Article

Research on the Electrodeposition of Graphene Quantum Dots under Supercritical Conditions to Enhance Nickel-Based Composite Coatings

1
School of Mechanical Engineering, Jiangsu University of Technology, Changzhou 213001, China
2
Jiangsu Key Laboratory of Advanced Material Design and Additive Manufacturing, Jiangsu University of Technology, Changzhou 213001, China
*
Author to whom correspondence should be addressed.
Metals 2023, 13(11), 1794; https://doi.org/10.3390/met13111794
Submission received: 9 September 2023 / Revised: 1 October 2023 / Accepted: 19 October 2023 / Published: 24 October 2023

Abstract

:
A graphene quantum dots (GQDs)-reinforced nickel-based composite coating was electrodeposited on the surface of a copper plate with a supercritical carbon dioxide fluid (SC-CO2)-assisted DC power supply. The effect of the current density on surface morphology, microstructure, average grain size, hardness, and corrosion resistance of the resulting coatings was investigated in detail. It was found that the GQDs composite coating showed a more compact surface, a smaller grain size, higher microhardness, and stronger corrosion resistance than the pure Ni coating produced in SC-CO2 and a texture coefficient indicative of a (111) preferred orientation. When the current density was 8 A/dm2, the surface morphology of the GQDs composite coating showed a high density, and the grain size was about 23 nm. In addition, the micro-hardness and corrosion resistance of the GQDs composite coating was greatly improved compared with those of the pure nickel coating; at the same time, its wear rate, friction coefficient, and self-corrosion current density were decreased by 73.2%, 17.5%, and 9.2%, respectively.

1. Introduction

Due to the influence of machinery operation, friction, and the environment, the surface of engineering parts can be damaged, and their usability and reliability are reduced. Therefore, improving the surface properties of engineering components, such as hardness, wear resistance, and corrosion resistance, is crucial to delay damages to their surfaces [1]. Metal matrix composites are widely used in various fields, such as aerospace, due to their excellent properties and industrial versatility [2]. Cobalt, magnesium, titanium, nickel, aluminum, and iron are often used in metal matrix composites [3]. In particular, nickel-based composites are widely used in the industry and other fields due to their outstanding advantages such as high wear resistance, good oxidation resistance, strong corrosion resistance, and good bonding ability [2,4]. The methods for preparing surface-plating (coating) layers include laser cladding, thermal spraying, electroless plating, hydrothermal deposition, plasma spraying, electrodeposition, etc.
Electrodeposition is one of the processing methods with low cost, high efficiency, high hardness, good wear resistance, and corrosion resistance. To further improve the quality of electrodeposited coatings, other metal elements or non-metal elements are added as reinforcement phases during the electrodeposition process. For example, M.H. Sarafrazi et al. used electrodeposition to add silicon and titanium dioxide to a nickel-based coating [5]. An appropriate silicon and titanium dioxide content improves the hardness and corrosion resistance of the coating. In recent years, preparing metal-based composite coatings with excellent performance using graphene and graphene oxide as reinforcing phases has attracted research interest [6,7,8]. GQDs are graphene sheets of less than 100 nm, a new type of zero-dimensional carbon-based nanomaterials. In addition to exhibiting the excellent properties of graphene, they also have quantum confinement effects and edge effects [9]. Due to their unique structural characteristics, they have stable dispersibility in water and good film-forming properties, which solves the problem that graphene is not easily soluble in water [10]. The addition of GQDs as a second phase in Ni-based coatings can significantly improve the quality of the coatings [11]. However, the electrodeposition technology has limits, as easy aggregation of second-phase additives and instability of the coating performance may occur, which hinders the further development of this technology. The supercritical CO2 fluid technology exploits the gas diffusivity and liquid solubility of supercritical CO2. Supercritical CO2 has the characteristics of high fluidity, high permeability, and fast mass transfer rate, which can improve the uneven distribution of second-phase additives in a coating, thereby further improving the quality of the coating.
Yu An Chien et al. [12] compared the micromechanical properties and sample size effects of Ni–TiO2 (NTO) composite materials prepared by supercritical CO2 emulsion co-electroplating (SCNTO) with those of NTO materials prepared by conventional co-electroplating (CVNTO). They found that Ni/TiO2 composite materials prepared by SCNTO had better mechanical properties and showed no sample size effect. Sabarison Pandiyarajan et al. [13] used two different electrodeposition methods, supercritical CO2 (SC-CO2) and ultrasonic-assisted supercritical CO2 (US-SC-CO2) electrodeposition, to improve the deposition quality of Cu–PVP composite coatings. They found that the electrodeposition quality and performance were improved under US-SC-CO2 conditions. Sabarison Pandiyarajan et al. [14] prepared a green zinc–cobalt (Zn Co) alloy film using the SC-CO2 electrodeposition process and investigated its electrochemical performance. They found that compared with the alloy film obtained with traditional methods, the Zn Co alloy film produced by SC-CO2 electrodeposition presented smaller microcrystals and an improvement in corrosion resistance of 27.6%. These previous studies found that in the preparation process of supercritical GQDs composite coatings, the magnitude of current density had a significant effect on the performance of the supercritical GQDs composite coatings. Therefore, the influence of the current density on the microstructure and properties of supercritical nickel-based GQDs nanocomposite coatings was studied by adding GQDs nanoparticles to the coating and varying the current density. The grain refinement mechanism in the composite coatings was analyzed, and ways to improve their wear resistance and corrosion resistance are discussed.

2. Experimental Materials and Methods

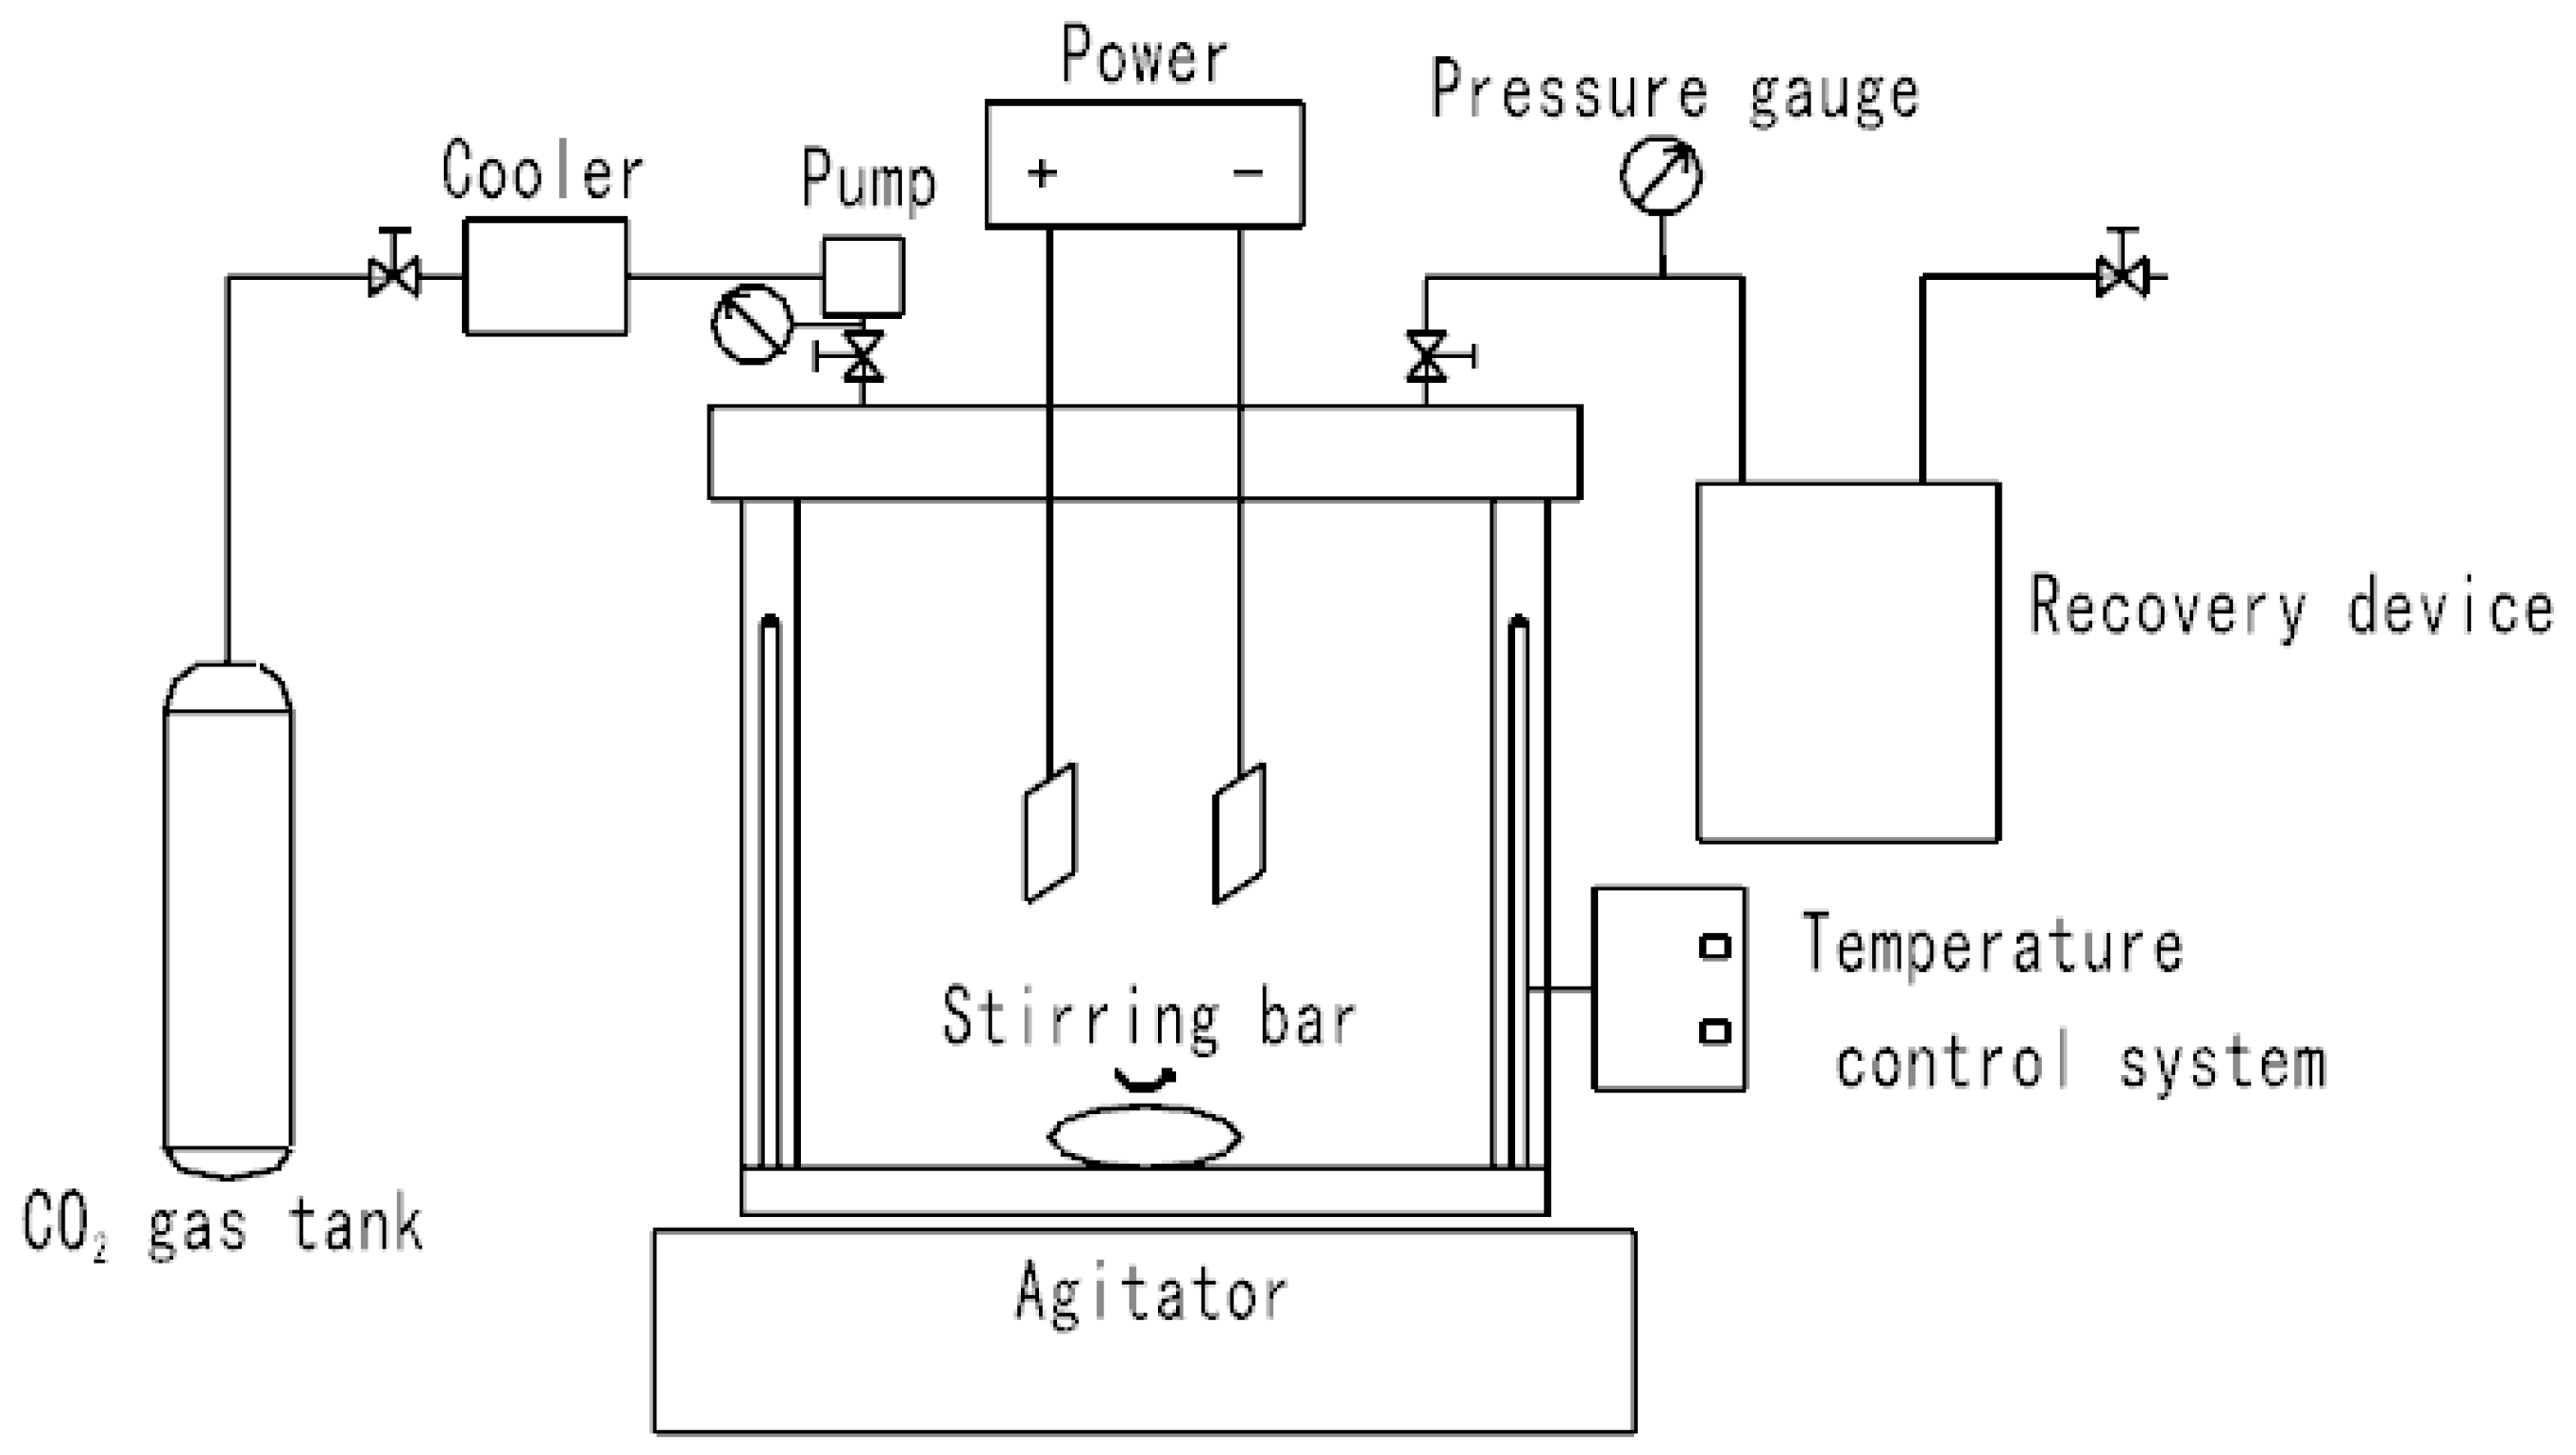
2.1. Sample Preparation

GQDs were prepared by adding 0.21 g of citric acid (Sinopharm Chemical Reagent Co., Ltd., Shanghai, China) and 0.18 g of urea (Sinopharm Chemical Reagent Co., Ltd., Shanghai, China) to 5 mL of deionized water and stirring to obtain a clear solution. The stirred solution was then transferred into a 100 mL polytetrafluoroethylene reaction kettle, which was sealed and placed into an oven at 180° for 8 h. Afterwards, ethanol was added to the solution, which was centrifuged at 8000 rpm for 5 min. The GQDs composition is shown in Table 1.
The supercritical composite electroplating device is shown in Figure 1. The pressure and temperature required for electroplating were ensured by a cooling device, a high-pressure pump, and a temperature control device. The reaction kettle was a stainless-steel container with a capacity of 300 mL. The pressure and temperature were set to 9.5 MPa and 50 °C, respectively. The anode used in this experiment was a nickel plate with a purity of 99.9%, and the cathode was a copper plate with a purity of 99.9%; they were 20 × 20 mm2 in size and were placed 20 mm apart. The cathode and the anode were, respectively, connected with the negative pole and the positive pole of the output terminal of the DC power supply. The power supply used was an SMD-10P programmable pulse power supply from Handan Dashun Electroplating Equipment Co., Ltd. (Handan, China) The treated nickel plate and copper plate were fixed on the fixture by insulating glue and were well energized. We used a KQ-300VDE three-frequency numerical control ultrasonic cleaner (Uno Instrumentation Co., Ltd., Tianjin, China) and an EMS-12 remote control stirrer (Uno Instrumentation Co., Ltd., Tianjin, China) to fully disperse the GQDs in the well-stirred bath before electroplating. The bath formulations for the preparation of supercritical nickel-based GQDs composite coatings (Ni–GQDs) and supercritical pure-nickel coatings (Ni) are shown in Table 2. The speed of the magnetic stirrer was set to 250 r/min, the electrodeposition time was 55 min, and the current density was selected in the range of 4 to 10 A/dm2. The process parameters are shown in Table 3. At the same time, the properties of the two coatings were studied under the condition of 8 A/dm2.

2.2. Analysis and Characterization

The surface and cross-sectional morphologies of the coatings were observed with a Sigma-500 field-emission (Carl Zeiss, Oberkochen, Germany) scanning electron microscope. We used a Primotech-type upright metallographic microscope to observe the structure of coating sections and measure their thickness.
The phase structure of the coatings was analyzed by a D/MAX2500 X-ray powder diffractometer (Cu target Kα radiation, the diffraction angle was 10~80°, PANalytical B.V., Almelo, The Netherlands), and the grain size was calculated by the Scherrer formula:
D = K λ β cos θ
where K is the Scherrer constant, which is 0.89, λ is the X-ray wavelength, and β is the full width at half maximum (Rad) of the θ peak. θ is the diffraction angle.
The chemical structure of the tested samples was identified using the HORIBA LabRAM HR Evolution Raman spectroscopy equipment (HORIBA Jobin Yvon, Paris, France), employing a He–Ne laser and performing the measurements at a wavelength of 633 nm, with a spot size of 1 μm and in a scanning range of 1000–3000 cm−1.
The prepared GQDs were characterized by an EFI Tecnai G2 F20 transmission electron microscope (TEM, EFI Technologies Inc., San Francisco, CA, USA). The state of the GQDs in the composite coatings was observed by high-resolution transmission electron microscopy (HRTEM, EFI Technologies Inc., San Francisco, CA, USA). The voltage was 200 kV. Then, the carbon content of the coatings was analyzed with the help of a Wuxi high-speed HIR944 carbon–sulfur analyzer (Wuxi High Speed Analytical Instrument Co., Ltd., Wuxi, China).
We used an HVS-1000B digital display microhardness (Beijing Shangguang Instrument Co., Ltd., Beijing, China) tester to measure the microhardness of the coatings. To this aim, we set the load to 100 g and the dwell time to 15 s and conducted the measurements on six different points on each sample. The final hardness value was the average of these six measurements. The coatings were tested for wear resistance using a Nanovea TRB friction and wear tester (Irvine, CA, USA). The experiment was carried out under normal temperature and pressure. A high-chromium steel-bearing steel ball with a diameter of 6 mm was selected as the opposite abrasive piece. The test parameters were set as follows: the load was 10 N, the rotational speed was 200 r/min, and the friction time was 10 min. The friction marks of the coatings were measured by a Nanovea PS50 micro-profiler (Microna (Hong Kong) Technology Limited, Hong Kong, China); the scanning area was 2 × 2 mm2, and the scanning rate was 3.4 mm2/s.
On a PGSTAT 302N electrochemical workstation (Shanghai Chenhua Instrument Co., Ltd., Shanghai, China), electrochemical polarization of the coatings was carried out with a three-electrode system. The coatings were used as the working electrode, a platinum plate was used as the counter electrode, and the reference electrode was Ag/AgCl (1 M). The experiment was performed in a 3.5% sodium chloride solution. The scanning rate for determining the potentiodynamic polarization curve was 5 mV/s, and the voltage range was −0.5~0.5 V. The samples were immersed in a 3.5% NaCl solution at room temperature for 72 h or 120 h, and then surface corrosion was observed by scanning electron microscopy.

3. Results and Discussion

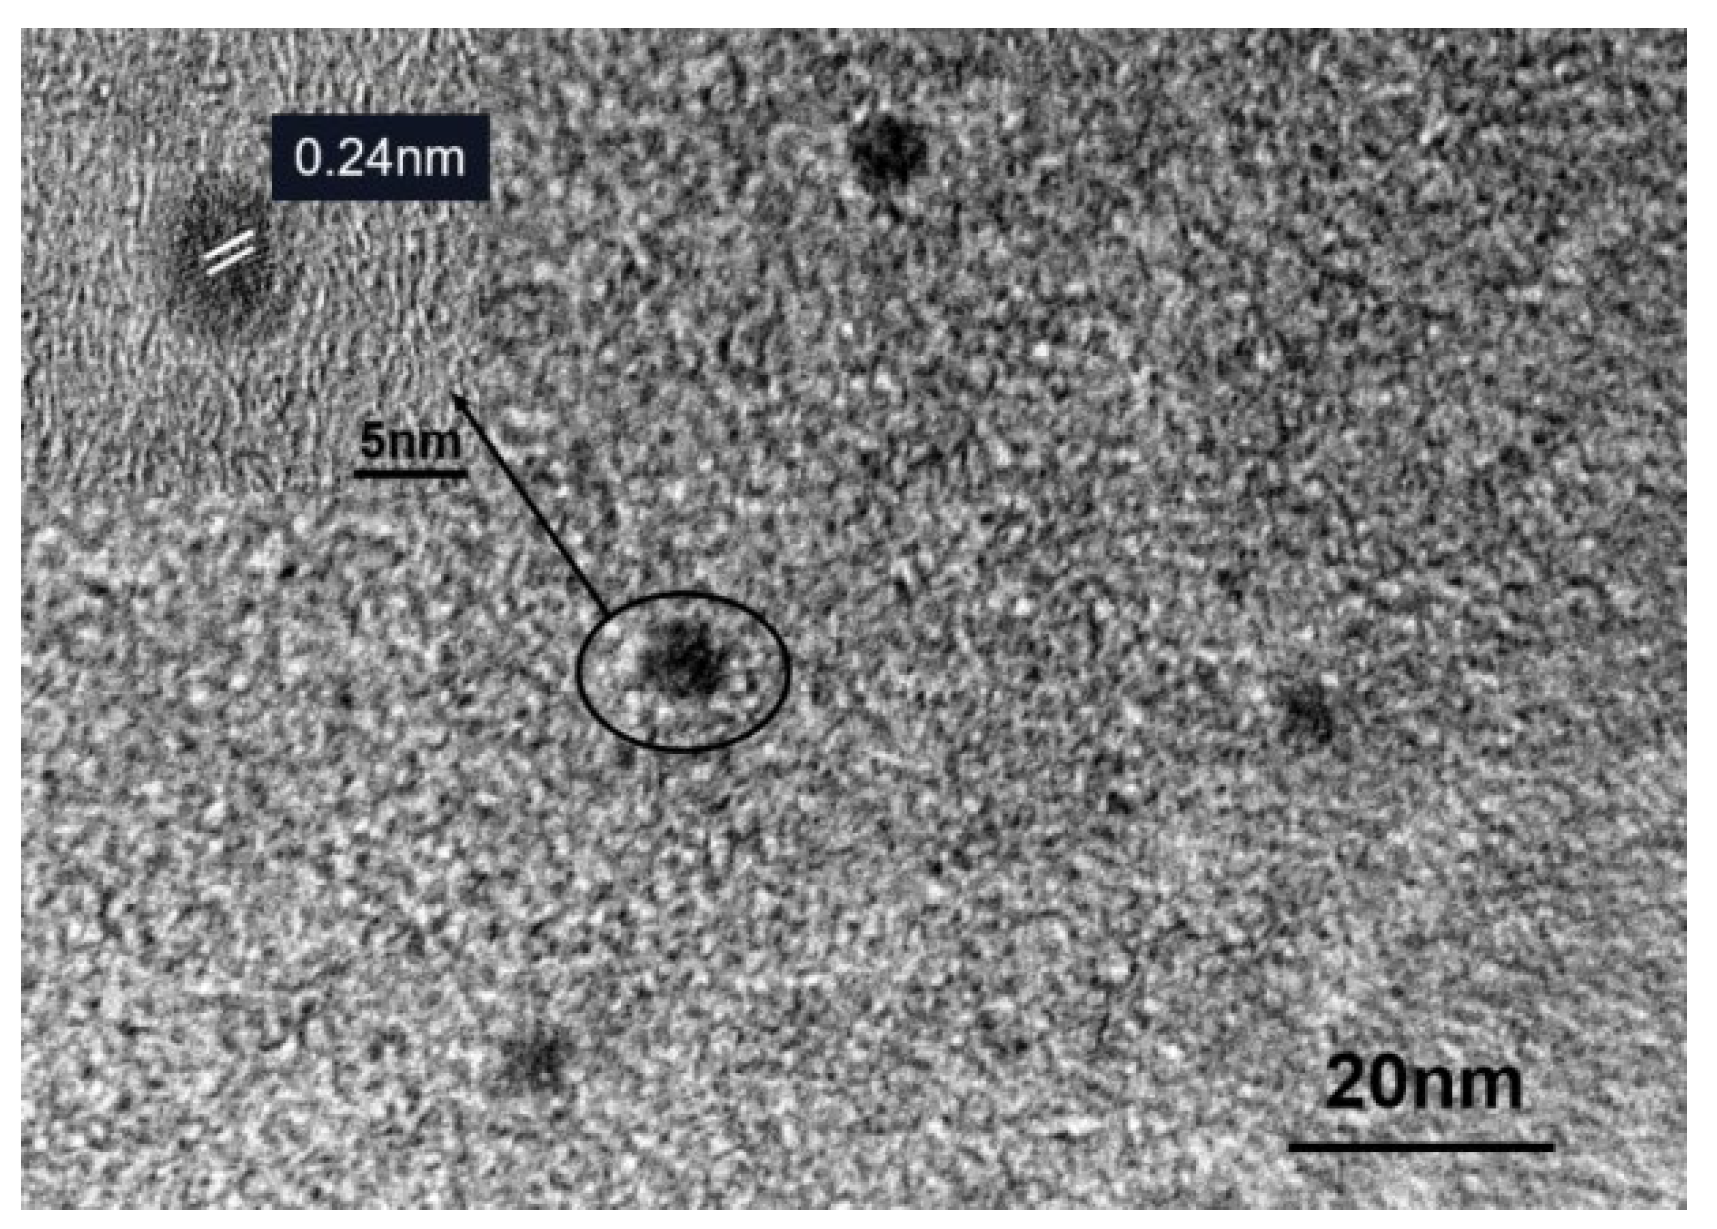
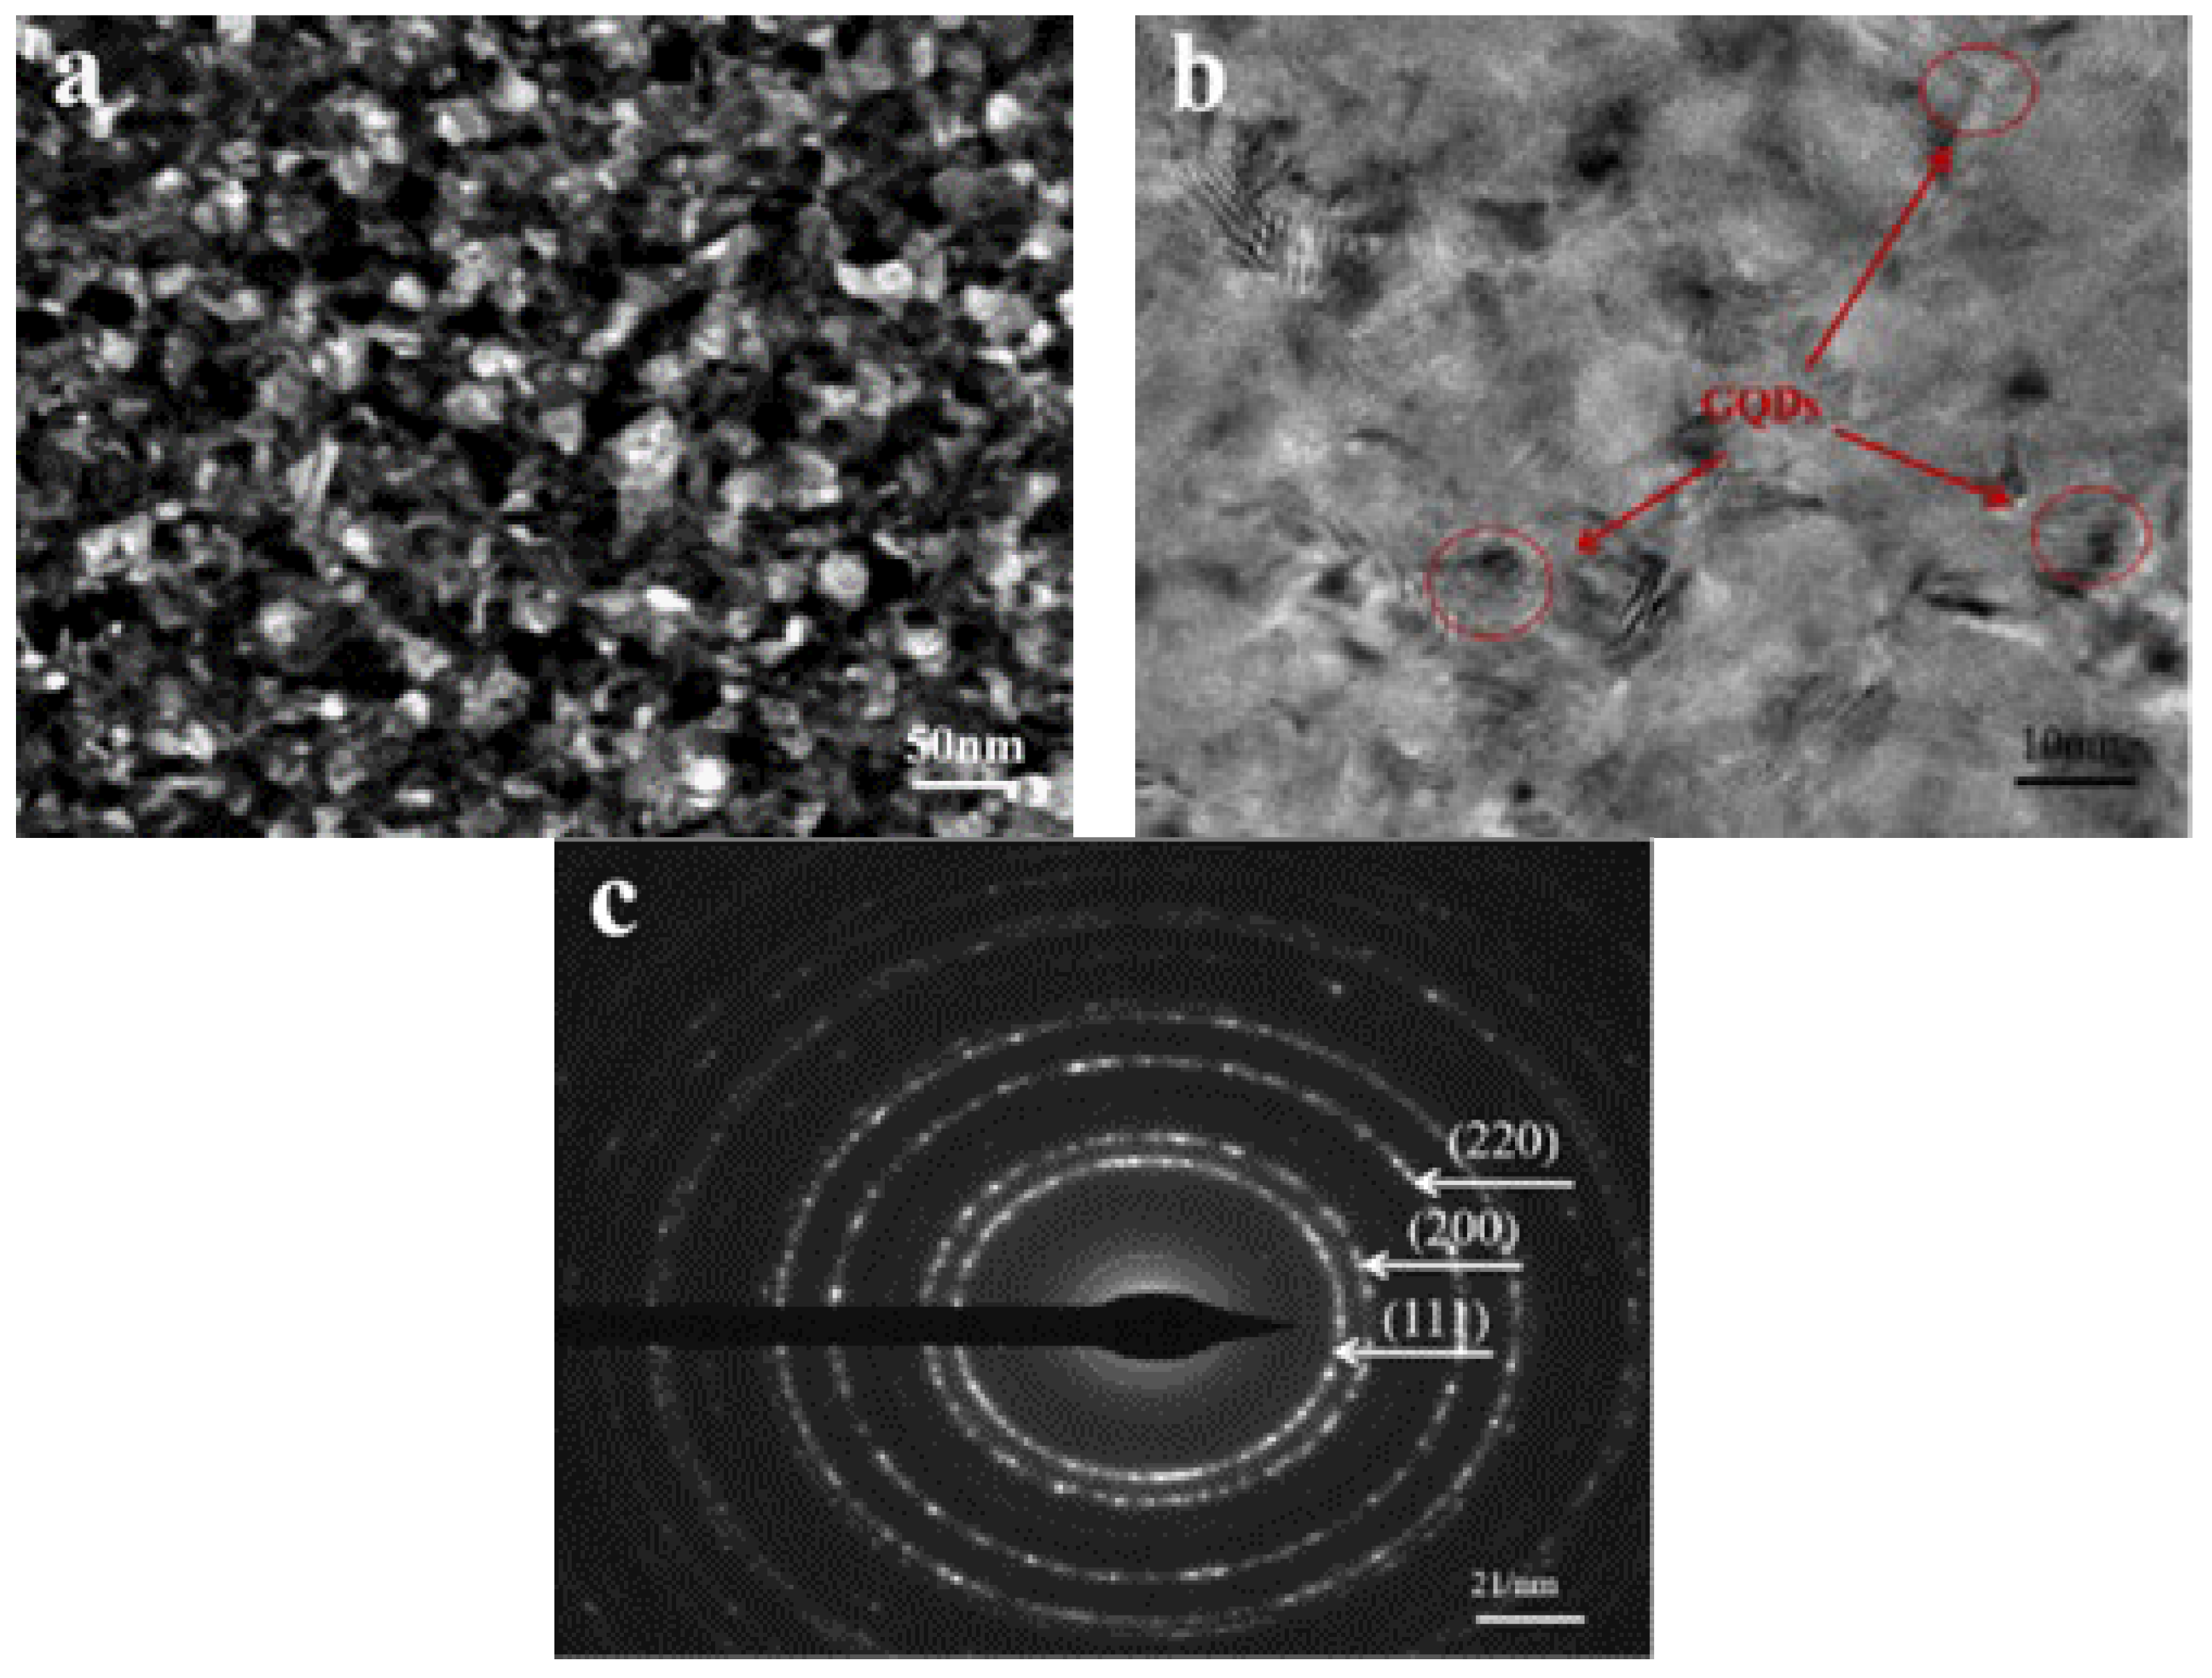
3.1. Microstructure Analysis of the Graphene Quantum Dots

Transmission electron microscope images of the GQDs are shown in Figure 2. It can be seen that the lattice spacing of the graphene dots was about 0.24 nm, similar to that of the graphite (002) plane, indicating that the lattice structure of the prepared GQDs had the properties of graphite [15].

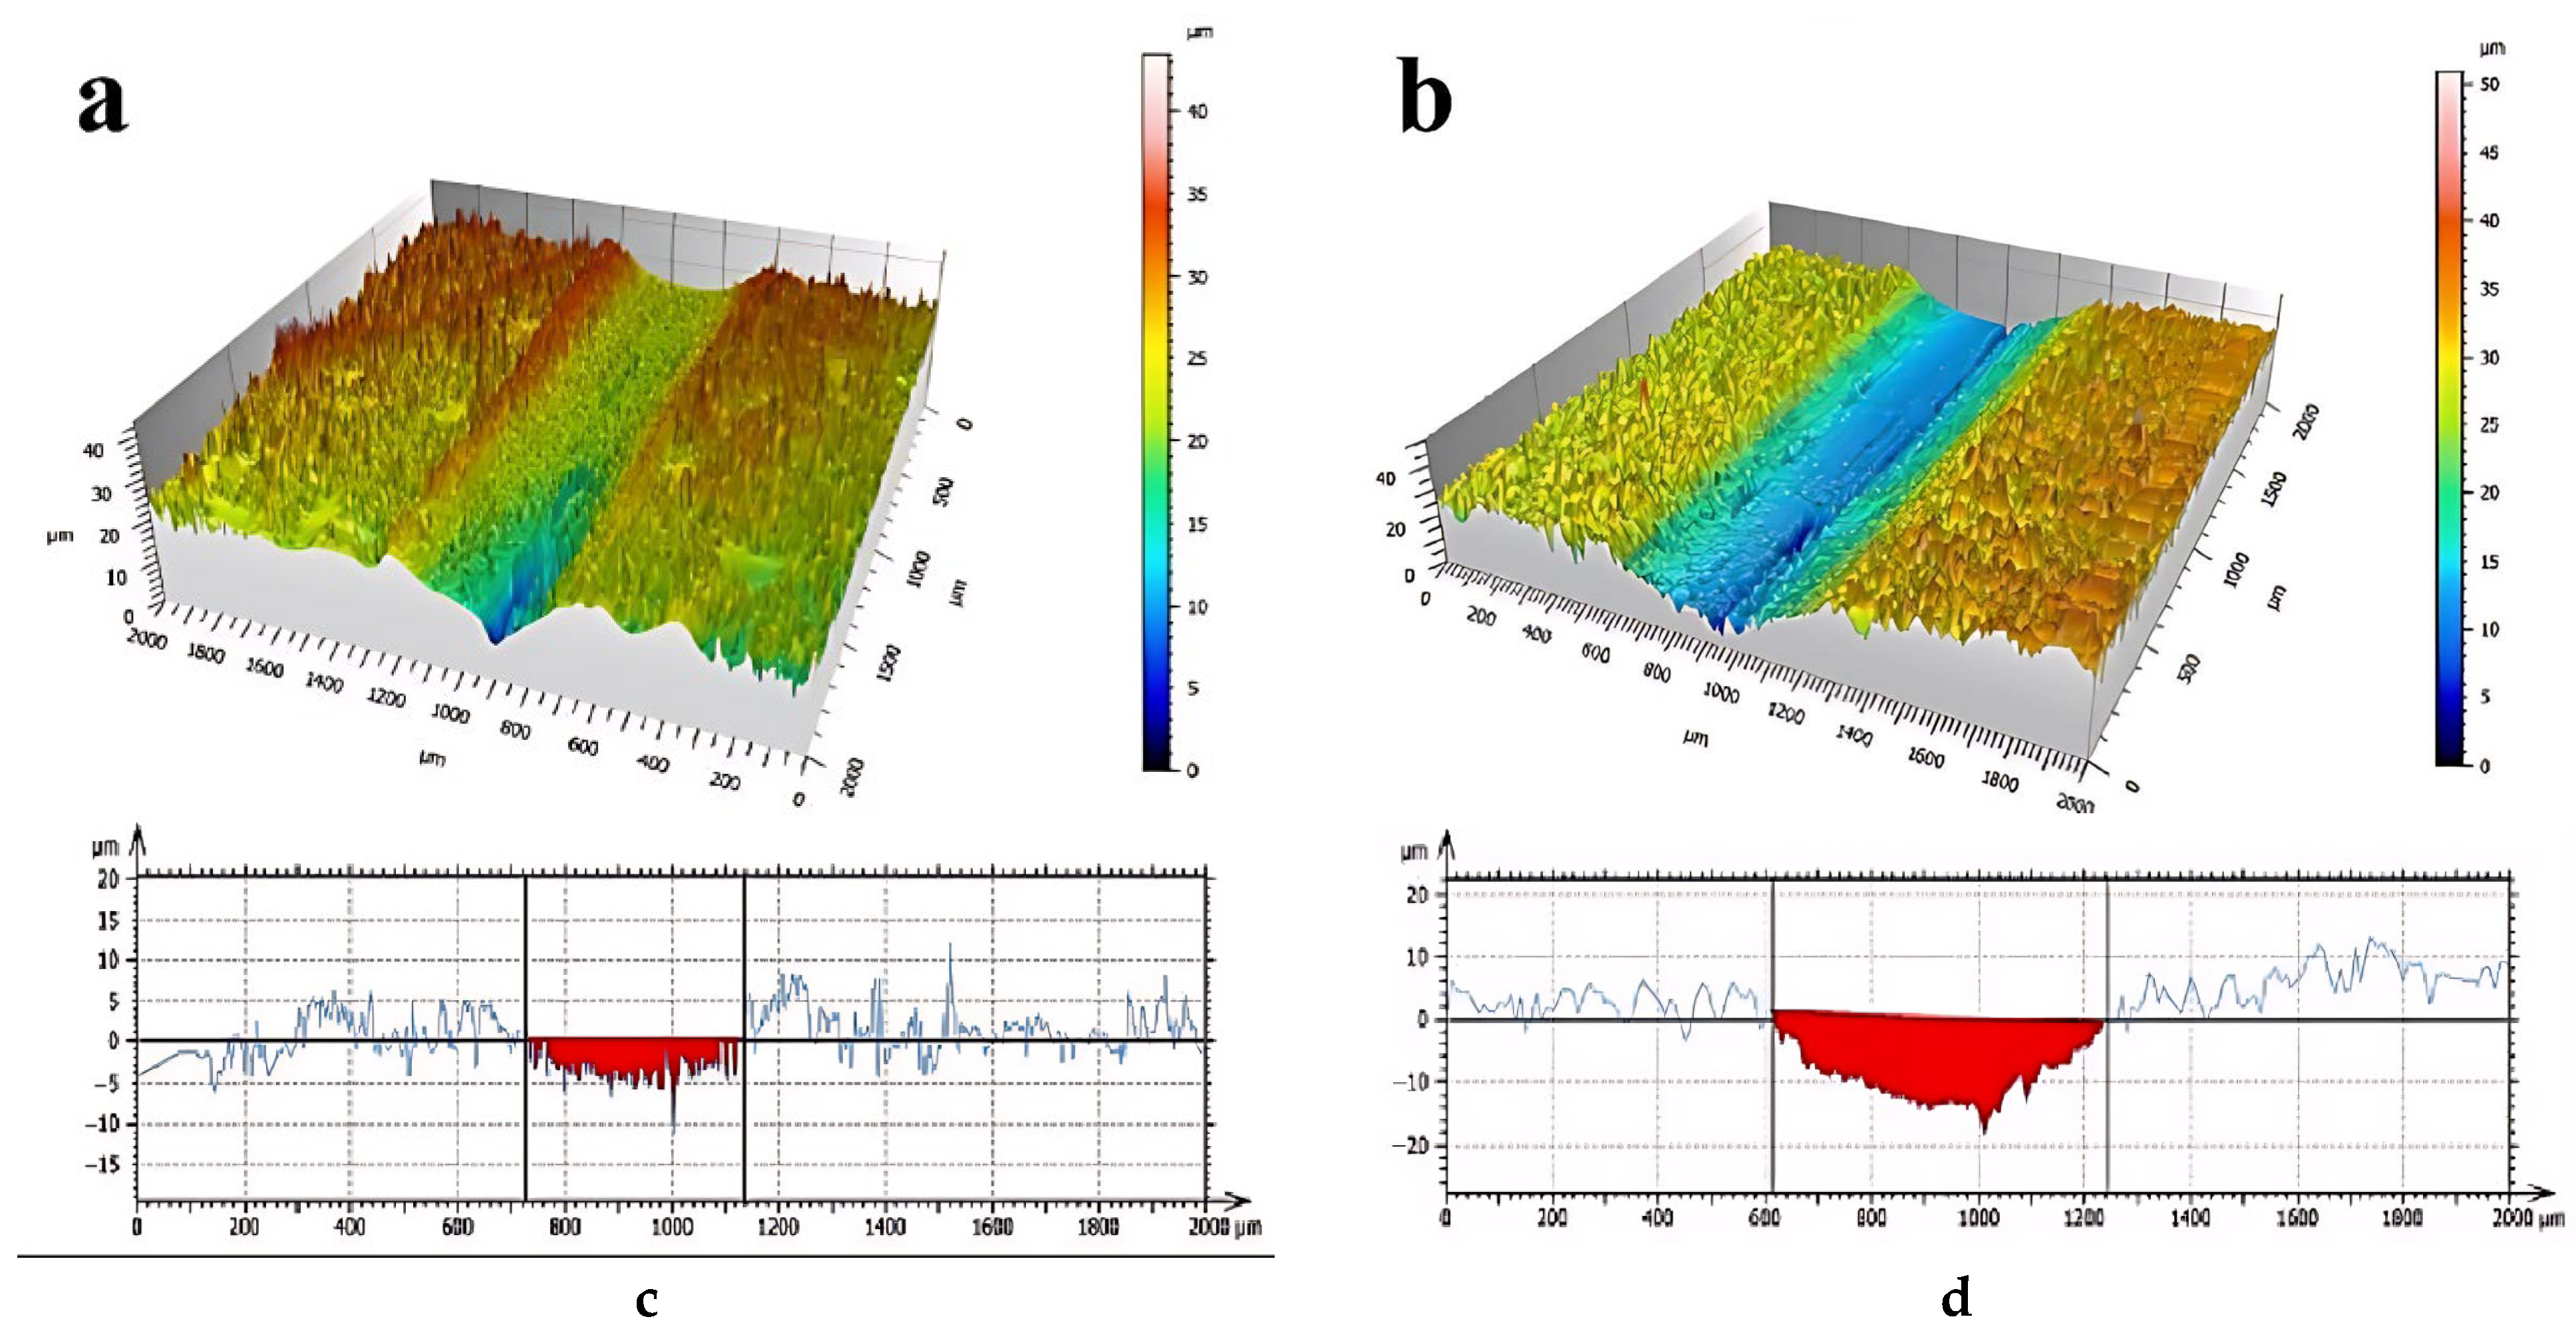
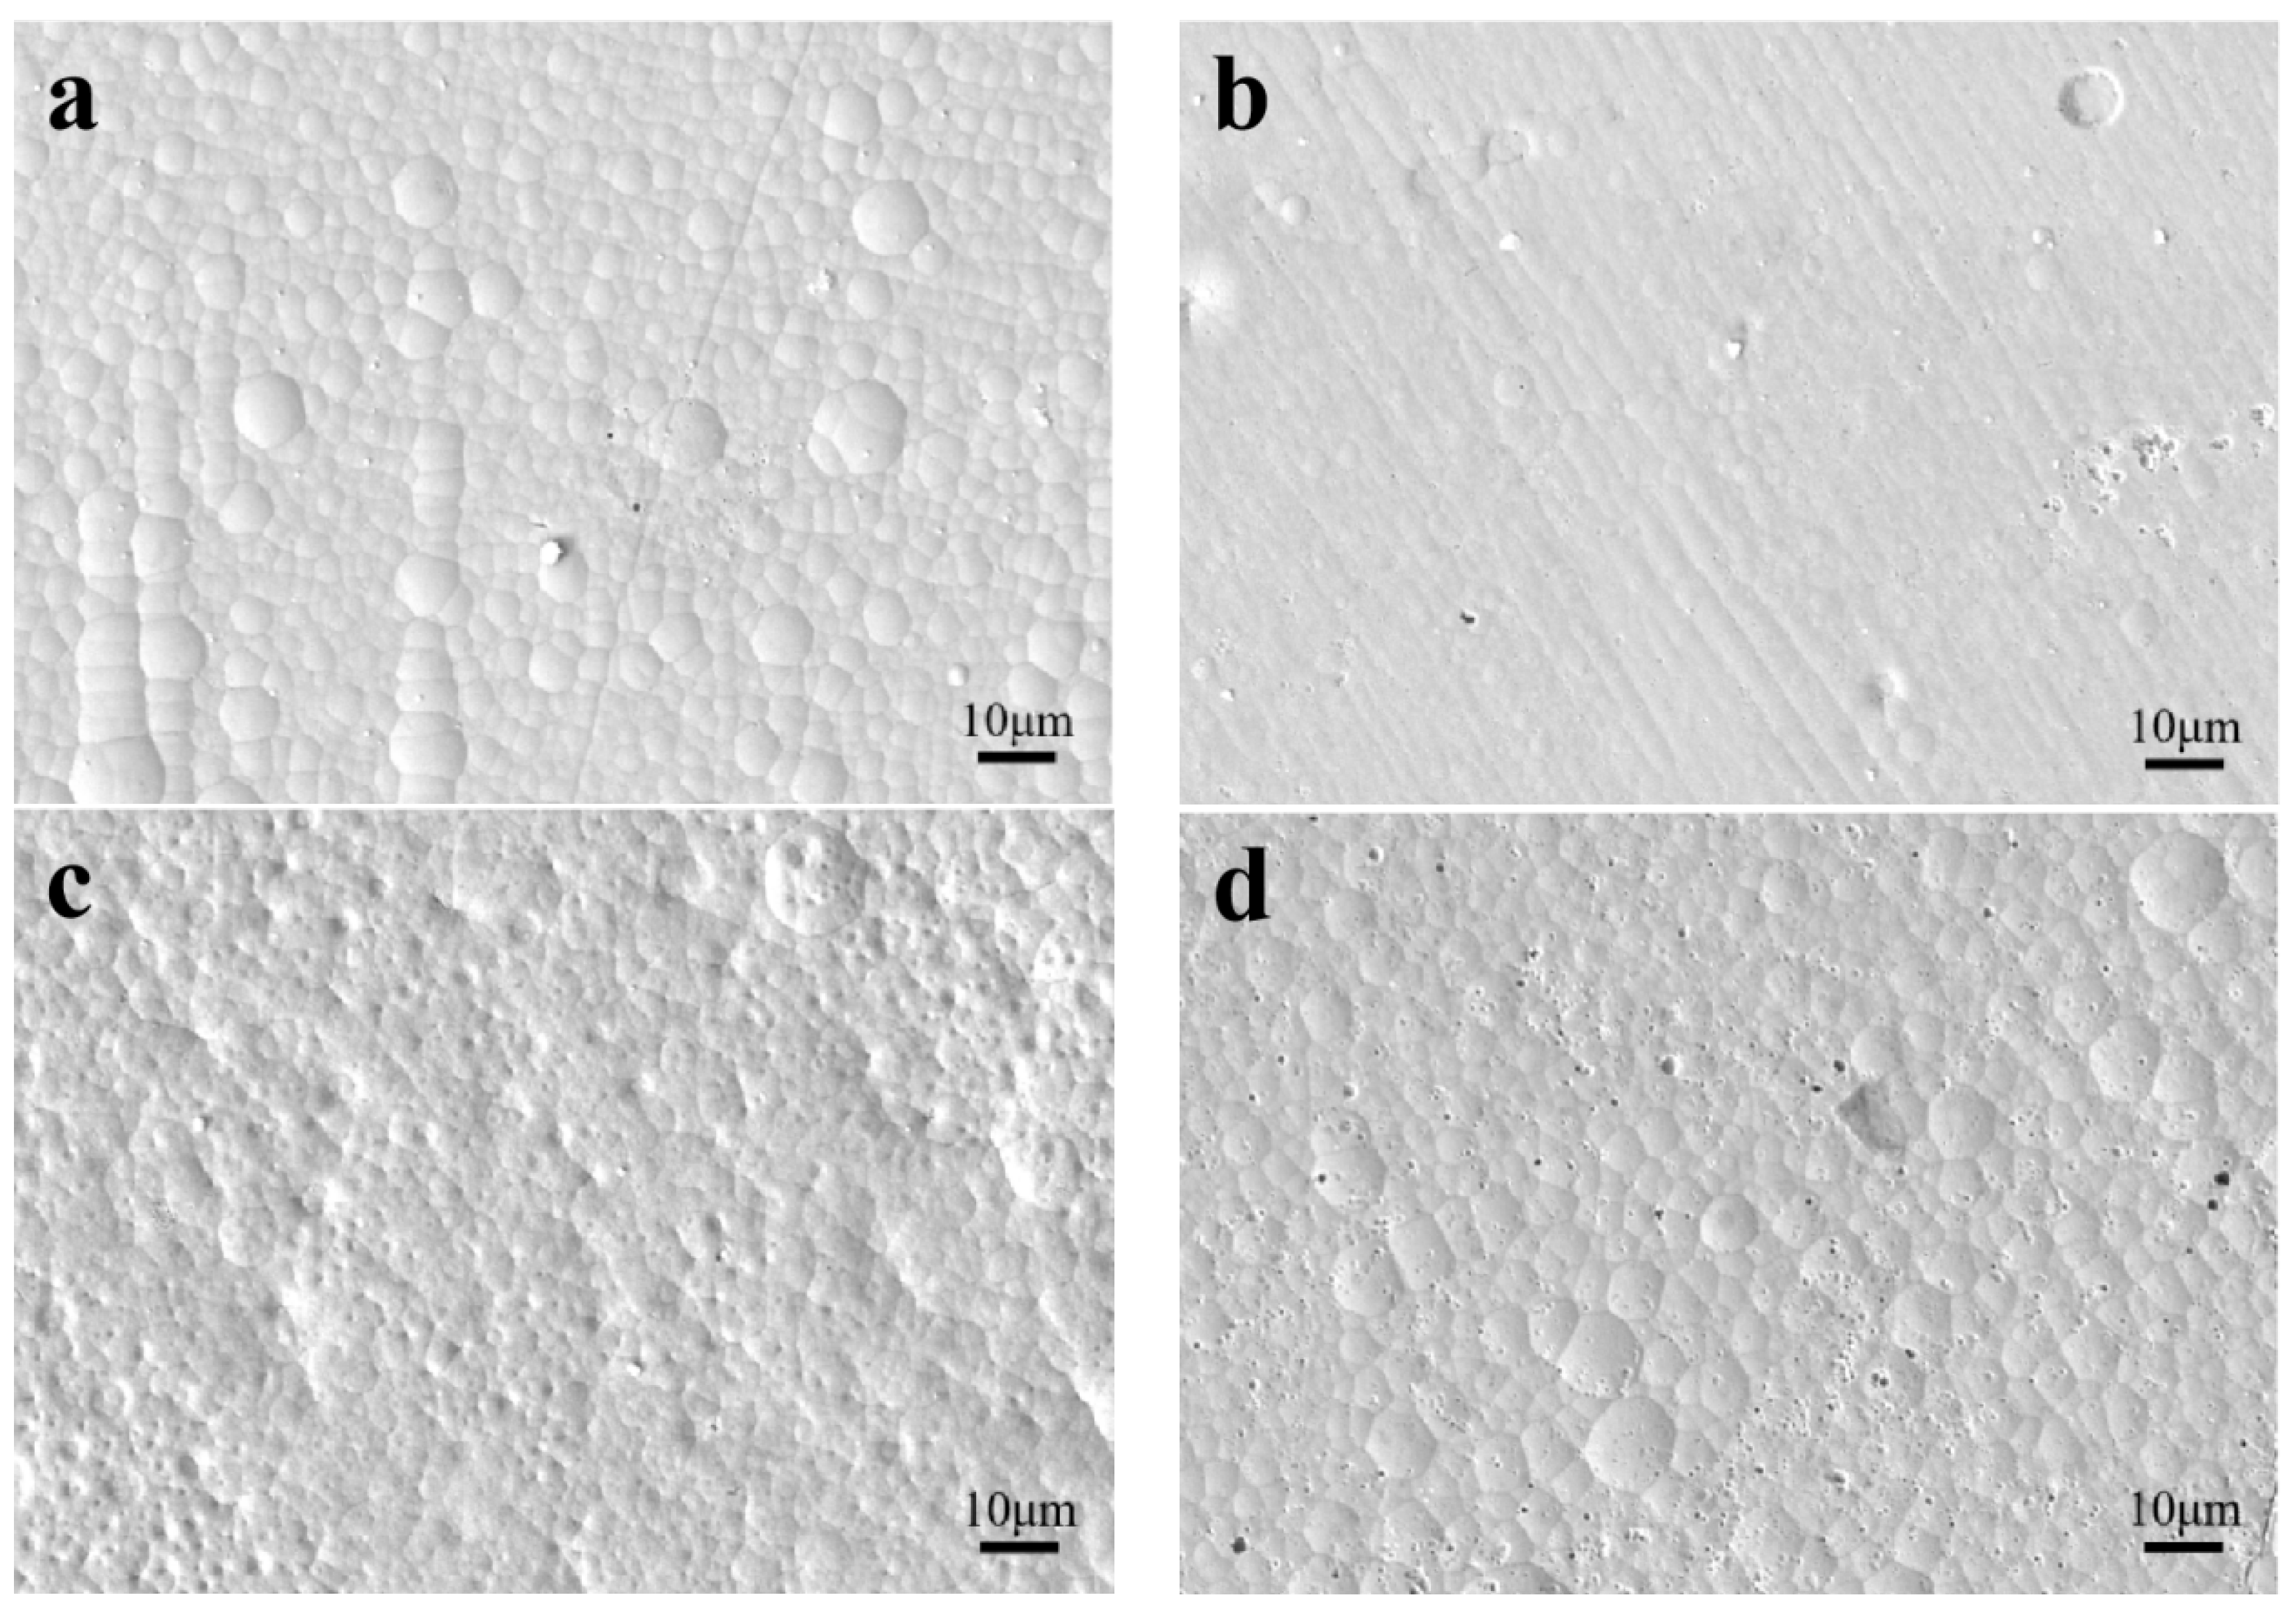
3.2. Effect of Current Density on the Surface Morphology of the Coatings

Figure 3 shows SEM images of the surface morphology of the Ni–GQDs and Ni coatings under different current densities. It can be seen in Figure 3 that when the current density was 4 A/dm2, the surface of the Ni–GQDs–I composite coating was not uniform, and many spherical bumps appeared. As the current density increased to 8 A/dm2, the spherical shapes on the surface of the Ni–GQDs–III coating gradually became smaller and evenly distributed, and the coating showed the best sphericity. When the current density increased to 10 A/dm2, the surface of the Ni–GQDs–IV coating began to show spherical structures with uneven distribution and increased size. The reasons for this are as follows: when the current density was low, the potential difference was smaller, the nucleation rate of the coating was lower, the grains were fewer, and the volume of the grains was larger. When the current density gradually increased, the potential difference increased, the nucleation rate of the coating increased, and multiple grains grew uniformly at the same time, resulting in a denser and smoother coating surface [16]. When the current density was too high, the cathode reacted violently and consumed a large amount of GQDs. The GQDs near the cathode could not be replenished in a timely manner, and their concentration became extremely low. The deposition of GQDs in the coating deteriorated, and the nickel grain growth was inhibited to different extents, resulting in an uneven particle size distribution and a coarse grain size on the surface of the Ni–GQDs composite coating. We found that a current density of 8 A/dm2 was the most suitable.
The surface of the pure-nickel coating was smoother than that of the Ni–GQDs composite coating, but the surface was loose and less dense, as shown in Figure 3e. In the composite electroplating process, the presence of GQDs provided nucleation points for metallic nickel on the surface of the cathode, which hindered the growth of the nickel grains, so that the nickel grains became uniformly dispersed and deposited on the surface of the cathode, thereby improving the compactness of the coating surface. At the same time, the GQDs were wrapped by Ni2+ and deposited on the surface of the cathode to form local protrusions, which led to a higher potential and a faster crystallization rate. In addition, these protrusions were more likely to “attract” Ni2+, so that the surface of the composite coating appeared spherical.
Figure 4 shows metallographic and scanning electron microscope images of Ni–GQDs–III coating and Ni coating sections. It can be seen in Figure 4a,c that the cross-sectional morphologies of the two coatings were intact and free of cracks. The coatings and the substrates were well bonded, and no significant separation was found. In the metallographic diagram of the corroded cross sections, only the structure of copper was seen, and the coatings only showed a flat cross-sectional morphology. This could be due to the relatively small grain size of nickel in the coatings. In order to verify this interpretation, a scanning electron microscope was used to further explore the cross-sectional structure of the coatings. The results are shown in Figure 4b,d. Both coatings showed only a flat morphology, and the results were consistent with the metallographic diagram. It can be seen that the thickness of the Ni–GQDs–III coating was 34.7 μm, smaller than that of the Ni coating, which was 43.8 μm, under the same conditions. This result indicated that the GQDs acted as a physical barrier to the grain growth during electrodeposition, decreasing the grain growth rate and reducing the current efficiency; thus, the Ni–GQDs–III coating was slightly thinner than the Ni coating [5].

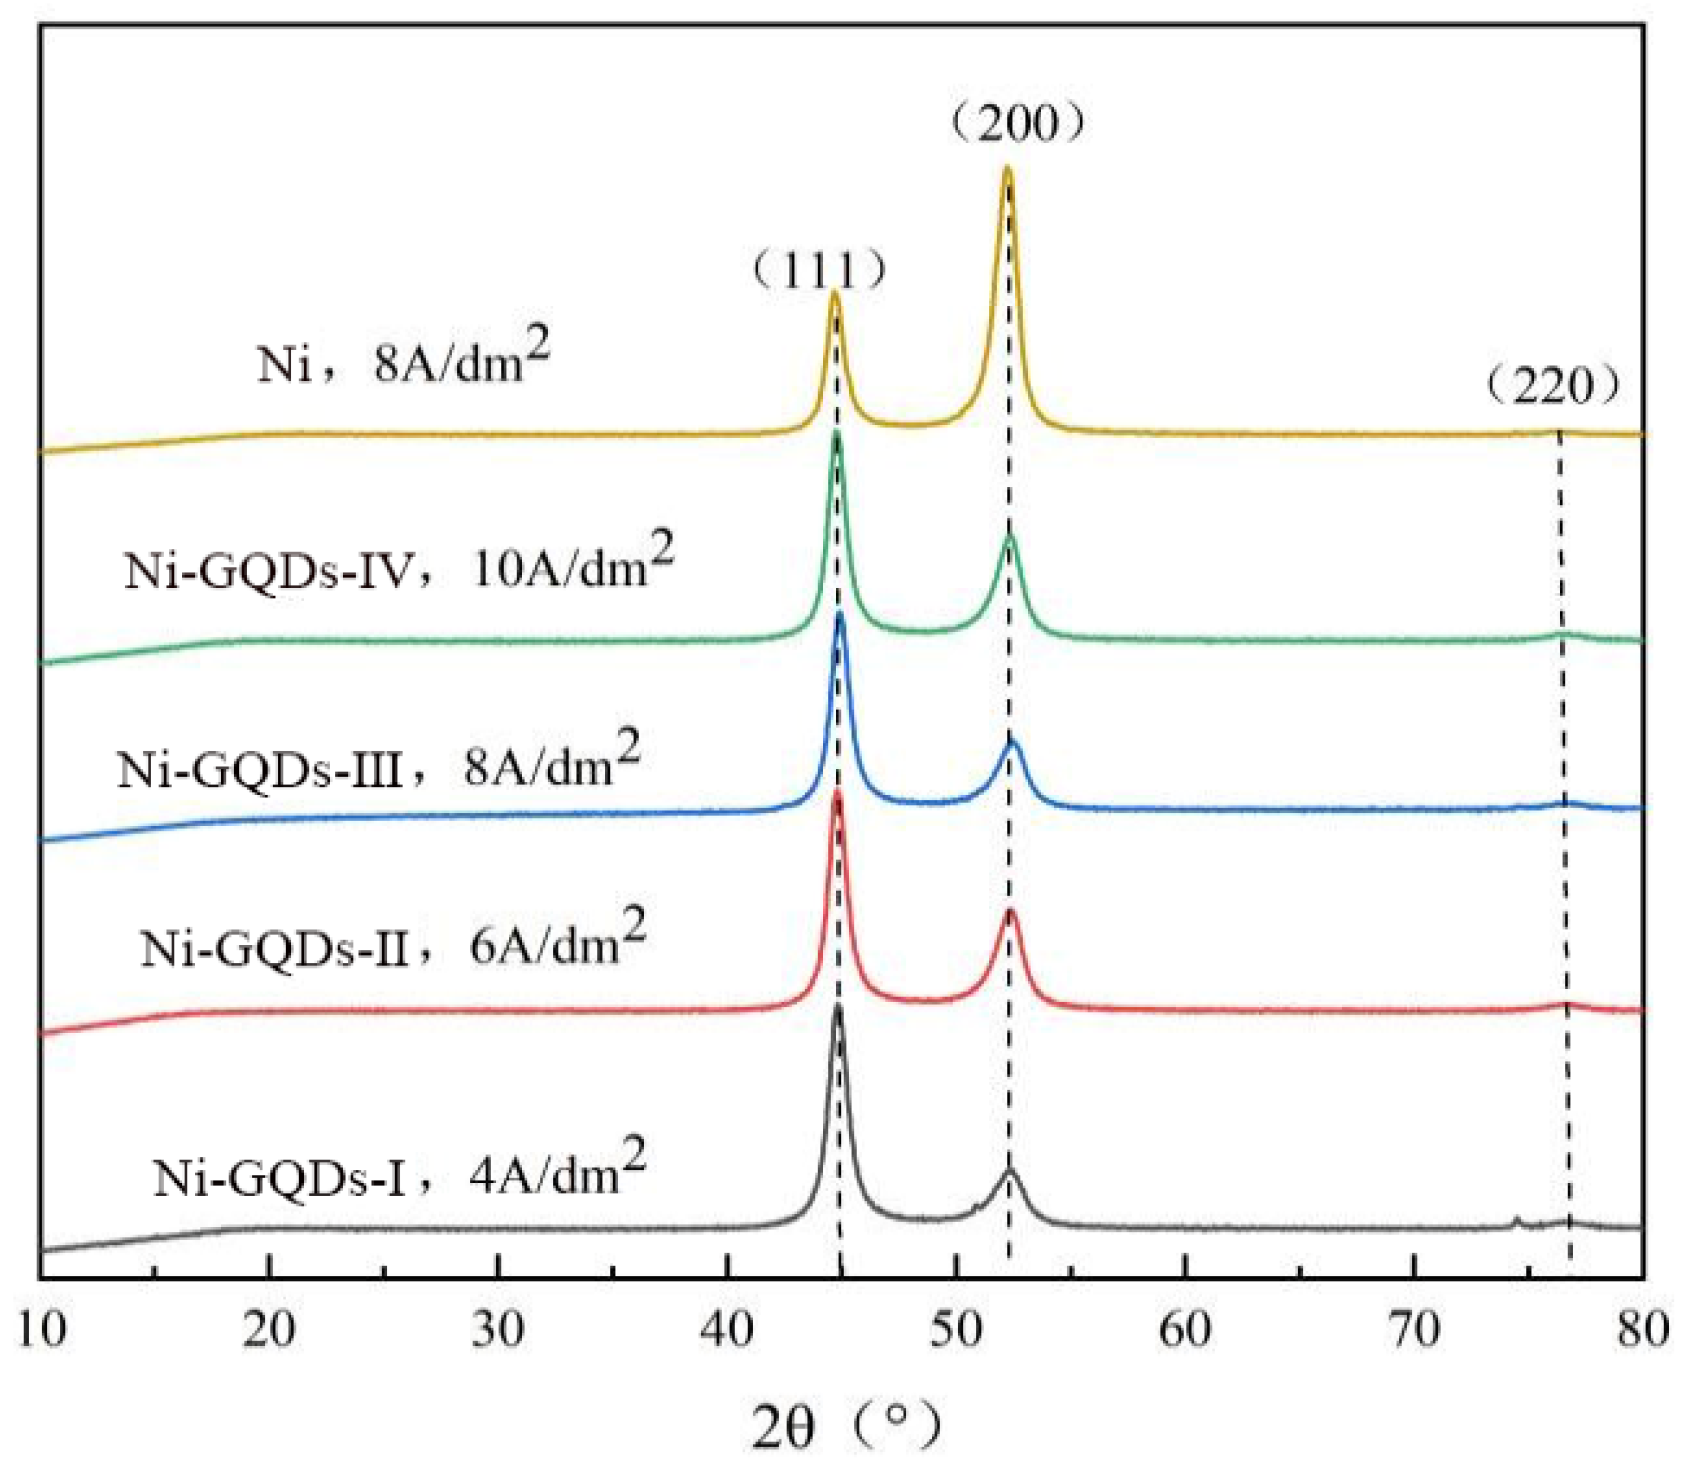
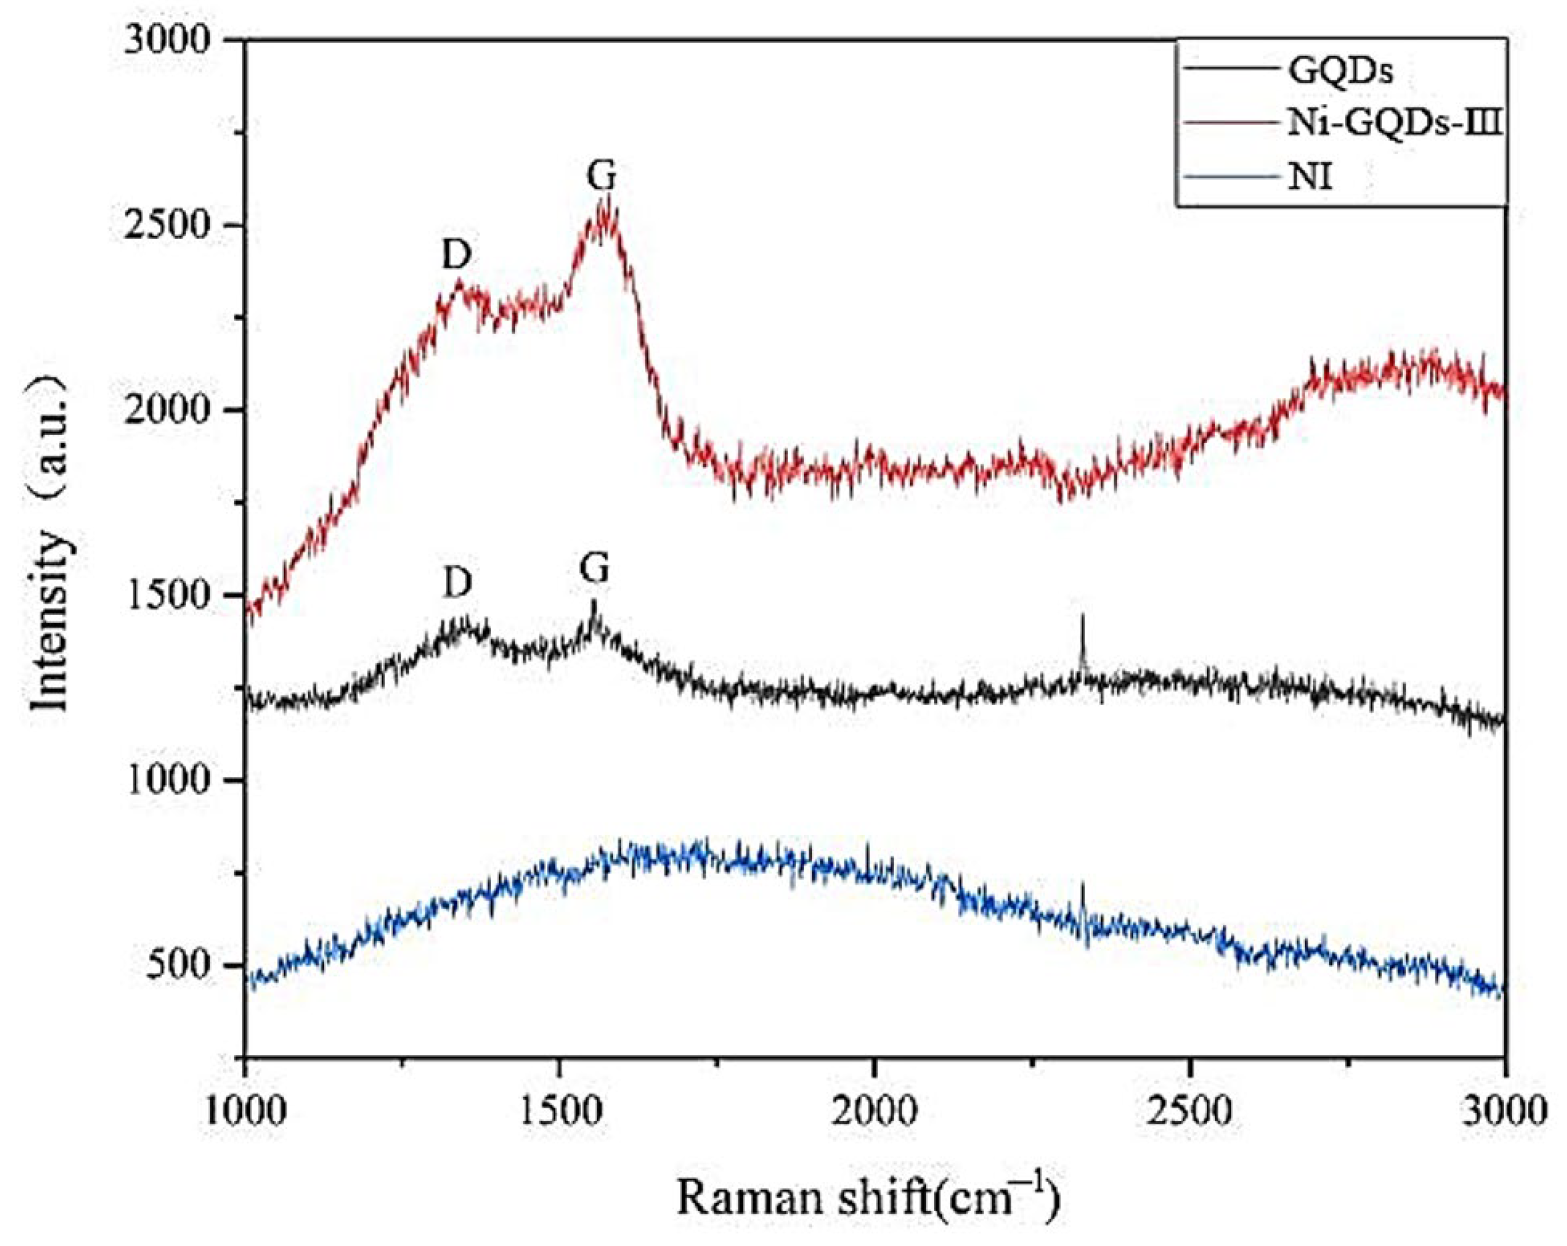
3.3. Structural Analysis of the Coating

Figure 5 shows the XRD patterns of the Ni–GQDs composite coatings and the Ni coating. The XRD patterns showed that the diffraction peak positions of Ni in both Ni–GQDs composite coatings and Ni coating were the same; at 2θ = 45°, 52°, and 76°, the crystal planes corresponding to each diffraction peak were the same, followed by the (111), (200), and (220) planes, but the preferred orientation and diffraction intensity of each peak in the Ni–GQDs composite coatings were different from those in the Ni coating. From the diffraction peak corresponding to the crystal plane, it can be seen that the crystal structure of Ni was a face-centered cubic structure. However, the diffraction intensity of the Ni–GQDs coating on the (111) plane was higher than that of the Ni coating, while the diffraction intensity on the (200) plane was lower than that of the Ni coating, indicating that the addition of the GQDs had an impact on the process of nickel-free crystallization and changed the process of nickel nucleation and growth during electrodeposition. The texture coefficients of each crystal plane in the XRD spectrum were obtained by the following Formula (2) [17], as shown in Table 4:
T C ( h k l ) = I ( h l k ) / I 0 ( h l k ) ( I ( h l k ) / I 0 ( h l k ) )
It can be seen in Table 4 that the Ni coating exhibited an obvious (200) plane preferred orientation, and its preferred coefficient was as high as 69.48%, while the Ni–GQDs coating showed a (111) plane preferred orientation, and its preferred coefficient was 37.58%. This showed that the addition of the GQDs changed the growth of Ni during the deposition process, so that the coating exhibited the preferred orientation of the (111) plane. No obvious diffraction peaks of the GQDs were found in the Ni–GQDs coatings prepared at different current densities, which could be due to their lower content in the coatings. The preferred orientation of the Ni–GQDs coating did not change much with the change of current density, which could be because the phase structure of the coating was mainly affected by the composition of the coating in the same bath. With the same plating solution, the composition of the coating obtained by changing the current density was basically the same; so, the phase structure of the Ni–GQDs coating was not affected by the average current density.
The grain size calculated by the Scherrer formula [18] is shown in Table 5. It can be seen in Table 5 that the grain size of the coating was significantly reduced due to the addition of the GQDs. In the process of electrodeposition, although the agglomeration of the GQDs was inevitable, this phenomenon reduced the resistance of charge movement and the reduction potential difference, which was beneficial to alleviate the local “tip discharge” effect of the coating. At the same time, the dispersed distribution of the GQDs hindered the continuous growth of the nickel grains; so, the grain size of the Ni–GQDs coating was relatively reduced. The grain size of the Ni–GQDs coating decreased from 32 nm to 23 nm with the increasing current density. This could be explained as follows. On the one hand, as the current density increased, the phenomenon of hydrogen evolution on the cathode surface intensified, causing the pH value of the plating solution to increase from 4.6 to 5.6, which increased the adsorption on the surface of the cathode and led to the deposition of some insoluble solids, thereby inhibiting the growth of the coating grains; this refined the grains of the coating. On the other hand, with the increase in the current density, the increased cathode overpotential promoted the deposition of more GQDs on the cathode surface, which further hindered the growth of the nickel crystals; this provided another opportunity for the refinement of the grain structure [19].
Raman spectroscopy can characterize the number of layers and the disorder degree of graphene; so, it is often used to analyze graphene and its derivatives [20]. Figure 6 shows the Raman spectra of the Ni–GQDs–III composite coating, Ni coating, and GQDs prepared by different preparation processes. Table 6 shows the positions of the D-band and G-band in the Raman spectra, as well as the intensity values and the intensity ratios of the D-peak and G-peak. The relative strength of the D-band reflects the degree of crystal structure disorder, while the G-band is caused by the in-plane vibration of sp2 carbon atoms and is the main characteristic peak of graphene. The strength ratio (ID/IG) of the D-peak to the G-peak is usually used to represent the internal defects of graphene. The better the quality of GQDs, the smaller the ID/IG value. Figure 6 shows obvious D and G bands for the Ni–GQDs–III composite coating, which are characteristic peaks of carbon, indicating the presence of GQDs in the coating. The ID/IG of the Ni–GQDs–III composite coating was 0.91, while the ID/IG of the GQDs was 0.98. This indicated that after supercritical electrodeposition, the defects and disorder of the GQDs in Ni–GQDs–III were relatively reduced, and their quality was improved, indicating that supercritical electrodeposition can improve the quality of GQDs.
Figure 7 shows the TEM analysis of the microstructure of the Ni–GQDs–III coating. Figure 7a shows the TEM image of the supercritical graphene quantum dot composite coating prepared at a current density of 8 A/dm2. It can be seen that the size of the nickel grains was generally uniform (about 25 nm), and there were individual differences. The boundaries between the nickel grains clearly indicated the tight bonding between the nickel grains. Figure 7b presents a high-resolution image of the composite coating, where the presence of GQDs can be clearly seen. Figure 7c shows the electron diffraction pattern (SAED) of the composite coating, from which we can see the (220), (200), and (111) crystal planes, indicating that nickel in the Ni–GQDs-III coating had a face-centered cubic structure. In order to determine the content of GQDs embedded in the composite coating, a carbon–sulfur analyzer was used to detect the carbon content in the Ni and Ni–GQDs-III coatings under the same experimental conditions. The results are shown in Table 7. It can be seen that the carbon content of the two coatings was quite different. The Ni–GQDs-III casting layer had the highest carbon content, which was 0.890 wt%, while the carbon content in the Ni coating was only 0.061 wt%, that is, almost negligible. The microstructure and carbon–sulfur analyzer measurements indicated that the GQDs were successfully deposited into the composite coating, in agreement with the Raman spectroscopy results.

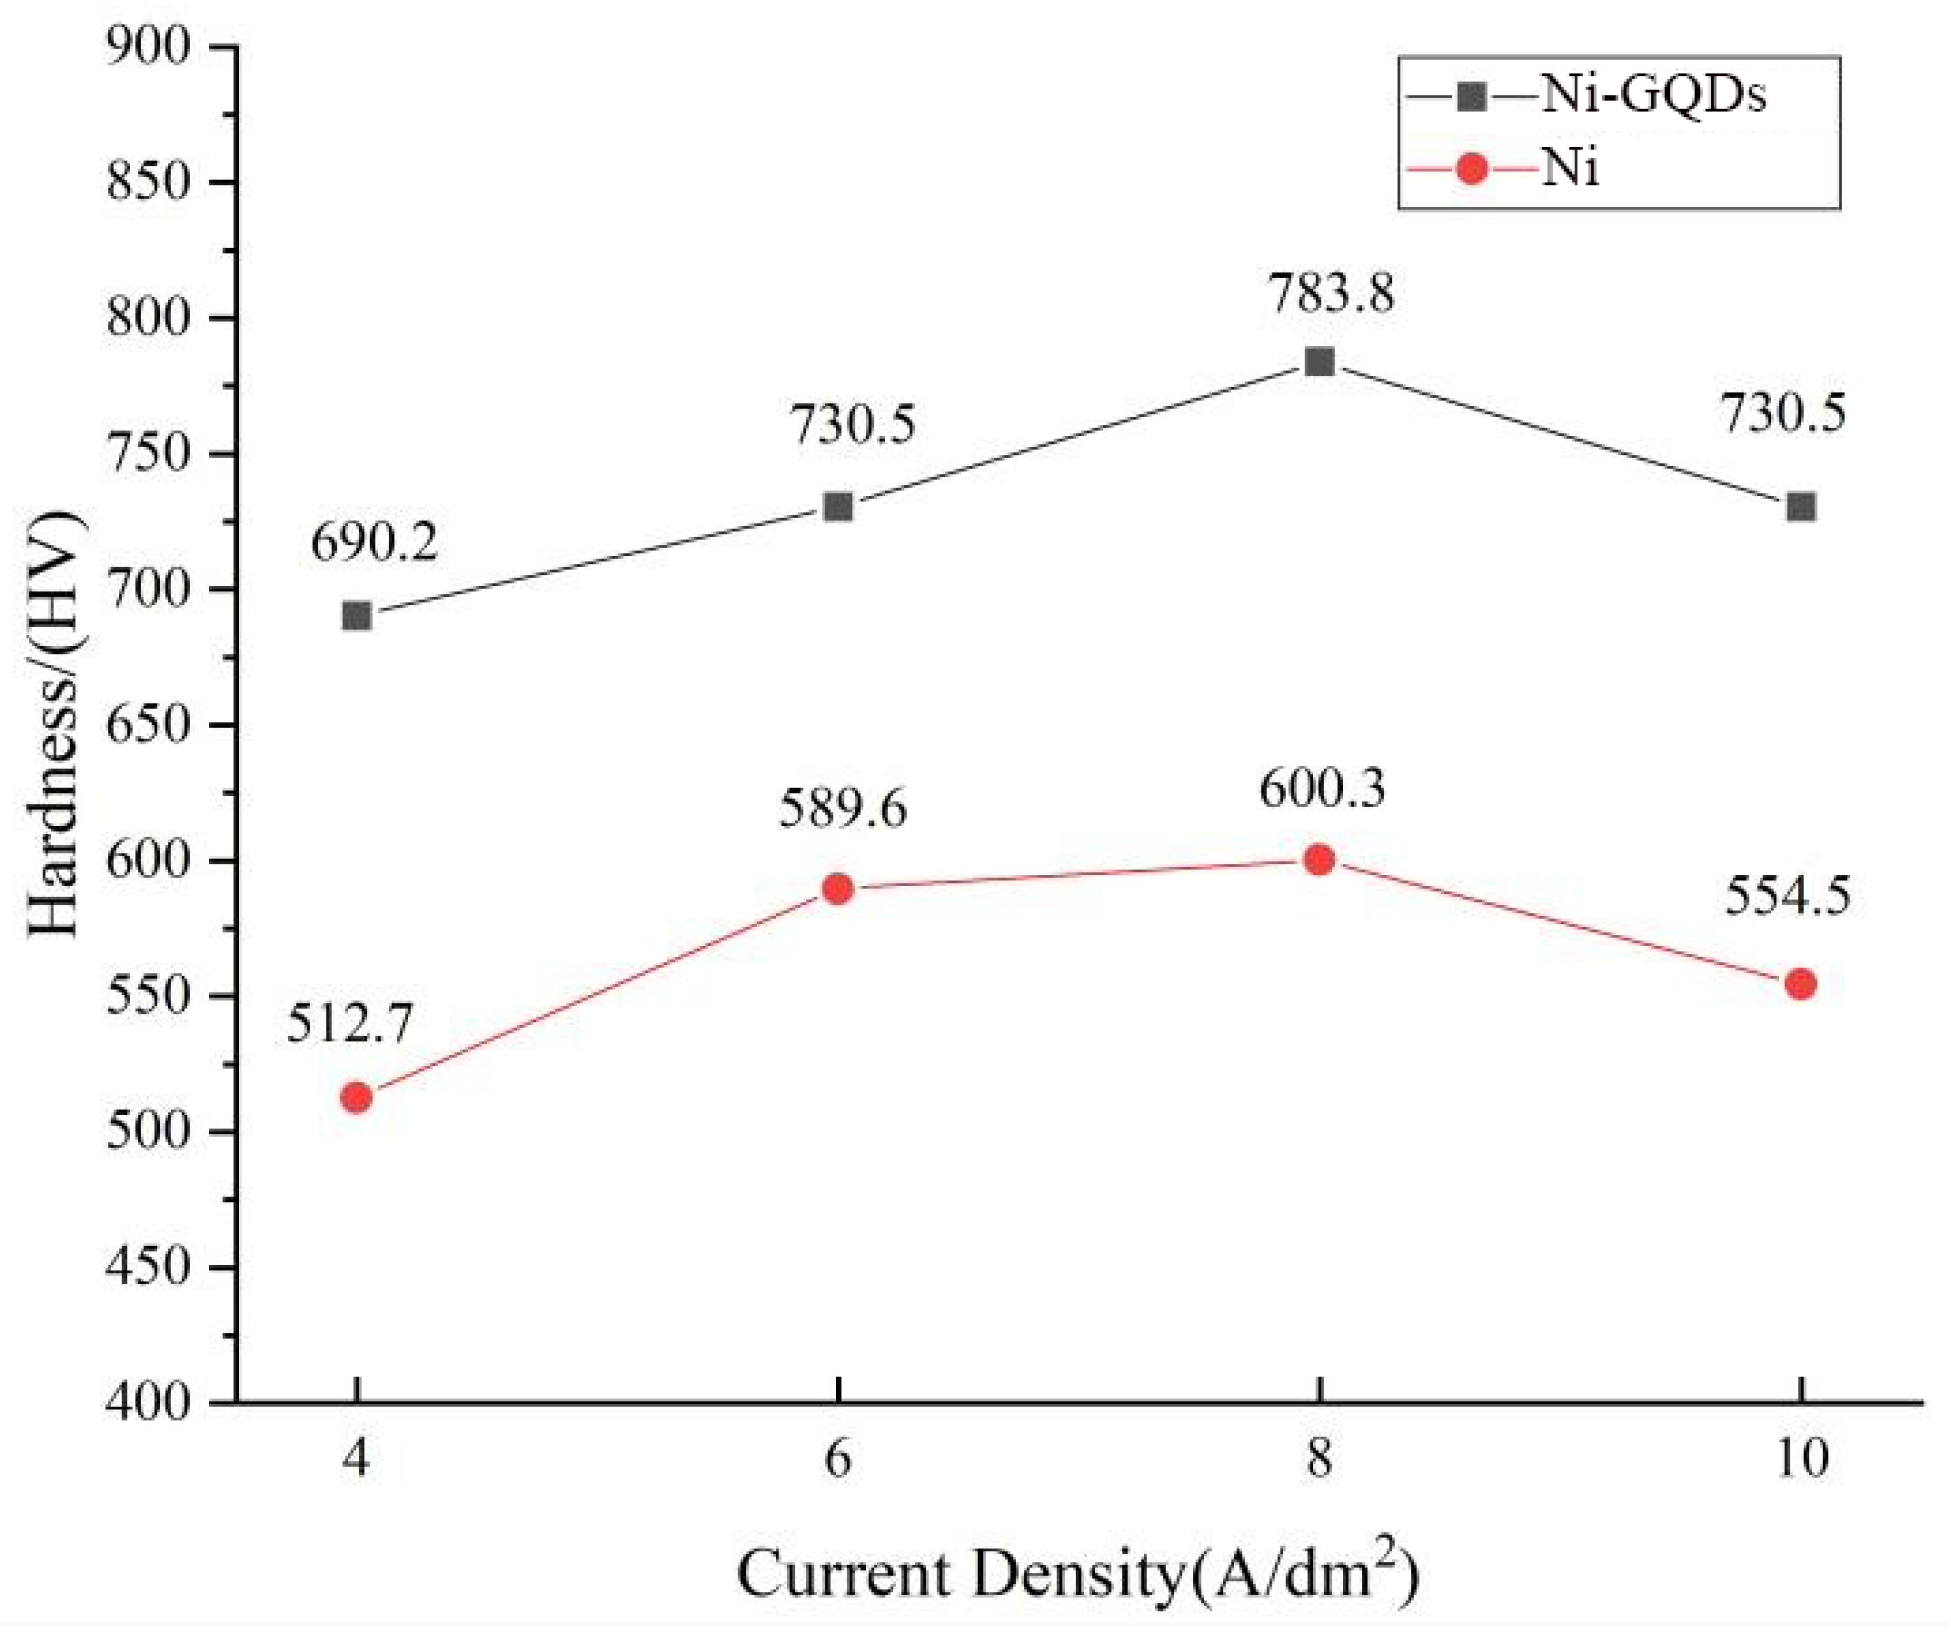
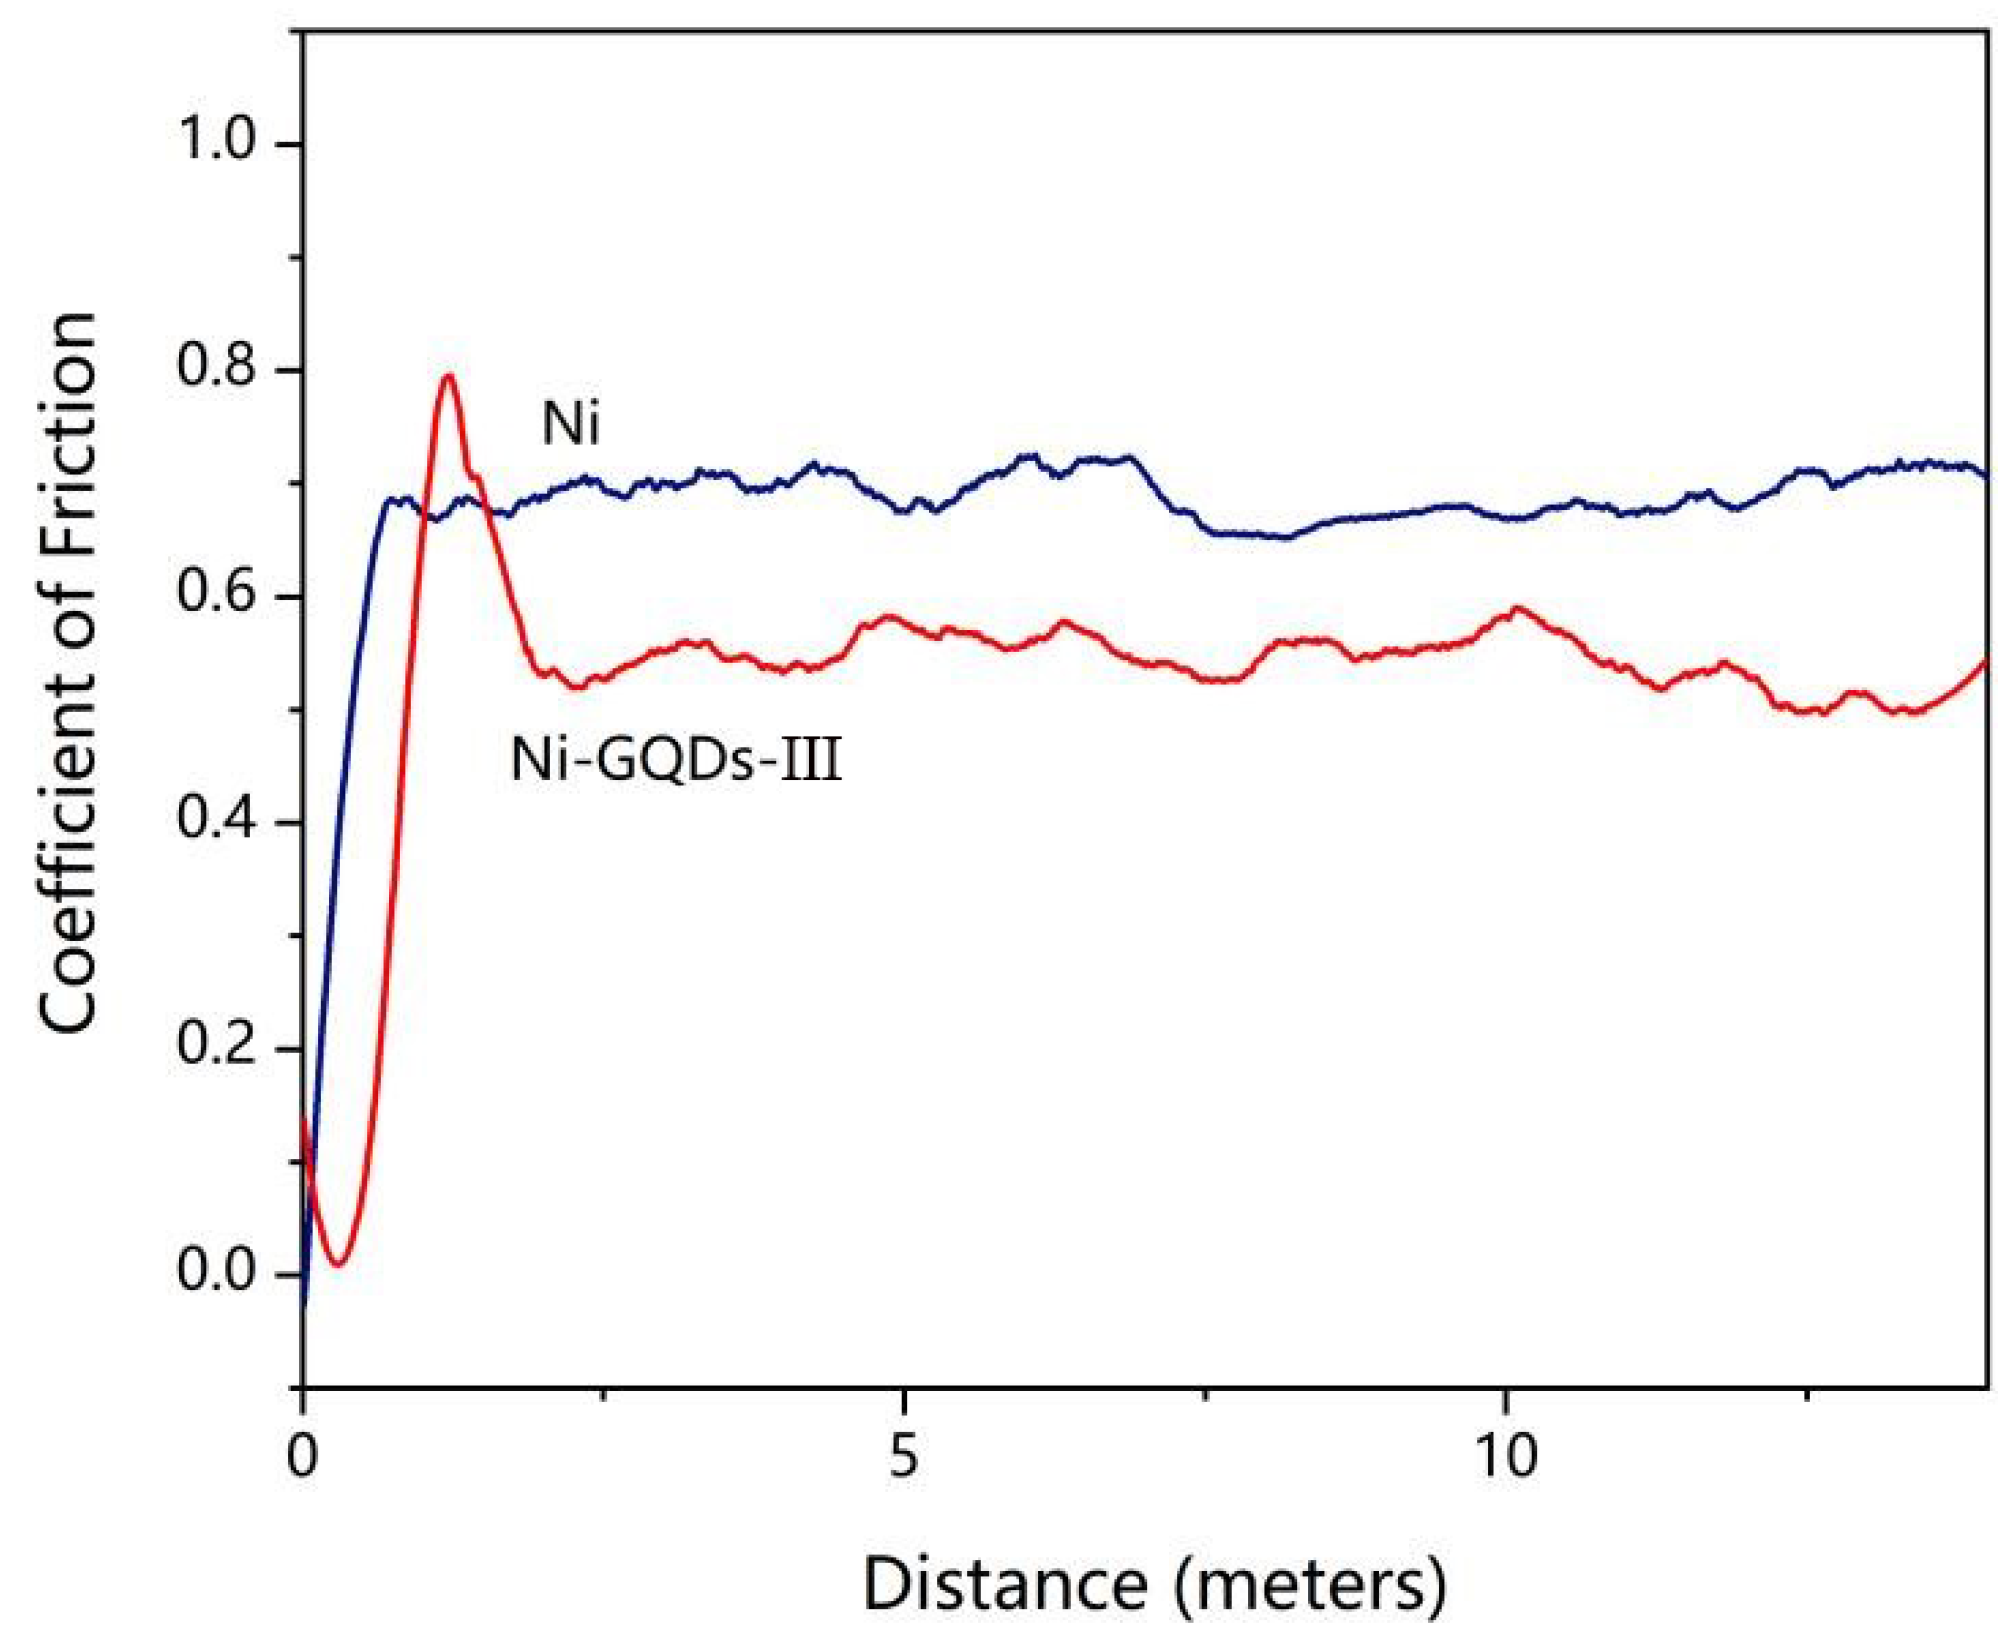
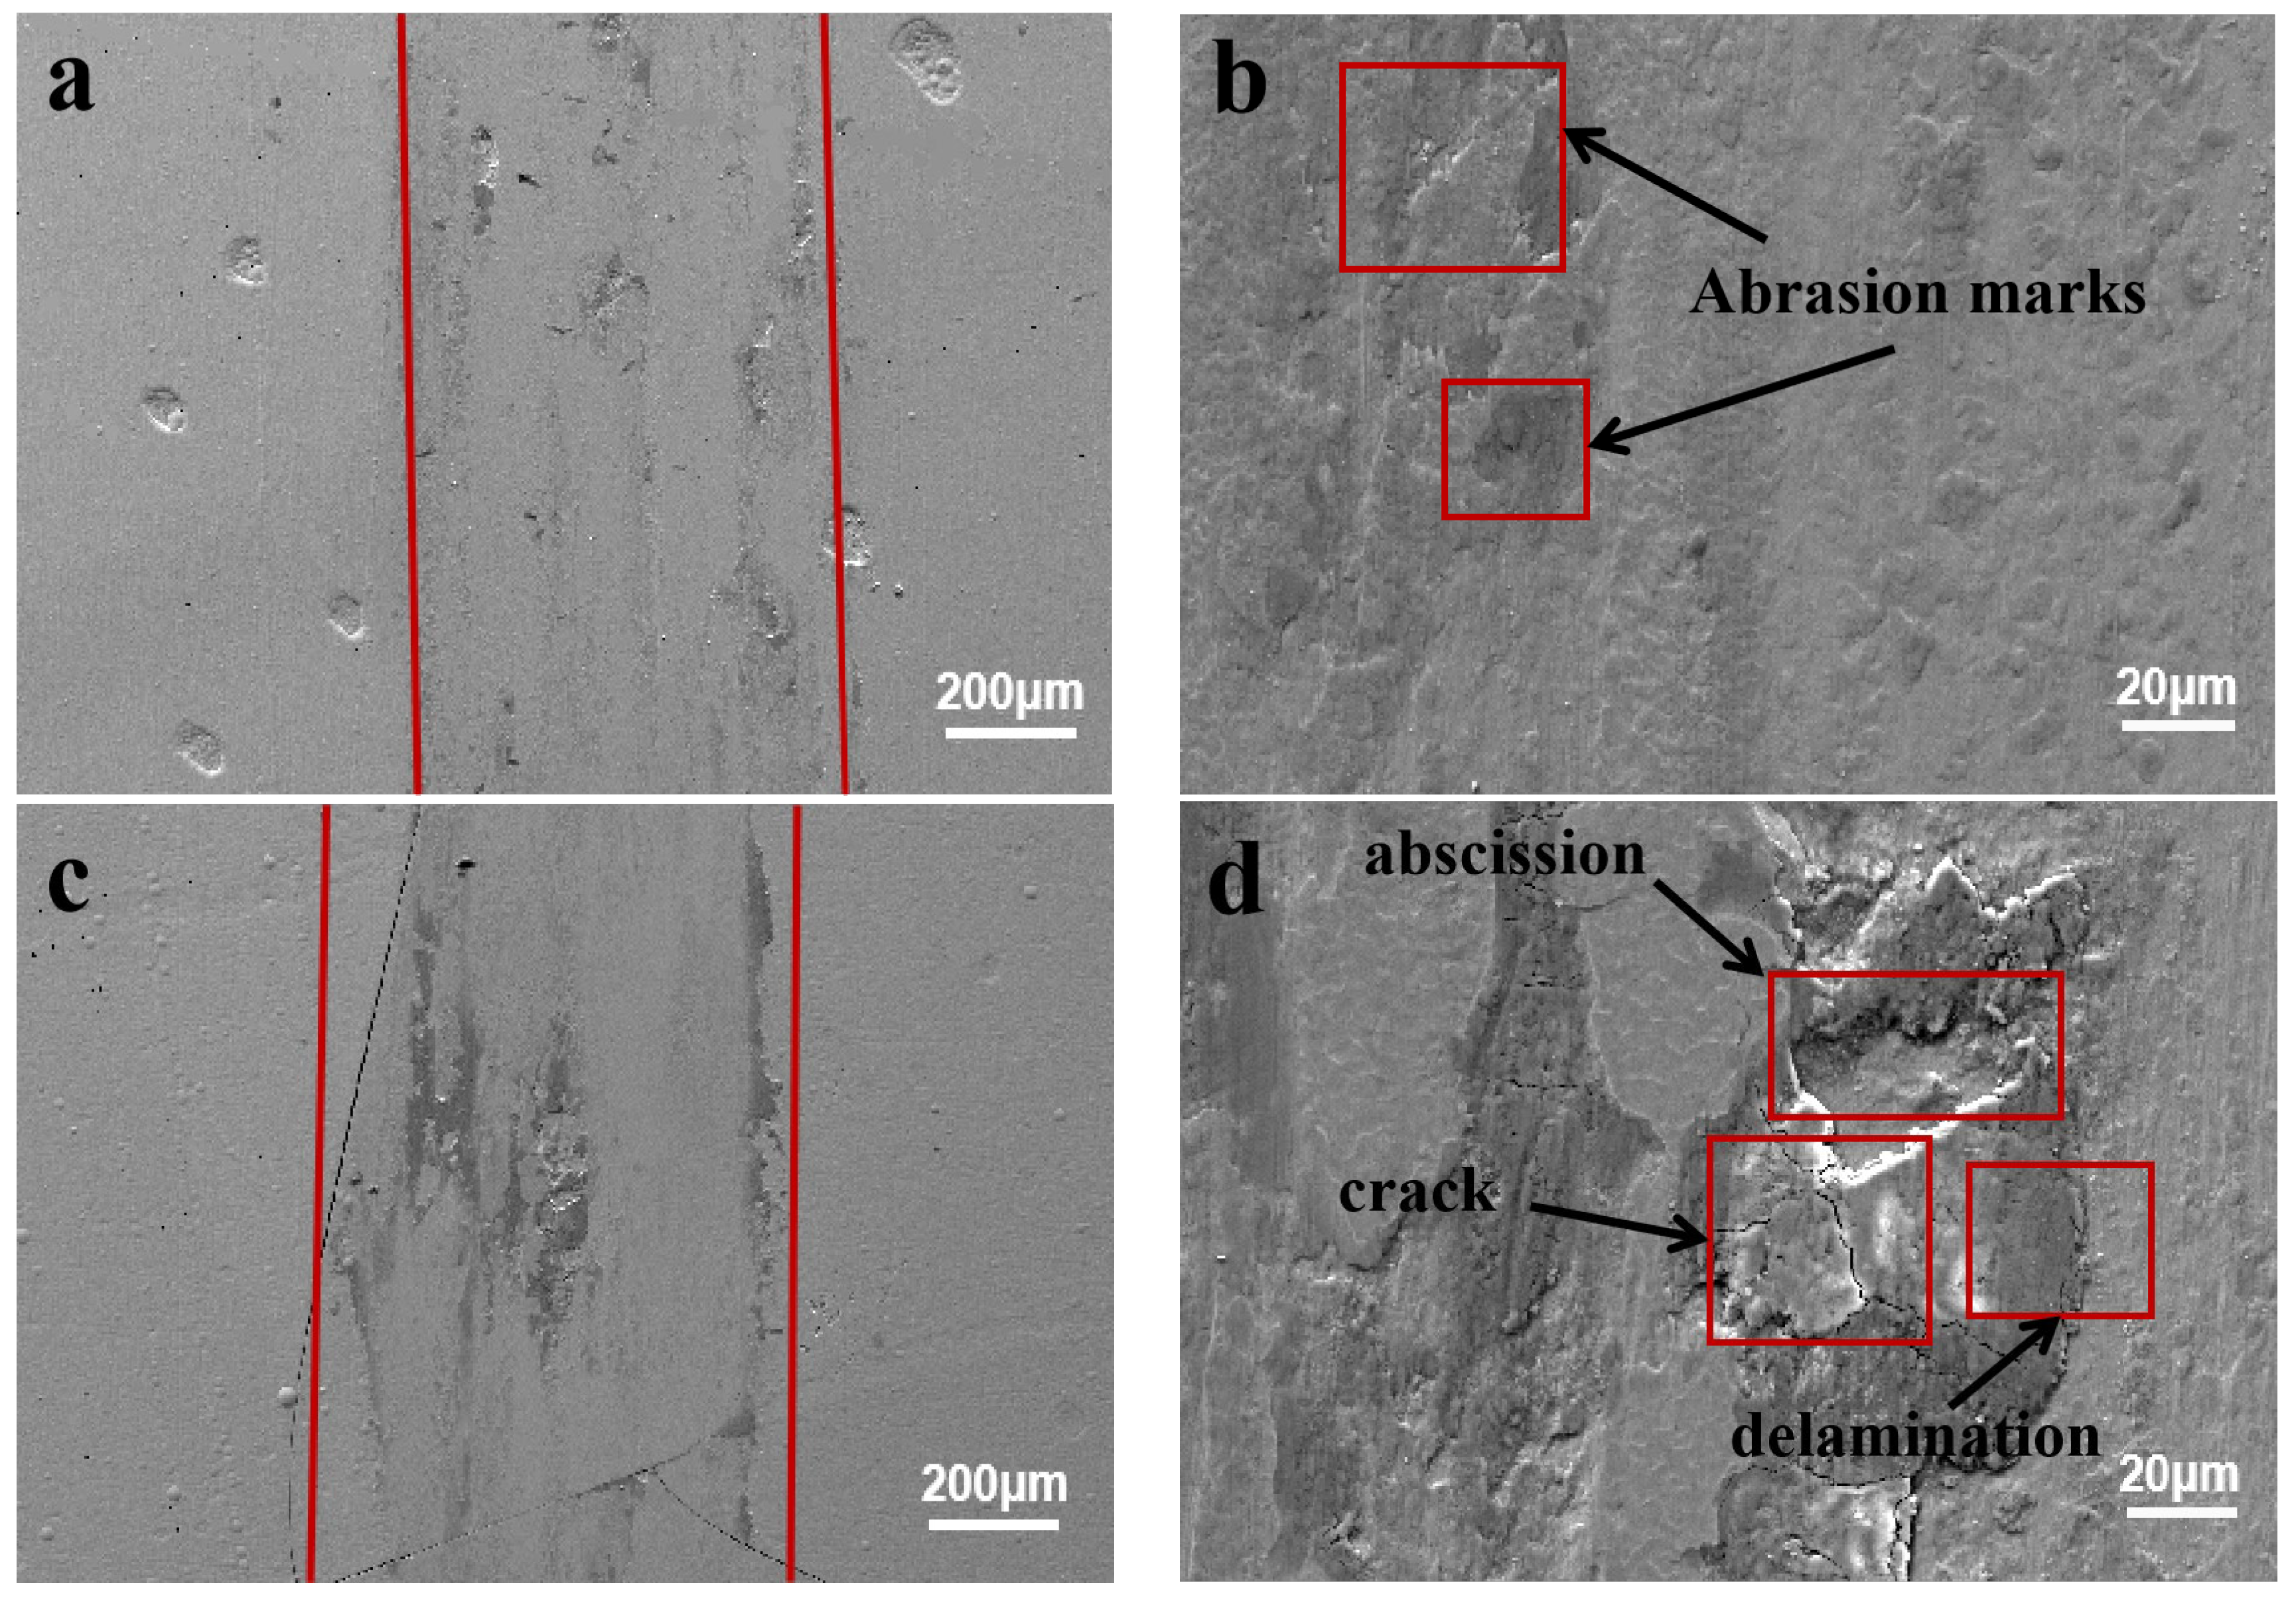
3.4. Microhardness and Wear Resistance of the Coatings

Figure 8 shows the effect of the current density on the microhardness of the coatings. It can be seen in Figure 8 that the microhardness of the coatings with added GQDs was higher than that of the pure-nickel coating, and the addition of the GQDs second phase significantly improved the microhardness of the coating. This was mainly because the GQDs in the composite coating were beneficial to refine the nickel grains and reduce the defects of the coating. From the Hall–Petch equation, the grain size is inversely proportional to the microhardness. This is consistent with the average size of the grains in our coatings. In addition, the GQDs dispersed and deposited in the coating strengthened the composite coating and hindered its plastic deformation thanks to their excellent mechanical properties, thereby further improving the microhardness of the composite coating. With the increase in the current density, the hardness of the Ni–GQDs coating first increased and then decreased. When the current density was 8 A/dm2, the hardness reached the maximum value of 783.8 HV, which was 30% higher than that of the pure-nickel coating. The cathode overpotential increased with the increase in the current density, which augmented the nucleation rate of nickel, thereby refining the grains of the coating and making the crystals denser. When the current density increased to 10 A/dm2, the microhardness of the coating began to decrease due to defects such as scabs and pits in the coating.
Figure 9 shows the 3D views of the surface of the Ni–GQDs−III and Ni coatings scanned after the friction and wear test under the current density of 8 A/dm2 (Figure 9a,b), as well as the corresponding wear scar profiles (Figure 9c,d); the maximum depth of the wear scar, the cross-sectional area of the wear scar, and the wear rate of the two coatings obtained according to the cross-sectional view of the wear scar are shown in Table 8. It can be seen in Table 8 that the Ni–GQDs−III coating presented the shallowest wear scar and the smallest cross-sectional area of the wear scar, and the wear rate was 1.786 × 10⁻⁴ mm3/(N·mm), i.e., 73.2% lower than that of the Ni coating. This showed that the wear resistance of the Ni–GQDs−III coating was better than that of the Ni coating, which was mainly attributed to the relatively good compactness and relatively high microhardness of the Ni–GQDs−III coating under these conditions. Figure 10 shows the friction coefficient curves of the two coatings at a current density of 8 A/dm2. It can be seen in Figure 10 that the friction coefficient curves of the two coatings did not change much with the wear distance, indicating that a balance was reached within the wear distance. The friction coefficient of the Ni–GQDs−III coating was about 0.52, i.e., 17.5% lower than that of the Ni coating, which was 0.63. The addition of GQDs was beneficial to improve the wear resistance of the coating. This could be explained as follows. On the one hand, the nanoparticles falling on the crystals blocked their dislocation and inhibited the deformation of the coating [21]. On the other hand, the GQDs were preferentially deposited on defect sites such as coating vacancies and grain boundaries where they became nucleation active sites, which was conducive to the deposition of adsorbed metal complex ions; the large dispersion of the GQDs increased the heterogeneity in the deposition of the nickel ions. The nucleation increased the nucleation rate, refined the grains of the coating, enhanced the hardness of the coating, and thus improved its wear resistance [22].
Figure 11 shows the wear morphologies of the Ni–GQDs−III coating and the Ni coating after the friction and wear experiments at a current density of 8 A/dm2. It can be seen in Figure 11a,c that the wear scar width of the Ni–GQDs−III coating was significantly smaller than that of the Ni coating, which is consistent with the scanning results of the three-dimensional profiler in the previous experiments. The surfaces of both coatings were plastically deformed, indicating adhesive wear. The difference was that the Ni coating showed greater plastic deformation, accompanied by coating peeling and fracture delamination, while the Ni–GQDs−III coating presented only a small number of wear scars and a slight plastic deformation, as shown in Figure 11b,d. The wear resistance of the coatings was greatly affected by their own hardness. The hardness of the Ni coating was relatively low. The local frictional heat and high pressure generated during the friction process aggravated the degree of local plastic deformation of the coating and the wear debris that fell off first. It also acted as an abrasive between the friction pairs and further aggravated the local plastic deformation of the coating. These severe deformations caused the production of small cracks in places with great stress concentration and serious crystal structure defects. When the friction force was greater than the fracture strength, the local plastic deformation started to cause the deterioration of the coating, resulting in the phenomenon shown in Figure 11d. Combined with the change in grain size previously measured by X-ray diffractometry and the analysis with the Hall–Petch formula, the addition of GQDs refined the grains of the Ni–GQDs−III coating, improved the microhardness of the coating, and enhanced the plasticity of the coating. The deformation and grinding ability increased, thus improving the wear resistance.

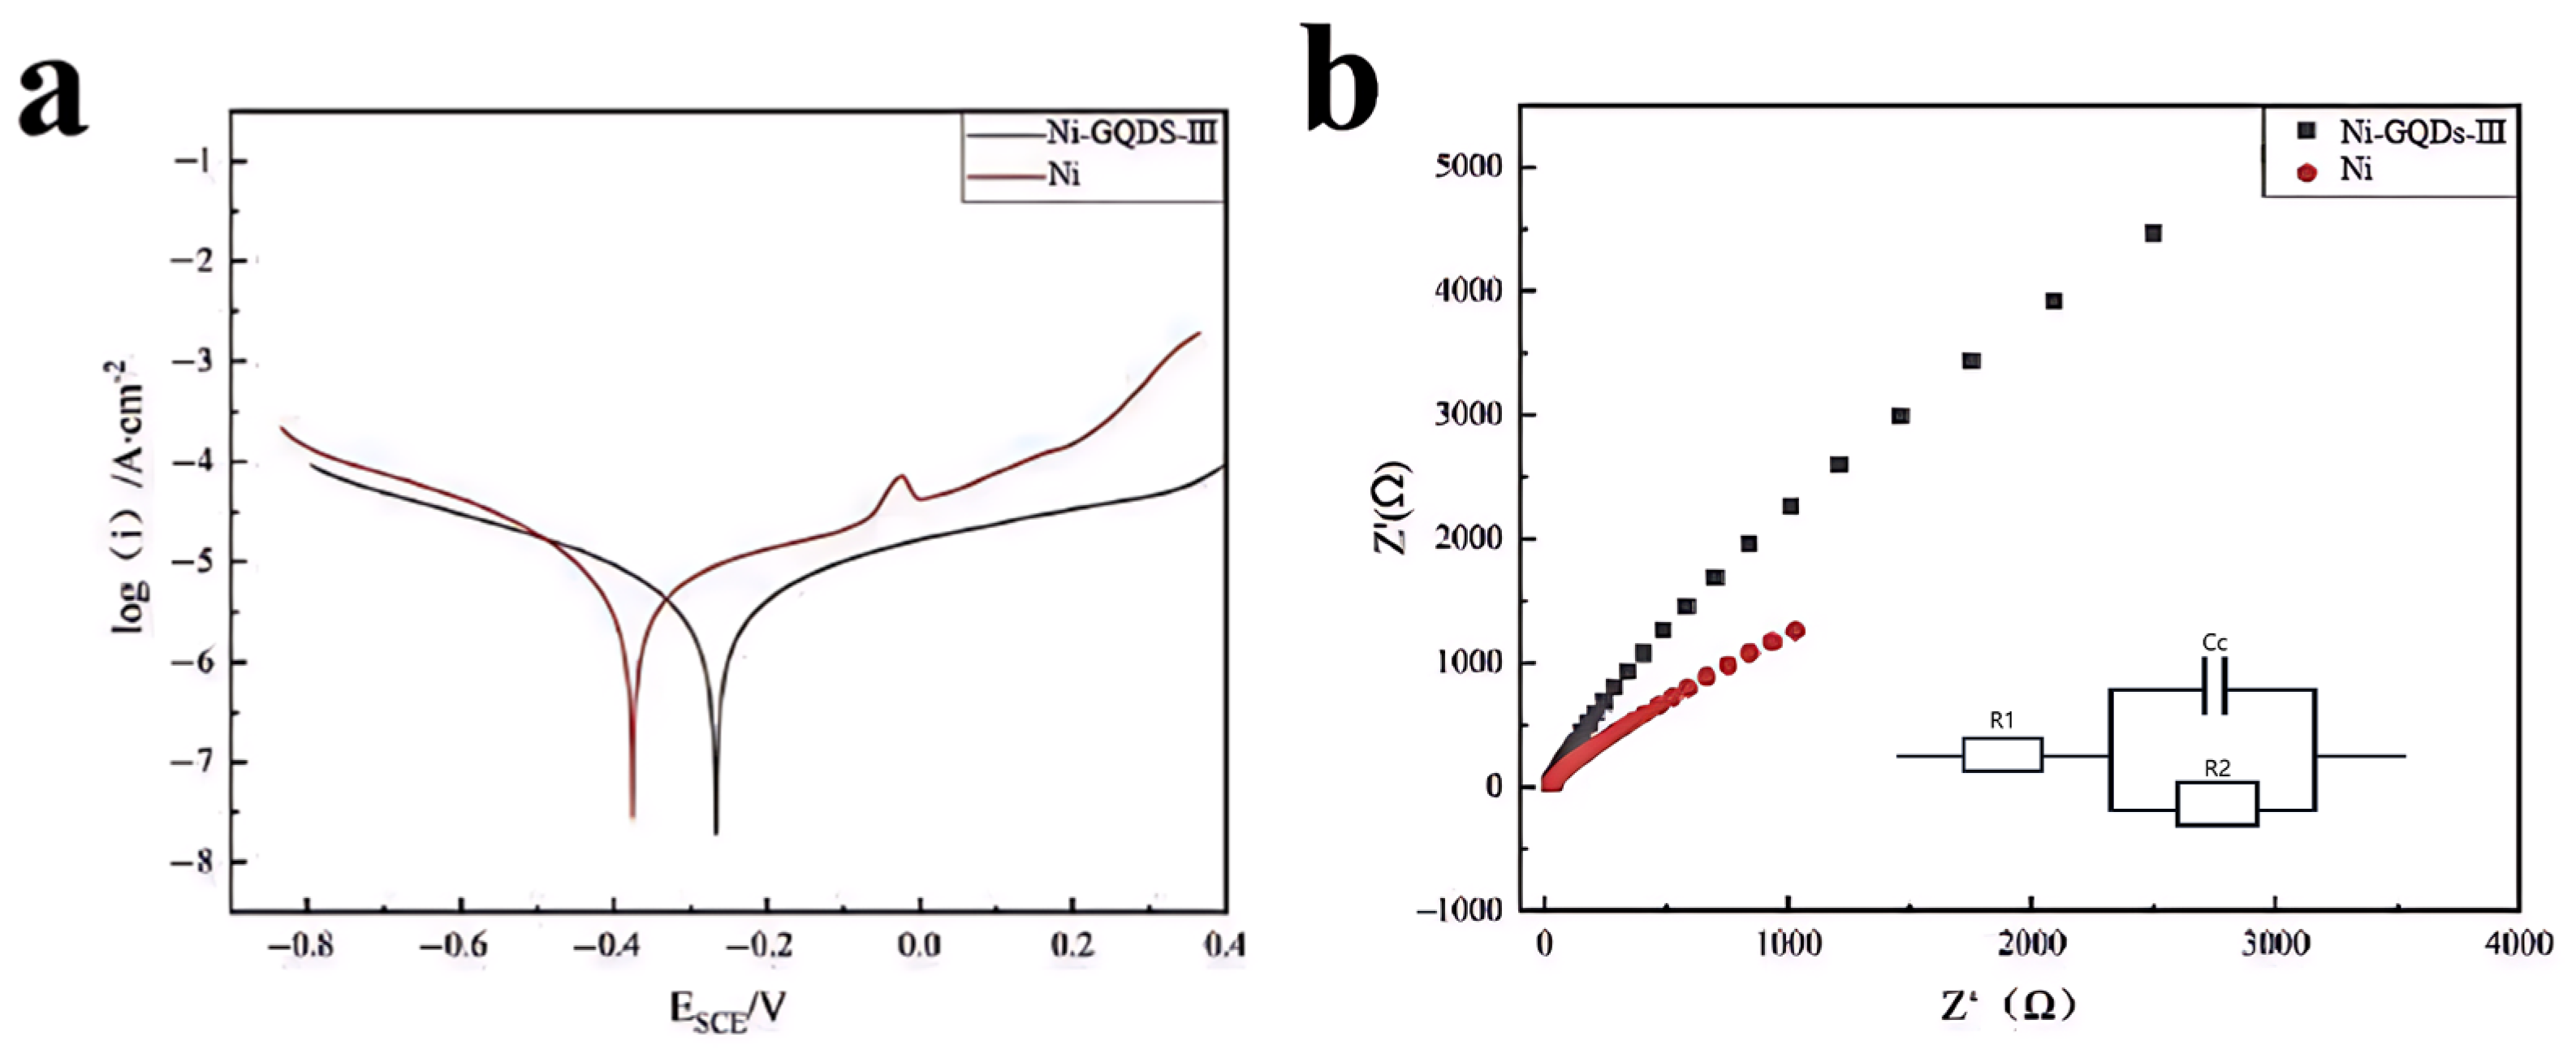
3.5. Corrosion Resistance of the Coatings

The potentiodynamic polarization curves and impedance spectra of the Ni–GQDs−III coating and Ni coating immersed in a 3.5% NaCl solution are shown in Figure 12. Table 9 shows the values of Icorr and Ecorr fitted in the corresponding Tafel curves. The self-corrosion potential of the Ni–GQDs−III coating was −0.278 V, and the addition of the GQDs improved the self-corrosion potential. The Icorr of the Ni–GQDs−III coating was 4.117 × 10⁻⁶ A/cm−2, that is, 9.2% lower than that of the Ni coating. The self-corrosion current reflects the corrosion rate to a certain extent. The lower the self-corrosion current is, the stronger the anti-corrosion performance is [23]. Therefore, the corrosion resistance of the Ni–GQDs−III coating was better than that of the Ni coating. On the one hand, the active surface area of the electrode was reduced due to the introduction of the GQDs, thereby reducing the diffusion and transfer of chlorine particles in the corrosion solution in the Ni–GQDs−III coating [24], the local corrosion area associated with the chlorine particles in the coating, and the specific adsorption of pitting pores. On the other hand, the addition of the GQDs provided heterogeneous nucleation sites for the cathode, inhibited the grain growth, and made the surface of the coating denser, which hampered the penetration of the corrosive solution in the coating towards the substrate. The GQDs not only filled the defects in the coating but also made the composite coating denser. They could also effectively prevent the further expansion of corrosion pits [25], thereby improving the corrosion resistance of the coating.
A fitting circuit analysis was carried out on the impedance spectrum in Figure 12b, and the equivalent circuit model is shown in Figure 12b, where R1 is the resistance of the plating solution, Cc is the capacitance of the coating, and R2 is the resistance of the coating. The resistance value of the coating (R2) represents the strength of the corrosion resistance of the coating. According to the impedance spectrum characteristics and equivalent circuit diagram, Zsimp was used to fit the data, and the results are shown in Table 10. The resistance value of the Ni–GQDs−III coating was higher than that of the Ni coating, indicating that the corrosion resistance of the Ni–GQDs−III coating was better than that of the Ni coating. This was consistent with the Tafel curve analysis. In order to understand the long-term corrosion resistance of the Ni–GQDs−III coating, the Ni–GQDs−III and Ni coatings were soaked in a 3.5% sodium chloride solution for 72 h and 120 h. The surface morphology after corrosion is shown in Figure 13. The Ni–GQDs−III coating after immersion for 72 h hardly showed any change, while the Ni coating presented dense pits. After soaking for 120 h, the Ni–GQDs−III coating contained only a few pits and corrosion holes, but a large number of corrosion holes were present on the surface of the Ni coating. After the GQDs entered the composite coating, the corrosion damage degree of the coating surface was relatively reduced. Therefore, the long-term corrosion resistance of the Ni–GQDs−III coating was better than that of the Ni coating. The analysis showed that the Ni–GQDs−III coating had good compactness and few defects, which prevented the corrosion by Cl in the long term. Therefore, the long-term corrosion resistance of the Ni–GQDs−III coating was improved.

4. Conclusions

(1)
Under supercritical conditions, the surface density of the Ni–GQDs composite coatings was good, exhibiting good sphericity, and the thickness of the composite coatings was smaller than that of the Ni coating. In particular, the surface morphology of the nanocomposite coating prepared at 8 A/dm2 was relatively better than those of coatings prepared at other current densities.
(2)
The addition of GQDs refined the grains of the composite coatings, improved their microhardness, changed the preferred orientation of the nickel grains, and reduced the grain size of the coatings from 35 nm to 23 nm. Especially, when the current density was 8 A/dm2, the microhardness of the composite coating reached a maximum value of 783.8 HV, which was 30% higher than that of the supercritical pure-nickel coating.
(3)
The wear resistance test showed that with the addition of the GQDs, the wear rate of the nanocomposites decreased to 1.786 × 10⁻⁴ mm3/(N·mm), and the friction coefficient decreased to 0.52; these values were 73.2% and 17.5% lower than those determined for the supercritical pure-nickel coating, respectively. The presence of the GQDs enhanced the resistance to plastic deformation and the grinding ability of the coatings, greatly improving their wear resistance.
(4)
The corrosion resistance test showed that the addition of the GQDs improved the corrosion resistance of the composite coatings. Compared with the supercritical pure nickel coating, the corrosion current density of the Ni–GQDs−III coating prepared at a current density of 8 A/dm2 decreased by 9.2%. After 120 h of immersion, it was found that there were only a few pits and corrosion holes in the Ni–GQDs−III coating, while a large number of corrosion holes had appeared on the surface of the Ni coating. The higher corrosion resistance of the Ni–GQDs−III coating was attributed to the GQDs.

Author Contributions

Y.L., thesis conceptualization, research design, situation analysis, data collection, data analysis, data management, manuscript writing. W.L., project management, resourcing, mentoring, validating, reviewing and editing writing. Z.L., literature search, graphing, data collection, and validation. H.Q., literature search, charting, and data analysis. C.F., literature search, data collection, situation analysis. B.H., data analysis, guidance, and validation. All authors have read and agreed to the published version of the manuscript.

Funding

This research was funded by National Natural Science Foundation of China (51975264) And the APC was funded by National Natural Science Foundation of China (51975264).

Data Availability Statement

Not applicable.

Conflicts of Interest

The authors declare no conflict of interest.

References

  1. Chakraborty, S.; Kar, S.; Dey, V.; Ghosh, S.K. The phenomenon of surface modification by electro-discharge coating process: A review. Surf. Rev. Lett. 2018, 25, 1830003. [Google Scholar] [CrossRef]
  2. Karmakar, R.; Maji, P.; Ghosh, S.K. A review on the nickel based metal matrix composite coating. Met. Mater. Int. 2021, 27, 2134–2145. [Google Scholar] [CrossRef]
  3. Feng, Z.; Tang, M.; Liu, Y.; Yan, Z.; Li, G.; Zhang, R. In situ synthesis of TiC-TiN-reinforced Fe-base plasma cladding coatings. Surf. Eng. 2018, 34, 309–315. [Google Scholar] [CrossRef]
  4. Torabinejad, V.; Aliofkhazraei, M.; Assareh, S.; Allahyarzadeh, M.H.; Rouhaghdam, A.S. Electrodeposition of Ni-Fe alloys, composites, and nano coatings–A review. J. Alloys Compd. 2017, 691, 841–859. [Google Scholar] [CrossRef]
  5. Sarafrazi, M.H.; Alizadeh, M. Improved characteristics of Ni-electrodeposited coatings via the incorporation of Si and TiO2 particulate reinforcements. J. Alloys Compd. 2017, 720, 289–299. [Google Scholar] [CrossRef]
  6. Mu, J.; Gao, F.; Cui, G.; Wang, S.; Tang, S.; Li, Z. A comprehensive review of anticorrosive graphene-composite coatings. Prog. Org. Coat. 2021, 157, 106321. [Google Scholar] [CrossRef]
  7. Pinate, S.; Zanella, C. Wear behavior of Ni-based composite coatings with dual nano-SiC: Graphite powder mix. Coatings 2020, 10, 1060. [Google Scholar] [CrossRef]
  8. Yan, C.; Karthik, N.; Li, H.; Kang, Y.; Xiong, D. The nickel based composite coating fabricated by pulse electroplating through graft between nano-TiN and graphene oxide. Ceram. Int. 2020, 46, 15714–15718. [Google Scholar] [CrossRef]
  9. Wang, Z.F.; Liu, F. Nanopatterned graphene quantum dots as building blocks for quantum cellular automata. Nanoscale 2011, 3, 4201–4205. [Google Scholar] [CrossRef] [PubMed]
  10. Fattah-alhosseini, A.; Chaharmahali, R. Enhancing corrosion and wear performance of PEO coatings on Mg alloys using graphene and graphene oxide additions: A review. FlatChem 2021, 27, 100241. [Google Scholar] [CrossRef]
  11. Jiang, B.K.; Chen, A.Y.; Gu, J.F.; Fan, J.T.; Liu, Y.; Wang, P.; Li, H.; Sun, H.; Yang, J.; Wang, X. Corrosion resistance enhancement of magnesium alloy by N-doped graphene quantum dots and polymethyltrimethoxysilane composite coating. Carbon 2020, 157, 537–548. [Google Scholar] [CrossRef]
  12. Chien, Y.A.; Chen, C.Y.; Sone, M.; Chang, T.F.M. Sample size effect in Ni-TiO2 composites fabricated by supercritical CO2 emulsified CO-electroplating for miniaturized device. Micro Nano Eng. 2022, 15, 100135. [Google Scholar] [CrossRef]
  13. Pandiyarajan, S.; Hsiao, P.J.; Liao, A.H.; Ganesan, M.; Huang, S.T.; Chuang, H.C. High-performance polyvinylpyrrolidone capped copper coatings via ultrasonic-assisted supercritical-CO2 electrodeposition: Electrochemical evaluation. Surf. Coat. Technol. 2021, 409, 126926. [Google Scholar] [CrossRef]
  14. Pandiyarajan, S.; Manickaraj, S.S.M.; Liao, A.H.; Ramachandran, A.; Lee, K.Y.; Chuang, H.C. Construction of zinc-cobalt alloy film by supercritical-CO2 electrodeposition pathway: Evaluation of electrochemical robustness. Inorg. Chem. Commun. 2022, 144, 109858. [Google Scholar] [CrossRef]
  15. Qu, D.; Zheng, M.; Du, P.; Zhou, Y.; Zhang, L.; Li, D.; Tan, H.; Zhao, Z.; Xie, Z.; Sun, Z. Highly luminescent S, N co-doped graphene quantum dots with broad visible absorption bands for visible light photocatalysts. Nanoscale 2013, 5, 12272–12277. [Google Scholar] [CrossRef] [PubMed]
  16. Kartal, M.; Buyukbayram, I.; Alp, A.; Akbulut, H. Production of pulse electrodeposited Ni-TiC nanocomposite coatings. Mater. Today Proc. 2017, 4, 6982–6989. [Google Scholar] [CrossRef]
  17. Maharana, H.S.; Rai, P.K.; Basu, A. Surface-mechanical and electrical properties of pulse electrodeposited Cu–graphene oxide composite coating for electrical contacts. J. Mater. Sci. 2017, 52, 1089–1105. [Google Scholar] [CrossRef]
  18. Li, Y.; Wang, G.; Liu, S.; Zhao, S.; Zhang, K. The preparation of Ni/GO composite foils and the enhancement effects of GO in mechanical properties. Compos. Part B Eng. 2018, 135, 43–48. [Google Scholar] [CrossRef]
  19. Wang, J.; Lei, W.; Deng, Y.; Xue, Z.; Qian, H.; Liu, W.; Li, X. Effect of current density on microstructure and corrosion resistance of Ni-graphene oxide composite coating electrodeposited under supercritical carbon dioxide. Surf. Coat. Technol. 2019, 358, 765–774. [Google Scholar] [CrossRef]
  20. Hao, H.H.; Liu, J.B.; Li, K.W.; Wang, H.; Yan, H. Research progress on characterization of graphene structure by raman spectroscopy. Mater. Eng. 2018, 46, 1–10. [Google Scholar]
  21. Wei, G.; Gao, E.; Ding, Z.; Li, X. Effect of graphene particle size on the properties of Ni-Co-graphene composite coatings. Rare Met. Mater. Eng. 2018, 50, 1735–1742. [Google Scholar]
  22. Xue, Z.; Lei, W.; Wang, Y.; Qian, H.; Li, Q. Effect of pulse duty cycle on the microstructure and properties of graphene composite coatings under supercritical conditions. Mater. Eng. 2019, 47, 53–62. [Google Scholar]
  23. Fan, Y.; Yang, L.; Zhang, J.; Wu, H.; Wang, Y. Preparation and properties of carbon nanotubes reinforced Cu–Ni composite coatings. Surf. Technol. 2019, 48, 114–124. [Google Scholar]
  24. Khalil, M.W.; Eldin, T.A.S.; Hassan, H.B.; El-Sayed, K.; Hamid, Z.A. Electrodeposition of Ni–GNS–TiO2 nanocomposite coatings as anti-corrosion film for mild steel in neutral environment. Surf. Coat. Technol. 2015, 275, 98–111. [Google Scholar] [CrossRef]
  25. Lou, Y.; Sun, J.; Xia, F. Corrosion behavior of Ni–SiC nanocoatings prepared by jet electrodeposition. Ordnance Mater. Sci. Eng. 2020, 43, 38–42. [Google Scholar]
Figure 1. Schematic diagram of the supercritical composite electroplating system.
Metals 13 01794 g001
Figure 2. Transmission electron microscopy (TEM) images and high-resolution TEM images of the prepared GQDs.
Metals 13 01794 g002
Figure 3. SEM of the surface morphology of the Ni–GQDs coatings and Ni coatings under different average current densities. (a) Ni–GQDs–I; (b) Ni–GQDs–II; (c) Ni–GQDs–III; (d) Ni–GQDs–IV; (e) Ni.
Metals 13 01794 g003
Figure 4. Metallographic and SEM images of the Ni–GQDs–III coating (a,b) and the Ni coating (c,d).
Metals 13 01794 g004
Figure 5. XRD patterns of the Ni–GQDs and Ni coatings.
Metals 13 01794 g005
Figure 6. Raman spectra of the GQDs, Ni–GQDs–III coating, and Ni coating.
Metals 13 01794 g006
Figure 7. (a) TEM image; (b) high-resolution image; (c) SAED pattern of the Ni–GQDs−III coating.
Metals 13 01794 g007
Figure 8. Microhardness of the Ni–GQDs coating and Ni coating at different average current densities.
Metals 13 01794 g008
Figure 9. Three-dimensional view (a,c) and wear scar profile (b,d) of the Ni–GQDs−III coating and Ni coating at the current density of 8 A/dm2.
Metals 13 01794 g009
Figure 10. Friction coefficient of the Ni–GQDs−III coating and Ni coating.
Metals 13 01794 g010
Figure 11. SEM images of the friction and wear effects on the Ni–GQDs−III coating (a,b) and Ni coating (c,d) at a current density of 8 A/dm2.
Metals 13 01794 g011
Figure 12. (a) Polarization curve of the Ni–GQDs−III coating and Ni coating in a 3.5% sodium chloride etching solution. (b) Impedance plots and equivalent circuit diagrams of Ni-GQDs-III coatings and nickel coatings in 3.5% NaCl etching solution.
Metals 13 01794 g012
Figure 13. Corrosion-induced morphologies of the Ni–GQDs−III (a,c) and Ni coatings (b,d) after the immersion test for 72 h and 120 h.
Metals 13 01794 g013
Table 1. Raw materials for the preparation of graphene quantum dots.
ReagentDosage/g
C6H8O7·H2O0.21
CH4N2O0.18
H2O5
Table 2. Composition of the electrolytes.
ComponentsDosage/(g·L−1)
NiSO4·6H2O300.0
NiCl2·6H2O30.0
H3BO335.0
C12H25NaO4S0.2
TMN Surfactant0.15
Table 3. Process parameters.
Process ParametersSample
Ni–GQDs–INi–GQDs–IINi–GQDs–IIINi–GQDs–IVNi
GQDs (g/L)0.150.150.150.150
Current density(A/dm2)468108
Pressure/MPa9.59.59.59.59.5
Temperature/°C5050505050
Table 4. Crystal plane texture coefficients of the Ni–GQDs and Ni coatings.
SampleTC (111)TC (200)TC (220)
4 A/dm2, Ni–GQDs–I0.37580.32260.2948
6 A/dm2, Ni–GQDs–II0.41380.32260.2636
8 A/dm2, Ni–GQDs–III0.35130.31800.3307
10 A/dm2, Ni–GQDs–IV0.42660.31120.2621
8 A/dm2, Ni0.16770.69480.1374
Table 5. Average grain size of the Ni–GQD coatings and Ni coating.
SampleAverage Grain Size (nm)
4 A/dm2, Ni–GQDs–I32 ± 3
6 A/dm2, Ni–GQDs–II29 ± 3
8 A/dm2, Ni–GQDs–III23 ± 3
10 A/dm2, Ni–GQDs–IV27 ± 3
8 A/dm2, Ni35 ± 3
Table 6. The positions and intensity values of the D and G bands in the Raman spectra.
SamplePosition D (cm−1)Position G (cm−1)Strength D (ID)Strength G (IG)ID/IG
GQDs1357.51551.11121.41133.30.98
Ni–GQDs–III1340.91568.52000.52197.60.91
Ni/////
Table 7. Carbon content of the Ni and Ni–GQDs−III coatings determined by a carbon–sulfur analyzer.
SampleWeight of Sample (g)C (wt%)
Ni0.20210.061
Ni–GQDs−III0.20560.890
Table 8. Wear resistance test results for the Ni–GQDs−III coating and Ni coating.
SampleMaximum Depth of Wear Scar/μmWear Scar Cross Section/μm2Wear Rate mm3/(N·mm)
8 A/dm2, Ni–GQDs−III12.117861.786 × 10−4
8 A/dm2, Ni19.266646.664 × 10−4
Table 9. Fitting results of the polarization curves of the Ni and Ni–GQDs−III coatings in a 3.5% NaCl etching solution.
SampleEcorr (V)Icorr (A/cm−2)
Ni−0.3754.536 × 10−6
Ni–GQDs−III−0.2784.117 × 10−6
Table 10. Fitting circuit values.
CoatingR1/Ω∙cm2R2/Ω∙cm2
Ni–GQDs−III28.898979
Ni33.271054
Disclaimer/Publisher’s Note: The statements, opinions and data contained in all publications are solely those of the individual author(s) and contributor(s) and not of MDPI and/or the editor(s). MDPI and/or the editor(s) disclaim responsibility for any injury to people or property resulting from any ideas, methods, instructions or products referred to in the content.

