Abstract
This study conducts a comparative electrochemical evaluation of three types of pearlitic steels used in flexible pipelines for oil transport in marine environments. The steels have been manufactured with chemical composition and geometry variations to optimize operation performance under adverse conditions. Electrochemical tests were conducted using solutions simulating marine environments with NaCl and CO2, and at high temperatures. The results indicated that spheroidized (SC) steel demonstrated the best corrosion resistance under these specific conditions. Additionally, the Raman spectroscopy characterization technique was used to analyze the layers of corrosion products formed during the tests, identifying the presence of FeCO3 (siderite) and other corrosive oxides. These discoveries are valuable for selecting and improving materials in flexible pipelines used in oil production in marine waters. The study highlights the importance of the cementite morphology present in pearlite as a relevant factor in the corrosive behavior of steels, contributing to the development of more efficient and durable solutions for the offshore oil and gas industry.
1. Introduction
The offshore oil industry includes, as a cost of its operations, the purchase and maintenance of crude oil exploration pipelines. The pipelines, called risers, connect a floating offshore oil production structure to the subsea production system [1,2]. These risers have several layers of metallic and polymeric materials, and their main characteristics are tensile strength, collapse, internal pressure, attack by chemical products, ease of installation and reuse, and flexibility, among others [3,4].
In the region called the annular space, the tension reinforcements that support the axial loads of the pipeline and the pressure reinforcements that provide the pipeline with the capacity to withstand its internal pressures are positioned in overlapping layers. In this confined space between the layers, material failure can occur through the phenomena known as sweet corrosion and other structural damage caused by corrosion [5,6].
The evaluation of the tensile strength of wires subjected to severe corrosion conditions with CO2 and NaCl is of interest to the oil industry, in addition to appealing to companies manufacturing risers that develop materials with different compositions and heat treatments. The application of other materials and in environmentally unfavorable conditions are relevant factors for the industries that manufacture such components since, for these reasons, the optimization and quality of the final product are essential [7,8]. CO2 gas has a very damaging effect on the surface of steel, especially due to forming H2CO3, an acidic compound that can lead to the rupture of pipelines and other oil production structures [9,10].
Although this type of structure is vital for the oil industry to guarantee productivity and a safe environment, few studies have investigated them in conditions that can simulate the application of the main components of these risers when in service. Therefore, this work aims to correlate the corrosion resistance of pearlitic steels with different cementite profiles under various atmospheric conditions. NaCl solution with the presence of CO2 and at different temperatures was evaluated. Raman spectroscopy was also used to verify the presence of oxides and salts resulting from corrosion products on the material’s surface.
2. Materials and Methods
2.1. Materials
The materials used in this study were pearlitic steel (eutectoid) used as tensor armors, received in the form of wires, initially called wires A, B and C, as shown in Figure 1.
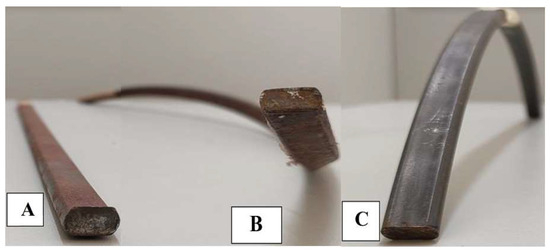
Figure 1.
Wire format in its received condition: (A) flat (1.29 cm × 0.69 cm), (B) twisted (1.21 cm × 0.60 cm) and (C) bent (1.23 cm × 0.72 cm).
The chemical composition (wt%) of the wires, as shown in Table 1, was determined by using an optical emission spectrometer, model PDA 70000 (Shimadzu, Kyoto, Japan).

Table 1.
Chemical composition (wt%) of the wires.
2.2. Microstructural Characterization of the Wires
For the acquisition of micrographs of the wires, a scanning electron microscope (SEM) Quanta 450 FEG–FEI was used The wire samples were embedded in Bakelite, ground from 100 to 1200 mesh and polished with diamond paste from 3 to 1 μ. The samples were sprayed with alcohol and blow dried. They were then etched with 2% Nital to reveal their microstructure. The samples were evaluated close to the external faces of the wires.
2.3. Electrochemical Tests
For the electrochemical tests, samples with an area of approximately 42 mm2 (surfaces of the wires) were used. ASTM G1-03, Standard Practice for Preparing, Cleaning, and Evaluating Corrosion and Test Specimens, ASTM, International, West Conshohocken PA, 2011 were used. The samples were embedded in epoxy resin, ground from 100 to 600 mesh, sprayed with alcohol and blow-dried. An enamel was used to prevent crevice corrosion between the resin and the sample. For the corrosion tests, a conventional three-electrode cell was used. The working electrode was the wire samples, the counter electrode was a platinum plate and the reference electrode used was an Ag(s)/AgCl(s)/Cl-(aq)KCl electrode. All tests were performed in triplicate to ensure repeatability. The equipment used was a potentiostat model PGSTAT30 (Autolab, Methrom-Eco Chemie) connected to a computer by the software NOVA 2.1. The polarization curves were scanned from −0.1 V to 2.0 V from OCP at a rate of 1 mV/s. When the current density reached 1 mA, the tests ended. The electrolyte was an aqueous solution of 3.5% NaCl and CO2 bubbling (99.99 purity) at a flow rate of 1 × 10⁻⁴ m³/s. The solution was deaerated with N2 before the tests. The corrosion tests were conducted at room temperature and 80 °C [11]. A different test condition was used for each wire, as shown in Table 2. From here on, wires, A, B and C are named as spheroidized (SC), lamellar (LC), and discontinuous (DC) structured, respectively. These are classified according to the specific presented microstructure in the material that a local oil company supplied.
Table 2.
Conditions of the experiments.
2.4. Raman Spectroscopy
Raman spectroscopy was performed using Witec Alpha 300 equipment, grating of 600 grooves/mm. Excitation was achieved with a 532 nm wavelength laser. The sample utilized for this characterization technique was the one that presented the most severe corrosion situation. The Raman spectral range reading was from 200 to 2000 cm−1 since the main oxides found in the previously evaluated databases were in this range.
3. Results
3.1. Characterization of the Cementite of the Wires
Figure 2 shows three different types of microstructure at the cross-section of each sample. In Figure 2a, the micrograph of wire A can be seen. It is possible to visualize the presence of globular cementite and discontinuous pearlite (brittle). This wire was called spheroidized cementite (SC). A lamellar pearlite microstructure can be seen in Figure 2b. This wire was called lamellar cementite (LC). Figure 2c shows a discontinuous cementite microstructure. This wire was called discontinuous cementite (DS).
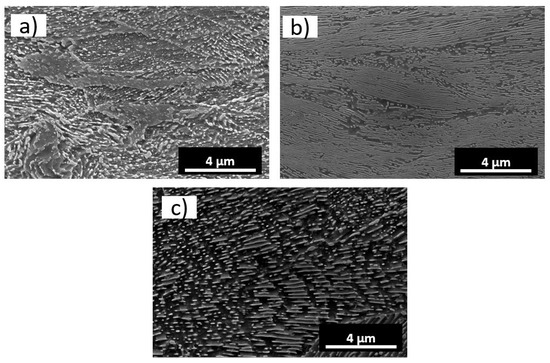
Figure 2.
Microstructure of (a) spheroidized cementite, (b) lamellar cementite and (c) discontinuous cementite.
3.2. Electrochemical Tests
The graphs with the respective open circuit polarization (OCP) and potentiodynamic polarization curves obtained from the electrochemical tests are presented in Figure 3, Figure 4, Figure 5, Figure 6, Figure 7 and Figure 8. These experiments were carried out with the three samples (SC, LP, and DP). NaCl solutions (3.5%) mixed with and without CO2 were used in both specimens. Tests were performed at room temperature and at 80 °C. During the tests, the pH was recorded by means of a pH meter, obtaining the following values for the respective solutions: saturated with CO2 at 80 °C (pH 3–4); saturated with CO2 at room temperature (pH 4–5); aerated and at room temperature (pH 6–7).
3.2.1. Electrochemical Tests for the SC Wire
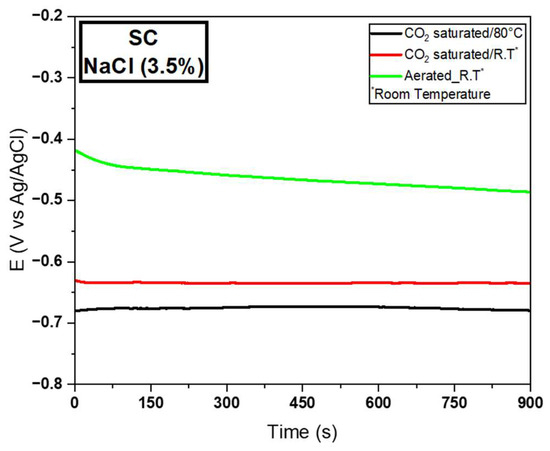
Figure 3.
OCP curves for SC wire in the aqueous solution of 3.5% NaCl saturated with CO2 at 80 °C, saturated CO2 at room temperature (23 °C), and aerated at room temperature (23 °C).
Figure 3.
OCP curves for SC wire in the aqueous solution of 3.5% NaCl saturated with CO2 at 80 °C, saturated CO2 at room temperature (23 °C), and aerated at room temperature (23 °C).
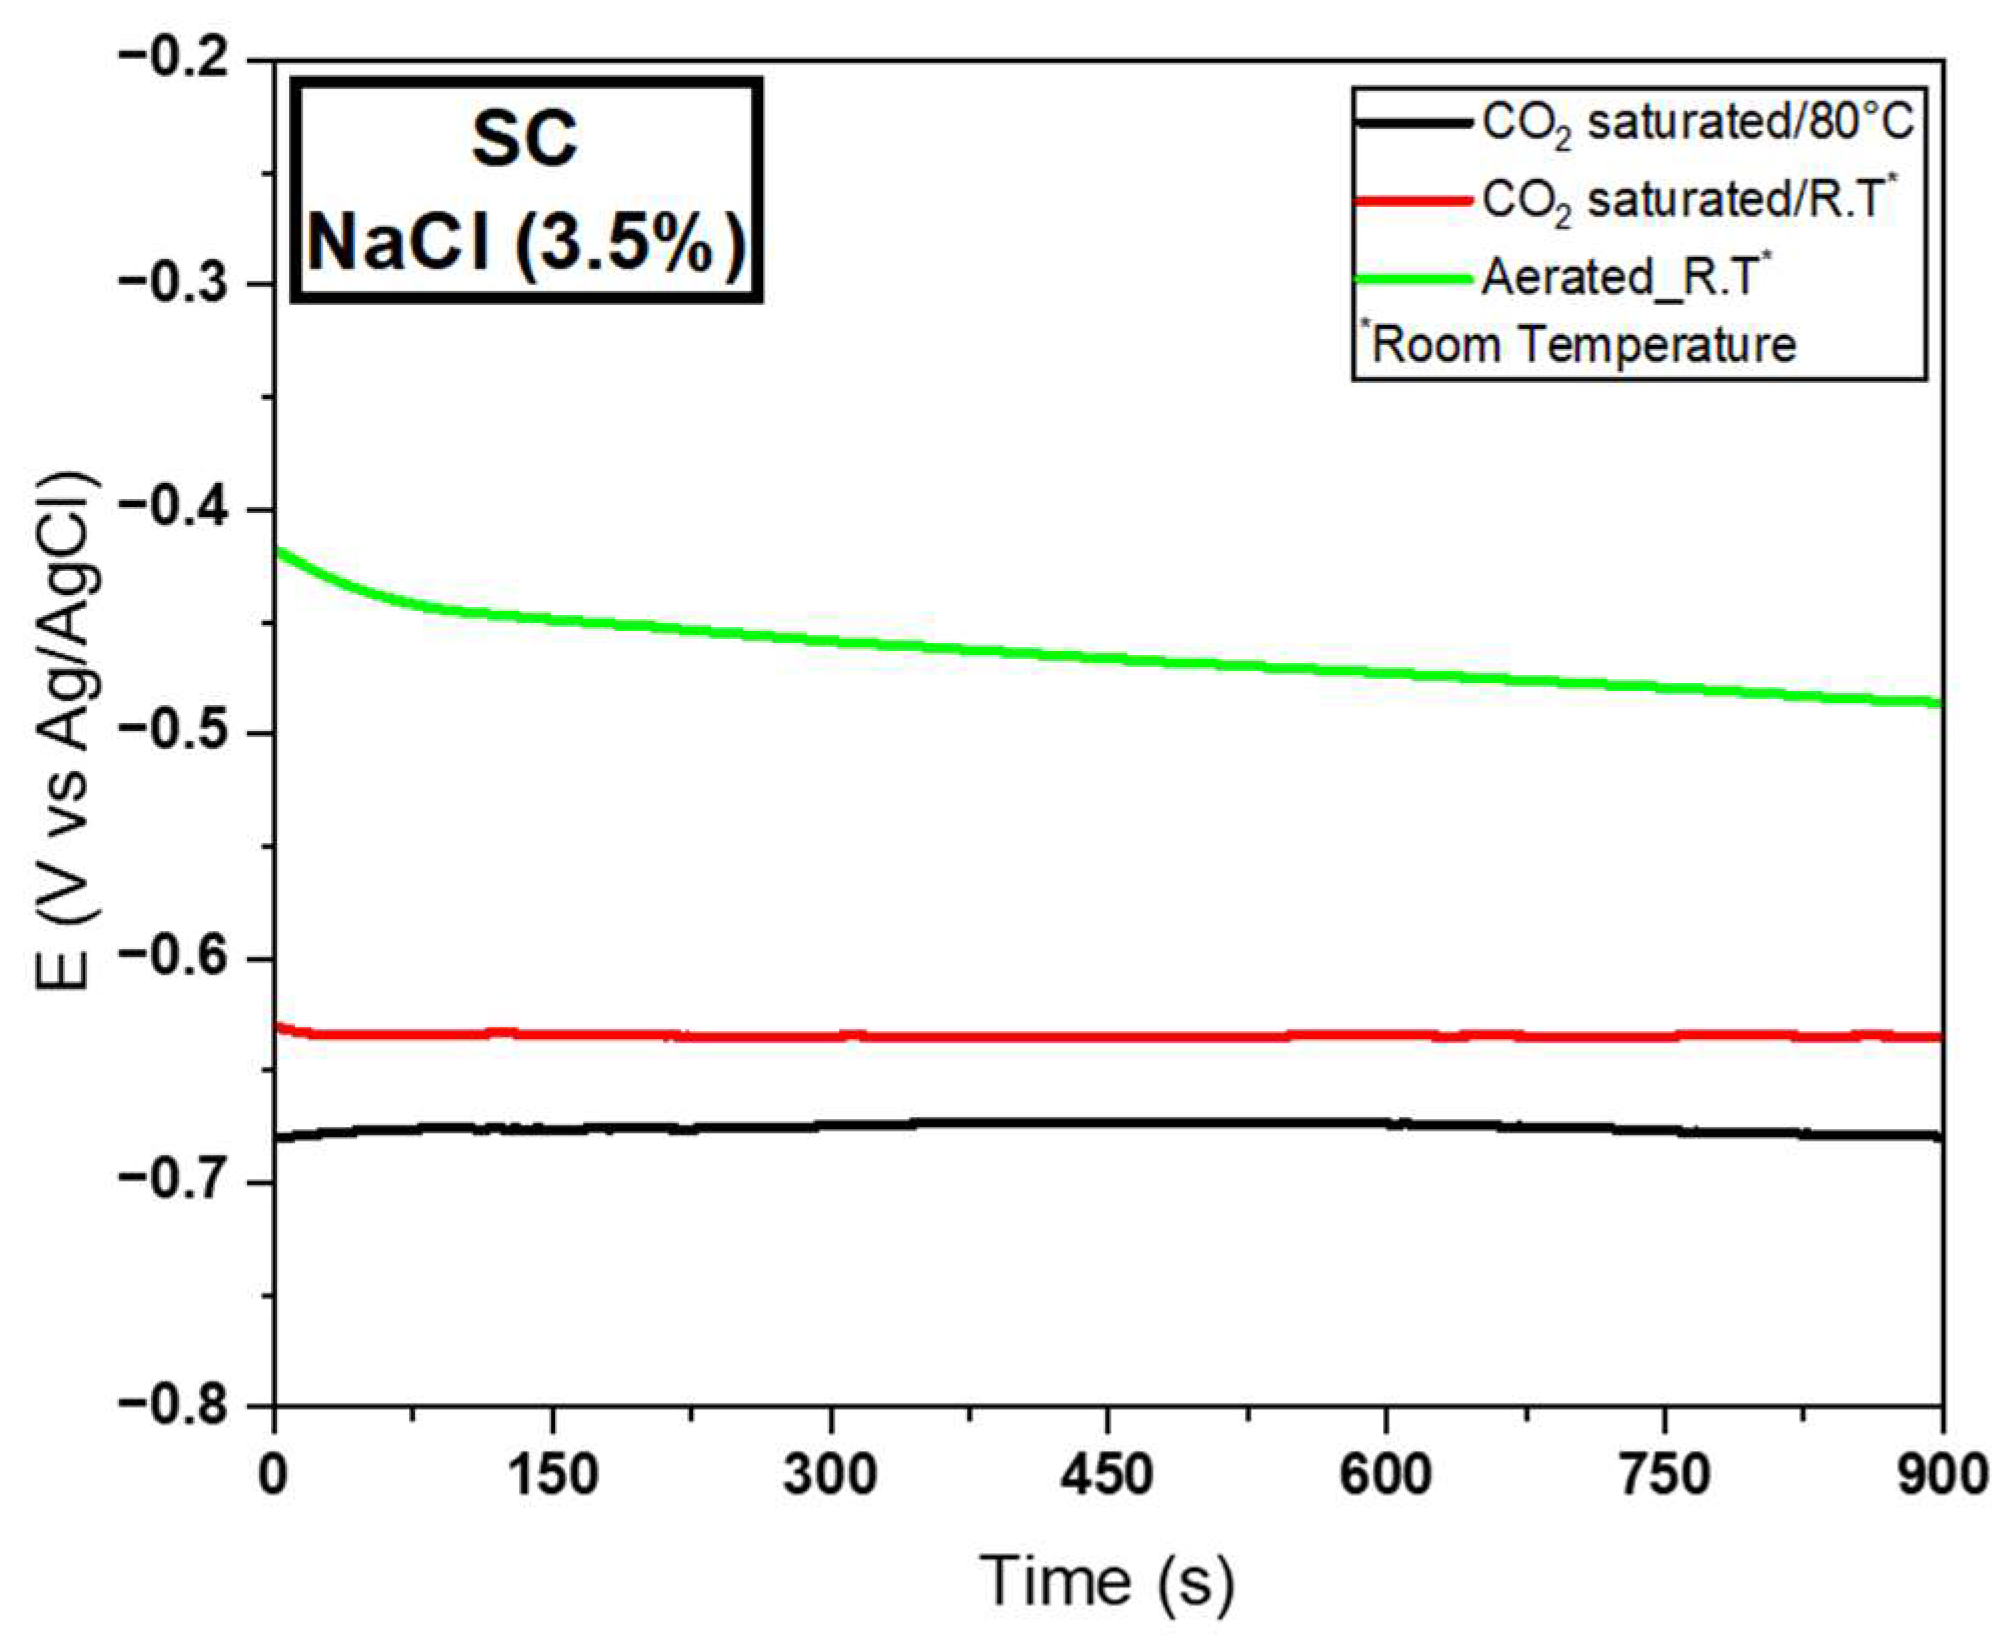
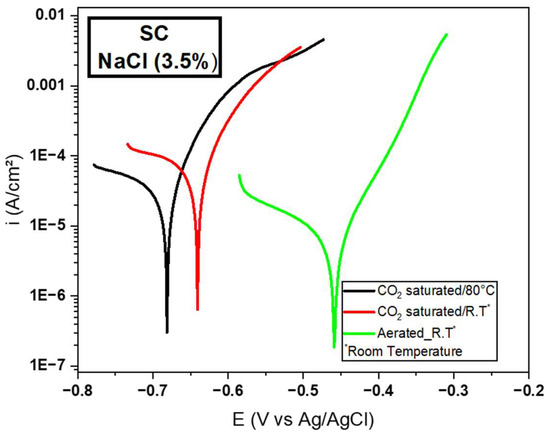
Figure 4.
Potentiodynamic polarization curves for SC wire in the aqueous solution of 3.5% NaCl saturated with CO2 at 80 °C, saturated CO2 at room temperature (23 °C), and aerated at room temperature (23 °C).
Figure 4.
Potentiodynamic polarization curves for SC wire in the aqueous solution of 3.5% NaCl saturated with CO2 at 80 °C, saturated CO2 at room temperature (23 °C), and aerated at room temperature (23 °C).
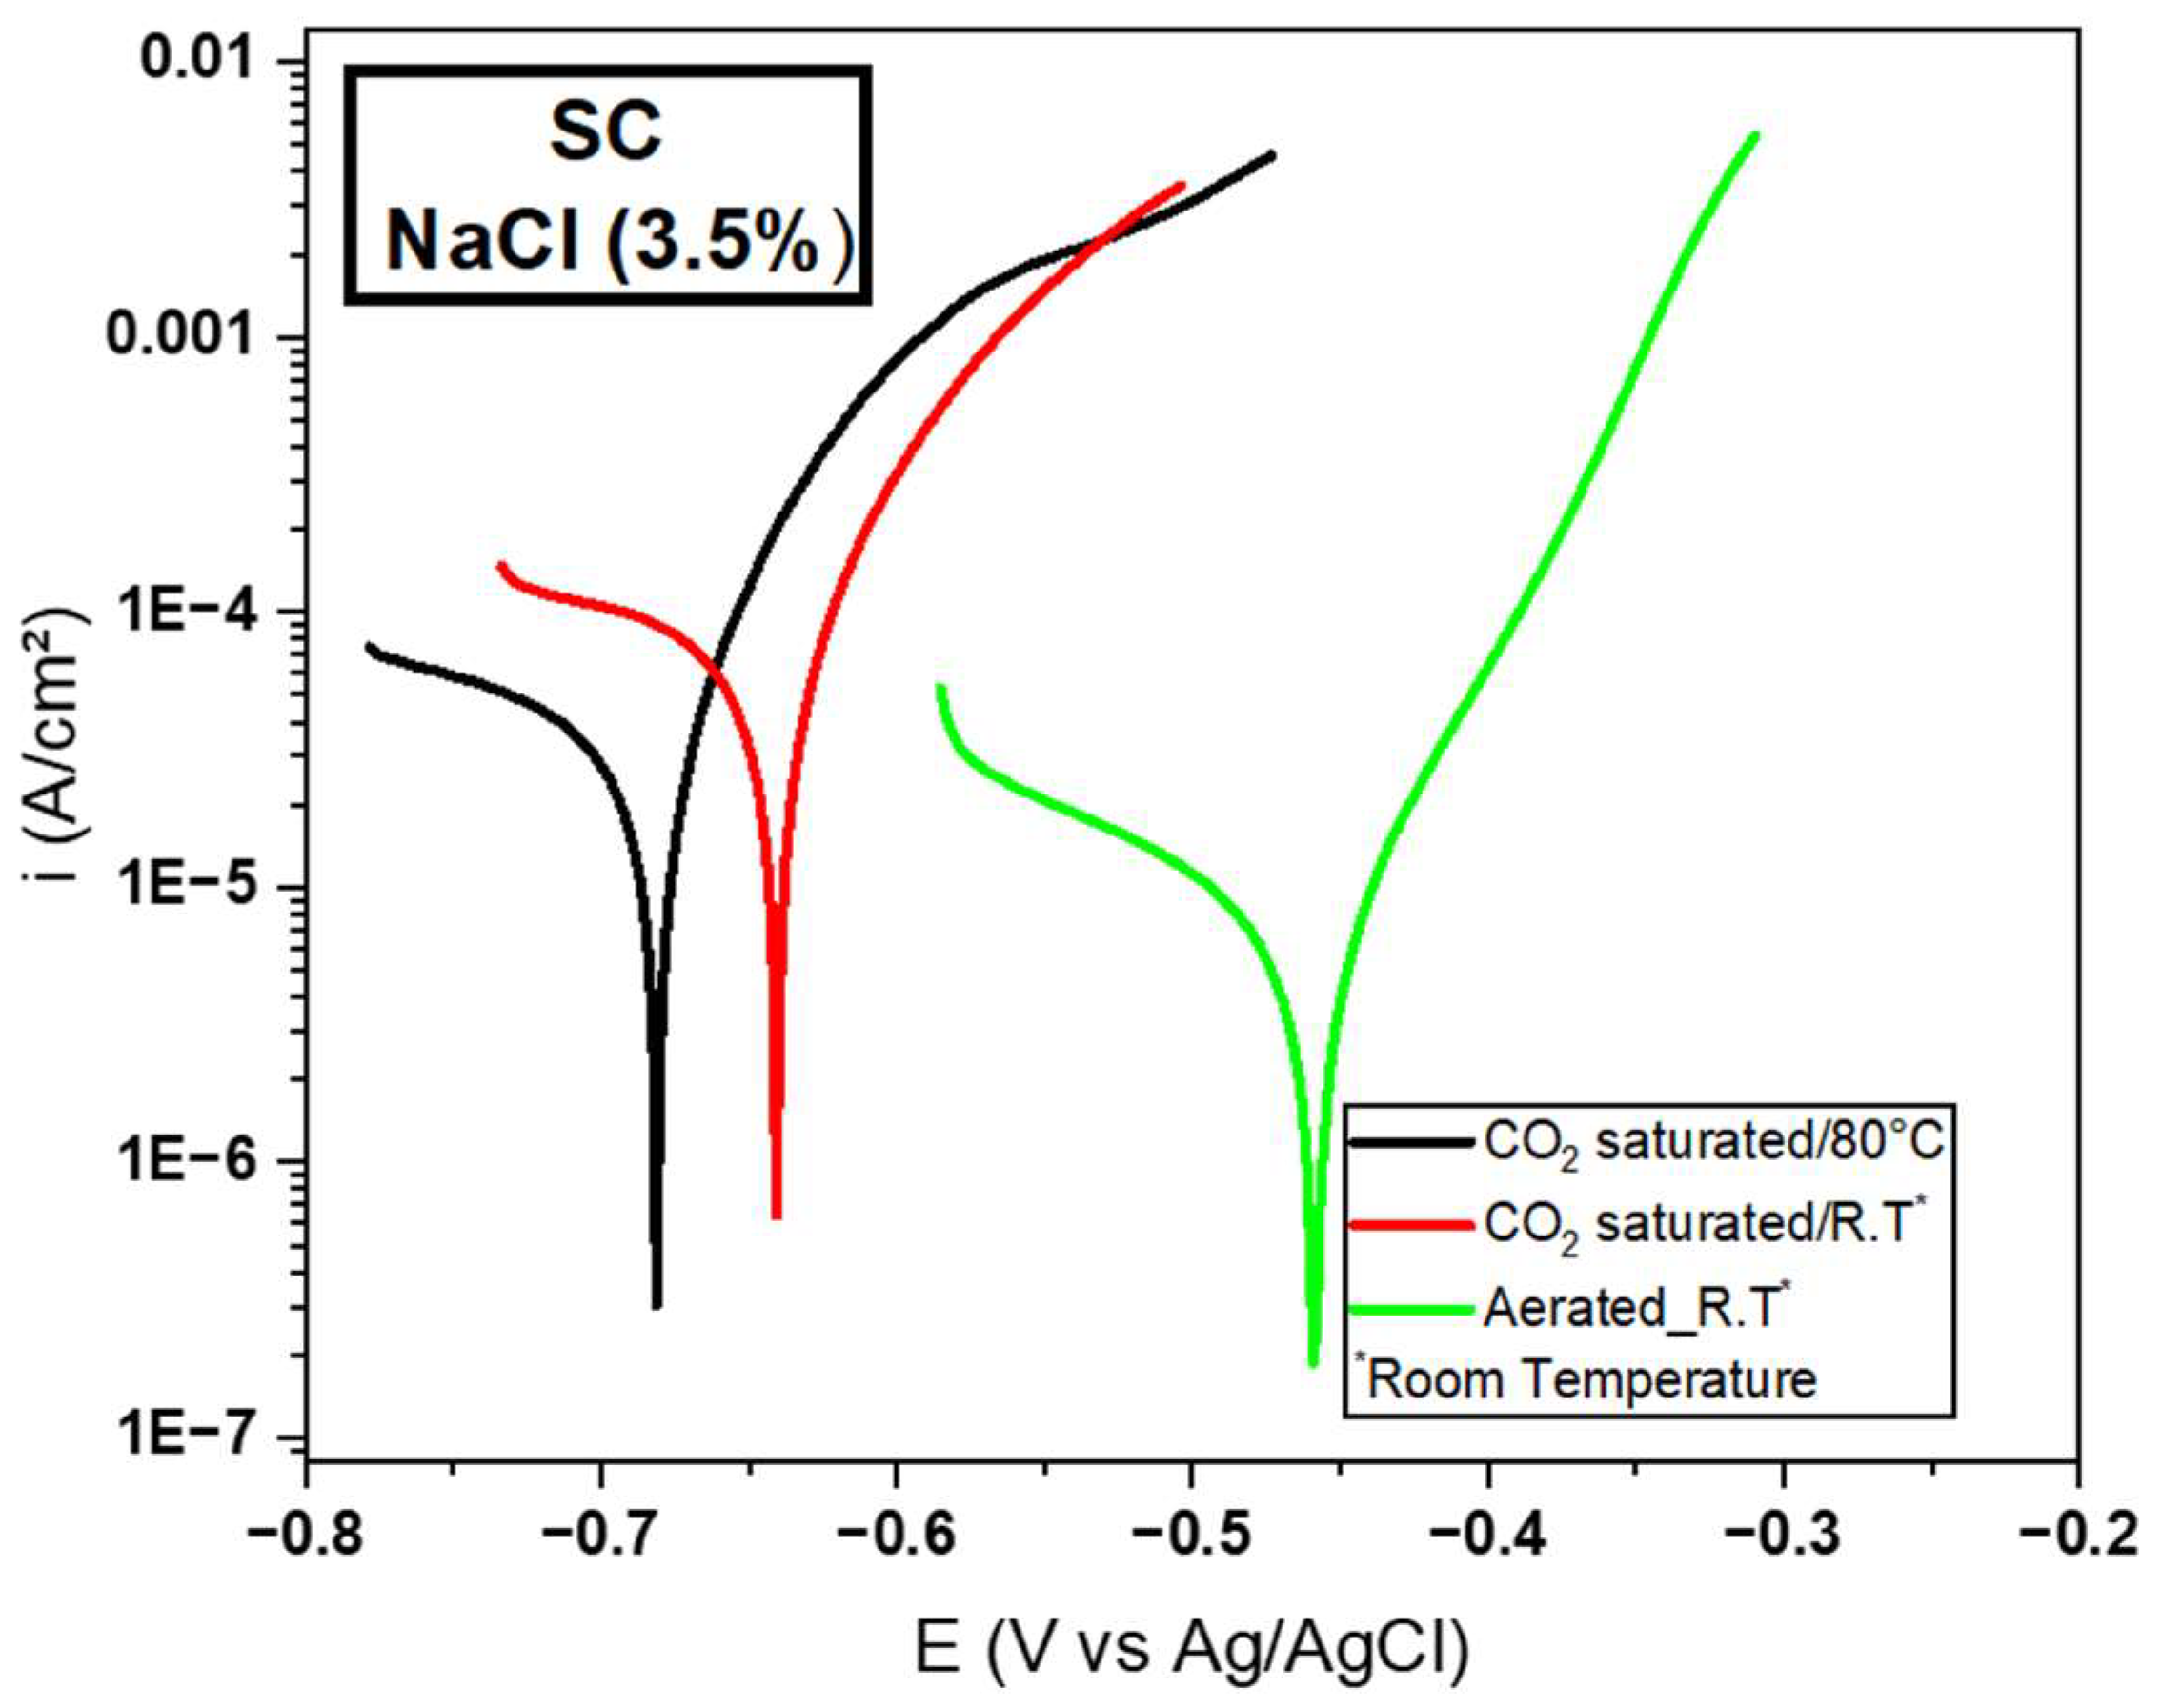
Figure 3 shows that the time established for the OCP was 900 s (15 min), the same as used for the other tests, due to the stabilization of the potential applied to the material. There was great similarity between the OCP’s of the SC in the condition in which there was saturated CO2. However, this same potential was not close in the absence of CO2 condition. This fact demonstrates the greater sensitivity of the SC sample to carbon dioxide. On the other hand, using a different temperature from the ambient one did not show a great difference when the sample was submitted to 80 °C.
Figure 4 shows the potentiodynamic polarization curves for SC microstructure wire. In this graph, the samples in the CO2 medium showed a higher anode current density (ACD), showing that the samples were more susceptible to corrosion. A difference was noticed between the corrosion resistances for each sample since, on the y-axis, it is possible to identify the current density of the specimens by the Tafel extrapolation method. These ACDs were very similar between the samples with saturated CO2 at 80 °C and room temperature, while the aerated sample at room temperature showed lower ACD. Regarding the two saturated CO2 specimens, this effect of low corrosion resistance is due to the acidifying power generated by CO2, forming H2CO3 when in contact with water in the electrolyte [12]. This fact can be proven by the pH reduction measured in this solution, reaching values between 3 and 4.
CO2 corrosion in steels can contribute to forming FeCO3 (iron carbonate or siderite), significantly reducing corrosion rates. This occurs when the concentrations of Fe2+ and CO32− ions exceed the solubility limit for the evaluated solution [13]. This characteristic can affect the material, depending on its morphology. This mechanism can be explained because, once CO2 is dissolved in water, carbonic acid is formed, and it is harmful to carbon steel. Equations (1a)–(1e) detail these reactions [14]:
CO2 + H2O ↔ H2CO3
2H2CO3 + 2e− → H2 + 2HCO3−
2HCO3 + 2e− → H2 + 2CO32−
2H+ + 2e− → H2
Fe → Fe2+ + 2e−
Equation (1a) (oxy-reduction) and Equations (1b)–(1d) are cathodic reactions (reduction) and Equation (1e) is anodic (oxidized). The reaction in Equation (2) helps us to understand the mechanism of iron carbonate formation, because when the Fe2+ and CO32− ions exceed the solubility limit, FeCO3 is formed [15,16]:
Fe2+ + CO32− → FeCO3
Some authors affirm the existing correlation between temperature increase and susceptibility to siderite formation, depending on the morphology [17,18,19].
3.2.2. Electrochemical Tests for the LC Wire
Figure 5 and Figure 6 represent the OCP and potentiodynamic polarization tests for the LC wire in an aqueous medium of 3.5% NaCl saturated with CO2 at 80 °C, saturated with CO2 at room temperature, and aerated at room temperature.
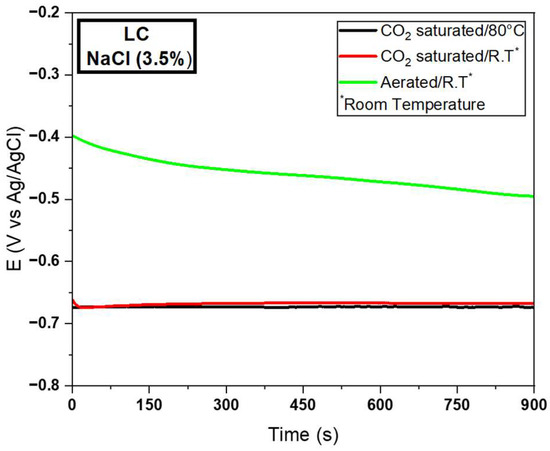
Figure 5.
OCP curves for LC wire in aqueous solution of 3.5% NaCl with saturated CO2 at 80 °C, saturated CO2 at room temperature (23 °C) and aerated at room temperature (23 °C).
Figure 5.
OCP curves for LC wire in aqueous solution of 3.5% NaCl with saturated CO2 at 80 °C, saturated CO2 at room temperature (23 °C) and aerated at room temperature (23 °C).
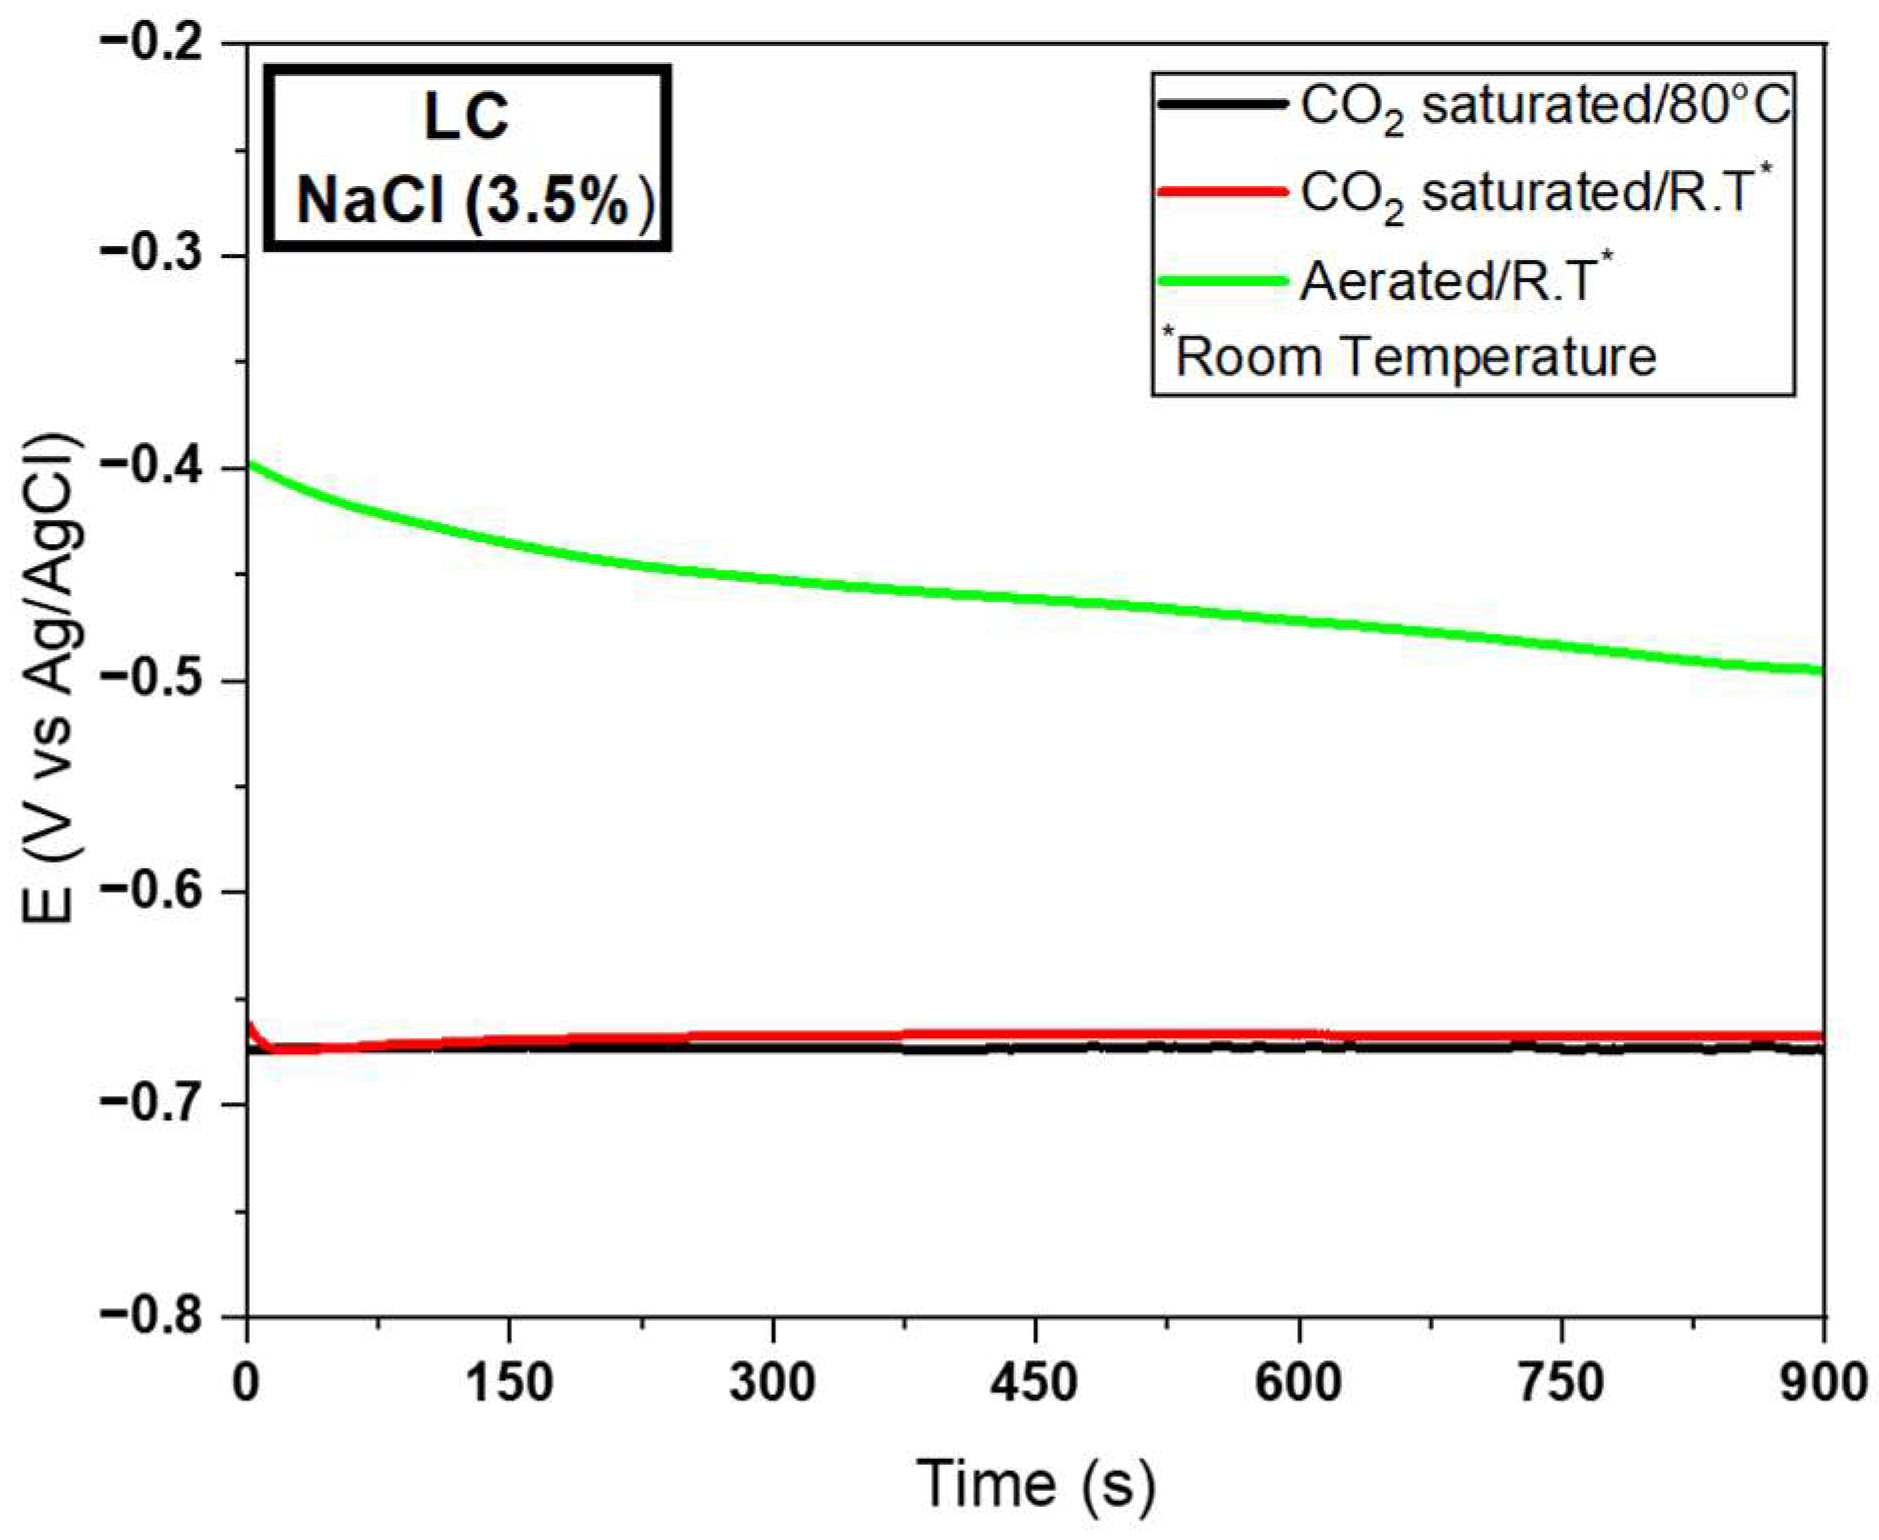
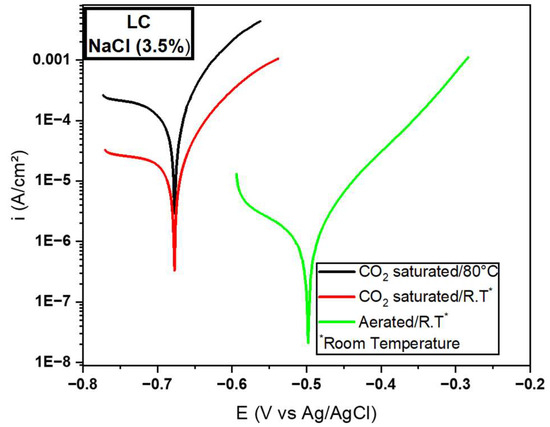
Figure 6.
Potentiodynamic polarization curves for LC wire in aqueous solution of 3.5% NaCl with saturated CO2 at 80 °C, saturated CO2 at room temperature (23 °C) and aerated at room temperature (23 °C).
Figure 6.
Potentiodynamic polarization curves for LC wire in aqueous solution of 3.5% NaCl with saturated CO2 at 80 °C, saturated CO2 at room temperature (23 °C) and aerated at room temperature (23 °C).

Figure 5 indicates that the LC wire OCP showed very similar results between the specimens submitted to CO2, demonstrating once again that the influence of temperature is not very important for the established corrosion conditions when it comes to the corrosion potential of the material. However, the OCP values were less negative when carbon dioxide was removed.
In Figure 6, which establishes the result for the polarization curves, the established difference between the current densities is denoted. Among the specimens with the presence of carbon dioxide, the sample showed greater susceptibility to corrosion. The sample tested in the presence of a temperature different from room temperature proved to be the most prone to corrosion, since its current density was higher. In turn, the aerated sample at room temperature was the one that showed the lowest susceptibility to corrosion.
3.2.3. Electrochemical Tests for the DC Wire
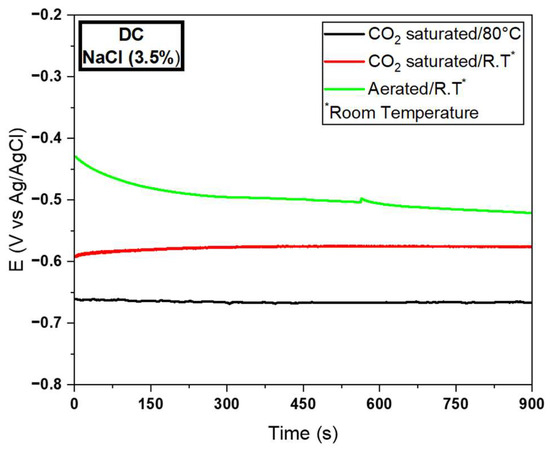
Figure 7.
OCP curves for the DC wire in aqueous solution of 3.5% NaCl with saturated CO2 at 80 °C, saturated CO2 at room temperature (23 °C) and aerated at room temperature (23 °C).
Figure 7.
OCP curves for the DC wire in aqueous solution of 3.5% NaCl with saturated CO2 at 80 °C, saturated CO2 at room temperature (23 °C) and aerated at room temperature (23 °C).

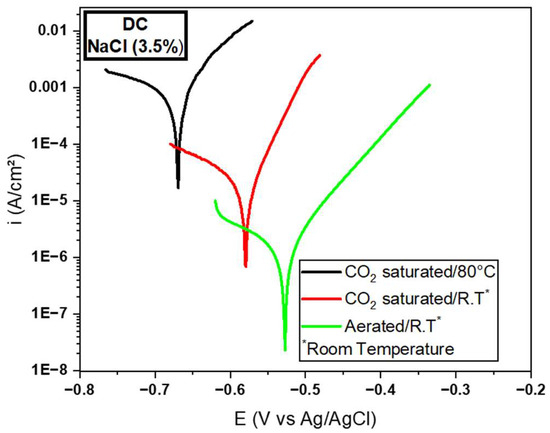
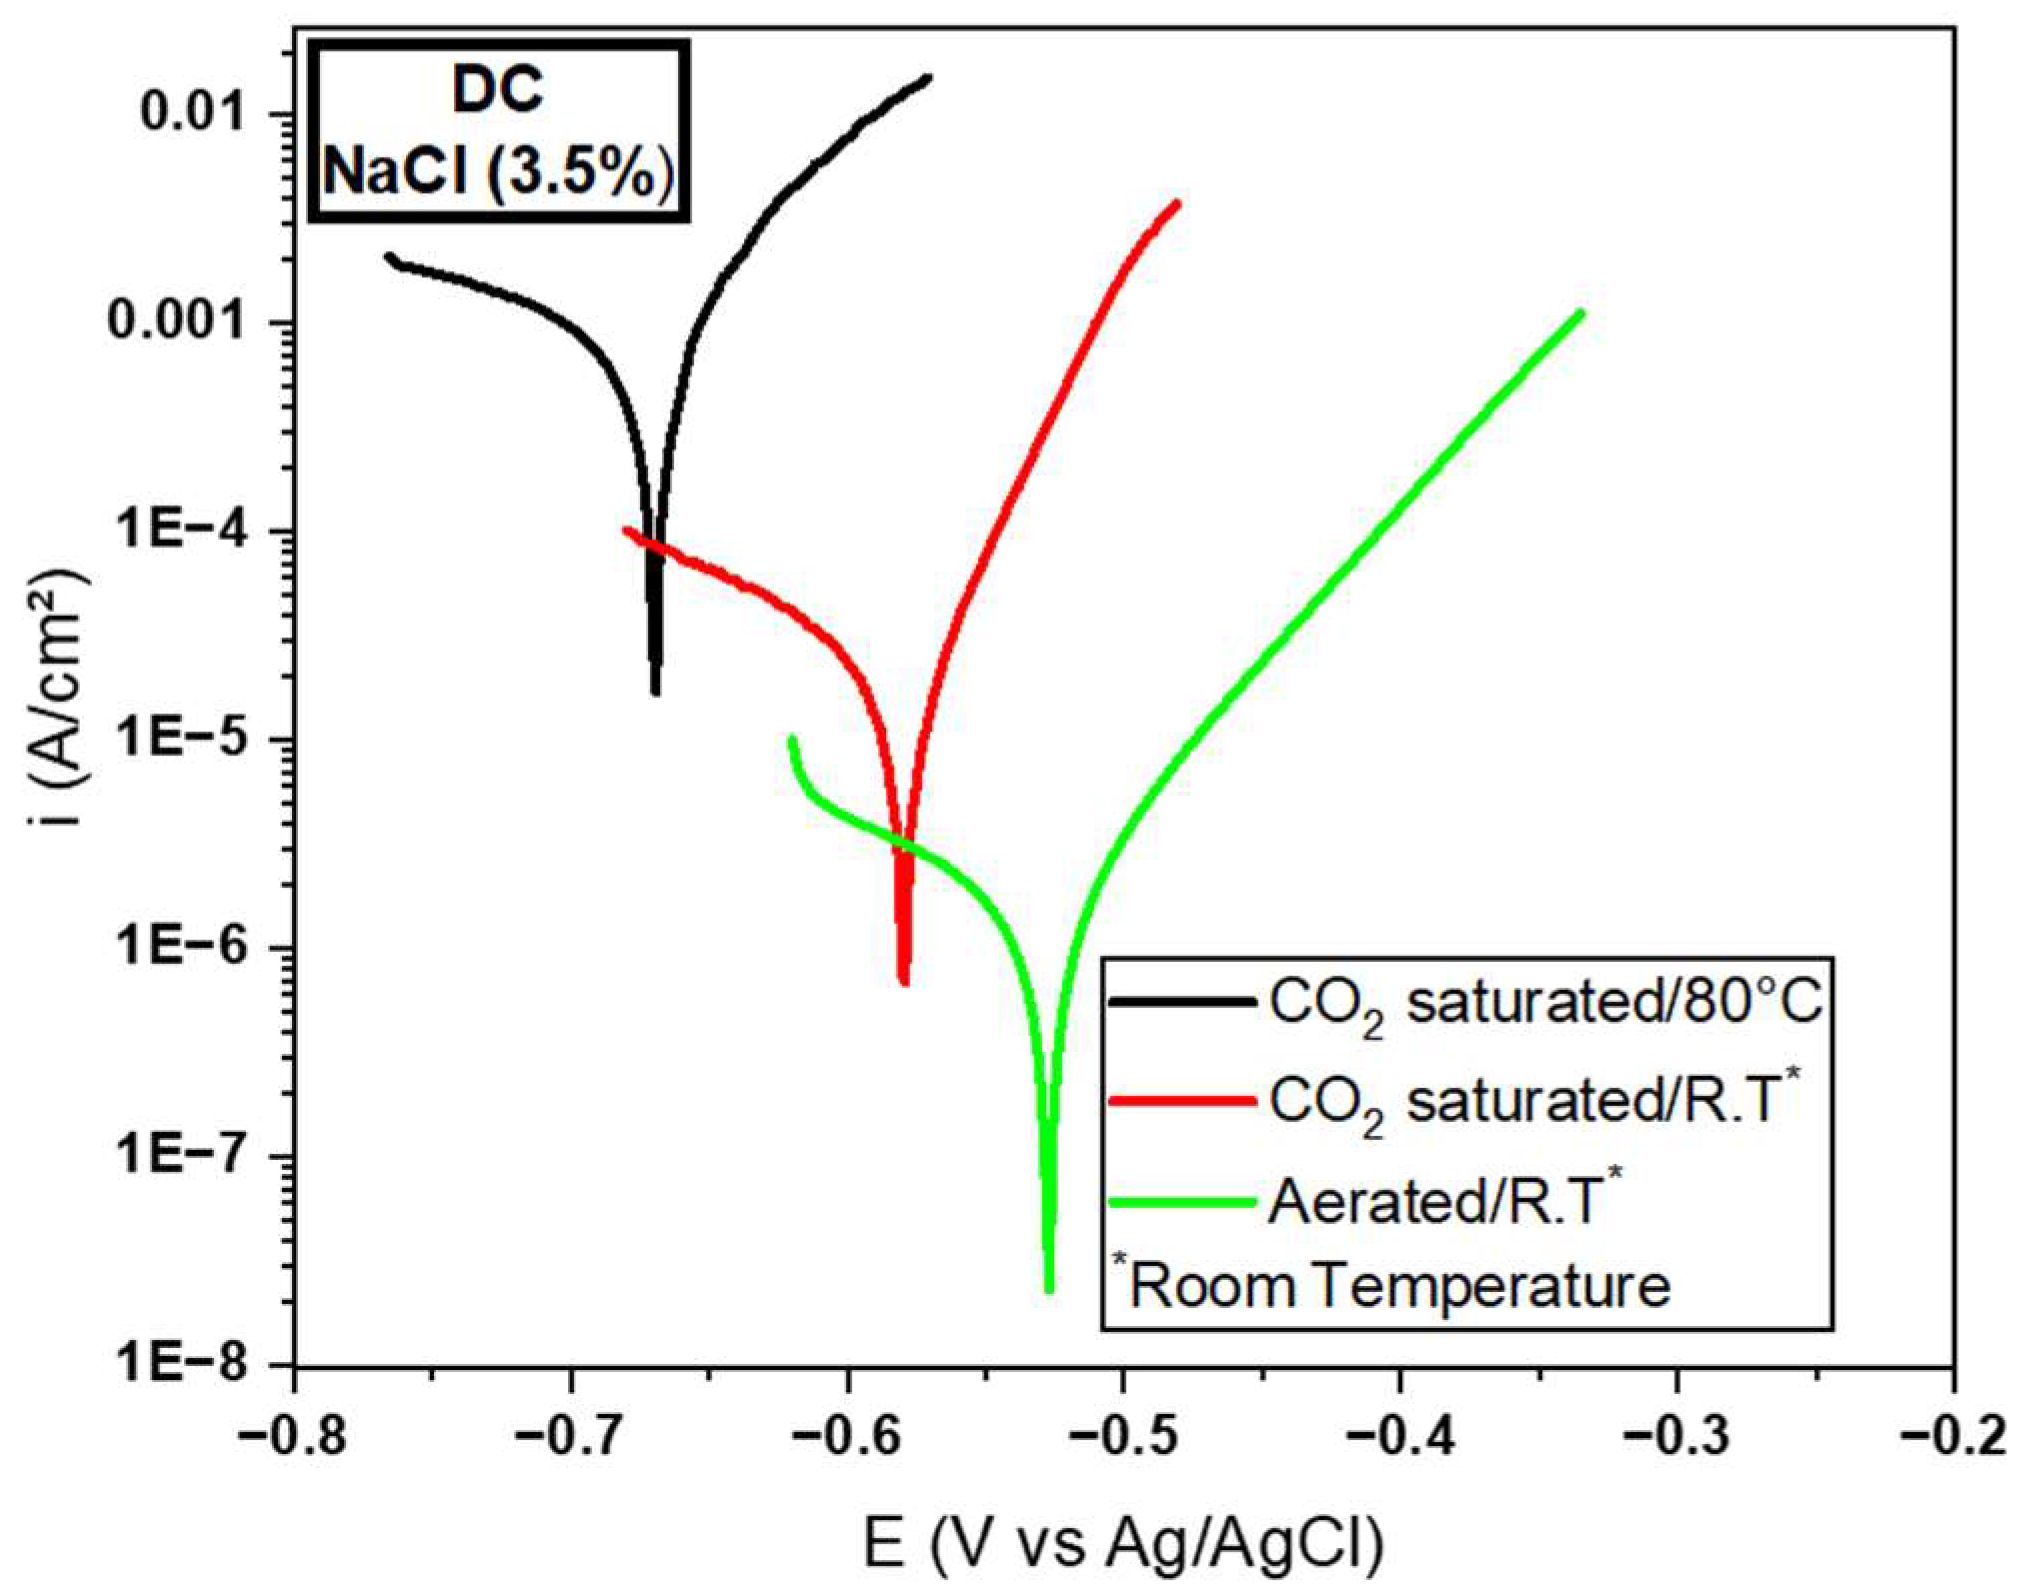
Figure 8.
Potentiodynamic polarization curves for the DC wire in an aqueous solution of 3.5% NaCl with saturated CO2 at 80 °C, saturated CO2 at room temperature (23 °C) and aerated at room temperature (23 °C).
Figure 8.
Potentiodynamic polarization curves for the DC wire in an aqueous solution of 3.5% NaCl with saturated CO2 at 80 °C, saturated CO2 at room temperature (23 °C) and aerated at room temperature (23 °C).
Unlike previous samples, in which there was considerable similarity between the OCP results for those saturated with CO2, the DC wire (Figure 7), there was not a big difference. For this specimen, it is believed, based on the results presented, that the temperature added greater corrosion capacity, since its OCP was more negative. In a corrosion process without the formation of a protective film on the surface, the increase in temperature increases the corrosion rate [12], which directly applies to the described case.
The current densities are indicated in Figure 8. Notably, the potential distance and current densities of the sample in saturated CO2 at room temperature are quite similar to those of the other solutions.
3.3. Characterization of the Corrosion Product by Raman Spectroscopy
The analysis of the surfaces of specimens submitted to a corrosive environment is intended to evaluate possible oxides that form on the surface of the samples. Characterization techniques such as SEM (scanning electron microscopy), EDS (energy dispersion X-ray spectroscopy) and Raman spectroscopy are the main methodologies used to obtain information on layers deposited on materials, once subjected to adverse conditions.
The technique used in this study was Raman spectroscopy. It was intended to investigate the formation of oxides on the surface of the material that can help reduce the corrosive process, simulating a passive layer. The main films that can form on the studied samples, in this study and in conditions similar to the corrosion evaluated here, are FeCO3, Fe3O4, and Fe2O3 [20,21].
SC Sample in Aqueous NaCl Medium
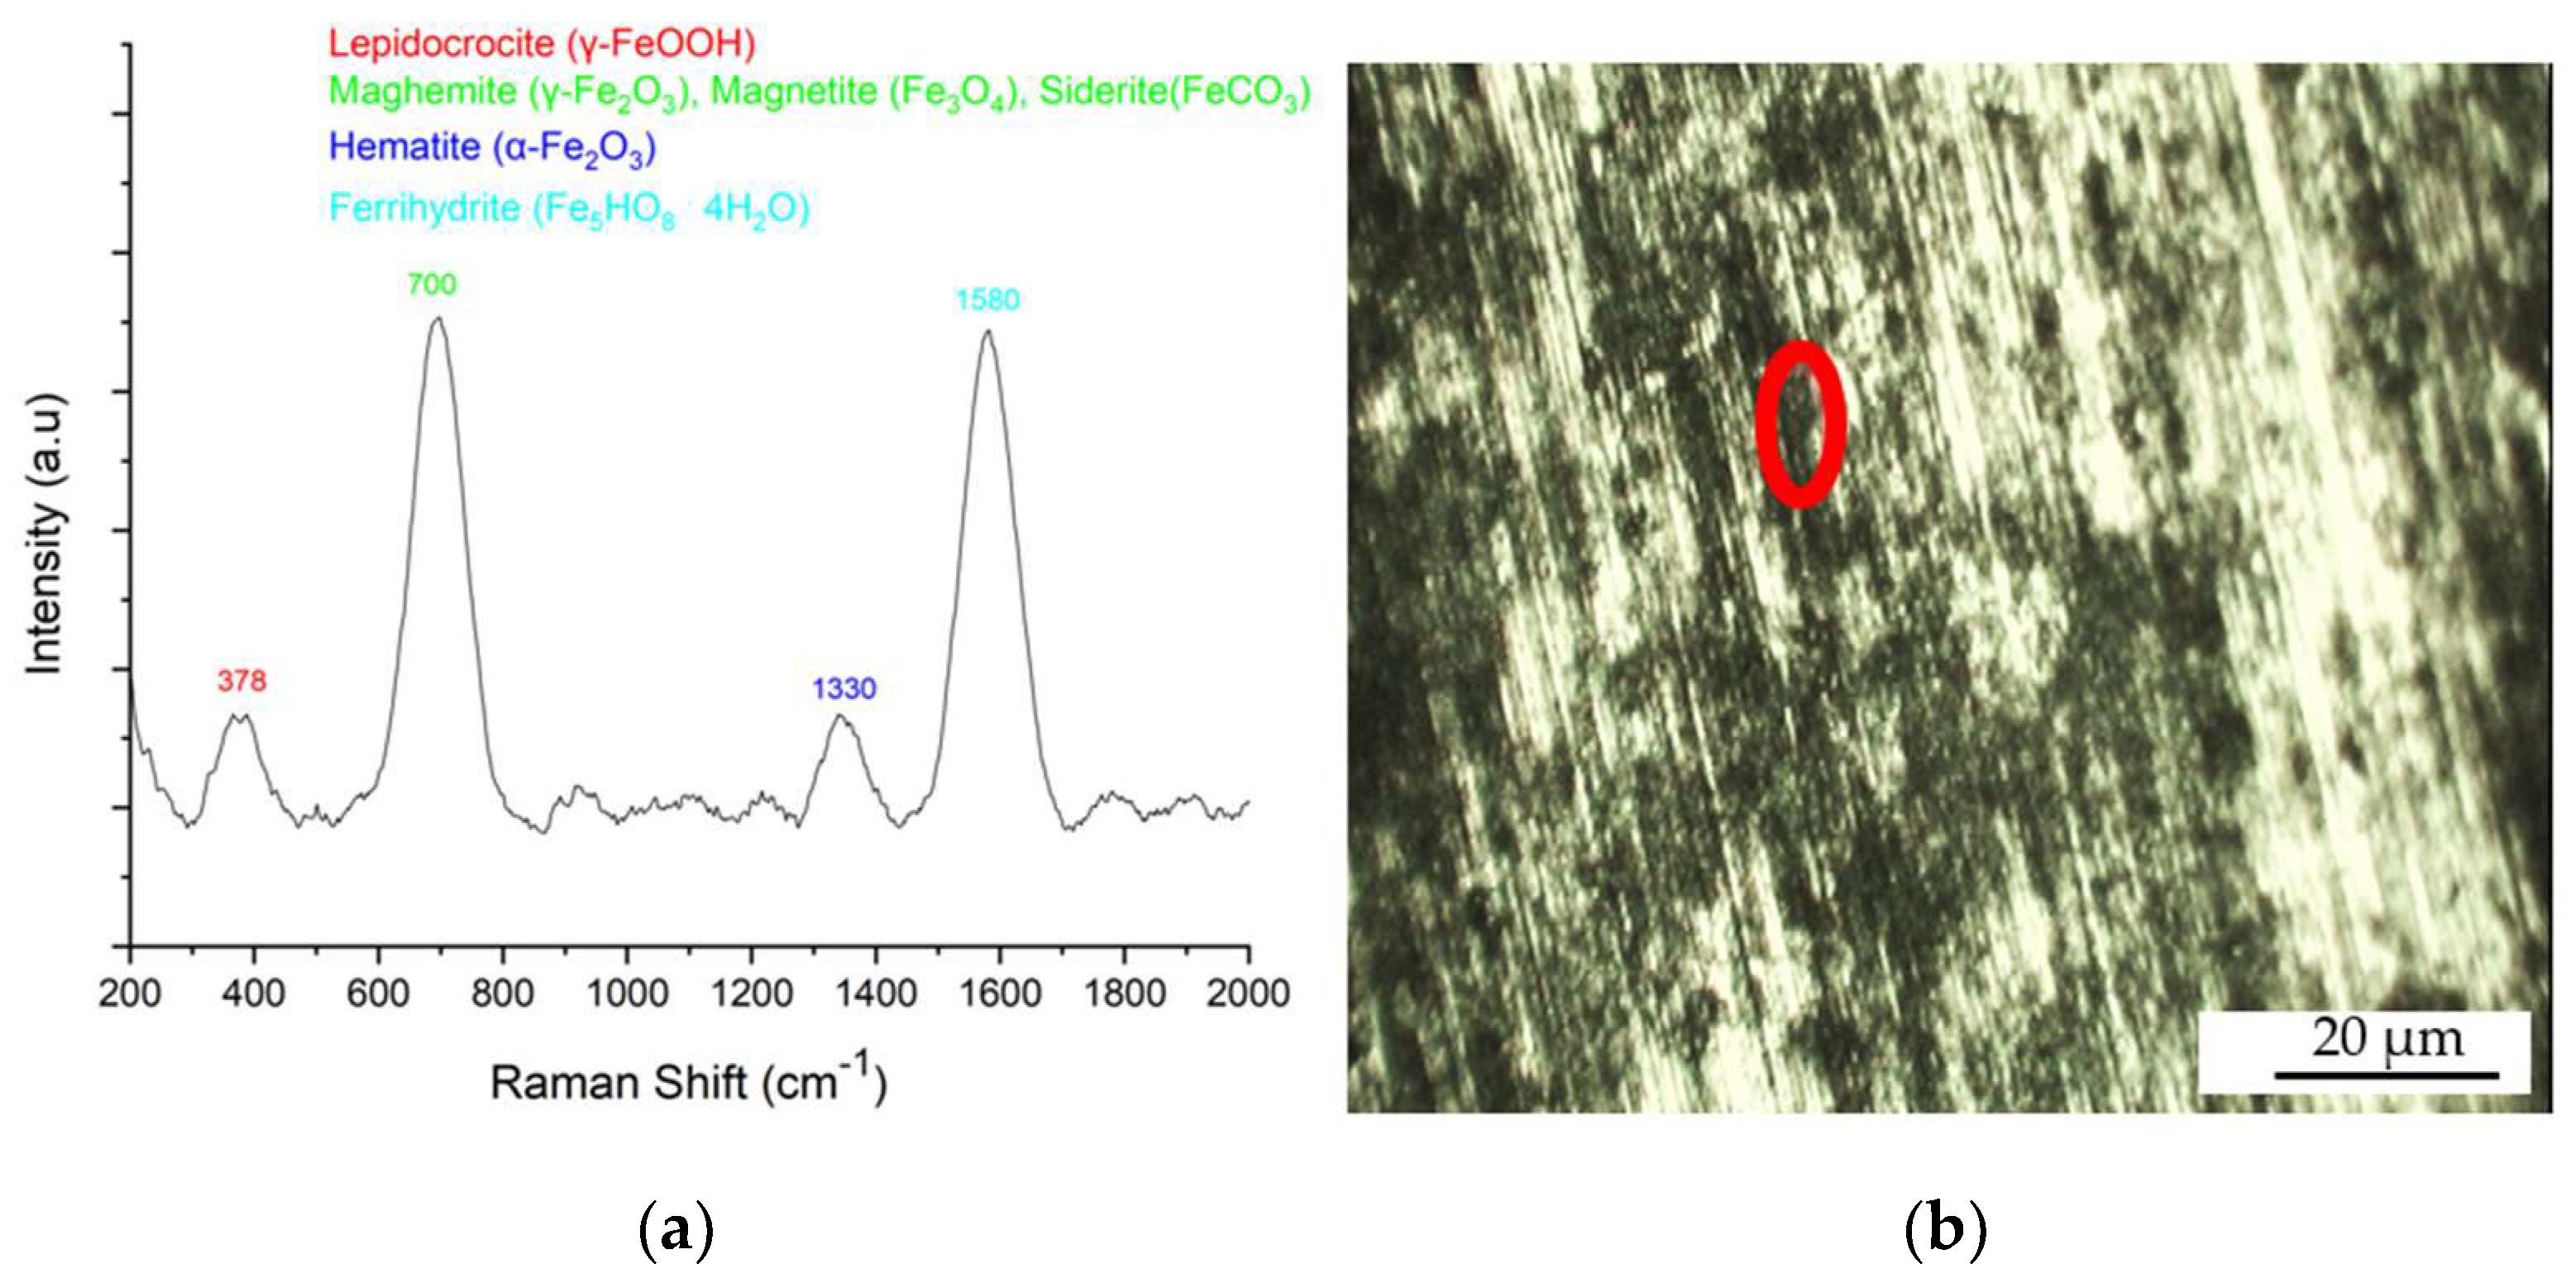
The evaluation started with the SC sample being subjected to the most severe corrosion conditions when using the NaCl solution. Figure 9b shows black regions where the material has suffered corrosion. The red circle represents the point where the Raman technique measured the corrosion. In this region, lepidocrocite, maghemite, magnetite, siderite, hematite, and ferrihydrite were found. Among these oxides, the acid salt FeCO3 (siderite) stands out, obtained by the reaction of carbon dioxide with Fe+2 ions [22] (Figure 9a) dissolved in the aqueous solution. Normally, those detected oxides appeared as dark spots on the sample’s surface, and resulted from the reaction between Fe ions and oxygen in the water.
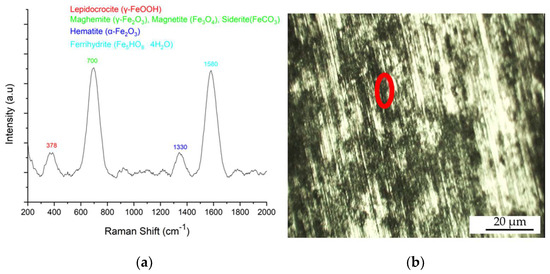
Figure 9.
SC sample (immersed in 3.5% NaCl aqueous solution with saturated CO2 at 80° C): (a) Raman spectroscopy characteristic peaks for generalized corrosion and (b) micrograph of the sample with emphasis on the analyzed region.
Figure 10a refers to capturing the Raman shift in a lighter sample region. This was called the area without apparent corrosion. In this region, goethite and ferroxyite appeared, oxides that were not detected in Figure 9. The presence of siderite peaks was not detected, which leads to the assumption that this oxide does not necessarily appear as a protective layer from non-corroded regions, as identified by some authors [12].
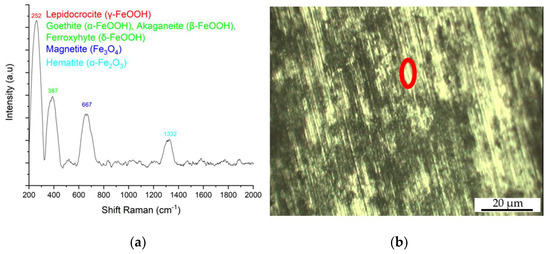
Figure 10.
SC sample (immersed in 3.5% NaCl aqueous solution with saturated CO2 at 80 °C): (a) characteristic peaks of Raman spectroscopy for the area without apparent corrosion and (b) micrograph of the sample with emphasis on the analyzed region.
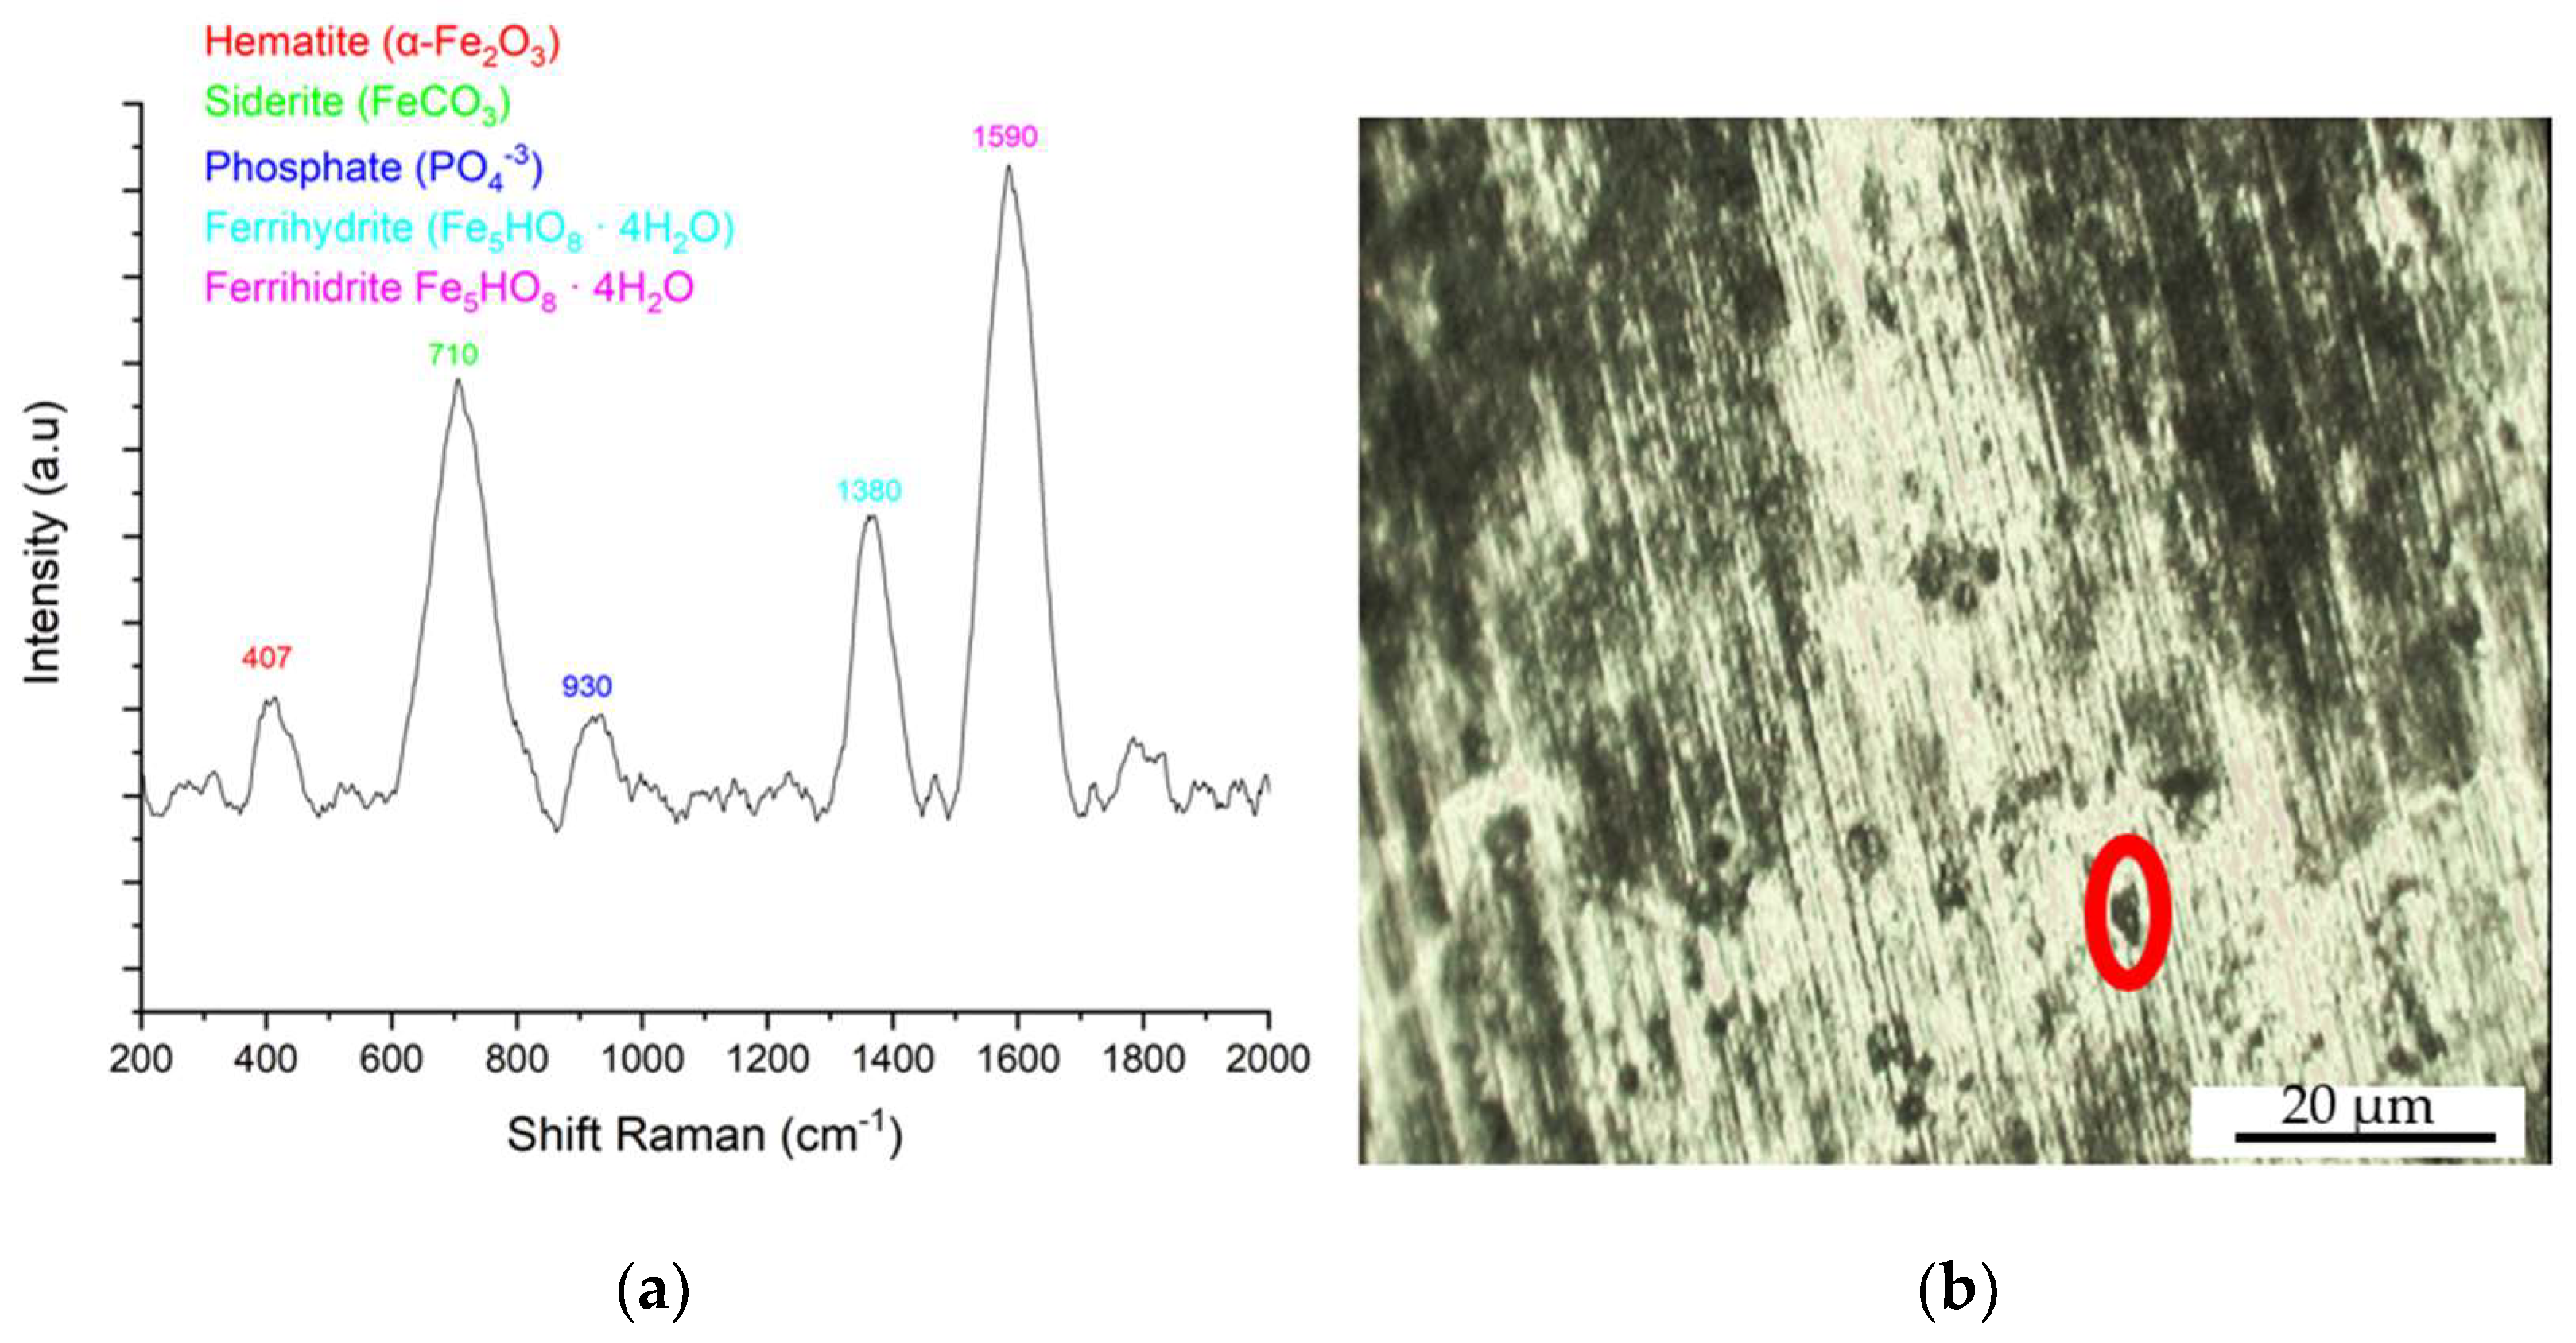
The spectrum in Figure 11 was captured in a region called localized corrosion. Their characteristic spectra identified oxides and salt (siderite), as in other regions of the same sample. However, the Raman shift for phosphate (PO4−3) is highlighted, which has not previously been identified, and is probably the result of phosphate in the chemical composition of the material. This ion was possibly formed by the presence of phosphorus in the composition of the evaluated steels. However, no published studies were found that properly discussed the ratio of Raman peaks of phosphates in steels, having only its characteristic peak [23].
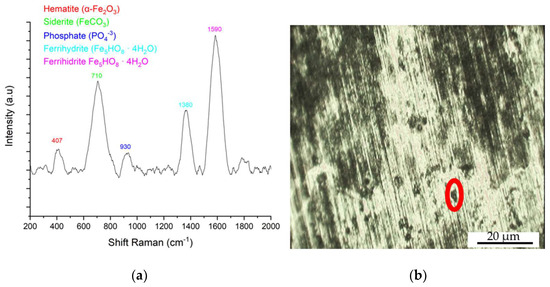
Figure 11.
SC sample (immersed in an aqueous solution of 3.5% NaCl with saturated CO2 at 80 °C): (a) characteristic peaks of Raman spectroscopy for the area with localized corrosion and (b) micrograph of the sample with emphasis on the analyzed region.
4. Discussion
Table 3 computes information about the electrochemical tests, calculating each sample’s mean, standard deviation, and condition according to the studied solutions. The standard deviation indicates how uniform the test results were, consisting of measuring the level of dispersion in the measurements. The value of Rp (resistance to polarization) is essentially calculated by the ratio of OCP to current density (I). The latter is obtained by the Tafel extrapolation method [24]. They are presented in the table and Figure 12.
Table 3.
Statistical data from the electrochemical tests in NaCl for the three samples in the three tested solutions (MD = mean and SD = standard deviation).
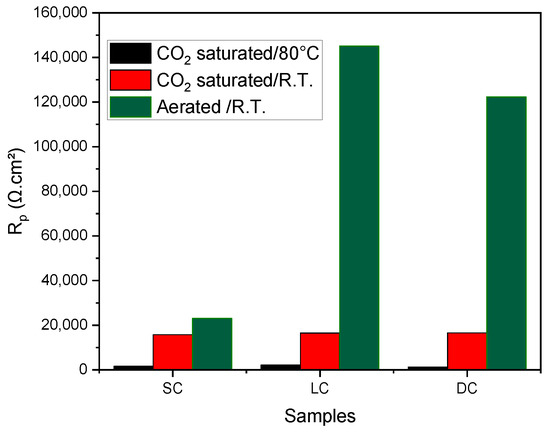
Figure 12.
Comparative values of Rp (resistance to polarization) that were calculated from the ratio of OCP and the current density of each sample in different environments.
From Table 3, a comparison can be made between the samples and their different electrolyte solutions. Comparing the results of Table 3 vertically(the different samples of steels in the same solution) shows the one that had the highest potential and current density performance.
In the solution with 3.5% NaCl with saturated CO2 and at a temperature of 80 °C, the three samples obtained very similar potentials, with the values varying only in the second decimal place. For the same electrolyte, a difference was observed between SC and DC wires, with the LC sample being more resistant to corrosion, since its current density obtained a lower result (greater difference than the comparison between SC and DC). Another observation to be made concerns the Rp’s between these two wires (see Figure 12).
Analyzing the 3.5% NaCl solution with saturated CO2 and at room temperature (23 °C), the most notable difference was shown between the LC and DC wires, dealing with the OCP of these materials under the previously mentioned conditions, obtaining a difference of almost one decimal place between the first and the second. Likewise, the current density values for these same samples proved to be more distant when comparing the LC sample with the SC one.
The medium with 3.5% NaCl aerated and at room temperature (23 °C) was generally a less aggressive medium of those evaluated. Fewer negative potentials were obtained for this medium, indicating greater resistance to corrosion by the material, emphasizing the LC wire. However, the SC sample reached higher current densities than the other samples. The LC and DC samples reached very similar results.
Analyzing the results based on the Rp (polarization resistance), it is observed that the LC sample showed more resistance to corrosion, being less degraded, while the DC sample showed less resistance in solution 1. For solution 2, the DC obtained a high result for Rp, if compared to the SC sample, the latter being the sample that obtained the lowest resistance to corrosion. The least aggressive solution for the samples was solution 3.
Table 4 presents the results divided into levels of resistance to polarization for each sample according to its solution.
Table 4.
Comparison of the Rp’s result of the samples in relation to the solutions of 3.5% of NaCl.
The corrosion resistance of steels used in the oil industry was evaluated, depending on their morphologies [8]. It was possible to identify that those with globular (spheroidized) cementite obtained better results for corrosion when subjected to high temperatures (>60 °C) and with the use of CO2 in a NaCl solution. This fact was also identified by another author [25], who highlighted in his work the formation of carbides and other compounds that helped to form a protective film against corrosion. The main compound formed was siderite FeCO3, which reduces the corrosion rate in steels [26,27,28,29].
Concerning Raman spectra of corrosion products, carbon dioxide, when in contact with water, forms carbonic acid; once dissociated, one of its ions is CO32− which, when reacting with Fe2+, results in carbonate of iron [30]. Such a compound could be detected by Raman spectroscopy at some wavelengths, namely, 290, 520, 734, and 1080 cm−1, due to a passivating film on the surface of metals [31].
The surface of carbon steel metals was evaluated using Raman spectroscopy. The medium used for the electrochemical tests was NaCl 3.5% and saturated CO2. The result obtained in the characterization was the formation of a magnetite (Fe3O4) and hematite (Fe2O3) film [32]. Such compounds can be explained by the decomposition of FeCO3 [33], namely, by the (3a)–(3d) reactions:
FeCO3 → FeO + CO2
The transformation of FeO takes place by reaction (3b) [34]:
3FeO + CO2 → Fe3O4 + CO
3FeO + H2O → Fe3O4 + H2
In the presence of oxygen, the transformation to Fe2O3 occurs.
4FeO+ O2 → 2Fe2O3
Such characteristics help to understand the formation of oxides on the surface of metals and the possibility of finding them in characterization techniques, such as Raman.
Next, the spectra of the tested samples are cited with their respective acquisition regions. Three samples were used, according to the submitted test. It is noteworthy that the methodology used to obtain the spectra focused on submitting to the Raman spectrum those samples that obtained intermediate resistance to corrosion in a 3.5% NaCl solution saturated with CO2 at 80 °C. This approach was based on the assumption that, in this way, it would be more likely to find oxides or salts that increased or decreased corrosion resistance.
Thus, these are the spectra and their respective acquisition references, according to the literature: generalized corrosion region (378 [35]; 700 [36]; 1300 [37,38]; 1580 [38]); region without apparent corrosion (252 [39]; 387 [40,41,42,43,44]; 667 [45]; 1332 [40]); region of localized corrosion (407 [37,38,39]; 710 [36]; 930 [23]; 1380 [38]; 1590 [38]).
The spectra were evaluated according to the color variation of the images obtained by the microscope of the equipment. Thus, the laser focus regions of the equipment were defined and named to obtain the spectra according to the type of corrosion found, namely, generalized corrosion region, no apparent corrosion, and localized corrosion.
5. Conclusions
Based on the results discussed in this research for the three wires, the following conclusions can be reached.
Under conditions of temperatures different from ambient, the pearlitic microstructure with lamellar cementite presents less susceptibility to corrosion, if compared to the other forms of cementite.
When the SC wire was subjected to an aerated environment and at room temperature, it showed lower corrosion resistance compared to other wires in the same condition (lamellar and brittle). This raises a question about CO2 gas serving as a protective element for the spheroidized microstructure, since the performance of this sample in relation to corrosion was better than the other samples when in the presence of carbon dioxide.
The results of Raman spectroscopy identified the formation of siderite in the most severe corrosion condition (NaCl + CO2/80 °C), which leads to the belief that the siderite salt reduces the advance of generalized corrosion on the surface of the SC sample.
Siderite peaks were also observed in the region with localized corrosion (pitting) and not in the region with no apparent degradation, showing that this salt does not contribute to increasing the corrosion resistance of the material.
Several oxides were also found on the surface of the analyzed SC sample, especially lepidocrocite and ferrihydrite.
Author Contributions
Conceptualization, F.F.d.M.F., M.A.C.F., M.V.G.R., J.L.C., C.A.J., S.F.R., M.N.d.S.L. and H.F.G.d.A.; Investigation, F.F.d.M.F., M.A.C.F., J.L.C., C.A.J., S.F.R., M.N.d.S.L., C.V.P.P. and H.F.G.d.A.; Visualization, F.F.d.M.F., M.A.C.F., J.L.C., C.A.J., G.S.R., E.S.S. and H.F.G.d.A.; Data curation, F.F.d.M.F., M.A.C.F., J.L.C., C.A.J., G.S.R., E.S.S. and H.F.G.d.A.; Writing—Original Draft, F.F.d.M.F., M.A.C.F., M.V.G.R., S.F.R., M.N.d.S.L. and J.L.C.; Writing—Review and Editing, F.F.d.M.F., M.A.C.F., M.V.G.R., S.F.R., J.L.C., C.A.J., S.F.R., G.S.R., E.S.S. and H.F.G.d.A.; Software, F.F.d.M.F., M.A.C.F., J.L.C., C.V.P.P., T.A.d.M. and H.F.G.d.A.; Validation, F.F.d.M.F., M.A.C.F., J.L.C., C.A.J., S.F.R., C.V.P.P., T.A.d.M. and H.F.G.d.A.; Supervision, M.A.C.F., J.L.C., S.F.R. and H.F.G.d.A.; Funding acquisition, M.A.C.F., C.A.J., S.F.R., G.S.R., E.S.S. and H.F.G.d.A. All authors have read and agreed to the published version of the manuscript.
Funding
This study was supported by the Research and Support Foundation of Maranhão (FAPEMA), Coordenação de Aperfeiçoamento de Pessoal de Nível Superior—Brasil (CAPES), Brazilian National Council for Scientific and Technological Development (CNPq), New Brunswick Innovation Foundation (NBIF), and the Natural Sciences and Engineering Research Council of Canada.
Data Availability Statement
Available upon reasonable request.
Acknowledgments
The authors acknowledge with gratitude the team of the Materials Characterization Laboratory (LACAM), Analytical Central from Federal University of Ceará (UFC), Corrosion Research Laboratory (LPC), Research and Support Foundation of Maranhão (FAPEMA), Coordenação de Aperfeiçoamento de Pessoal de Nível Superior—Brasil (CAPES), and Brazilian National Council for Scientific and Technological Development (CNPq).
Conflicts of Interest
The authors declare that they have no known competing financial interest or personal relationships that could have appeared to influence the work reported in this paper.
References
- Li, X.; Jia, R.; Zhang, R.; Yang, S.; Chen, G. A KPCA-BRANN Based Data-Driven Approach to Model Corrosion Degradation of Subsea Oil Pipelines. Reliab. Eng. Syst. Saf. 2022, 219, 108231. [Google Scholar] [CrossRef]
- Cheng, J.; Yan, Q.; Pan, Z.; Wei, W. On-Line Measurement and Characterization of Electrochemical Corrosion of 304L Stainless Steel Pipe Wall in High-Speed Cl-Containing Solution. Metals 2022, 12, 1324. [Google Scholar] [CrossRef]
- Pinheiro, P.H.; Masoumi, M.; Herculano, L.F.G.; Xavier, J.V.B.; de Lima, S.K.B.; Silva, E.S.; Reis, G.S.; Rodrigues, S.F.; de Abreu, H.F.G. Microstructural and Texture Evolution of Pearlite-Drawn Wires for Flexible Marine Pipelines: Investigating the Effect of Heat Treatments on Mechanical Properties. Metals 2023, 13, 805. [Google Scholar] [CrossRef]
- Handoko, W.; Pahlevani, F.; Hossain, R.; Sahajwalla, V. Stress-Induced Phase Transformation and Its Correlation with Corrosion Properties of Dual-Phase High Carbon Steel. J. Manuf. Mater. Process. 2019, 3, 55. [Google Scholar] [CrossRef]
- Latif, J.; Khan, Z.A.; Stokes, K. Structural Monitoring System for Proactive Detection of Corrosion and Coating Failure. Sens. Actuators A Phys. 2020, 301, 111693. [Google Scholar] [CrossRef]
- Chen, Z.; Chen, X.; Sun, Y.; Wang, G.; Wang, P. Effect of Microstructure on Coalescence-Induced Droplet Jumping Behavior of a Superhydrophobic Surface and Its Application for Marine Atmospheric Corrosion Protection. Metals 2023, 13, 1413. [Google Scholar] [CrossRef]
- Moreira, M.J.; Borges, M.F. Assesment of Electrochemical Machining-Induced Pitting Geometry on Fatigue Performance of Flexible Pipes’ Tensile Armor Wires. Results Eng. 2022, 15, 100485. [Google Scholar] [CrossRef]
- Abubakar, S.A.; Mori, S.; Sumner, J. Effect of Dissolved CO2 on the Interaction of Stress and Corrosion for Pipeline Carbon Steels in Simulated Marine Environments. Metals 2023, 13, 1165. [Google Scholar] [CrossRef]
- Onyeachu, I.B.; Chauhan, D.S.; Quraishi, M.A.; Obot, I.B. Influence of Hydrodynamic Condition on 1,3,5-Tris(4-Methoxyphenyl)-1,3,5-Triazinane as a Novel Corrosion Inhibitor Formulation for Oil and Gas Industry. Corros. Eng. Sci. Technol. 2021, 56, 154–161. [Google Scholar] [CrossRef]
- Onyeachu, I.B.; Njoku, D.I.; Nwanonenyi, S.C.; Ahanotu, C.C.; Etiowo, K.M. Investigation into the adsorption and inhibition properties of sodium octanoate against CO2 corrosion of C1018 carbon steel under static and hydrodynamic conditions. Sci. Afr. 2023, 20, e01603. [Google Scholar] [CrossRef]
- Honarvar Nazari, M.; Allahkaram, S.R.; Kermani, M.B. The Effects of Temperature and PH on the Characteristics of Corrosion Product in CO2 Corrosion of Grade X70 Steel. Mater. Des. 2010, 31, 3559–3563. [Google Scholar] [CrossRef]
- Santos, B.A.F.; Souza, R.C.; Serenario, M.E.D.; Gonçalves, M.C.; Mendes Júnior, E.P.; Simões, T.A.; Oliveira, J.R.; Vaz, G.L.; Caldeira, L.; Gomes, J.A.C.P.; et al. The Effect of Different Brines and Temperatures on the Competitive Degradation Mechanisms of CO2 and H2S in API X65 Carbon Steel. J. Nat. Gas. Sci. Eng. 2020, 80, 103405. [Google Scholar] [CrossRef]
- Mishra, B.; Al-Hassan, S.; Olson, D.L.; Salama, M.M. Development of a Predictive Model for Activation-Controlled Corrosion of Steel in Solutions Containing Carbon Dioxide. Corrosion 1997, 53, 852–859. [Google Scholar] [CrossRef]
- Fu, A.Q.; Tang, X.; Cheng, Y.F. Characterization of corrosion of X70 pipeline steel in thin electrolyte layer under disbonded coating by scanning Kelvin probe. Corros. Sci. 2009, 51, 186–190. [Google Scholar] [CrossRef]
- Panossian, Z.; de Almeida, N.L.; de Sousa, R.M.F.; Pimenta, G.d.S.; Marques, L.B.S. Corrosion of Carbon Steel Pipes and Tanks by Concentrated Sulfuric Acid: A Review. Corros. Sci. 2012, 58, 1–11. [Google Scholar] [CrossRef]
- Gulbrandsen, E.; Kvarekvål, J.; Miland, H. Effect of Oxygen Contamination on Inhibition Studies in Carbon Dioxide Corrosion. Corrosion 2005, 61, 1086–1097. [Google Scholar] [CrossRef]
- Ma, Z.; Gao, X.; Brown, B.; Nesic, S.; Singer, M. Improvement to Water Speciation and FeCO3 Precipitation Kinetics in CO2 Environments: Updates in NaCl Concentrated Solutions. Ind. Eng. Chem. Res. 2021, 60, 17026–17035. [Google Scholar] [CrossRef]
- Tantawy, A.H.; Soliman, K.A.; Abd El-Lateef, H.M. Experimental and Computational Approaches of Sustainable Quaternary Bisammonium Fluorosurfactants for Corrosion Inhibition as Protective Films at Mild Steel/H2SO4 Interface. Colloids Surf. A Physicochem. Eng. Asp. 2021, 614, 126141. [Google Scholar] [CrossRef]
- Zhou, Y.; Guo, L.; Zhang, S.; Kaya, S.; Luo, X.; Xiang, B. Corrosion Control of Mild Steel in 0.1 M H2SO4 Solution by Benzimidazole and Its Derivatives: An Experimental and Theoretical Study. RSC Adv. 2017, 7, 23961–23969. [Google Scholar] [CrossRef]
- Sheikh, A.R. Effect of Microalloying with Ti on the Corrosion Behaviour of Low Carbon Steel in a 3.5 Wt.% NaCl Solution Saturated with CO2. Arch. Foundry Eng. 2023. [Google Scholar] [CrossRef]
- Gupta, R.; Sood, A.K.; Metcalf, P.; Honig, J.M. Raman Study of Stoichiometric and Zn-Doped Fe3O4. Phys. Rev. B 2002, 65, 104430. [Google Scholar] [CrossRef]
- Bahrami, M.J.; Hosseini, S.M.A.; Pilvar, P. Experimental and Theoretical Investigation of Organic Compounds as Inhibitors for Mild Steel Corrosion in Sulfuric Acid Medium. Corros. Sci. 2010, 52, 2793–2803. [Google Scholar] [CrossRef]
- Park, Y.; Kim, S.; Jin, S.; Lee, S.; Noda, I.; Jung, Y. Investigation of the Phase Transition Mechanism in LiFePO4 Cathode Using In Situ Raman Spectroscopy and 2D Correlation Spectroscopy during Initial Cycle. Molecules 2019, 24, 291. [Google Scholar] [CrossRef] [PubMed]
- Pyshmintsev, I.Y.; Vavilova, O.v.; Mansurova, E.R.; Korober, S.A.; Maltseva, A.N. Electrochemical Investigation of Corrosion Resistance of Steel For Oil and Gas Pipelines. Metallurg 2023, 2, 27–33. [Google Scholar] [CrossRef]
- de Souza, C.A.C.; Meira, M.; de Assis, L.O.; Barbosa, R.S.; Luna, S. Effect of Natural Substances as Antioxidants and as Corrosion Inhibitors of Carbon Steel on Soybean Biodiesel. Mater. Res. 2021, 24. [Google Scholar] [CrossRef]
- Li, Q.; Liu, B. Erosion-Corrosion of Gathering Pipeline Steel in Oil-Water-Sand Multiphase Flow. Metals 2022, 13, 80. [Google Scholar] [CrossRef]
- Wang, Z.M.; Zhang, J. Corrosion of Multiphase Flow Pipelines: The Impact of Crude Oil. Corros. Rev. 2016, 34, 17–40. [Google Scholar] [CrossRef]
- Silva, C.A.; Filho, D.R.; Nunes, G.M.; Bassani, G.S.; Almeida, N.L.; Panossian, Z. Corrosion in Multiphase Slug Flow Loop in Deep-Water Oil and Gas Exploitation. In Proceedings of the Offshore Technology Conference Brasil, Rio de Janeiro, Brazil, 28–31 October 2019. [Google Scholar]
- Wang, Z.M.; Song, G.-L.; Zhang, J. Corrosion Control in CO2 Enhanced Oil Recovery From a Perspective of Multiphase Fluids. Front. Mater. 2019, 6. [Google Scholar] [CrossRef]
- Banaś, J.; Lelek-Borkowska, U.; Mazurkiewicz, B.; Solarski, W. Effect of CO2 and H2S on the Composition and Stability of Passive Film on Iron Alloys in Geothermal Water. Electrochim. Acta 2007, 52, 5704–5714. [Google Scholar] [CrossRef]
- Simpson, L.J.; Melendres, C.A. Surface-Enhanced Raman Spectroelectrochemical Studies of Corrosion Films on Iron in Aqueous Carbonate Solution. J. Electrochem. Soc. 1996, 143, 2146–2152. [Google Scholar] [CrossRef]
- Cen, H.; Chen, Z.; Guo, X. N, S Co-Doped Carbon Dots as Effective Corrosion Inhibitor for Carbon Steel in CO2-Saturated 3.5% NaCl Solution. J. Taiwan Inst. Chem. Eng. 2019, 99, 224–238. [Google Scholar] [CrossRef]
- Heuer, J.K.; Stubbins, J.F. An XPS Characterization of FeCO3 Films from CO2 Corrosion. Corros. Sci. 1999, 41, 1231–1243. [Google Scholar] [CrossRef]
- Islam, M.A.; Farhat, Z.N. Characterization of the Corrosion Layer on Pipeline Steel in Sweet Environment. J. Mater. Eng. Perform. 2015, 24, 3142–3158. [Google Scholar] [CrossRef]
- Li, S.; Hihara, L.H. A Micro-Raman Spectroscopic Study of Marine Atmospheric Corrosion of Carbon Steel: The Effect of Akaganeite. J. Electrochem. Soc. 2015, 162, C495–C502. [Google Scholar] [CrossRef]
- Müller, J.; Speziale, S.; Efthimiopoulos, I.; Jahn, S.; Koch-Müller, M. Raman Spectroscopy of Siderite at High Pressure: Evidence for a Sharp Spin Transition. Am. Mineral. 2016, 101, 2638–2644. [Google Scholar] [CrossRef]
- Dubois, F.; Mendibide, C.; Pagnier, T.; Perrard, F.; Duret, C. Raman Mapping of Corrosion Products Formed onto Spring Steels during Salt Spray Experiments. A Correlation between the Scale Composition and the Corrosion Resistance. Corros. Sci. 2008, 50, 3401–3409. [Google Scholar] [CrossRef]
- Demoulin, A.; Trigance, C.; Neff, D.; Foy, E.; Dillmann, P.; L’Hostis, V. The Evolution of the Corrosion of Iron in Hydraulic Binders Analysed from 46- and 260-Year-Old Buildings. Corros. Sci. 2010, 52, 3168–3179. [Google Scholar] [CrossRef]
- Neff, D.; Bellot-Gurlet, L.; Dillmann, P.; Reguer, S.; Legrand, L. Raman Imaging of Ancient Rust Scales on Archaeological Iron Artefacts for Long-Term Atmospheric Corrosion Mechanisms Study. J. Raman Spectrosc. 2006, 37, 1228–1237. [Google Scholar] [CrossRef]
- Ohtsuka, T.; Taneda, K. In-Situ Raman Spectroscopy for the Passive Oxide Film on Iron in Neutral Borate Solution. ECS Trans. 2009, 16, 125–131. [Google Scholar] [CrossRef]
- Ohtsuka, T. Raman Spectra of Passive Films of Iron in Neutral Borate Solution. Mater. Trans. JIM 1996, 37, 67–69. [Google Scholar] [CrossRef]
- de Faria, D.L.A.; Venâncio Silva, S.; de Oliveira, M.T. Raman Microspectroscopy of Some Iron Oxides and Oxyhydroxides. J. Raman Spectrosc. 1997, 28, 873–878. [Google Scholar] [CrossRef]
- Oh, S.J.; Cook, D.C.; Townsend, H.E. Characterization of Iron Oxides Commonly Formed as Corrosion Products on Steel. Hyperfine Interact. 1998, 112, 59–66. [Google Scholar] [CrossRef]
- Neff, D.; Reguer, S.; Bellot-Gurlet, L.; Dillmann, P.; Bertholon, R. Structural Characterization of Corrosion Products on Archaeological Iron: An Integrated Analytical Approach to Establish Corrosion Forms. J. Raman Spectrosc. 2004, 35, 739–745. [Google Scholar] [CrossRef]
- Neff, D.; Dillmann, P.; Bellot-Gurlet, L.; Beranger, G. Corrosion of Iron Archaeological Artefacts in Soil: Characterisation of the Corrosion System. Corros. Sci. 2005, 47, 515–535. [Google Scholar] [CrossRef]


Disclaimer/Publisher’s Note: The statements, opinions and data contained in all publications are solely those of the individual author(s) and contributor(s) and not of MDPI and/or the editor(s). MDPI and/or the editor(s) disclaim responsibility for any injury to people or property resulting from any ideas, methods, instructions or products referred to in the content. |
© 2023 by the authors. Licensee MDPI, Basel, Switzerland. This article is an open access article distributed under the terms and conditions of the Creative Commons Attribution (CC BY) license (https://creativecommons.org/licenses/by/4.0/).