Article

Towards Understanding the Relationships between Processing Conditions and Mechanical Performance of the Additive Friction Stir Deposition Process

1
Department of Mechanical Engineering, Baylor University, Waco, TX 76706, USA
2
Point-of-Need Innovations (PONI) Center, Baylor University, Waco, TX 76704, USA
3
U.S. Army DEVCOM Ground Vehicle Systems Center (GVSC), Warren, MI 48092, USA
4
Department of Metallurgical Engineering, The University of Alabama, Tuscaloosa, AL 35487, USA
*
Author to whom correspondence should be addressed.
Metals 2023, 13(10), 1663; https://doi.org/10.3390/met13101663
Submission received: 16 August 2023 / Revised: 14 September 2023 / Accepted: 26 September 2023 / Published: 28 September 2023
(This article belongs to the Special Issue Advances in Friction Stir Welding and Processing (2nd Edition))

Abstract

:
In this research, we explore the preliminary effects of processing conditions using a novel additive manufacturing (AM) process, known as additive friction stir deposition (AFSD), on resulting build direction (BD) mechanical performance. Using the AFSD process, a feasibility study of three AM builds of identical size are created using differentiating processing parameters. A relationship referred to as the deposition pitch, exhibiting similarities to weld pitch, is determined to be a simple but effective predictor of the interlayer bonding in AFSD processing of AA7020. The deposition pitch directly correlates the necessary temperature, time, and pressure required for effective solid-state bonding. Using this correlation, increased mechanical performance in the BD is achieved through an increase in deposition pitch. A reduction in the deposition pitch from 4.46 rev/mm to 1.08 rev/mm resulted in a significant decrease in failure strain from 24.4% to 0.82%, with the failure mechanism shifting from a ductile failure to brittle failure. The inverse relationship between grain refinement and BD failure strain at high deposition pitches suggests deposition pitch and heat input are the dominant factors in the resulting BD mechanical properties.

1. Introduction

Due to the increasing demand for high-strength and low-density alloys in the rail and defense industries, the use of Al–Mg–Zn alloys has become more prevalent [1,2]. Al–Mg–Zn alloys, such as AA7020, have a favorable combination of strength, damage resistance, and weldability compared to other precipitate-strengthened aluminum alloys [2]. However, high intensity thermal inputs from traditional welding techniques on AA7020 can cause severely textured microstructures and anisotropic mechanical performance [3,4]. Additive manufacturing (AM) offers a cost-effective solution to these issues, by means of rapid build rates, favorable microstructures, and mechanical responses. Unlike initial promising results, difficulties have been observed in producing fully dense AA7020 components with isotropic mechanical properties in beam-based AM methods [5,6].
The melting and re-solidification required during beam-based AM processes induces inherent flaws such as hot cracking, porosity, and anisotropic mechanical behavior in AM AA7020 components [7,8,9]. Specifically, Zhou et al. noted that a significant amount of Mg and Zn evaporation occurred during the Laser Powder Bed Fusion (LPBF) process, causing significant porosity and columnar grains throughout the component [7]. Zhou et al. concluded that a fully dense component could not be created for LPBF processing of AA7020 [7]. Babu et al. discovered that Al–Mg–Zn components with high solute contents are able to be produced with no hot cracking and low porosity using selective laser melting (SLM) [8]. However, Babu noted that there is a high volume of second phase particles along the melt pool causing a more brittle anisotropic mechanical response. Li et al. noted the evaporation of alloying element Zn around the fusion line of Al–Mg–Zn alloys produced via wire arc additive manufacturing (WAAM), creating solute-depleted regions near the layer causing a significant reduction in build direction (BD) mechanical performance compared to the longitudinal samples (LD) [9].
To circumvent these deleterious effects observed in fusion-based AM, solid-state processes, such as friction stir welding (FSW), can be employed to create fully dense components with isotropic mechanical properties since processing occurs below the melting temperature in these processes [10,11]. In an FSW study of AA7020, Essa et al. observed excellent friction stir weldability, with the nugget zone of the weld experiencing a highly refined equiaxed grain structure due to dynamic recrystallization inherent to the FSW process [10]. Similarly, Gaafer et al. studied the process–structure–property (PSP) relationship of friction stir welded AA7020 and noted a highly refined microstructure post FSW in AA7020, however, an inverse relationship between the tool rotational rate and UTS exists [11]. These correlations were made by relating the tool rotational rate (ω) and the traverse rate (V) in a parameter commonly known as weld pitch (ω/V) in FSW applications [12].
Similar to FSW, additive friction stir deposition (AFSD) is a thermo-mechanical process derived from FSW, friction surfacing (FS) [13,14,15,16,17], and the friction stir forming technique [18]. The AFSD process utilizes frictional heat generated by a rotating tool and severe plastic deformation physics to plastically deform the material, inducing material flow to form a layer-by-layer AM process [19,20,21]. The shear-induced plastic deformation and dynamic recrystallization (DRX), inherent to the AFSD process, produces a fully dense, near net-shaped component with a refined microstructure consisting of a homogenous grain structure exhibiting forged-like mechanical performance. The AFSD process is a versatile AM method that can utilize multiple feedstock avenues such as the solid bar [22], machine chips [23], and wire [24,25].
Currently, there are a handful of studies that have examined 7XXX series aluminum alloys [26,27,28,29,30,31] processed with AFSD. However, only a few of these studies have quantified the mechanical behavior in the BD. In particular, Avery et al. investigated the BD quasi-static mechanical properties of AFSD AA7075 and observed a decrease in YS and UTS when compared to the wrought feedstock material, which was attributed to the loss of strengthening precipitates during the AFSD process [26]. However, a similar failure strain in the as-deposited samples compared to the feedstock was observed [26]. In a separate study by Mason et al. [27], anisotropic mechanical performance was observed in AFSD-processed AA7050, which was attributed to the hardness gradient throughout the BD. Severe anisotropic mechanical behavior was also noted for AFSD-processed AA5083, which was caused by layer delamination due to carbon contaminates from the graphite coating used during the deposition process to prevent machine jamming [32].
This study investigates the preliminary influence of a relationship similar to weld pitch, known as deposition pitch, on AFSD-processed AA7020. For the first time, correlations between AFSD process parameters and the resulting BD mechanical performance are examined to understand mechanisms causing severe anisotropic mechanical properties in as-deposited high-strength aluminum alloys.

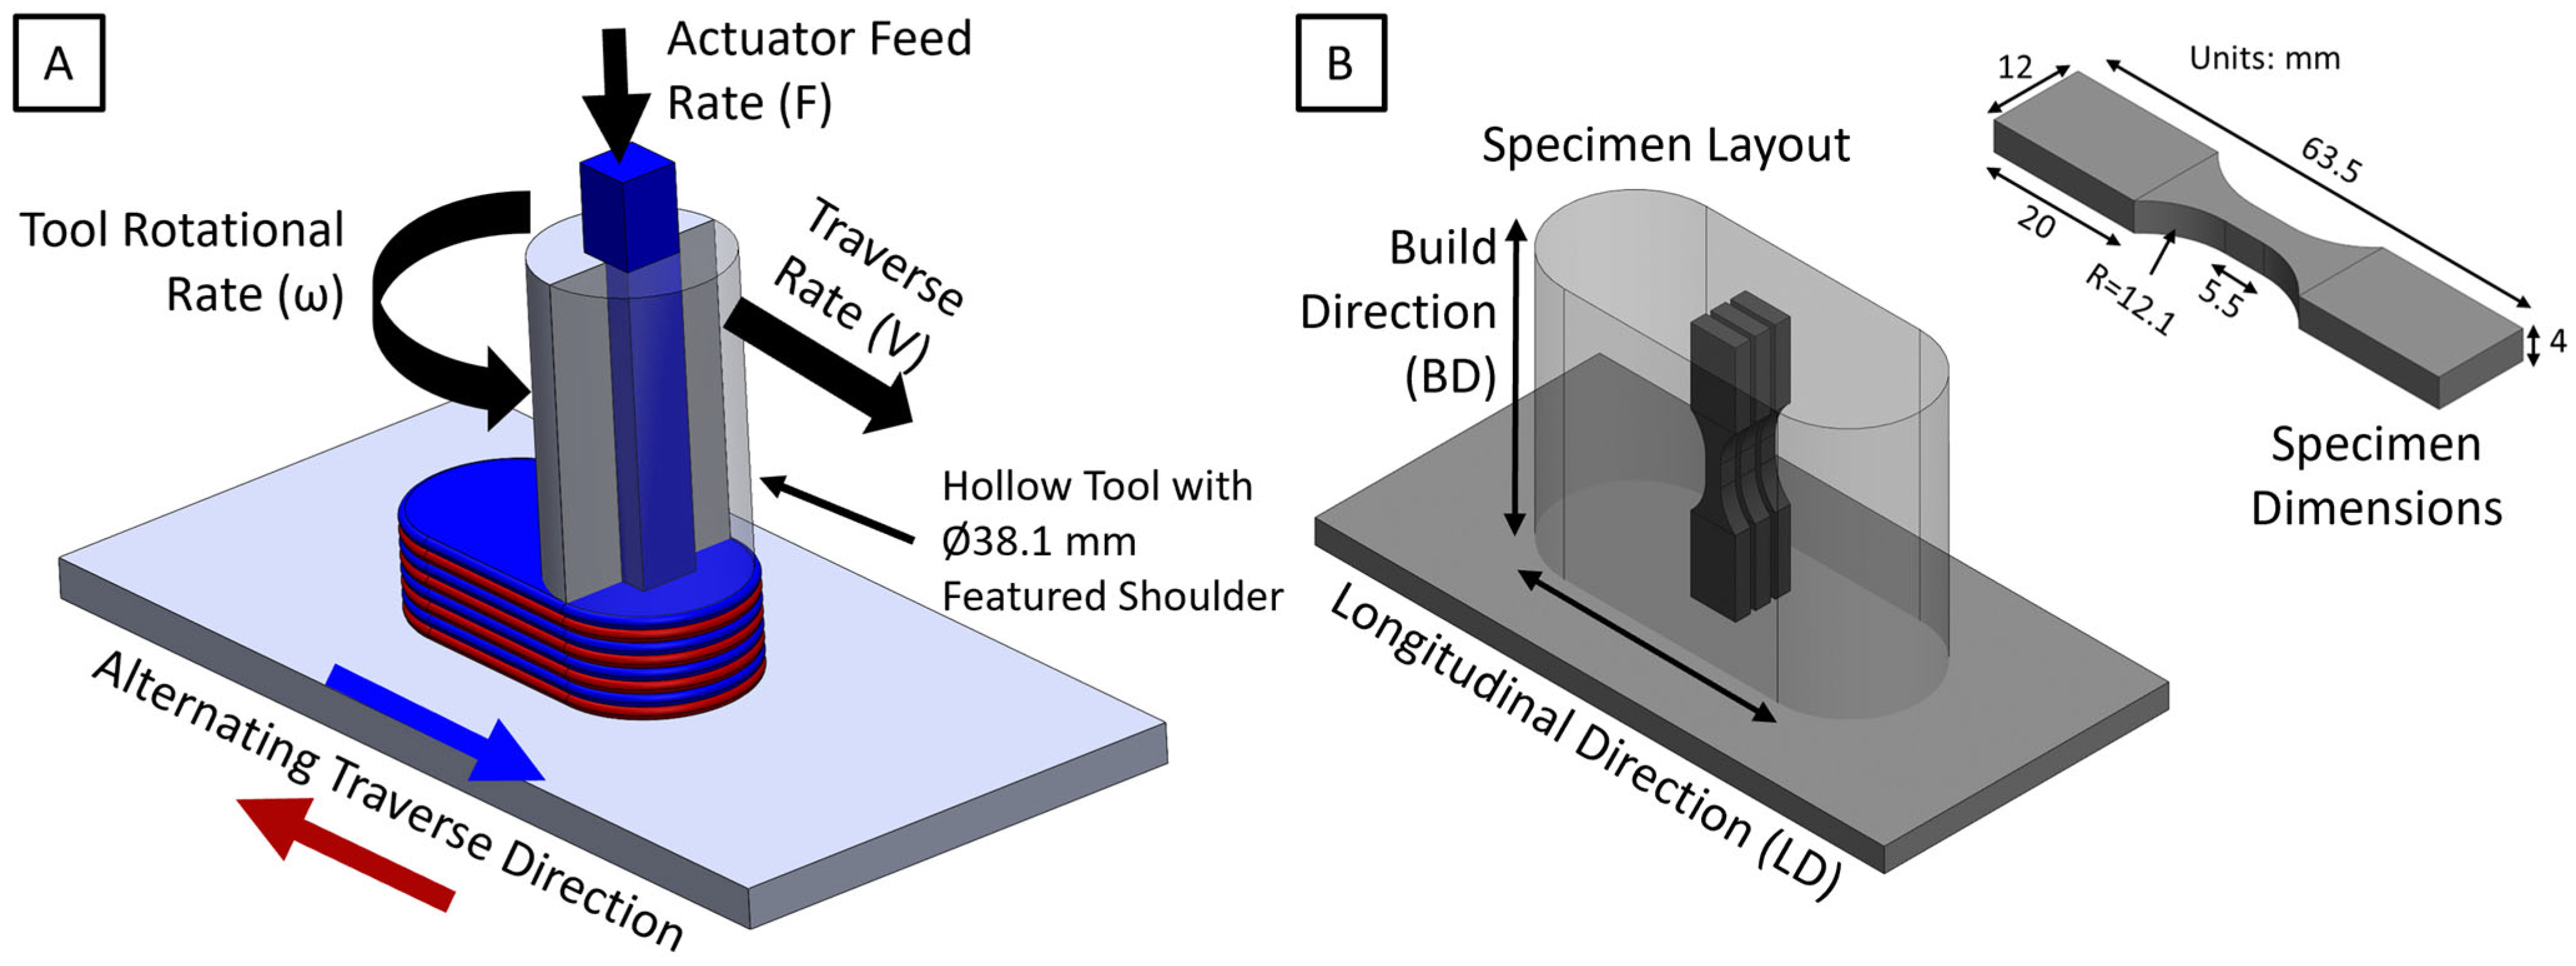
2. Materials and Methods

All of the AM builds in this study were deposited layer-by-layer using a commercially available MELD Manufacturing B8 machine with a maximum build profile of 0.46 m wide by 1.07 m long by 0.3 m tall. A schematic of the AFSD process used in this study is shown in Figure 1A. The tooling used in this study was made of H13 tool steel with four “teardrop” features on the tool shoulder [31]. The feature tool shoulder promotes the increase in frictional heat generation and increases the amount of interlayer material mixing [22,28]. The depositions were made with a commercially available Al–Mg–Zn aluminum alloy (AA7020), with a nominal composition listed in Table 1. A solid square rod with a 9.53 mm by 9.53 mm cross-section was used as the initial feedstock material, which was machined from a hot rolled plate. All the feedrods used in this study were coated with a spray graphite lubricant, per the OEM recommendation, to prevent machine jamming of the feedstock during deposition. In this study, three components, as shown in Figure 2, with identical dimensions were deposited using the parameters listed in Table 2. The AM builds in this work will be referred to as Slow, Medium, and Fast according to the corresponding parameters for the remainder of this study. All three of the depositions were 63.5 mm long with a build height of 54 mm, layer heights of 1 mm, and with nominal track widths correlating to the deposition tool diameter of 30 mm.
Samples for electron backscattered diffraction (EBSD) characterization were extracted from the builds and prepared by cross-sectioning the three AFSD deposits normal to the short traverse direction (STD). The samples were cold mounted, step-wise ground from P240 to P4000, and polished with 3 μm and 1 μm alcohol-based diamond suspension in a stepwise manner. Final polishing was completed using a vibratory polisher with 0.05 μm colloidal silica for 4 h. The EBSD measurements were collected at 30 keV and 9.0 nA with a step size of 0.5 μm using the APEX system (EDAX, Mahwah, NJ, USA) with a Versa 3D Dual Beam scanning electron microscope (Thermo Fisher Scientific, Waltham, MA, USA). Grain dilation cleanup with a minimum grain size of 25 pixels was performed on the corresponding results using the orientation imaging microscopy (OIM) software (Version 8, EDAX, Mahwah, NJ, USA).
Quasi-static tensile testing was performed in triplicate on samples throughout the AA7020 deposition BD as shown in Figure 1B. The dimensions for the modified ASTM E606/E606M-12 quasi-static specimens are shown in Figure 1B [33]. All specimens were machined from each respective deposition using a Mitsubishi MV1200 wire electron discharge machine (EDM). The specimens were tested using a 25 kN Landmark 370 MTS (MTS, Eden Prairie, MN, USA) servo hydraulic load frame and were run in displacement control with an MTS 5 mm gage extensometer at a nominal strain rate of 0.001 s–1 in ambient laboratory conditions. All post-mortem analysis is performed using a Thermo Fisher Scientific Versa 3D Dual Beam FIB-SEM at 20 keV.

3. Results and Discussion

To explore PSP relationships of AFSD, the processing parameters shown in Table 2 were used to successfully deposit AA7020. While all the AM builds are well consolidated, from macroscopic visual evaluation, it is evident that the Slow build has significantly more flash than the Medium and Fast builds, as shown in Figure 2A–C. A macroscopic image of the representative cross-section of each build is shown in Figure 2D. From Figure 2D it is evident that the usable width throughout the entirety of the build is well-consolidated and fully dense. Throughout the build there is no evidence of macroscopic defects, alluding to a fully homogenous macro and resulting microstructure. Utilizing the usable width of a deposit equation, introduced by Gradl et al. [34], the Slow build (Figure 2A) yielded the lowest deposition efficiency at 56.9% while the Medium (Figure 2B) and Fast (Figure 2C) builds yielded a deposition efficiency of 73.3% and 81.3%, respectively. The deposition rates, also referred to as the build rates, for the Slow, Medium, and Fast builds are 0.78 kg/h, 1.17 kg/h, and 2.33 kg/h, respectively, assuming a continuously fed system. It should also be noted that the deposition pitch for the Fast build was 4 times lower than that of the Slow and Medium builds. When evaluating the deposition properties above, there is a direct correlation between the speed of the process parameters and the resulting deposition efficiency. To maximize build rate without deleterious mechanical properties, in-depth investigations on processing conditions must be conducted on AFSD builds to avoid the anisotropic BD mechanical behavior noted in previous studies [32,35].
The processing parameters influence the amount of heat input introduced into the system, which has a direct effect on the resulting microstructure and mechanical properties. Using the empirical relations developed by Pew et al. [36] for FSW aluminum alloys, heat input can be roughly estimated using machine processing conditions as shown in Equations (1) and (2) below:
Weld   Power = 2 π M ω 60 ,
where M is torque from the spindle and ω is the tool rotational rate, and
Heat Input = W e l d   P o w e r V ,
where V is the traverse rate. The values for weld power and heat input for the as-deposited AA7020 builds are given in Table 3. It should be noted that there is an inverse relationship between the average torque and the tool rotational rate, while there is a direct relationship between the tool rotational rate and the heat input, which has been reported previously [37,38]. From the values in Table 3, it is evident that there is a correlation between the heat input and the tool rotational speed to traverse speed ratio. To further characterize this correlation, Equation (3), developed by Arbegast and Hartley [39], is utilized to estimate the peak temperature during the deposition process:
T T m = K ω 2 V × 10 4 α ,
where Tm is the melting temperature for AA7020, and both K and α are constants that can vary between 0.65–0.75 and 0.04–0.06, respectively, for aluminum alloys [37]. In this study, the values for K and α used were 0.75 and 0.04. The estimated peak temperatures for the AA7020 depositions in this study are shown in Table 3. The peak temperature and heat input are directly related to the deposition pitch and resulting mechanical behavior. It should also be noted that in this relationship the tool rotational speed is the most significant contributor to the peak temperature, which is shown in this study with the Medium build experiencing the highest estimated peak temperature. The peak temperatures in this study are similar to temperatures experienced by other AFSD-processed aluminum alloys [21,40]. However, even though the Medium build had the largest peak temperature, the Slow build had roughly two times more total heat input than the Medium build, suggesting the total heat input will affect the resulting microstructure more than the peak temperature, as shown in Figure 3.
Figure 3A–C depicts the representative EBSD maps for the Slow, Medium, and Fast builds exhibiting an average grain size of 29.4 ± 10.0 µm, 17.7 ± 7.5 µm, and 12.7 ± 4.9 µm, respectively. It should be noted that while there are some slight differences in the grain size between depositions, the AFSD process generates a highly refined, defect-free grain morphology compared to the feedrod material [31]. The refined grains are attributed to the continuous dynamic recrystallization that occurs during the high-shear deformation AFSD process [26,41]. As expected, there is a direct correlation between the heat input during the deposition and the grain size. The Slow build (Figure 3A) exhibits the largest grain size, caused by the grain growth that occurs with an increased heat input during the deposition process, while the Fast build (Figure 3C) exhibits the smallest grain size, due to the minimized heat input during the AFSD process. A lower deposition pitch causes fewer tool rotations per millimeter traversed, therefore inducing less plastic deformation in the deposit. Figure 3D depicts a comparison of the cumulative area fraction for the Slow, Medium, and Fast builds. With an increasing traverse rate (V), there is a decrease in grain size signified by a leftward shift in the curves as shown in Figure 3D. A similar slope is noted for the Fast and Medium builds in Figure 3D, however, there is a more pronounced change in the slope for the Slow build, due to the increased grain size variance in this deposition. The increased grain size variance in the Slow build is attributed to the increased heat input during AFSD processing.
Figure 4A shows the BD quasi-static tensile stress–strain results for the Slow, Medium, and Fast builds compared to the as-deposited AA7020 LD results [31]. A summary of the quasi-static testing results is shown in Table 4. It should be noted that due to the significant heat input during the AFSD process, the as-deposited specimens have a decrease in mechanical performance when compared to a peak aged (T651) specimen. This decrease in performance is attributed to the loss of strengthening precipitates resulting from the inherent physics of the AFSD process [26,27,31]. Interestingly, as shown in Figure 4A, the Slow and Medium build BD specimens have a modulus of 57.5 GPa, while the Fast build BD and LD specimens have a modulus of 63.0 and 67.0 GPa, respectively. Future investigations should be conducted to determine the cause of the change in modulus between the LD and BD. While the Fast build BD specimen exhibited the highest YS at 145 MPa, the failure strain experienced a reduction of at least 95.5% when compared to the other as-deposited AA7020 specimens. To contrast, the Slow build exhibited a respective 0.77%, 2.3%, and 19.1% decrease in YS, UTS, and failure strain when compared to the LD specimen. Similarly, the Medium build experienced a respective 16.2%, 10.1%, and 39.6% decrease in YS, UTS, and failure strain compared to the LD specimen. The increase in failure strain with increased grain size, as noted in the Slow Build, is attributed to the larger defect-free grains’ ability to accommodate more dislocation density than smaller defect-free grains. While the Slow and Medium builds do not exhibit completely isotropic behavior when compared to the LD specimen, these processing conditions yield a more isotropic mechanical response than the Fast build. The severe anisotropic behavior in the BD and LD specimens using the fast build processing conditions supports the hypothesis of a fundamental relationship between the deposition pitch and resulting effective interlayer bonding criteria. To further characterize this hypothesis, Figure 4B shows a correlation between the deposition pitch and the failure strain and build rate for this preliminary study. Interestingly, the failure strain and build rate exhibit an inverse relationship, which must be considered when designing for component applications.
A schematic depicting key features of a high and low deposition pitch are shown in Figure 5A,B, respectively. It should be noted that the degree of deposition pitch, i.e., either high or low, can be macroscopically observed by the spacing of onion skin features [42] on the final layer of a build, as illustrated in Figure 5. While the schematics in Figure 5 exaggerate the onion skin spacing for illustration purposes, this phenomenon is visible in Figure 2. Figure 2C shows clear definition of onion skin spacing in the Fast build with a low deposition pitch, while there is minimal definition of onion skin spacing in the Slow build (Figure 2A), which exhibits a large deposition pitch. As discussed previously, a lower deposition pitch equates to fewer tool rotations per millimeter traversed, which is a contributor to lesser amounts of inter- and intra-layer material mixing, as shown in Figure 5B. An insignificant amount of interlayer material mixing is one of the contributing factors to weaker layer interface bonding causing layer delamination of BD specimens, as shown in Figure 4A. The Slow and Medium builds have different processing conditions, however, these builds exhibit a comparable deposition pitch and resulting mechanical performance, therefore suggesting there is a critical deposition pitch and heat input in which a build must exceed to minimize layer delamination and resulting premature failure. To elucidate this critical deposition pitch and heat input, the authors suggest an expansive process parameter correlation study using multiple aluminum alloys to fully understand the effect of the deposition pitch on resulting interlayer bonding.
To further understand the BD quasi-static stress–strain response, representative fracture surface analysis was performed on the Slow, Medium, and Fast builds, as shown Figure 6. Figure 6A,B is representative images of the Slow build fractured specimens. Figure 6A displays cup-and-cone topography, typical to ductile fractures. Figure 6B reveals an area with equiaxed microdimpling indicative of transgranular fracture, however, a large ridge is noted with surrounding grains appearing elongated indicting shear mechanisms. The shear mechanisms in this area are likely caused by a combination of localized stress concentrations from neighboring plastic deformation and layer delamination [32]. Figure 6C,D is representative images of the Medium build fractured specimens. Similar to the Slow build fracture surface, Figure 6C depicts a cup-and-cone topography. Interestingly, in Figure 6C, a distinct pattern is noted on the side of the ridges, which matches the tool rotational pattern, indicating a potential multitude of areas for reduced void nucleation resistance. As expected, Figure 6D illustrates similar features to the Slow build, including a large region of transgranular fracture with equiaxed microdimpling and areas of shear-dominated fracture mechanisms. Figure 6E,F is the representative fracture surface images of the Fast build. As shown in Figure 6E, the entire fracture surface was flat, with minimal amounts of plastic deformation observed, indicating brittle fracture. The direction of the ridgelines, as shown in Figure 6E, coincide with the tool protrusions and rotation, indicating an insufficient amount of interlayer material mixing. When at a higher magnification at one of the ridgelines, as shown in Figure 6F, small microvoids are noted throughout the lighter region. The microvoids are able to nucleate, but coalescence is inhibited due to the large stress concentrations created by insufficient layer bonding, resulting in delamination.
From the preliminary results in this study, it is evident that a complex relationship between AFSD processing parameters and resulting near isotropic performance exists. To further understand these correlations, Figure 7 depicts AFSD processing conditions as related to solid-state bonding criteria. To achieve acceptable interlayer bonding resulting in isotropic mechanical performance, a threshold of temperature and pressure for a given value of time must be input into the component during processing [43,44]. While not all the conditions shown in Figure 7 are investigated in this study, the deposition pitch, which evaluates the amount of tool rotations per millimeter traversed, is one of the relationships inclusive of all the criteria necessary for effective interlaying bonding. The deposition pitch, max temperature, and heat input for the Slow and Medium builds are hypothesized to be above a theoretical critical value promoting effective layer bonding and increased mechanical performance. However, the Fast build exhibiting weak layer bonding and dimensioned mechanical properties, falls below this hypothesized critical threshold for deposition pitch, peak temperature, and heat input.

4. Conclusions

This preliminary study explores the effect of AFSD processing conditions on resulting BD mechanical performance. The following conclusions were determined from this investigation:
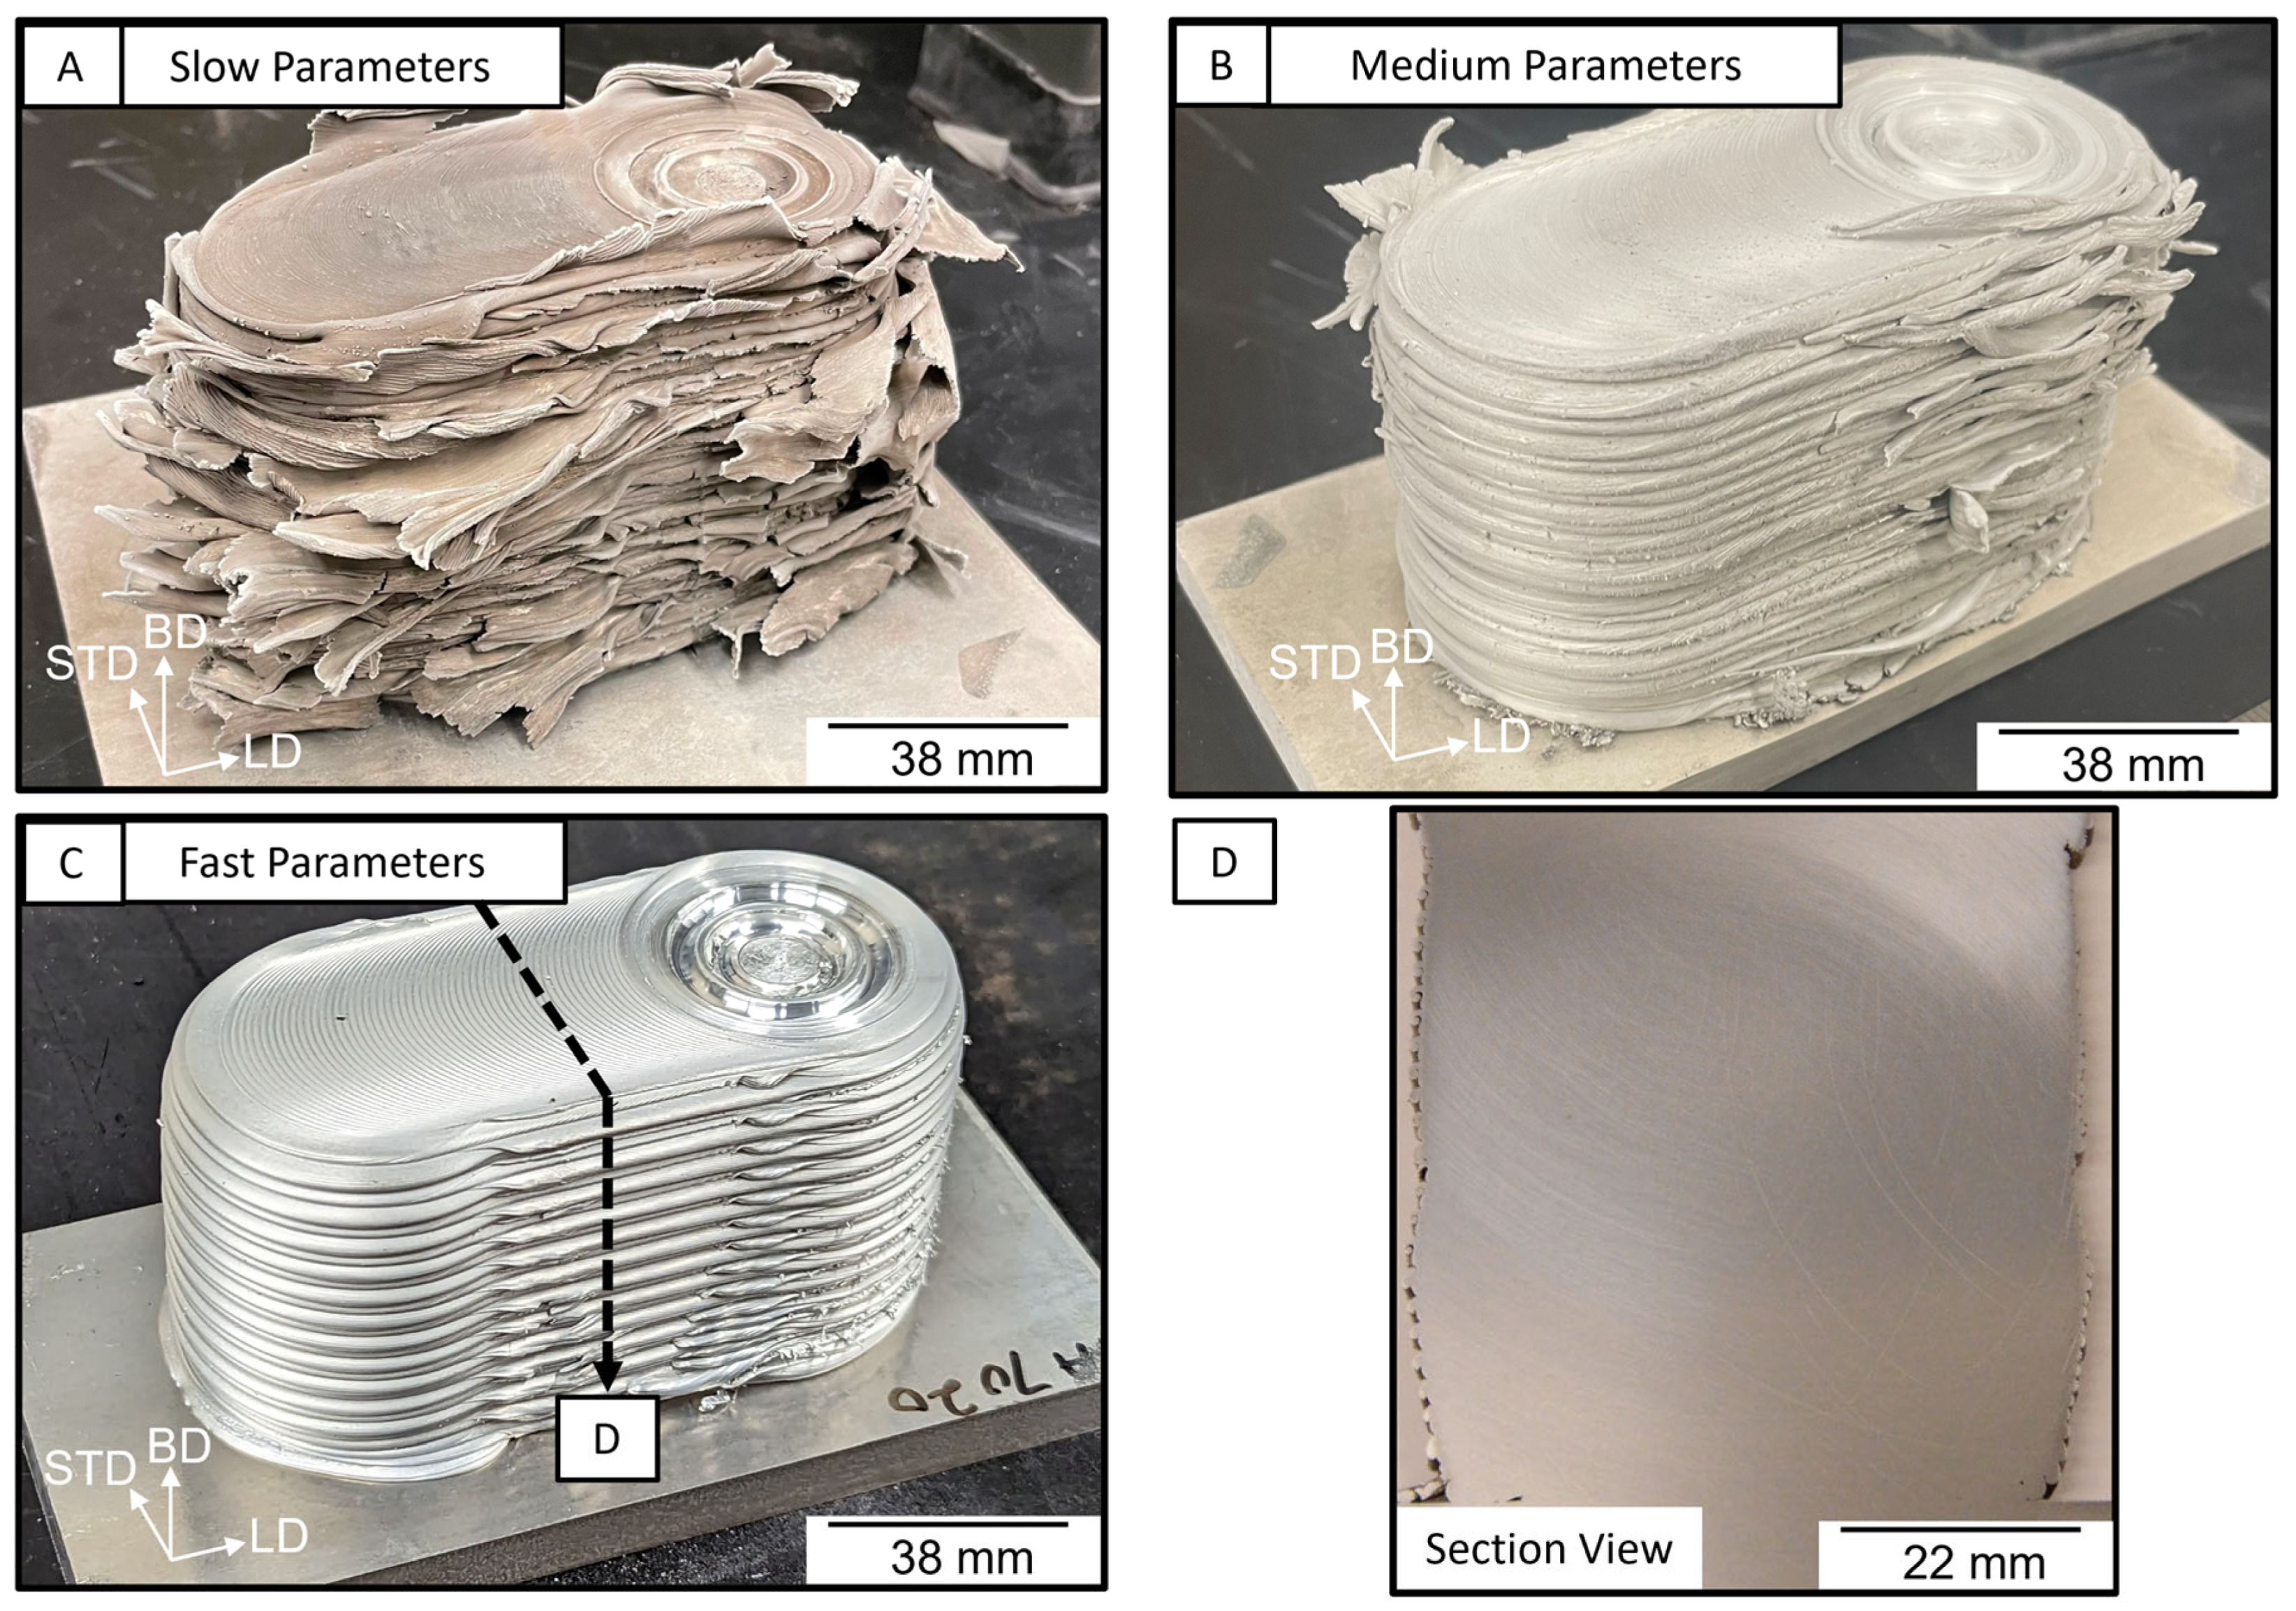
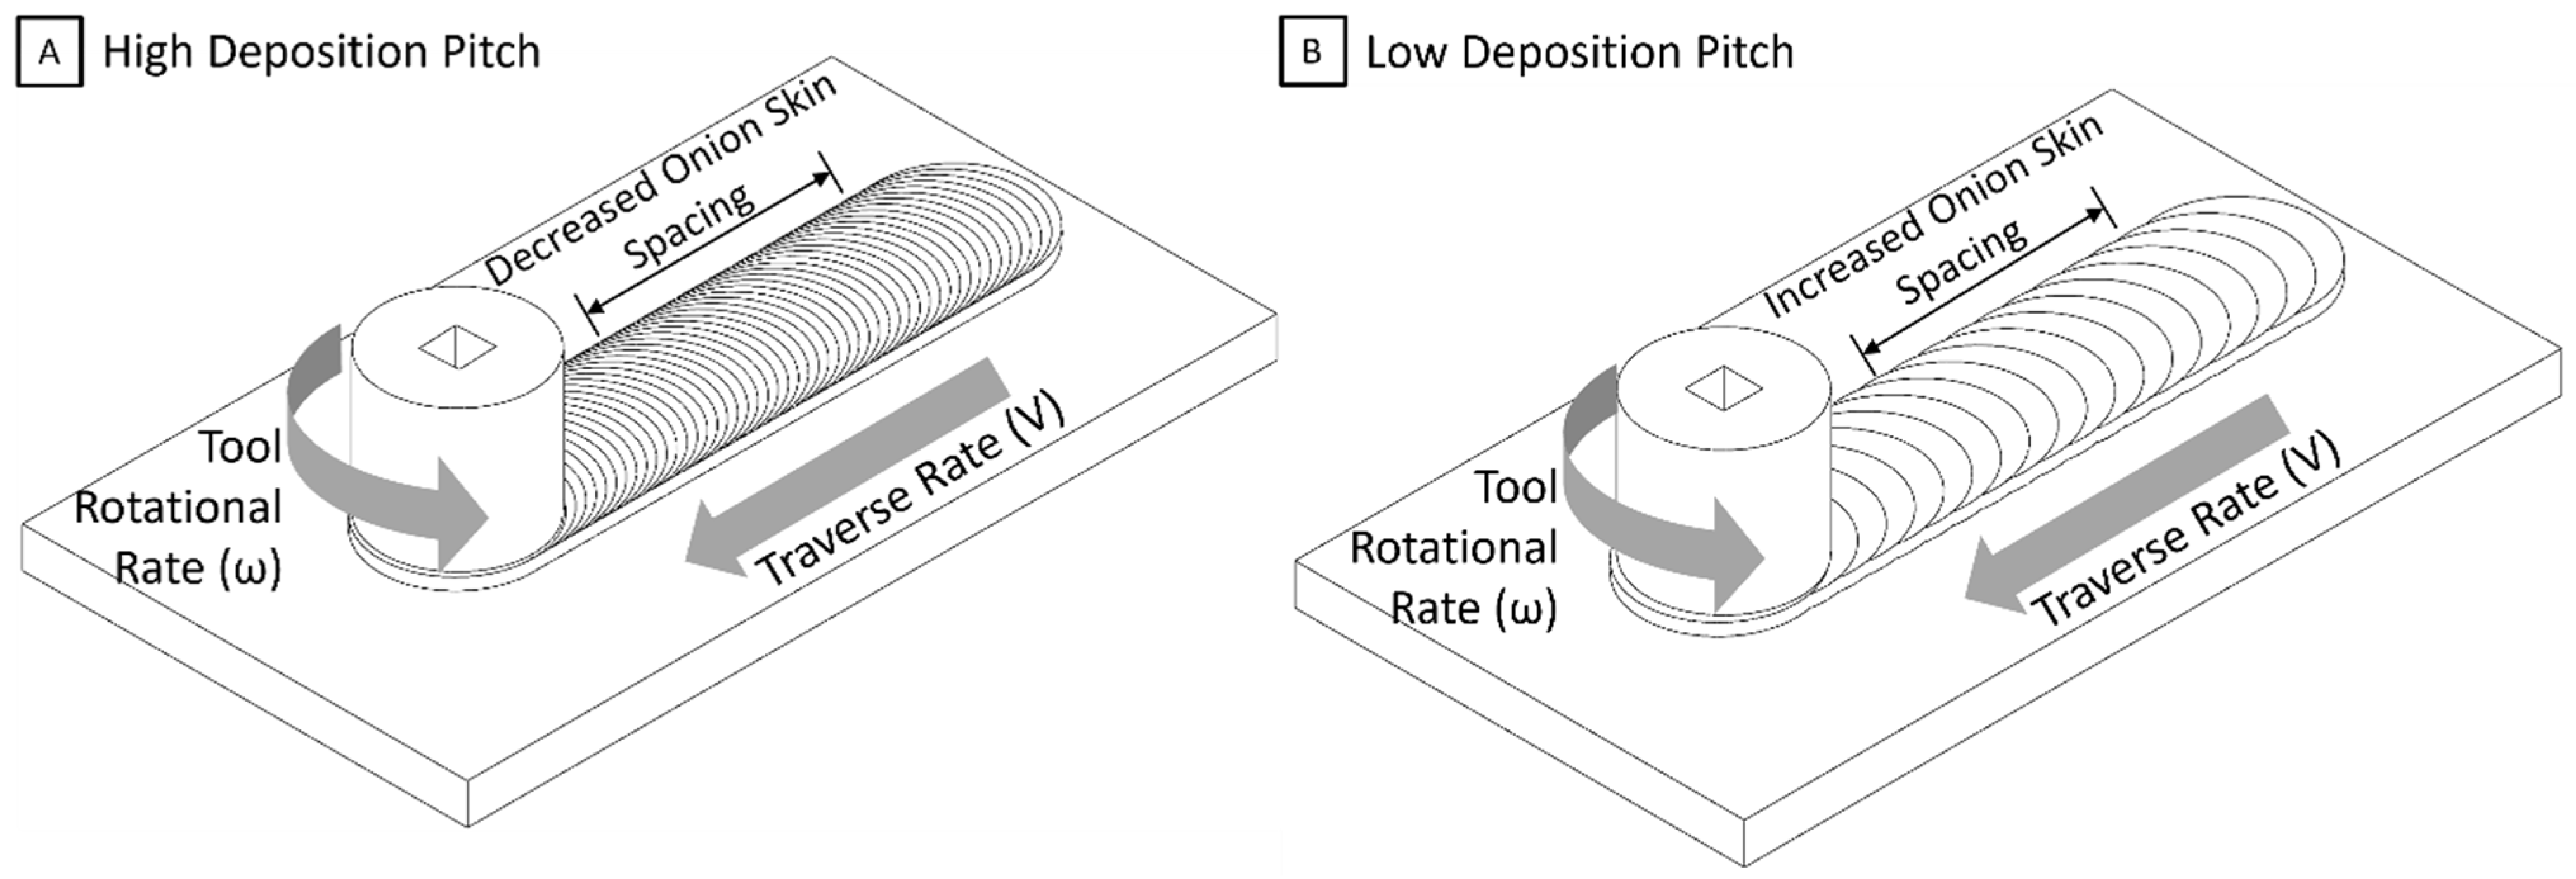
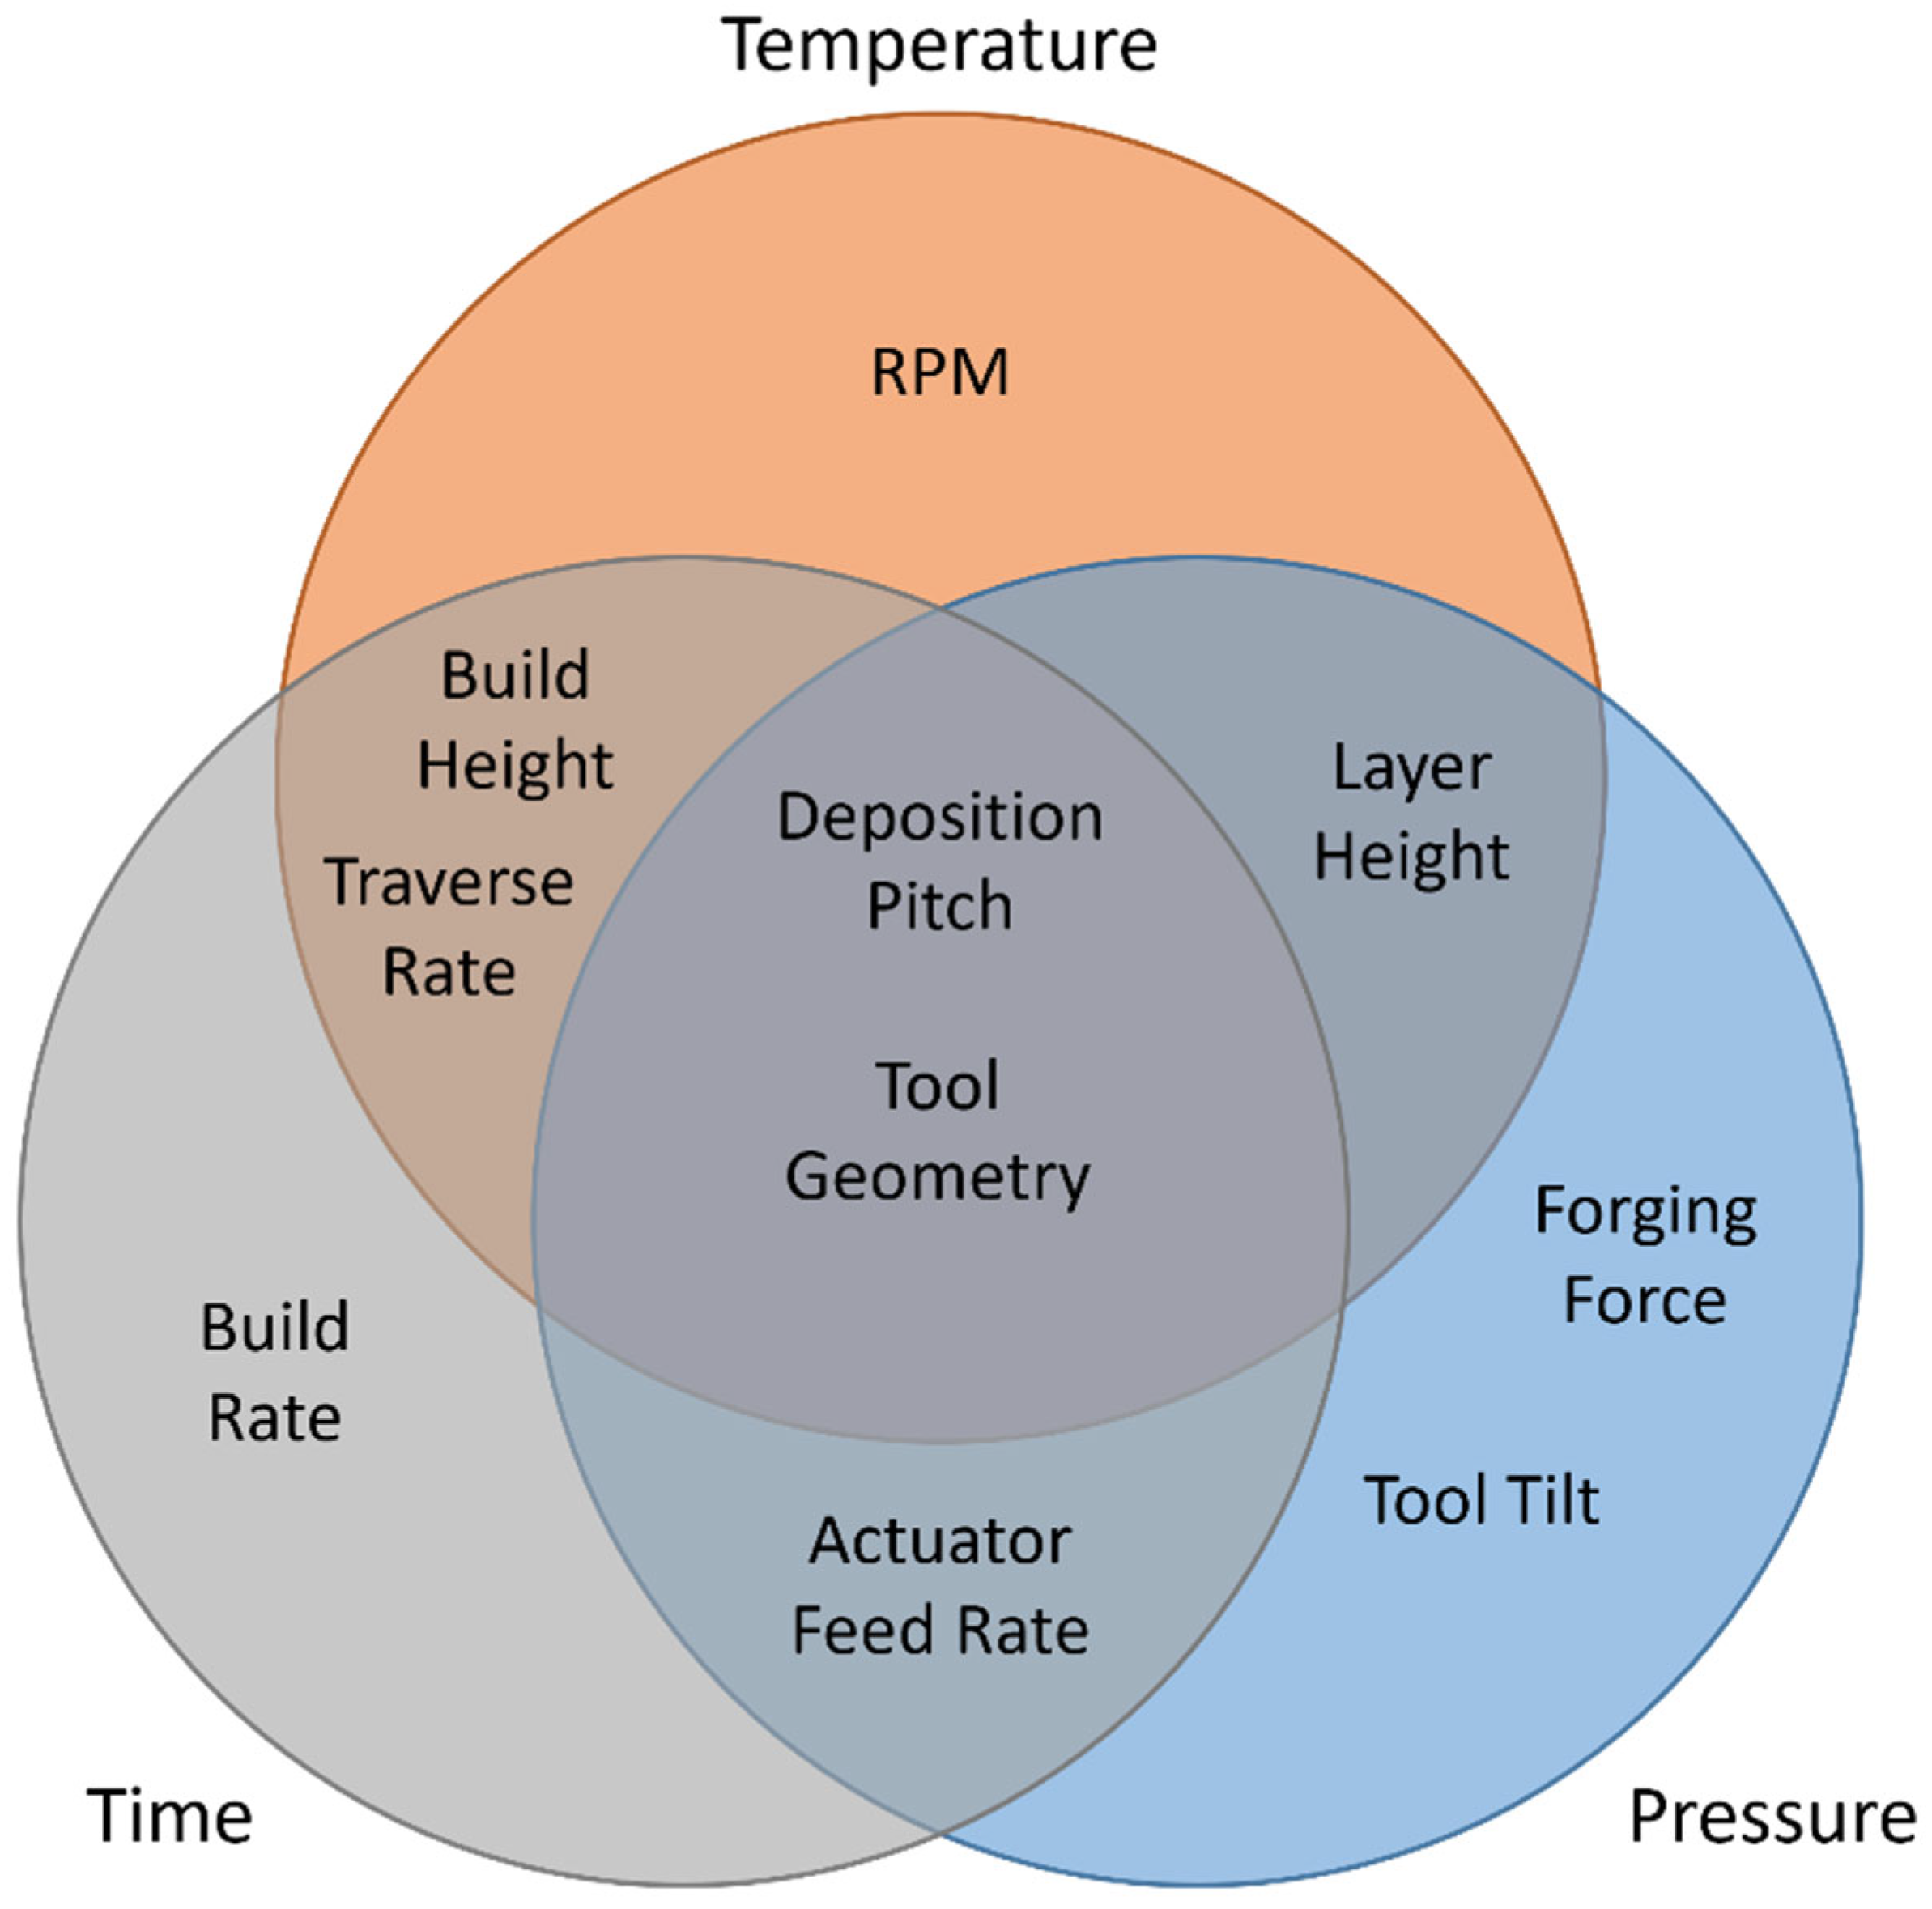
  • Deposition pitch, i.e., the ratio of the tool rotational rate to traverse rate, is one of the simple but effective predictors of the interlayer bonding in AFSD processing of AA7020. The deposition pitch directly correlates the necessary temperature, time, and pressure required for effective solid-state bonding.
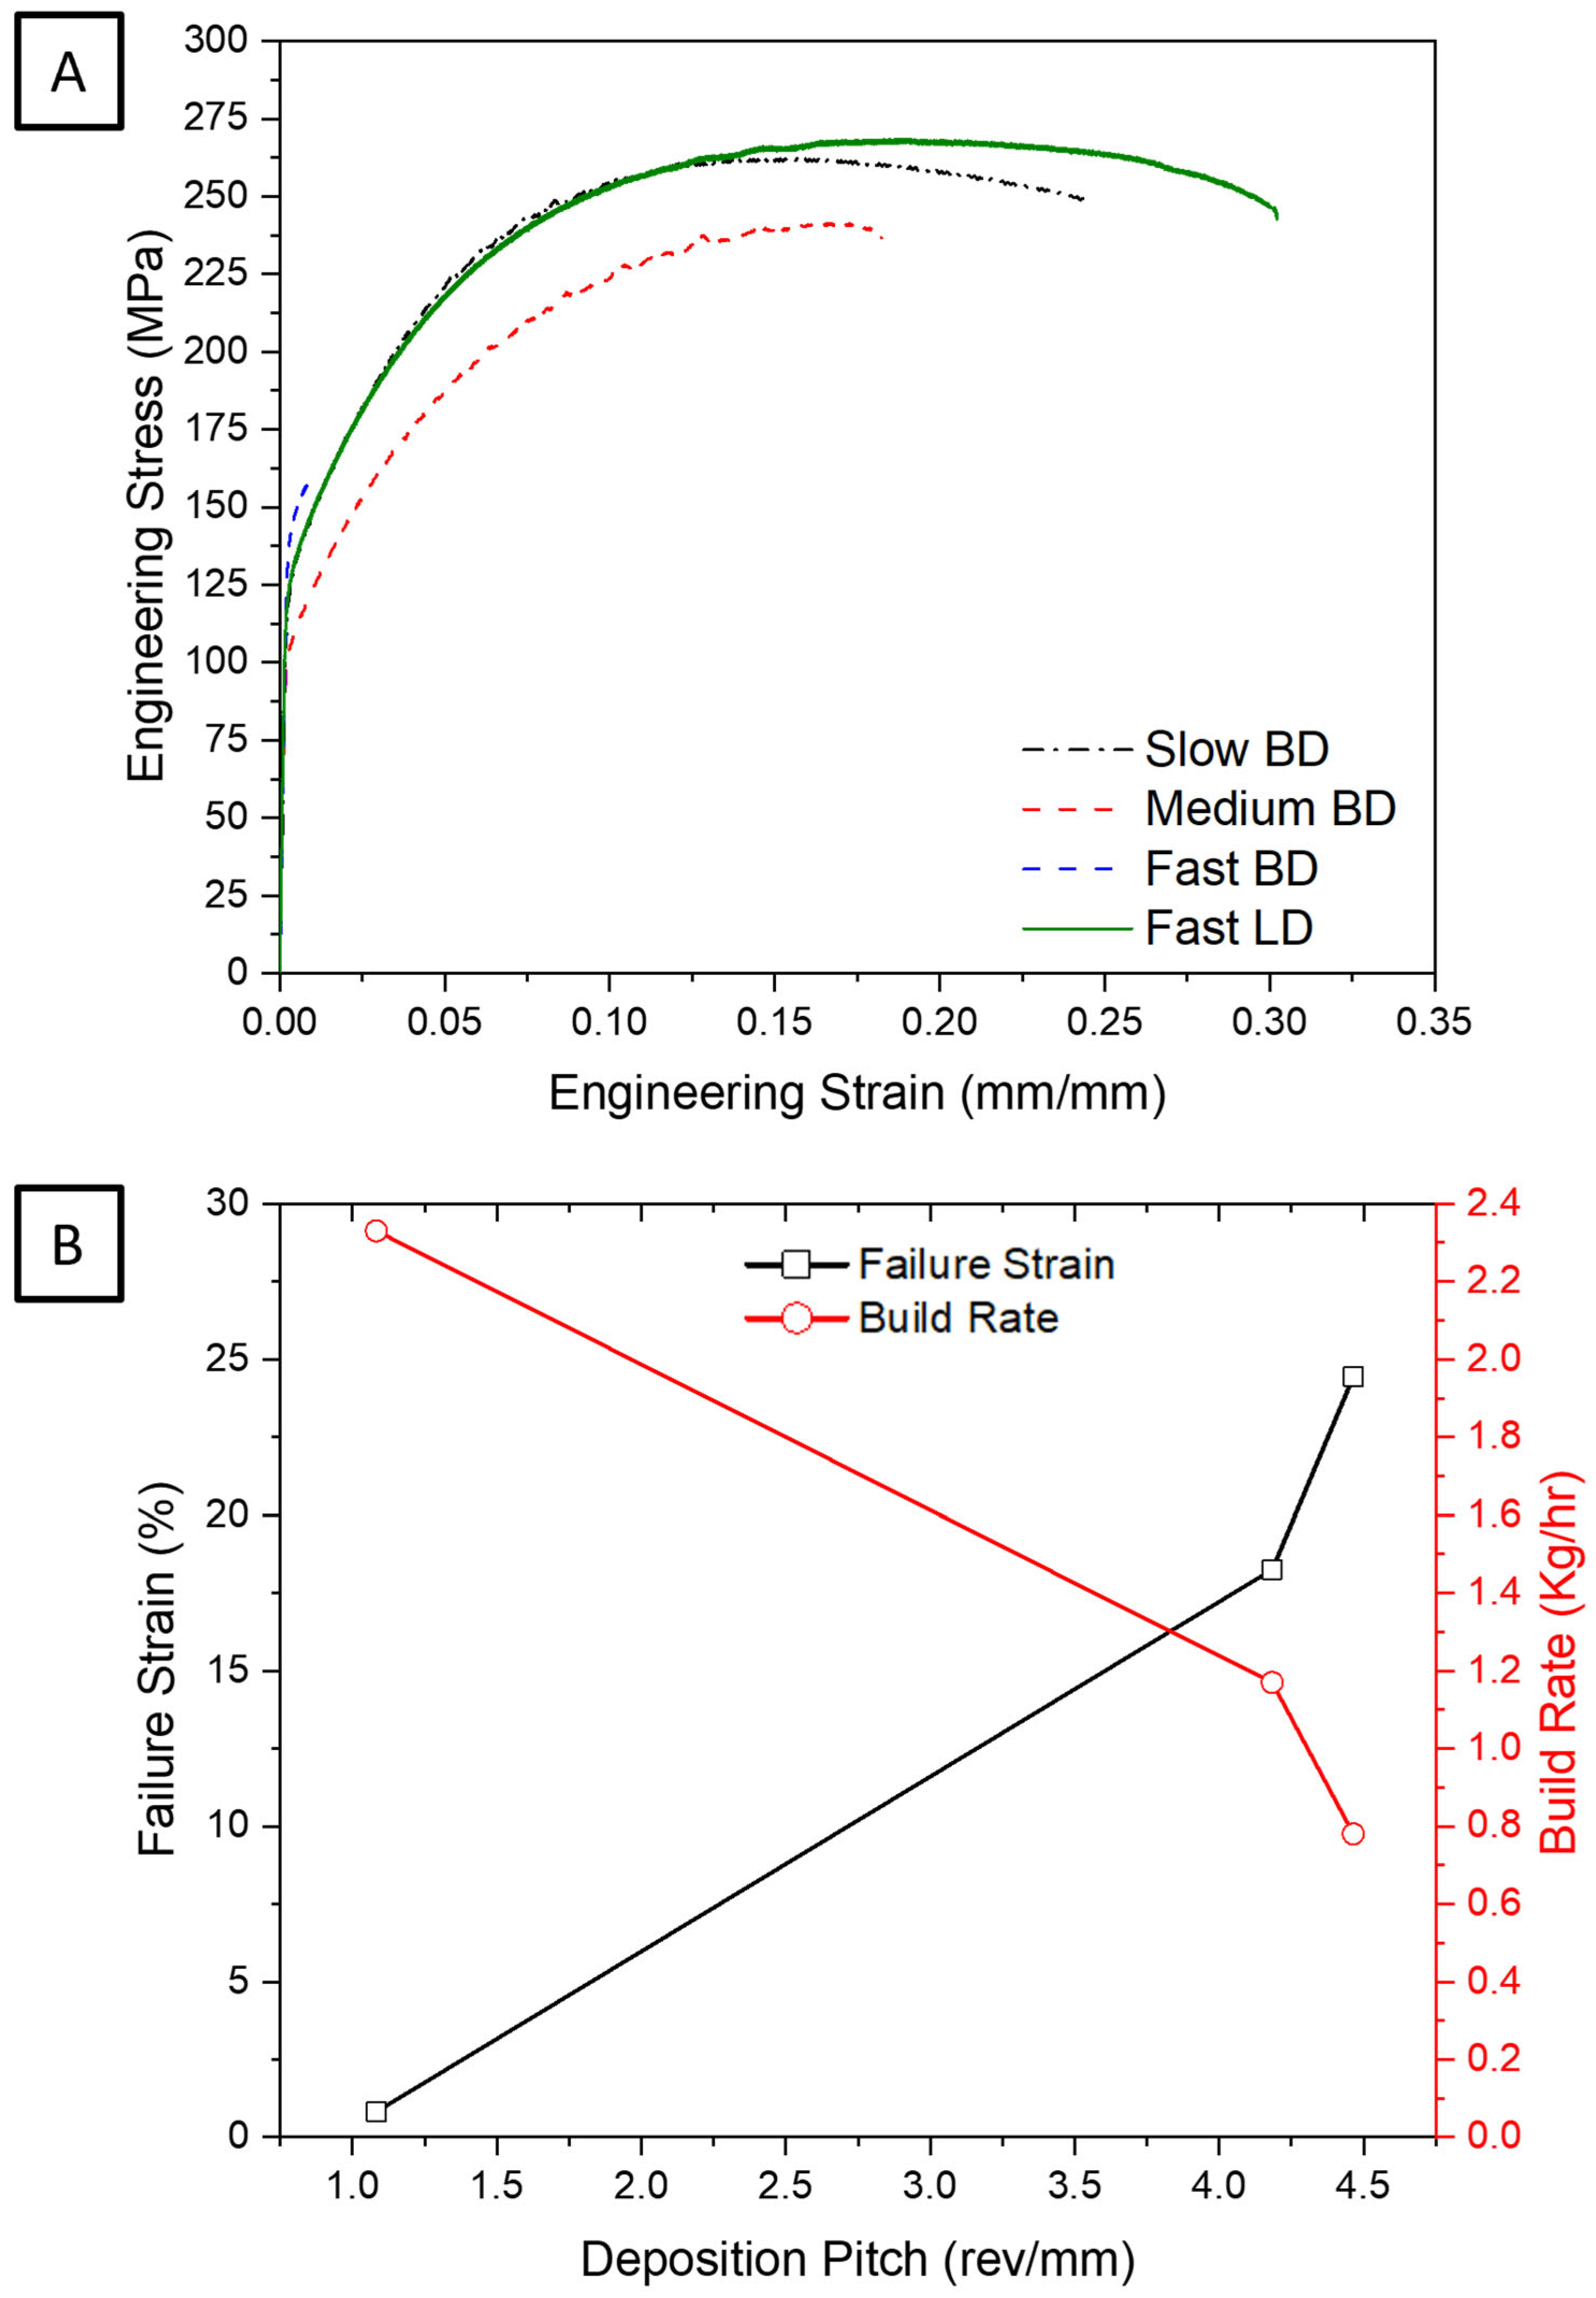
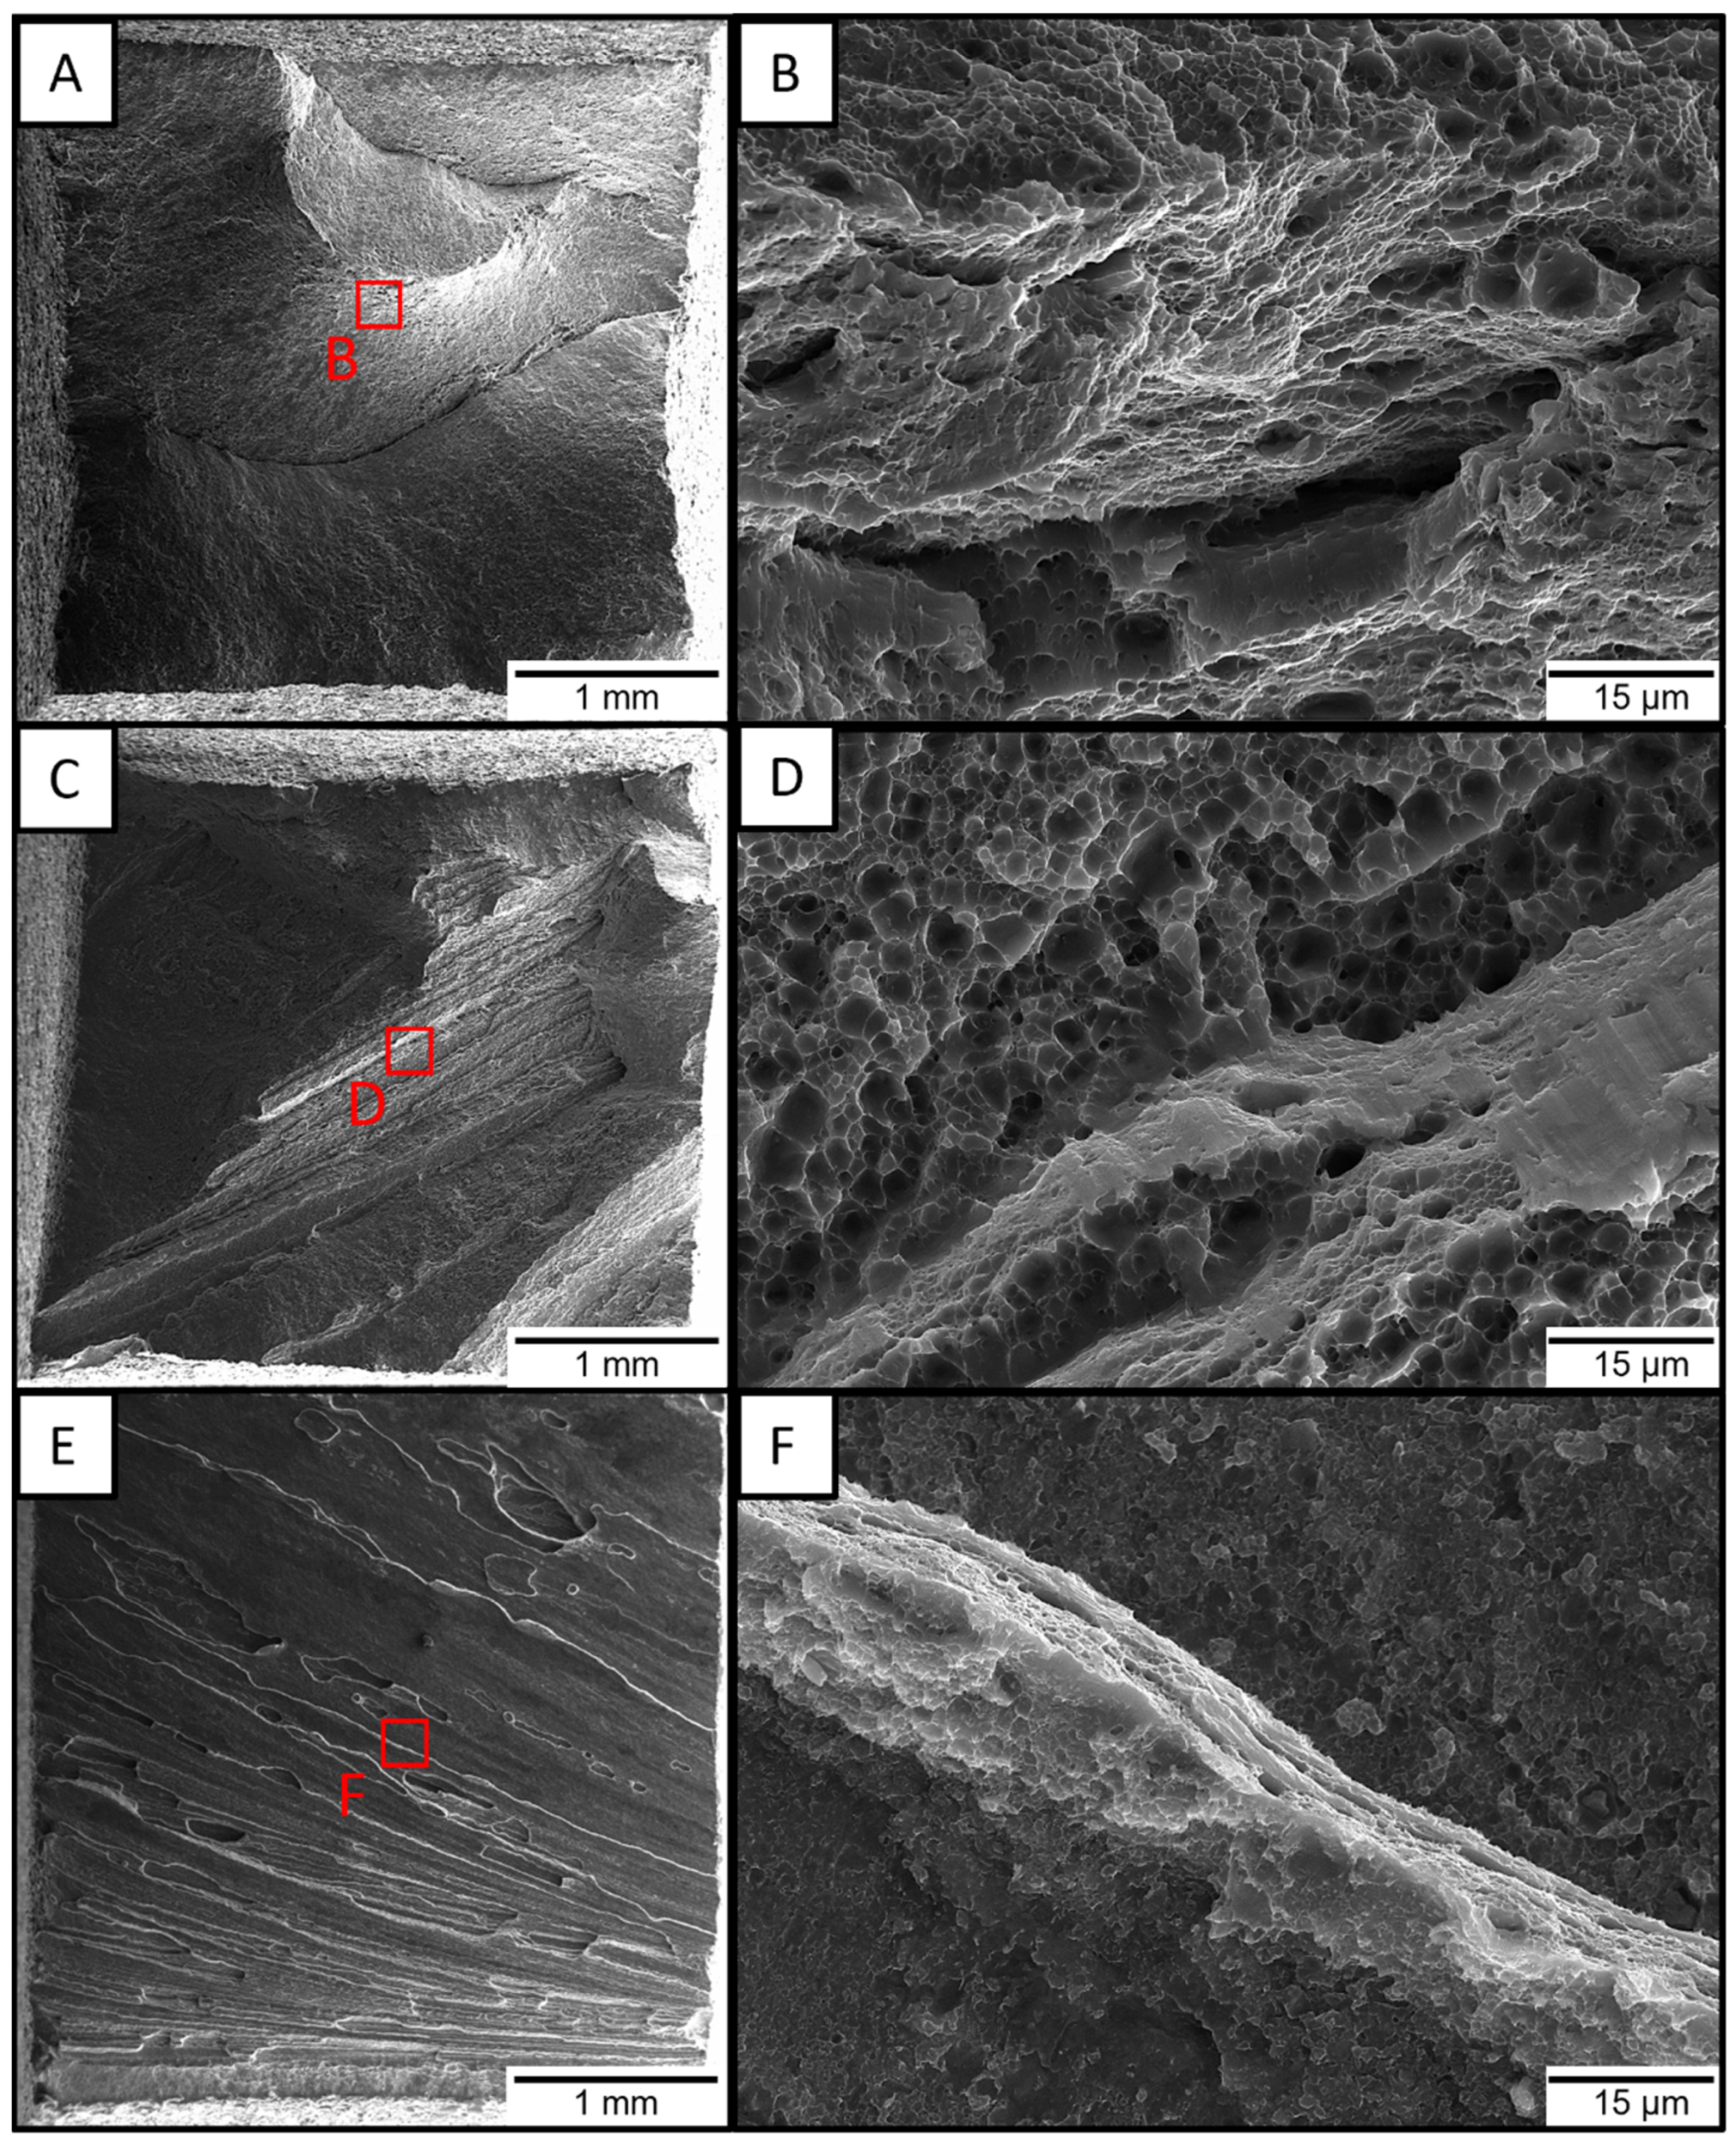
  • Reducing the deposition pitch from 4.46 rev/mm to 1.08 rev/mm resulted in a significant decrease in failure strain from 24.4% to 0.82%, with the failure mechanism shifting from a ductile failure to brittle failure, inferring that there is a critical deposition pitch inducing the ductile to brittle transition.
  • Near isotropic mechanical properties can be achieved in as-deposited AA7020, using a deposition pitch of at least 4 and a heat input of 1.39 MJ/m. Further investigations should be conducted to determine the critical deposition pitch and heat input for creating components with maximized build rates and isotropic-like properties.
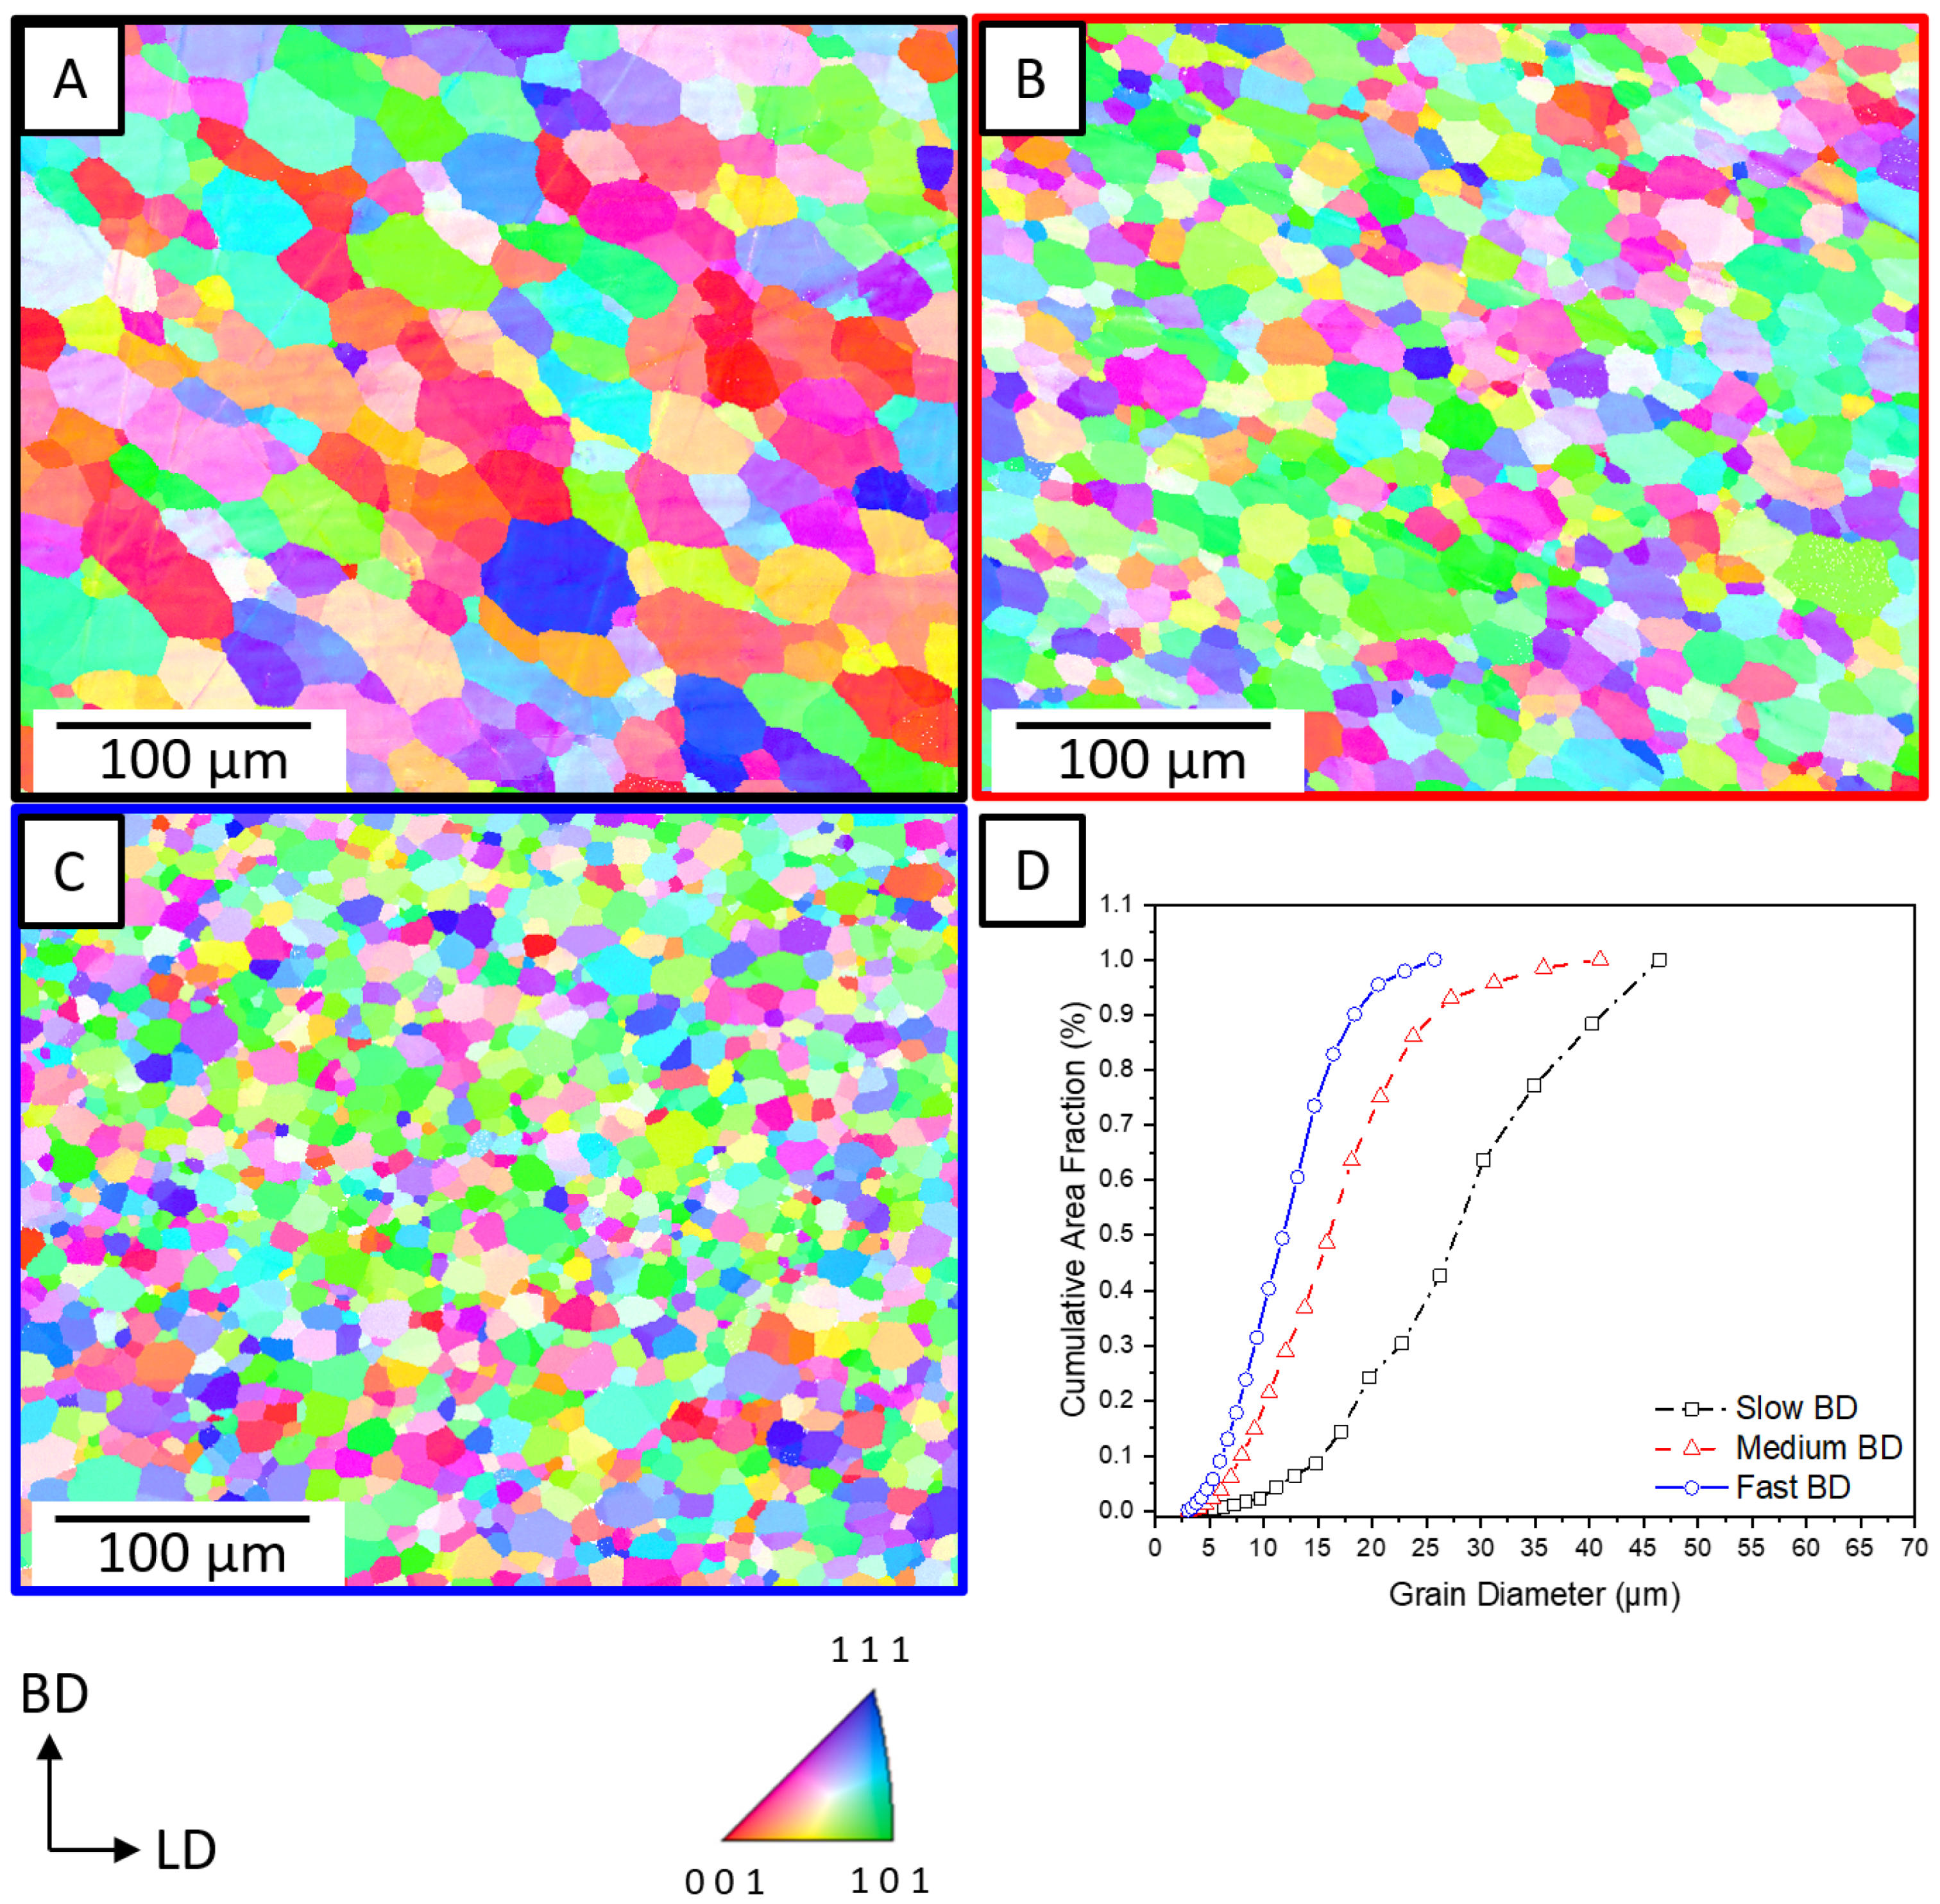
  • There is an inverse relationship between the deposition pitch, grain refinement, and BD failure strain. Increasing the deposition pitch from 4.18 rev/mm to 4.46 rev/mm and an increased grain size from 17.7 µm to 29.4 µm resulted in a 33.9% increase in failure strain. The inverse relationship between grain refinement and BD strain to failure suggests deposition pitch and heat input are the dominant factors in resulting BD mechanical properties.

Author Contributions

Conceptualization, M.B.W., N.I.P., J.B.H., M.M.M., L.N.B., P.G.A. and J.B.J.; formal analysis, M.B.W. and N.Z.; investigation, M.B.W.; methodology, M.B.W., L.N.B., P.G.A. and J.B.J.; validation, M.B.W. and N.Z.; interpretation and visualization, M.B.W., N.Z., N.I.P., M.M.M., M.R.K., A.D.L., P.G.A. and J.B.H.; original draft writing, M.B.W. and N.I.P.; original draft editing, M.B.W., N.Z., N.I.P., J.B.H., M.M.M., M.R.K., A.D.L., L.N.B., P.G.A. and J.B.J.; funding acquisition, M.M.M., M.R.K., A.D.L., L.N.B., P.G.A. and J.B.J. All authors have read and agreed to the published version of the manuscript.

Funding

Baylor University and the PONI Center gratefully acknowledge the financial support of the United States Army Research Office, grant number ARO-W911NF-15-2-0050.

Data Availability Statement

Supporting data may be requested from the corresponding author pending approval from the United Stated Army Research Office.

Acknowledgments

The authors would like to thank the Point-of-Need Innovations (PONI) Center at Baylor University for their support for this project. The authors would also like to thank Bernd Zechmann and the CMI (Center for Microscopy and Imaging) at Baylor University for technical support during microscopy and image analysis. Additionally, the authors would like to thank Ground Vehicle Systems Center (GVSC) for the financial support of this project. DISTRIBUTION A. Approved for public release; distribution unlimited. OPSEC#7669.

Conflicts of Interest

The authors declare no conflict of interest. One of the authors of this article is part of the Editorial Board of the journal. To avoid potential conflicts of interest, the responsibility for the editorial and peer-review process of this article lies with the journal’s other editors. Furthermore, the authors of this article were removed from the peer review process and had no and will not have any access to confidential information related to the editorial process of this article.

References

  1. Polmear, I. Light Alloys, 5th ed.; Elsevier Ltd.: Amsterdam, The Netherlands, 2017. [Google Scholar]
  2. Puydt, Q.; Flouriot, S.; Ringeval, S.; De Geuser, F.; Estevez, R.; Parry, G.; Deschamps, A. Relationship Between Microstructure, Strength, and Fracture in an Al-Zn-Mg Electron Beam Weld: Part II: Mechanical Characterization and Modeling. Met. Mater. Trans. A 2014, 45, 6141–6152. [Google Scholar] [CrossRef]
  3. Wang, X.; Li, B.; Li, M.; Huang, C.; Chen, H. Study of local-zone microstructure, strength and fracture toughness of hybrid laser-metal-inert-gas-welded A7N01 aluminum alloy joint. Mater. Sci. Eng. A 2017, 688, 114–122. [Google Scholar] [CrossRef]
  4. Maya-Johnson, S.; Santa, J.F.; Mejía, O.L.; Aristizábal, S.; Ospina, S.; Cortés, P.A.; Giraldo, J.E. Effect of the Number of Welding Repairs with GTAW on the Mechanical Behavior of AA7020 Aluminum Alloy Welded Joints. Met. Mater. Trans. B 2015, 46, 2332–2339. [Google Scholar] [CrossRef]
  5. Bloem, C.A.; Salvador, M.D.; Amigó, V.; Vicente, A. Fatigue behaviour of GMAW welded aluminium alloy AA7020. Weld. Int. 2009, 23, 773–777. [Google Scholar] [CrossRef]
  6. Hu, Y.; Wu, S.; Song, Z.; Fu, Y.; Yuan, Q.; Zhang, L. Effect of microstructural features on the failure behavior of hybrid laser welded AA7020. Fatigue Fract. Eng. Mater. Struct. 2018, 41, 2010–2023. [Google Scholar] [CrossRef]
  7. Zhou, L.; Hyer, H.; Thapliyal, S.; Mishra, R.S.; McWilliams, B.; Cho, K.; Sohn, Y. Process-Dependent Composition, Microstructure, and Printability of Al-Zn-Mg and Al-Zn-Mg-Sc-Zr Alloys Manufactured by Laser Powder Bed Fusion. Metall. Mater. Trans. Phys. Metall. Mater. Sci. 2020, 51, 3215–3227. [Google Scholar] [CrossRef]
  8. Babu, A.; Kairy, S.; Huang, A.; Birbilis, N. Laser powder bed fusion of high solute Al-Zn-Mg alloys: Processing, characterisation and properties. Mater. Des. 2020, 196, 109183. [Google Scholar] [CrossRef]
  9. Li, S.; Zhang, L.-J.; Ning, J.; Wang, X.; Zhang, G.-F.; Zhang, J.-X.; Na, S.-J. Microstructures and mechanical properties of Al–Zn–Mg aluminium alloy samples produced by wire + arc additive manufacturing. J. Mater. Res. Technol. 2020, 9, 13770–13780. [Google Scholar] [CrossRef]
  10. Essa, G.M.; Zakria, H.M.; Mahmoud, T.S.; Khalifa, T.A. Microstructure examination and microhardness of friction stir welded joint of (AA7020-O) after PWHT. HBRC J. 2019, 14, 22–28. [Google Scholar] [CrossRef]
  11. Gaafer, A.; Mahmoud, T.; Mansour, E. Microstructural and mechanical characteristics of AA7020-O Al plates joined by friction stir welding. Mater. Sci. Eng. A 2010, 527, 7424–7429. [Google Scholar] [CrossRef]
  12. Mishra, R.S.; Ma, Z.Y. Friction Stir Welding and Processing Vii; Elsevier: Amsterdam, The Netherlands, 2005; Volume 50. [Google Scholar] [CrossRef]
  13. Halak, R.M.; Rath, L.; Suhuddin, U.F.H.R.; dos Santos, J.F.; Klusemann, B. Changes in processing characteristics and microstructural evolution during friction extrusion of aluminum. Int. J. Mater. Form. 2022, 15, 24. [Google Scholar] [CrossRef]
  14. Rath, L.; Kallien, Z.; Roos, A.; dos Santos, J.F.; Klusemann, B. Anisotropy and mechanical properties of dissimilar Al additive manufactured structures generated by multi-layer friction surfacing. Int. J. Adv. Manuf. Technol. 2023, 125, 2091–2102. [Google Scholar] [CrossRef]
  15. Seidi, E.; Miller, S.F.; Carlson, B.E. Friction surfacing deposition by consumable tools. J. Manuf. Sci. Eng. 2021, 143, 120801. [Google Scholar] [CrossRef]
  16. Gandra, J.; Miranda, R.; Vilaça, P. Performance analysis of friction surfacing. J. Mater. Process. Technol. 2012, 212, 1676–1686. [Google Scholar] [CrossRef]
  17. Dilip, J.J.S.; Babu, S.; Rajan, S.V.; Rafi, K.H.; Ram, G.J.; Stucker, B.E. Use of friction surfacing for additive manufacturing. Mater. Manuf. Process. 2013, 28, 189–194. [Google Scholar] [CrossRef]
  18. Nishihara, T. Development of Friction Stir Forming. In THERMEC’2003, in Materials Science Forum; Trans Tech Publications Ltd.: Stafa-Zurich, Switzerland, 2003; Volume 426, pp. 2971–2978. [Google Scholar] [CrossRef]
  19. Lopez, J.J.; Williams, M.B.; Rushing, T.W.; Confer, M.P.; Ghosh, A.; Griggs, C.S.; Jordon, J.B.; Thompson, G.B.; Allison, P.G. A solid-state additive manufacturing method for aluminum-graphene nanoplatelet composites. Materialia 2022, 23, 101440. [Google Scholar] [CrossRef]
  20. Perry, M.E.; Griffiths, R.J.; Garcia, D.; Sietins, J.M.; Zhu, Y.; Yu, H.Z. Morphological and microstructural investigation of the non-planar interface formed in solid-state metal additive manufacturing by additive friction stir. Addit. Manuf. 2020, 35, 101293. [Google Scholar] [CrossRef]
  21. Garcia, D.; Hartley, W.D.; Rauch, H.A.; Griffiths, R.J.; Wang, R.; Kong, Z.J.; Zhu, Y.; Yu, H.Z. In situ investigation into temperature evolution and heat generation during additive friction stir deposition: A comparative study of Cu and Al-Mg-Si. Addit. Manuf. 2020, 34, 101386. [Google Scholar] [CrossRef]
  22. Beck, S.; Rutherford, B.; Avery, D.; Phillips, B.; Rao, H.; Rekha, M.; Brewer, L.; Allison, P.; Jordon, J. The effect of solutionizing and artificial aging on the microstructure and mechanical properties in solid-state additive manufacturing of precipitation hardened Al–Mg–Si alloy. Mater. Sci. Eng. A 2021, 819, 141351. [Google Scholar] [CrossRef]
  23. Jordon, J.; Allison, P.; Phillips, B.; Avery, D.; Kinser, R.; Brewer, L.; Cox, C.; Doherty, K. Direct recycling of machine chips through a novel solid-state additive manufacturing process. Mater. Des. 2020, 193, 108850. [Google Scholar] [CrossRef]
  24. Chen, H.; Meng, X.; Chen, J.; Xie, Y.; Wang, J.; Sun, S.; Zhao, Y.; Li, J.; Wan, L.; Huang, Y. Wire-based friction stir additive manufacturing. Addit. Manuf. 2023, 70, 103557. [Google Scholar] [CrossRef]
  25. Chen, H.; Society, A.W.; Chen, J.; Meng, X.; Xie, Y.; Huang, Y.; Xu, S.; Zhao, Y. Wire-based friction stir additive manufacturing toward field repairing. Weld. J. 2022, 101, 249S–252S. [Google Scholar] [CrossRef]
  26. Avery, D.Z.; Phillips, B.J.; Mason, C.J.T.; Palermo, M.; Williams, M.B.; Cleek, C.; Rodriguez, O.L.; Allison, P.G.; Jordon, J.B. Influence of Grain Refinement and Microstructure on Fatigue Behavior for Solid-State Additively Manufactured Al-Zn-Mg-Cu Alloy. Met. Mater. Trans. A 2020, 51, 2778–2795. [Google Scholar] [CrossRef]
  27. Mason, C.; Rodriguez, R.; Avery, D.; Phillips, B.; Bernarding, B.; Williams, M.; Cobbs, S.; Jordon, J.; Allison, P. Process-structure-property relations for as-deposited solid-state additively manufactured high-strength aluminum alloy. Addit. Manuf. 2021, 40, 101879. [Google Scholar] [CrossRef]
  28. Avery, D.Z.; Cleek, C.; Phillips, B.J.; Rekha, M.Y.; Kinser, R.P.; Rao, H.; Brewer, L.N.; Allison, P.G.; Jordon, J.B. Evaluation of Microstructure and Mechanical Properties of Al-Zn-Mg-Cu Alloy Repaired via Additive Friction Stir Deposition. J. Eng. Mater. Technol. 2022, 144, 031003. [Google Scholar] [CrossRef]
  29. Griffiths, R.J.; Petersen, D.T.; Garcia, D.; Yu, H.Z. Additive Friction Stir-Enabled Solid-State Additive Manufacturing for the Repair of 7075 Aluminum Alloy. Appl. Sci. 2019, 9, 3486. [Google Scholar] [CrossRef]
  30. Stubblefield, G.G.; Williams, M.B.; Munther, M.; Tew, J.Z.; Rowe, R.A.; Barkey, M.E.; Jordon, J.B.; Allison, P.G. Ballistic Evaluation of Aluminum Alloy (AA) 7075 Plate Repaired by Additive Friction Stir Deposition Using AA7075 Feedstock. J. Dyn. Behav. Mater. 2022, 9, 79–89. [Google Scholar] [CrossRef]
  31. Williams, M.B.; Cahalan, L.P.; Lopez, J.J.; Perez-Andrade, L.I.; Leonard, R.T., III; McDonnell, M.M.; Kelly, M.R.; Lalonde, A.D.; Brewer, L.N.; Jordon, J.B.; et al. Dynamic Behavior Characterization of Aluminum Alloy 7020 Manufactured Using the Additive Friction Stir Deposition Process. JOM 2023. [Google Scholar] [CrossRef]
  32. Phillips, B.J.; Williamson, C.J.; Kinser, R.P.; Jordon, J.B.; Doherty, K.J.; Allison, P.G. Microstructural and Mechanical Characterization of Additive Friction Stir-Deposition of Aluminum Alloy 5083 Effect of Lubrication on Material Anisotropy. Materials 2021, 14, 6732. [Google Scholar] [CrossRef]
  33. ASTM. ASTM E606/E606M-12; Standard Test Method for Strain-Controlled Fatigue Testing. ASTM International: West Conshohocken, PA, USA, 2017; pp. 1–16. [CrossRef]
  34. Gradl, P.R.; Mireles, O.R.; Protz, C.S.; Garcia, C.P. Metal Additive Manufacturing for Propulsion Applications; American Institute of Aeronautics and Astronautics, Inc.: Reston, VA, USA, 2022. [Google Scholar] [CrossRef]
  35. Williams, M.B.; Robinson, T.W.; Williamson, C.J.; Kinser, R.P.; Ashmore, N.A.; Allison, P.G.; Jordon, J.B. Elucidating the Effect of Additive Friction Stir Deposition on the Resulting Microstructure and Mechanical Properties of Magnesium Alloy WE43. Metals 2021, 11, 1739. [Google Scholar] [CrossRef]
  36. Pew, J.W.; Nelson, T.W.; Sorensen, C.D. Torque based weld power model for friction stir welding. Sci. Technol. Weld. Join. 2007, 12, 341–347. [Google Scholar] [CrossRef]
  37. Ilkhichi, A.R.; Soufi, R.; Hussain, G.; Barenji, R.V.; Heidarzadeh, A. Establishing Mathematical Models to Predict Grain Size and Hardness of the Friction Stir-Welded AA 7020 Aluminum Alloy Joints. Metall. Mater. Trans. B Process. Metall. Mater. Process. Sci. 2015, 46, 357–365. [Google Scholar] [CrossRef]
  38. Agrawal, P.; Haridas, R.S.; Yadav, S.; Thapliyal, S.; Dhal, A.; Mishra, R.S. Additive friction stir deposition of SS316: Effect of process parameters on microstructure evolution. Mater. Charact. 2023, 195, 112470. [Google Scholar] [CrossRef]
  39. Arbegast, W.; Hartley, P. Trends in welding research. In Proceedings of the Fifth International Conference on Trends in Welding Research, Pine Mountain, GA, USA, 1–5 June 1998. [Google Scholar]
  40. Merritt, G.R.; Williams, M.B.; Allison, P.G.; Jordon, J.B.; Rushing, T.W.; Cousin, C.A. Closed-Loop Temperature and Force Control of Additive Friction Stir Deposition. J. Manuf. Mater. Process. 2022, 6, 92. [Google Scholar] [CrossRef]
  41. Griffiths, R.J.; Perry, M.E.J.; Sietins, J.M.; Zhu, Y.; Hardwick, N.; Cox, C.D.; Rauch, H.A.; Yu, H.Z. A Perspective on Solid-State Additive Manufacturing of Aluminum Matrix Composites Using MELD. J. Mater. Eng. Perform. 2019, 28, 648–656. [Google Scholar] [CrossRef]
  42. Krishnan, K.N. On the formation of onion rings in friction stir welds. Mater. Sci. Eng. A 2002, 327, 246–251. [Google Scholar] [CrossRef]
  43. Byun, T.D.S.; Vastava, R.B. Solid-State Bonding of Superplastic Aluminum Alloy 7475 Sheet. 1985. Available online: https://ntrs.nasa.gov/citations/19860001777 (accessed on 2 March 2023).
  44. Sunwoo, A.; Lum, R. Superplastic deformation enhanced diffusion bonding of aluminum alloy 7475. Scr. Metall. Mater. 1995, 33, 639–644. [Google Scholar] [CrossRef]
Figure 1. (A) Schematic of the AFSD process used in this experiment. (B) Schematic depicting the specimen locations and dimensions used in this study.
Metals 13 01663 g001
Figure 2. Representative macroscopic image of the (A) Slow, (B) Medium, and (C) Fast builds. (D) Representative macroscopic image of the cross-section throughout the BD of each build.
Metals 13 01663 g002
Figure 3. Representative inverse pole figure maps of the (A) Slow, (B) Medium, and (C) Fast builds. (D) Cumulative area fraction comparison of the grain diameters for the Slow, Medium, and Fast builds.
Metals 13 01663 g003
Figure 4. (A) Quasi-static tensile stress–strain response [31] and (B) variation in failure strain and build rate with respect to deposition pitch.
Metals 13 01663 g004
Figure 5. A schematic depicting the key features of a (A) high and (B) low deposition pitch.
Metals 13 01663 g005
Figure 6. (A,B) Representative fracture surface of the Slow build post quasi-static tensile testing depicting microvoid nucleation and coalescence. (C,D) A representative facture surface of the Medium build showing multiple damage mechanisms. (E,F) A representative fracture surface of the Fast build experiencing layer delamination.
Metals 13 01663 g006
Figure 7. Diagram depicting various fundamental correlations between various AFSD process parameters.
Metals 13 01663 g007
Table 1. AA7020 chemical composition (in wt %).
AlZnMgZrSiFeCuMnCrTiTi + Zr
Bal.4.71.10.10.10.180.050.170.110.040.14
Table 2. AFSD AA7020 process parameters.
Specimen IDTool Rotational Rate
(ω, RPM)
Traverse Rate
(V, mm/min)
Actuator Feed Rate
(F, mm/min)
Deposition Pitch (rev/mm)Deposition Rate (Kg/h)
Slow22550.450.44.460.78
Medium425101.676.24.181.17
Fast275254152.41.082.33
Table 3. Heat input for varying AFSD AA7020 parameters.
Specimen IDTorque (N*m)Weld Power (W)Heat Input (MJ)Tpeak (°C)Grain Size
(µm)
Slow95.222432.6735029.4 ± 10.0
Medium53.023591.3936517.7 ± 7.5
Fast83.624070.5732112.7 ± 4.9
Table 4. Quasi-static mechanical properties.
Specimen IDYoung’s Modulus (GPa)YS (MPa)UTS (MPa)Failure Strain (%)
Slow BD57.512926224.4
Medium BD57.510924118.3
Fast BD63.01451570.82
Fast LD67.013026930.2
Disclaimer/Publisher’s Note: The statements, opinions and data contained in all publications are solely those of the individual author(s) and contributor(s) and not of MDPI and/or the editor(s). MDPI and/or the editor(s) disclaim responsibility for any injury to people or property resulting from any ideas, methods, instructions or products referred to in the content.

