Abstract
Shear-coupled grain boundary motion (SCGBM) is an important mechanism of plastic deformation, especially in the cases of ultrafine-grained or nanocrystalline materials at low temperatures. Much research work has been focused on the geometric rules of coupling, the grain boundary migration mechanisms, or the temperature effect of SCGBM, but the effect of the alloy atoms is seldom involved. In this work, molecular dynamics (MD) simulations were carried out to examine the SCGBM of the Σ17[110](223) and Σ9[110](221) grain boundaries (GBs) in iron-chromium alloys containing from 1 at.% to 9 at.% Cr. A constant shear velocity corresponding to 10 m/s parallel to the boundary plane was applied to the models. Our simulation results indicate that the critical stress of GB migration reduces due to the addition of Cr atoms for the Σ17(223) GB. As for the Σ9(221) GB, sliding occurs simultaneously with coupling in the shear process when the atomic amount of Cr reaches 3%. This phenomenon was also observed in the Σ9(221) GB in pure Fe when the temperature was elevated to 300 K, which was studied in our previous simulation work. The existence of new structural units was demonstrated to be responsible for the sliding of the grain boundary.
1. Introduction
Grain boundary (GB) motion has a significant effect on the mechanical response in polycrystalline materials [1,2,3]. In particular, shear-coupled grain boundary motion (SCGBM) is an important mode of plastic deformation [4,5,6,7]. The geometric model of SCGBM in face-centered cubic (FCC) metals was built by Cahn [8,9] and the coupling factor β, which depends entirely on the GB misorientation, is defined as the ratio between the amounts of migration and sliding.
Molecular dynamics (MD) simulation is extensively used in research on SCGBM [10,11,12,13,14] due to the limitations in the direct experimental measurement of GB mobility. Most MD simulation research on SCGBM has been focused on FCC metals such as copper, aluminum, and nickel [15,16,17,18,19]. In recent years, SCGBM has been investigated in body-centered cubic (BCC) metals as well. Huang et al. [20] performed simulations of the Σ5[001](310) GB in niobium under a series of shear stresses in different directions. The coupled motion was observed under shear deformation along the [10] direction, while pure sliding occurs when the shear stress is along the [00] direction. Dmitriev et al. [21] found that GB sliding accompanied by rearrangement of the atomic configuration in the GB region under shear loading caused the boundary to move in a direction orthogonal to the applied load. Recently, we reported structural unit transformation in the shear-coupled motion of the Σ9[110](221) and Σ17[110](223) GBs in α-iron, and showed that both the GBs move in the <111> mode [22].
Factors affecting SCGBM are of great interest and have been widely studied. Zhang et al. [23] demonstrated the close relationship between the transformation of the migration mode and the structure of GB. Ivanov et al. [11] stated that the character of GB motion changes from stick-slip to driven random walk at high temperatures. Yang et al. [24] studied the behavior of helium-loaded GBs in BCC Fe under shear deformation and concluded the loaded self-interstitial atoms reduce the critical stress of the coupled GB motion in the Σ3 GB, but increase the critical stress in the Σ11 GB. The effect of temperature was investigated in our previous work [22]. We found that the critical temperature for GB sliding accompanied by coupling of the Σ9(221) GB in α-iron was about 300 K, which is much lower than that of the Σ17(223) GB. Further, we also demonstrated that the strain rate has almost no influence on the SCGBM mechanism. However, the effect of adding substitutional alloy atoms on SCGBM in BCC metals is not well-understood at present. Hence, MD simulations of the SCGBM in iron-chromium alloys were investigated in this study.
2. Computational Model
Two [110] symmetric tilt GBs in α-iron Σ17[110](223) (θ = 86.63°) and Σ9[110](221) (θ = 141.06°) were constructed by joining two separate crystals with specific crystallographic orientations [13]. The dimensions of the simulation box along the x, y, and z directions were set as about 233.09 Å × 306.60 Å × 20.19 Å for the Σ17(223) GB and 230.16 Å × 291.57 Å × 20.19 Å for the Σ9(221) GB; each GB contained approximately 120,000 atoms. Two slabs, at the top and bottom of the simulation cell (the black outlined blocks in Figure 1), were designed to provide a rigid boundary condition in the z-direction. The thickness of each slab was slightly larger than the cutoff radius of atomic interactions. During the simulation, atoms belonging to the rigid border slabs were frozen in their perfect lattice positions, while all other atoms in the model were free to move. By substituting free iron atoms with chromium atoms at random with the expected composition ratio used in Ref. [25], iron-chromium alloys models in which the atomic amounts of chromium are 1%, 3%, 5%, 7%, and 9% can be prepared. It should be noted that the concentration of impurities at the grain boundary is often different than in the bulk, however, in the current work only the effect of Cr concentration on the grain boundary movement was concerned, thus the grain boundary segregation of chromium was ignored in the simulation model. After minimizing the total energy of the system to obtain the optimized structure, the systems were further equilibrated for 40 ps in the isothermal-isobaric NPT ensemble.
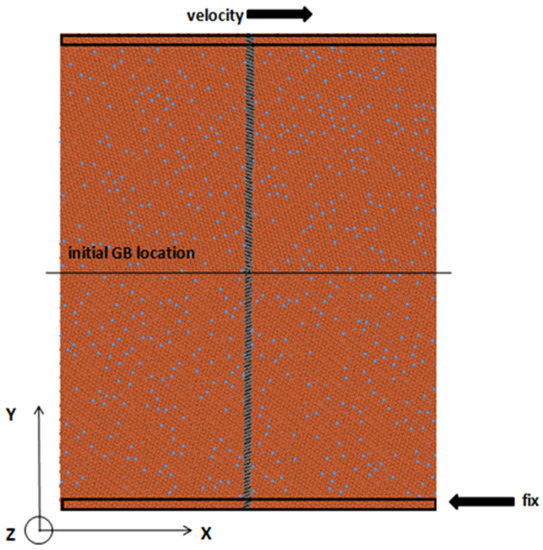
Figure 1.
The structure of the Σ9[110](221) GB in the Fe-5 at.% Cr alloy. Red spots represent Fe atoms and light gray spots represent Cr atoms. Dark gray atoms initially perpendicular to the GB interface are selected for marking SCGBM.
The simulations of the alloy bicrystal were performed using the 2BM potential for the Fe-Cr binary system [26]. Periodic boundary conditions were applied along the x and z directions while a free-surface boundary condition was applied for the y direction during the MD simulations of SCGBM. A constant velocity corresponding to 10 m/s was applied to the top part of the block, while the bottom block was held fixed. A slab of atoms (dark gray atoms in Figure 1) perpendicular to the GB interface was colored to mark the movement of atoms in the SCGBM. The simulations were performed at 10 K to avoid thermal effects. The MD time step was set to 1 fs and the total simulation time was 0.7-0.8 ns. The large-scale atomic/molecular massively parallel simulator (LAMMPS) code [27] was used to carry out the simulations. The visualization of atomic trajectories and GB structures was performed with the OVITO [28] package.
3. Results
3.1. SCGBM of Σ17[110](223) GBs in the Fe-X at.% Cr Alloys (X = 1, 3, 5, 7, and 9)
SCGBM was observed in the Σ17(223) GB in pure Fe under shear conditions according to the results of our previous research [22], and the same phenomenon could be observed in the Σ17(223) GBs in Fe-Cr alloys. Figure 2a is an MD snapshot at about 450 ps for the Σ17(223) GB in the Fe-1 at.% Cr alloy; the black horizontal line represents the new position of the GB after migration. The marked line between the initial position of the grain boundary and the new position is deflected, which means that the GB atoms were translated along the boundary. Figure 2b shows the GB position and the shear stress as functions of the simulation time. The original boundary position is defined as zero and the negative value means the boundary moved along the -y direction. It can be seen that the GB motion exhibits a “stop-and-go” character, making repeated downward steps in the plots. When the GB is stationary, the stress builds up until the accumulated stress is large enough to drive the boundary to move; then, permanent plastic deformation occurs, leading to a sudden drop in the shear stress. From the perspective of energy, the GB jumps abruptly to the equilibrium position and remains in this configuration until the next local energy minimum is reached.
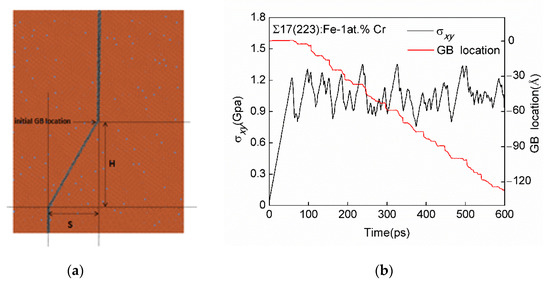
Figure 2.
(a) MD snapshot at about 450 ps and (b) shear stress (σxy)-time plot and GB location-time plot for the ∑17(223) GB in the Fe-1 at.% Cr alloy.
As stated in the introduction, the coupling factor β is defined as the ratio of the upper grain translation velocity over the GB normal velocity, or equivalently, the ratio of the displacements of GB translation S to migration H, as shown in Equation (1).
Through calculation, values of β of the Σ17(223) GBs in different alloys are approximately −0.412. This value is inconsistent with that of the Σ17(223) GB in pure Fe [22], indicating that the existence of Cr does not change the coupling mode and has little impact on the coupling factor.
However, the critical stress of GB migration is strongly dependent on the concentration of Cr atoms. It can be seen from Figure 3a that the stress-time curves display smaller drops in stress and shorter periods for the “stop-and-go” motion cycle with increasing Cr amount. This indicated that the atoms at the boundaries in Fe-Cr alloys have stronger mobility compared to the grain boundary in pure Fe, and thus the boundaries accumulate and release less elastic energy in one period. Correspondingly, the first step of grain boundary migration in pure Fe appears later, and the magnitude of GB displacement in each migration step is larger than that of the GBs in Fe-Cr alloys, as shown in Figure 3b.
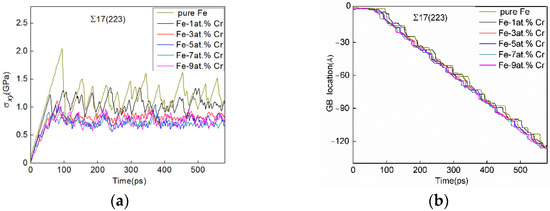
Figure 3.
Shear process of the Σ17(223) GBs in pure Fe and Fe-X at.% Cr alloys (X = 1, 3, 5, 7, and 9). (a) shear stress (σxy)-time curves and (b) GB location-time curves.
3.2. SCGBM of Σ9[110](221) GBs in Fe-X at.% Cr Alloys (X = 1, 3, 5, 7, and 9)
The shear stress and GB location as functions of the simulation time for the Σ9(221) GBs in Fe-Cr alloys are shown in Figure 4. Similar to the cases of the Σ17(223) GBs, the movement of the Σ9(221) GBs shows the “stop-and-go” characteristic, and the shear stress displays “stick-slip” behavior. However, the magnitude of GB displacement and the critical shear stress for migration shows some differences depending on the concentration of Cr. The position plots of the grain boundaries in the Fe-1 at.% Cr alloy and pure Fe show regular steps. Their coupling factors can be calculated by Equation (1), and they are both equal to 0.591. This result agrees well with our previous finding [22] that the Σ9(221) GB moved in the <111> mode. When the concentration of Cr is 3% and above, the stagnation time obviously increased and the distance of motion in the direction perpendicular to the GB was greatly reduced; the mobility of the atoms at the boundaries was diminished, and thus the elastic strain energy accumulated to a larger value within each period.
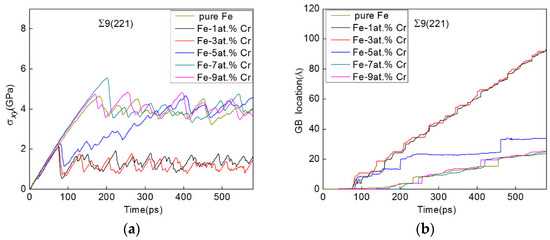
Figure 4.
Shear process of the Σ9(221) GB in pure Fe and Fe-X at.% Cr alloys (X = 1, 3, 5, 7, and 9). (a) shear stress (σxy)-time curves and (b) GB location-time curves.
GB motion includes migration, relative translation parallel to the GB plane coupled to migration, GB sliding, and grain rotation [8]. The ratio of the distance S that each GB moves in the horizontal direction and the distance H moved in the normal direction was calculated, and the results are shown in Figure 5a. The blue horizontal line on the plot represents the value of the ideal coupling factor β<111>, calculated using Equation (1). It is evident from the figure that the values of S/H increase significantly when the atomic amount of Cr is 3% or higher, i.e., the GBs no longer move with ideal coupling factor. A large amount of sliding in the horizontal direction that was not coupled to migration occurred and the mechanism will be discussed in the following section.
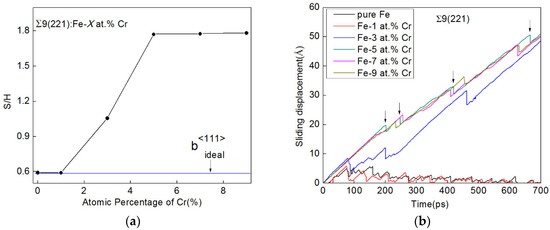
Figure 5.
(a) Values of S/H and (b)sliding displacement-time curves of the Σ9(221) GBs in pure Fe and Fe-X at.% Cr alloys (X = 1, 3, 5, 7, and 9).
Cahn et al. [8,9] proposed that the expression for β should be modified as given in Equation (2) when there is both coupling and sliding:
where vs is the velocity of GB sliding and vn is the migration velocity which can be obtained from Figure 4b (the GB location-time curve). The translation velocity vp is determined by the shear rate, therefore vs can be deduced on the basis of β = 0.591 of the Σ9(221) GB. Figure 5b shows the relationship between the sliding displacement and the simulation time. It is indicated that the sliding velocities of the GBs in pure Fe and the Fe-1 at.% Cr alloy are negligible, except those for the fluctuations in the first few steps. However, the sliding velocities of the GBs in the Fe-X at.% Cr alloys (X = 3, 5, 7, and 9) are much more considerable. There are periodic left-shifts in the sliding, as indicated by the arrows in the figure, taking the grain boundary in the Fe-5 at.% Cr alloy as an example. Interestingly, each time a displacement to the left was completed, the boundary jumped to a new position in the y direction (see Figure 4b). This phenomenon is caused by the transition structure of the GB which will be discussed in Section 4.1.
4. Discussion
4.1. Relationship between GB Structure and GB Motion
Figure 6 illustrates the initial atomic arrangement of the Σ9(221) GBs in the Fe-1 at.% Cr, Fe-3 at.% Cr, and Fe-9 at.% Cr alloys in (a), (b), and (c), respectively. For convenience, the structural units were defined to describe the GB structures. The boundary of the Fe-1 at.% Cr alloy consists of the kite-shaped unit “A” and the linear unit “C” and they are arranged alternately, as shown in Figure 6a. This structure shows good agreement with that of the Σ9(221) GB in pure Fe reported in our previous article [22]. When the atomic amount of Cr is 3% or more, the grain boundary can no longer maintain its original structure. A new unit “B”, which is a polygon of ten atoms surrounding 1 or 2 atoms, and a new unit “D” appear. It was reported by Zhang et al. [23] that structural units like B and D can also be observed when Σ5[001](310) GB in aluminum was heated to 300 K. Some |BD| units are randomly inserted between units A and C, and as a result, the GB is more disordered. With the increasing concentration of Cr, units B and D take a larger proportion in the boundary region. It can be seen from Figure 6c that the number of structural units B, B variant (B’), and D greatly increased when the concentration of Cr was 9%, and the original structure of the GB was completely lost. By calculating the average value of the atomic symmetric central parameter [29] of each grain boundary, the disorder in each GB can be quantitatively analyzed. Asymmetric central parameter Ci for each atom may be defined as follows:
where (j,j′) are six pairs of nearest-neighbor atoms with central symmetry centered on the atom-i. The results are shown in Figure 7.
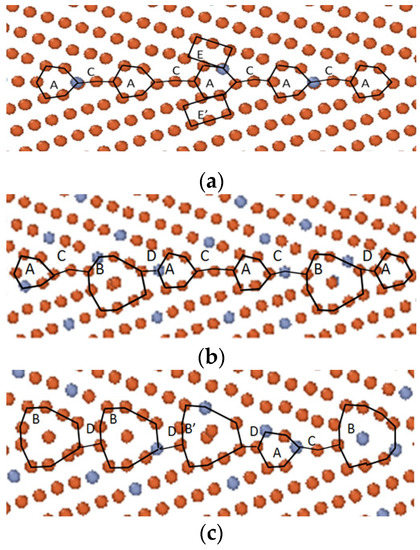
Figure 6.
Structures of the Σ9(221) GBs in the Fe-X at.% Cr alloys (X = 1, 3, and 9). (a) X = 1, (b) X = 3, and (c) X = 9. Red circles represent Fe atoms and light gray circles represent Cr atoms.
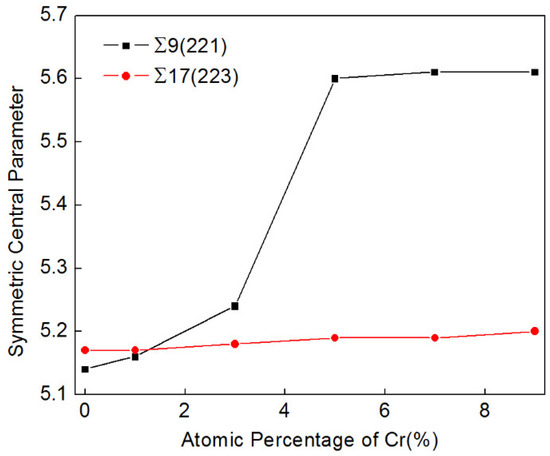
Figure 7.
Atomic symmetric central parameters of the Σ9(221) GBs and Σ17(223) GBs in pure Fe and Fe-X at.% Cr alloys (X = 1, 3, 5, 7, and 9).
It can be inferred from our simulation results that the shear-coupled grain boundary motion is sensitive to the local boundary structure. An increased proportion of Cr can facilitate GB structural transformation and, therefore, change its coupling mode. For the boundary of the |AC.AC| structure shown in Figure 6a, the rectangular structural unit E in the grain changes its shape and transforms into the unit A by relative atomic displacements, while the original unit A is simultaneously transformed into the unit E’. Note that the latter is a mirror reflection of the unit E. Thus, the coupling motion proceeds. However, this mode of motion is not applicable to the GBs that contain structural units B and D and for which sliding along the GB plane occurs to achieve deformation. Figure 8a displays the GB location and the system energy as functions of time for the Σ9(221) GB in the Fe-5 at.% Cr alloy. The GB location-time plot reveals that there is a plateau before each migration. Taking the first plateau as an example, its starting point and ending point are marked as t0 and t1. The continuous increase of the system energy over the period between t0 and t1 leads to the inference that there may be a transition state before the migration. Figure 8b,c are snapshots of the local structure of the Σ9(221) GB in the Fe-5 at.% Cr alloy at t0 and t1, representing the initial state and transition state, respectively. Some atoms are marked by different numbers; index 1-12 is for the structural unit B1 and index 13-24 is for the unit B2. As shown in Figure 8b, θ is the angle between the [110] direction vector and the normal to the boundary in the initial state. In the transition state, however, the value of θ becomes zero. This indicates that the atoms in the GB plane as well as all the atoms below them moved to the left, resulting in the alignment of atoms-10, -9, and -8 along the <110> direction in the structural unit B1. Similar trends are found in the structural unit B2 and other structural units B, which are not shown in the figure. This explains why there is a sudden drop near 200 ps (t1) in the sliding displacement-time plot of the Σ9(221) GB in the Fe-5 at.% Cr alloy.
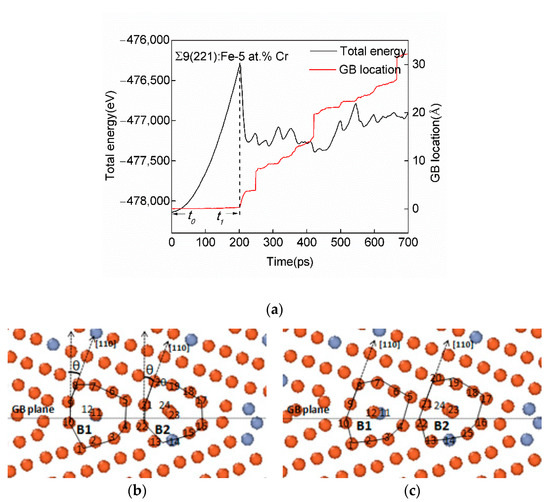
Figure 8.
(a) System energy-time and GB location-time plots, and (b) the initial and (c) transition states of the Σ9(221) GB in the Fe-5 at.% Cr alloy. Red circles represent Fe atoms and light gray circles represent Cr atoms.
In contrast with the Σ9(221) GB, the addition of Cr atoms has minimal impact on the structure of the Σ17(223) GB, as shown in Figure 7. For example, we can see from Figure 9 that the local structure of the Σ17(223) GB in the Fe-9 at.% Cr alloy has the regular |AA B.A A’B’| structure which is identical to the boundary in pure Fe [22]. Moreover, its transformation of structural units in coupled motion is also consistent with the Σ17(223) GB in pure Fe: the structural unit C, close to the perfect lattice below the GB region, is transformed into the unit A’, and the original A’ is transformed into the unit A. Hence, a new GB plane was formed between the units A and A’, and the boundary jumped a step in the y direction.
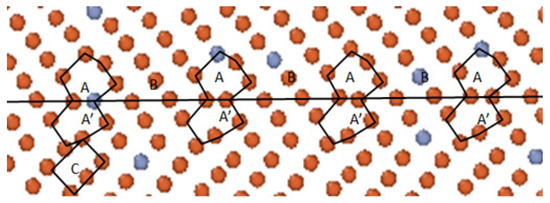
Figure 9.
Structure of the Σ17(223) GB in the Fe-9 at.% Cr alloy. Red circles represent Fe atoms and light gray circles represent Cr atoms.
4.2. Comparison of the Effects of Impurities and Temperature on SCGBM
By comparison of the critical stress trends over temperature and the concentration of Cr, we found that the effect of adding Cr atoms has some commonalities with that of elevating the temperature for the Σ17(223) and Σ9(221) GBs in pure Fe, as studied in our previous work [22].
For the Σ17(223) GB in pure Fe, the critical stress of migration is reduced both with the increase of temperature and the concentration of Cr, as shown in Figure 10a,b. The rise of temperature and the addition of Cr atoms both increased the movability of atoms at boundaries via increasing the degree of disorder of GBs, and the kinetic energy of atoms was also increased at higher temperatures.
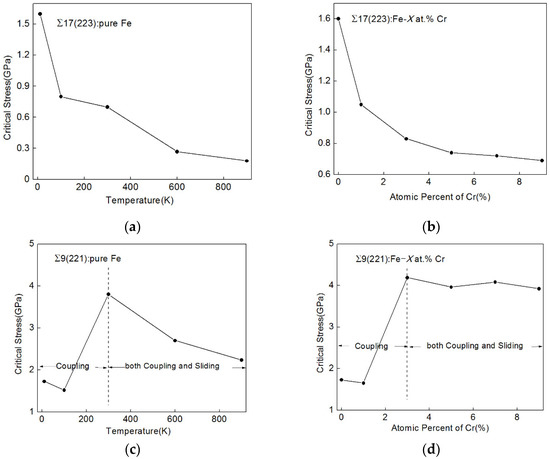
Figure 10.
Critical stress of migration of (a) the Σ17(223) GB in pure Fe at five different temperatures and (b) the Σ17(223) GBs in pure Fe and Fe-X at.% Cr alloys (X = 1, 3, 5, 7, and 9) at 10 K and (c) the Σ9(221) GB in pure Fe at five different temperatures, and (d) the Σ9(221) GBs in pure Fe and Fe-X at.% Cr alloys (X = 1, 3, 5, 7, and 9) at 10 K.
Figure 10c,d display how the critical stress of migration of the Σ9(221) GB changes over temperature and the concentration of Cr. When the concentration of Cr is increased to 3%, the critical stress of GB migration increases sharply as a result of the occurrence of GB sliding, as discussed in Section 3.2. A similar phenomenon can be observed in the Σ9(221) GB in pure Fe when the simulation temperature was raised to 300 K [22]. In order to investigate whether the mechanism of sliding caused by temperature is relevant to GB structure, we relaxed the Σ9(221) GB in pure Fe at 100, 300, 600, and 900 K to obtain the equilibrium states and some of the B and D structural units shown in Figure 6b were observed at 300 K and above in the pure Fe. This indicates temperature alters the GB motion behavior by altering GB structure, which is similar to the effect of adding Cr atoms. When sliding is involved, the critical stress of GB migration continues to decrease upon the rising temperature, while the decline induced by the increase of the concentration of Cr is slighter. This is because the temperature has a dynamical effect on grain boundaries. In addition, Cr atoms were randomly arranged in our simulation work. If solute segregation to boundaries occurs, the behavior of GB motion may be different and this is what we will study next.
5. Conclusions
In this study, the coupling motion of the Σ17[110](223) and Σ9[110](221) GBs in Fe-Cr alloys was simulated at a temperature of 10K using a molecular dynamics method to investigate the effect of the alloy atom Cr on the shear-coupled grain boundary motion in α-Fe. For the Σ17(223) GB, the addition of Cr atoms results in the reduction of the critical stress of migration. In the Σ9(221) GB, there is both coupling and sliding in the shear process when the atomic amount of Cr reaches 3%. New structural units B and D were observed in the Σ9(221) GBs of the Fe-X at.% Cr alloys (X = 3, 5, 7, and 9), and the new local structures were shown to be responsible for the sliding of the GB. It is demonstrated by the simulation that the alloy atom Cr does not change the coupling mode and has little effect on the coupling factor. Further, our simulation results indicate that the effect of adding Cr atoms has some commonalities with that of elevating the temperature for the Σ17(223) and Σ9(221) GBs, as studied in our previous work [22]. The experimental research on the effect of alloy atoms on SCGBM was seldom reported, and we hope that the present simulation work can inspire further experiments.
Author Contributions
Conceptualization, H.H.; methodology, H.H.; software, H.H and J.Y.; validation, H.H. and Z.B.; investigation, X.Y. and Z.B; writing—original draft preparation, X.Y. and Z.B.; writing—review and editing, J.Y.; supervision, H.H. All authors have read and agreed to the published version of the manuscript.
Funding
This research received no external funding.
Institutional Review Board Statement
Not applicable.
Informed Consent Statement
Not applicable.
Data Availability Statement
The data presented in this study are contained within the article.
Conflicts of Interest
The authors declare no conflict of interest.
References
- Li, C.H.; Edwards, E.H.; Washburn, J.; Parker, E.R. Stress-induced movement of crystal boundaries. Acta Metall. 1953, 1, 223–229. [Google Scholar] [CrossRef]
- Molodov, D.A.; Mishin, Y. Chapter 9: Plastic Deformation by Grain Boundary Motion: Experiments and Simulations. In Microstructural Design of Advanced Engineering Materials; Wiley-VCH Verlag GmbH & Co. KGaA: Weinheim, Germany, 2013; pp. 201–233. [Google Scholar]
- Rupert, T.J.; Gianola, D.S.; Gan, Y.; Hemker, K.J. Experimental observations of stress-driven grain boundary migration. Science 2009, 326, 1686–1690. [Google Scholar] [CrossRef] [PubMed]
- Niu, L.L.; Zhang, Y.; Shu, X.; Gao, F.; Jin, S.; Zhou, H.B.; Lu, G.H. Shear-coupled grain boundary migration assisted by unusual atomic shuffling. Sci. Rep. 2016, 6, 23602. [Google Scholar] [CrossRef] [PubMed]
- Mompiou, F.; Caillard, D.; Legros, M. Grain boundary shear–migration coupling—I. In situ TEM straining experiments in Al polycrystals. Acta Mater. 2009, 57, 2198–2209. [Google Scholar] [CrossRef]
- Caillard, D.; Mompiou, F.; Legros, M. Grain-boundary shear-migration coupling. II. Geometrical model for general boundaries. Acta Mater. 2009, 57, 2390–2402. [Google Scholar] [CrossRef]
- Berbenni, S.; Paliwal, B.; Cherkaoui, M. A micromechanics-based model for shear-coupled grain bondary migration in bicrystals. Int. J. Plast. 2013, 44, 68–94. [Google Scholar] [CrossRef]
- Cahn, J.W.; Mishin, Y.; Suzuki, A. Coupling grain boundary motion to shear deformation. Acta Mater. 2006, 54, 4953–4975. [Google Scholar] [CrossRef]
- Cahn, J.W.; Taylor, J.E. A unified approach to motion of grain boundaries, relative tangential translation along grain boundaries, and grain rotation. Acta Mater. 2004, 52, 4887–4898. [Google Scholar] [CrossRef]
- Hoyt, J.J. Atomistic simulations of grain and interphase boundary mobility. Model. Simul. Mater. Sci. Eng. 2014, 22, 033001. [Google Scholar] [CrossRef]
- Ivanov, V.A.; Mishin, Y. Dynamics of grain boundary motion coupled to shear deformation: An analytical model and its verification by molecular dynamics. Phys. Rev. B Condens. Matter 2008, 78, 064106. [Google Scholar] [CrossRef] [Green Version]
- Trautt, Z.T.; Adland, A.; Karma, A.; Mishin, Y. Coupled motion of asymmetrical tilt grain boundaries: Molecular dynamics and phase field crystal simulations. Acta Mater. 2012, 60, 6528–6546. [Google Scholar] [CrossRef]
- Aramfard, M.; Deng, C. Interaction of shear-coupled grain boundary motion with crack: Crack healing, grain boundary decohesion, and sub-grain formation. J. Appl. Phys. 2016, 119, 085308. [Google Scholar] [CrossRef]
- Bringuier, S.; Manga, V.R.; Runge, K.; Deymier, P.; Muralidharan, K. An atomic scale characterization of coupled grain boundary motion in silicon bicrystals. Philos. Mag. 2015, 95, 4118–4129. [Google Scholar] [CrossRef]
- Wan, L.; Wang, S. Shear response of the Σ11<100>{131} symmetric tilt grain boundary studied by molecular dynamics. Model. Simul. Mater. Sci. Eng. 2009, 17, 45008–45025. [Google Scholar] [CrossRef]
- Wan, L.; Wang, S. Shear response of the Σ9<100> {221} symmetric tilt grain boundary in fcc metals studied by atomistic simulation methods. Phys. Rev. B 2010, 82, 214112. [Google Scholar] [CrossRef]
- Zhang, L.; Lu, C.; Tieu, K.; Zhao, X.; Pei, L. The shear response of copper bicrystals with Σ11 symmetric and asymmetric tilt grain boundaries by molecular dynamics simulation. Nanoscale 2015, 7, 7224–7233. [Google Scholar] [CrossRef] [PubMed]
- Gorkaya, T.; Molodov, D.A.; Gottstein, G. Stress-driven migration of symmetrical <1 0 0> tilt grain boundaries in Al bicrystals. Acta Mater. 2009, 57, 5396–5405. [Google Scholar] [CrossRef]
- Shiga, M.; Shinoda, W. Stress-assisted grain boundary sliding and migration at finite temperature: A molecular dynamics study. Phys. Rev. B 2004, 70, 054102. [Google Scholar] [CrossRef]
- Huang, B.W.; Shang, J.X.; Liu, Z.H.; Chen, Y. Atomic simulation of bcc niobium Σ5 <001> {310} grain boundary under shear deformation. Acta Mater. 2014, 77, 258–268. [Google Scholar] [CrossRef]
- Dmitriev, A.I.; Nikonov, A.Y. Features of the behavior of symmetrical tilt grain boundaries in BCC and FCC metals under shear loading. Molecular dynamics study. AIP Conf. Proc. 2014, 1623, 127–130. [Google Scholar]
- Yin, J.; Wang, Y.; Yan, X.; Hou, H.; Wang, J.T. Atomistic simulation of shear-coupled motion of [110] symmetric tilt grain boundary in α-iron. Comput. Mater. Sci. 2018, 148, 141–148. [Google Scholar] [CrossRef]
- Zhang, L.; Lu, C.; Michal, G.; Tieu, K.; Zhao, X.; Deng, G. Influence of temperature and local structure on the shear-coupled grain boundary migration. Phys. Status Solidi B 2017, 254, 1600477. [Google Scholar] [CrossRef]
- Gao, F.; Yang, L.; Heinisch, H.L.; Kurtz, R.J. Dynamics of Helium-Loaded Grain Boundaries under Shear Deformation in α-Fe; US Department of Energy: Washington, DC, USA, 2014.
- Shibuta, Y.; Takamoto, S.; Suzuki, T. Dependence of the grain boundary energy on the alloys composition in the bcc iron–chromium alloys: A molecular dynamics study. Comput. Mater. Sci. 2009, 44, 1025–1029. [Google Scholar] [CrossRef]
- Bonny, G.; Pasianot, R.C.; Terentyev, D.; Malerba, L. Iron chromium potential to model high-chromium ferritic alloys. Philos. Mag. 2011, 91, 1724–1746. [Google Scholar] [CrossRef]
- Plimpton, S. Fast Parallel Algorithms for Short-Range Molecular Dynamics. J. Comput. Phys. 1995, 117, 1–19. [Google Scholar] [CrossRef]
- Stukowski, A. Visualization and analysis of atomistic simulation data with OVITO-the Open Visualization Tool. IEEE Trans. Fuzzy Syst. 2010, 23, 2154–2162. [Google Scholar] [CrossRef]
- Kelchner, C.L.; Plimpton, S.J.; Hamilton, J.C. Dislocation nucleation and defect structure during surface indentation. Phys. Rev. B 2011, 58, 11085–11088. [Google Scholar] [CrossRef]
Publisher’s Note: MDPI stays neutral with regard to jurisdictional claims in published maps and institutional affiliations. |
© 2022 by the authors. Licensee MDPI, Basel, Switzerland. This article is an open access article distributed under the terms and conditions of the Creative Commons Attribution (CC BY) license (https://creativecommons.org/licenses/by/4.0/).