Article

Effect of TiN on Sulfide Morphology of Non-Quenched and Tempered Steel

1
Collaborative Innovation Center of Steel Technology, University of Science and Technology Beijing, Beijing 100083, China
2
School of Urban Economics and Management, Beijing University of Civil Engineering and Architecture, Beijing 100044, China
*
Author to whom correspondence should be addressed.
Metals 2022, 12(9), 1402; https://doi.org/10.3390/met12091402
Submission received: 7 July 2022 / Revised: 9 August 2022 / Accepted: 19 August 2022 / Published: 24 August 2022

Abstract

:
In this paper, non-quenched and tempered steel was selected to observe sulfide inclusions in as-cast and forged steel with different Ti and N contents, and analyzed the influence of TiN on the precipitation, morphology, distribution and composition of MnS. The precipitation of MnS and TiN in liquid-phase, solid–liquid two-phase region and solid phase was comparatively analyzed from a thermodynamic perspective, and the effect of the thermodynamic precipitation sequence on composite sulfide was explored. It was found that the change in Ti content had little effect on the morphology of sulfide in its as-cast state, and the composite sulfide was more spindle-like in the forged state. The increase in Ti and N content will increase the content of composite sulfide containing TiN in the steel, especially the number of MnS with TiN as the nucleation core. The initial precipitation temperature of TiN is higher than that of MnS, which provides a thermodynamic explanation for the existence of composite manganese sulfide containing TiN. Titanium treatment provides a new way to improve sulfide morphology.

1. Introduction

Non-quenched and tempered steel with high cleanliness can save energy [1,2], and is often used in the automobile industry to manufacture crankshaft and other parts [3]. It can be produced by ingot casting or continuous casting, and continuous casting is the main means of production. Usually, a certain amount of sulfur (0.02–0.09%) is added in the production of non-quenched and tempered steel to improve its cutting performance and processability [4]. However, the improper control of sulfide morphology will damage the comprehensive properties of steel, because the formation of long strip sulfide will lead to anisotropy in steel, while sulfide aggregation distribution will also reduce the strength and toughness of steel, seriously affecting its mechanical properties [5]. Therefore, it is particularly important to master the formation and evolution law of sulfide and reasonably control the morphology and distribution of sulfide in steel.
Many scholars have studied the sulfides’ morphology control. Some scholars divided the morphology of sulfides in as-cast steel into four categories [6,7,8]: Class I (spherical), Class II (fan or chain), Class III (polyhedron) and Class IV (irregular shape). Type II sulfide will significantly deteriorate the properties of steel, and the formation of type II sulfide should be minimized. Some scholars have tried to improve the sulfide morphology by controlling the content of each element in the steel: Bigelow et al. studied the Fe-Mn-S-O system in detail, in which the O content in the formation of type I sulfides was above 0.01%. A higher oxygen content plays an important role in improving the morphology of sulfides [9]. Adding calcium and magnesium to the steel can improve the composition and morphology of sulfide to a certain extent [10,11]. In recent years, Jianxun Fu [12] and Wei Liu et al. [13] studied magnesium-calcium composite treatment. Including rare earth elements in sulfur free-cutting steel can better improve the composition, morphology and distribution of inclusions. In theory, the addition of rare earth first formed rare-earth oxides, and then formed rare-earth oxysulfides, and finally formed rare-earth sulfide [14]. ZrO2, formed by adding Zr to steel, are ideal partcles for the generation of spherical type I MnS inclusions [15]. Yunjin Xia [16] and Menglong Li [17] proposed that increasing Al content was beneficial to the formation of type III sulfides through experimental research. However, there are some problems with the above methods: under the condition of high cleanliness, it is difficult to improve the oxygen content and control the sulfide morphology. In addition, calcium treatment and magnesium treatment reactions are intense, and the treatment effect is not stable. If improper control may lead to nozzle clogging, and there are dust problems, the practical effect is not ideal. The addition of rare earth elements and other modified elements to sulfide morphology improvement effect is general, and there is no report on its large-scale industrial application. The improper control of Zr content will form large-sized agminated complex oxides, which are not easy to float and remove. Due to the steel’s composition requirements and the limitation of production conditions, it is difficult to increase the content of aluminum to a range that can play a significant role. The previous research results on sulfide behavior mechanisms still need to be improved, so it is necessary to seek new ideas and new methods to improve the morphology control of sulfide in steel under high cleanliness conditions. Titanium treatment technology can refine the grains and improve the mechanical properties of materials. It has been widely studied and applied in the field of microalloying [18,19,20], but its application in changing the morphology of sulfide is rarely reported.
According to the condition of high N content in high-cleanliness, non-quenched and tempered steel, the effect of TiN on sulfide morphology was studied using the precipitation characteristics of TiN and MnS at a high temperature. By combining various experimental methods and solidification segregation theory, the effects of different Ti and N contents in steel on the precipitation, composition, morphology and distribution of composite sulfides were explored. At the same time, the precipitation of sulfides containing the second phase of TiN microalloy was analyzed using thermodynamics.

2. Materials and Methods

The feasibility of titanium treatment is analyzed by experiments to provide new ideas for improving the morphology of sulfides.
The non-quenched and tempered steel was melted in a 6.5 kg vacuum induction furnace (Jzimt, Jinzhou, China) at 1600 °C with a vacuum degree of less than 100 Pa. After all melting, the components were adjusted, melted for 30 min, and then poured into a circular die (upper mouth Φ80 mm, height center line Φ70 mm, lower mouth Φ65 mm, height 64 mm). After casting, it was naturally cooled to room temperature in the air. The solidification rate of this cooling method is slower than that of the continuous casting process in industrial production, but faster than that of the ingot casting process in industrial production. According to the heating, rolling parameters and compression ratios that are commonly used in the actual production process of the steel, the ingot was forged into bars by multiple forgings. The ingot was forged by forging machine: heating temperature 1250 °C, heating time 1.5 h; Open forging temperature 1150 °C, final forging temperature 990 °C; Final forging of a 25 mm round rod. The components are shown in Table 1. The contents of O and N were measured by oxygen and nitrogen analyzer, and the contents of other components were measured by spectroscopy.
This paper mainly focuses on the interaction between TiN and MnS, so the composition of Ti and N is mainly adjusted by adding titanium iron, without controlling other components in the same number. Some elements (O\Al\Si) fluctuated slightly at different furnace times, which may be related to the secondary oxidation, the purity and the amount of titanium iron after adding titanium iron. Therefore, there is no strict inverse relationship between Al and O. Although the contents of Si, Mn, Al and O in the given experimental steels undergo some changes, according to our experimental cognition and industrial practice, the different oxygen content below 30 ppm will not cause significant differences in sulfide morphological control in the non-quenched and tempered steel.
The 10 mm × 10 mm × 12 mm metallographic samples (12 mm is the ingot height and the rod length direction) were cut along the height and length directions at the section diameter of 1/4 in the middle of the ingot height and 1/2 in the middle of the final forging rod length. The sample cutting diagram is shown in Figure 1. After polishing, the samples were observed under an optical microscope. Then, ZEISS ULTRA 55 field emission scanning electron microscopy combined with INCA Feature module of Oxford spectrometer (Zeiss, Niedersachsen, Germany) was used to analyze the composition, quantity, size, and especially the length and width of inclusions in the samples. Mapping scanning was used to analyze the morphology and composition distribution of inclusions in the samples, and the differences of sulfides in steels with different Ti, N, Mn and S contents were compared.

3. Results

3.1. Effect of Titanium Treatment on Sulfide Morphology in Steel under As-Cast Condition

The morphology of inclusions in as-cast samples is shown in Figure 2, Figure 3, Figure 4, Figure 5, Figure 6 and Figure 7. The green box in figures is the scan area.
It can be seen from the figure that the sulfide inclusions in the test steel include pure MnS inclusions (Figure 2) and various composite sulfides. The composite manganese sulfides can be roughly divided into the following categories: MnS with TiN as the nucleation core (Figure 3), MnS wrapped around Al2O3 and TiN as the nucleation cores (Figure 4), MnS with oxide as the nucleation core (Figure 5), MnS associated with TiN precipitation (Figure 6), and MnS pinned by TiN (Figure 7). The composite inclusions in Figure 4 firstly generate the Al2O3 core, then generate TiN around it, and finally generate MnS in the outer layer. The composite inclusion in Figure 7 is the core of the sir-formed oxide, and then MnS is generated around it. Finally, TiN is precipitated and pinned to the outer layer of MnS. In general, the morphology of as-cast sulfide is dot, spherical and spindle, and some are angular and irregular. MnS has no deformation, so it has no strip shape.
The metallographic specimens of three kinds of experimental steels were scanned by scanning electron microscope and energy dispersive spectrometer (Zeiss, Niedersachsen, Germany) under the field of view of 113 times over a total area of 25 mm2, and the inclusions with equivalent circular diameter less than 1 μm were ignored. Proportion of various sulfides can be obtained through data statistics. The number of sulfide inclusions in 0.006%, 0.028%, 0.055% Ti steel is 1225, 1202 and 1216, respectively, and the number of Ti-containing sulfides is 106, 167 and 297, respectively. The proportion of Ti-containing composite sulfides in total sulfides is shown in Figure 8.
As can be seen from Figure 8, with the increase in Ti, N content in steel, the proportion of composite sulfide will increase.

3.2. Effect of Titanium Treatment on Sulfide Morphology in Steel under Rolling Condition

The morphology of inclusions in forged samples is shown in Figure 9, Figure 10, Figure 11, Figure 12, Figure 13 and Figure 14.
It can be seen from the figure that the composition of sulfide in the steel does not change after forging, remaining the same as the cast state: pure MnS inclusions (Figure 9), MnS with TiN as the nucleation core (Figure 10), MnS inclusions surrounded by oxides and TiN as the nucleation core (Figure 11), MnS with oxide as the nucleation core (Figure 12), MnS associated with TiN precipitation (Figure 13) and MnS pinned by TiN (Figure 14). The morphology is quite different from that in the as-cast state. Pure MnS basically grows into a strip shape, and composite sulfide tends to be a spindle shape. In addition, there are some cubic pure TiN inclusions in the analyzed samples, whose sizes are mostly below 3 μm. The number of pure TiN in No. 1 steel is relatively high, while that in No. 3 steel is relatively low.
Three forged metallographic samples were observed under an optical microscope (Leica, Wetzlar, Germany) with 500 times magnification. According to the Z-line sequence, 50 fields of view were not repeatedly selected from the center of the metallographic sample. The morphology of sulfides in all photos was counted by Image-Pro plus v6.0 software (Media Cybernetics Inc., Maryland, MD, USA), and the change in aspect ratio was calculated. The number of sulfides in 0.006%, 0.028% and 0.055% Ti steel was 909, 950 and 1017, respectively. Typical morphologies of sulfides with different compositions in rolling state are shown in Figure 15.
It can be seen from Figure 15 that with the increase in Ti and N contents, the morphology and distribution of sulfides in forged steel obviously changed. The content of Ti and N in 0.006% Ti steel is low, the sulfide is a long strip, and the distribution is concentrated. 0.028% Ti and 0.055% Ti steels have higher Ti and N contents, and sulfides tend to be cylindrical or spindle-shaped, with a dispersed distribution. In general, the increase in titanium and nitrogen content is beneficial to the formation of sulfides close to cylindrical or spindle shapes, and the distribution is more dispersed, but this trend is nonlinear. By increasing TiN particles as the core of sulfide, sulfide precipitation at grain boundaries can be reduced, and distribution uniformity and subsequent deformation resistance can be increased.
The length–width ratio and average length–width ratio of sulfide forged steels with different compositions are shown in Figure 16 and Figure 17.
It was found that the highest aspect ratio of sulfide in 0.006% Ti and 0.028% Ti steel was in the range of 3–5 μm and the lowest was in the range of more than 11 μm. The highest aspect ratio of sulfide in 0.055% Ti steel was in the range of 1–3 μm and the lowest was in the range of 9–11 μm. With the increase in TiN content in the steel, the aspect ratio of the overall sulfide gradually inclines towards the smaller value, the sulfide proportion in the aspect ratio of 1–3 μm increases, and the average aspect ratio of sulfide gradually decreases.
SEM combined with energy spectrometer was used to scan a 25 mm2 area of three samples, and the number and proportion of different types of sulfides were counted. The composition and proportion of sulfides in the three sample steels under rolling are shown in Table 2.
The proportion of Ti-containing composite sulfide is basically consistent with that of as-cast, and the trend is the same. 0.006% Ti steel and 0.028% Ti steel are mainly composed of TiN-associated MnS, and 0.055% Ti steel is mainly composed of TiN-core MnS. The change of TiN content has a significant effect on the composition distribution of sulfide in forged steel, and 0.055% Ti steel is the most obvious. In addition, with the increase in Ti content, the proportion of MnS with TiN as the core increases the most, followed by the proportion of MnS pinned by TiN, and the proportion of MnS associated with TiN increases the least. It can be seen that the improvement in MnS morphology is mainly dominated by TiN nucleation, and TiN pinning also plays a certain role.
It can also be seen from Table 2 that the proportion of oxy-sulfides without TiN is very small, and the percentage of oxy-sulfides decreases although the contents of Al and O in Steels 2 and 3 are slightly larger compared with that in Steel 1. This is because, even if Al and O are high, the number of oxides in steel increases but the proportion of composite sulfides with them as the core does not increase. This may be related to the large difference between the temperature range of MnS formation and the temperature range of oxide formation, meaning that most sulfides are not generated on the oxide core. Compared with composite sulfide containing TiN, the formation temperature range of TiN is closer to that of MnS and easier to promote the formation of Ti-containing composite sulfides. It is also the key idea when increasing the proportion of composite sulfides by adjusting Ti and N in this paper.

4. Discussion

The equilibrium activity product and actual activity product of MnS and TiN in the solid–liquid two-phase region were calculated to determine the precipitation temperature and precipitation time. The segregation in the solidification process has an important influence on the actual activity, so the Scheil segregation model is used to calculate this.
The description of solute concentration distribution in solid-liquid two-phase region of steel is shown in Equations (1) and (2):
C S = KC 0 ( 1 f S ) K 1
C L = C 0 ( 1 f S ) K 1
where C S is concentration of solute in solid phase during solidification; C L is concentration of solute in liquid phase during solidification; K is the equilibrium distribution coefficient in the two phases, K   = C S C L , K Ti = 0.3 , K N = 0.5 , K S = 0.02 [21], K Mn = 0.84 [21]; C 0 is the concentration of the original solute; f S is the solid fraction.
The Equation (3) [22] to calculate the temperature of the liquid region:
T = T 0 T 0 T L 1 f S T L T S T 0 T S
where T is the temperature of liquid region at the solidification front; T 0 is the melting point of pure iron (1536 °C); T L is the temperature of liquidus of experimental steel; T S is the temperature of solidus of experimental steel; f S is the solid fraction.
The liquidus and solidus temperatures of experimental steel were calculated by Equations (4) and (5) [23]:
T L = 1538 ( 65 % C + 8 % Si + 5 % Mn + 30 % P + 25 % S + 3 % Al + 20 % Ti + 2 % V + 9.5 % Nb + 90 % N + 80 % O )
T S = 1538 ( 175 % C + 20 % Si + 30 % Mn + 280 % P + 575 % S + 7.5 % Al + 40 % Ti + 4 % V + 60 % Nb + 160 % O )
Substituting the elements in Table 1 into Equations (4) and (5), the liquidus and solidus temperatures can be obtained, as shown in Table 3.
In molten steel, the reaction of TiN formation is shown in Equation (6), and the reaction of Mn and S is shown in Equation (7):
Ti + N = TiN
Mn + S = MnS
Δ G 0 = RT ln K 0
The equilibrium constants K T i N 0 and K M n S 0 of the above reactions are calculated by Equation (9) and Equation (10), respectively:
K TiN 0 = a TiN a Ti · a N = 1 f Ti % Ti · f N % N
K MnS 0 = a MnS a S · a Mn = 1 f s % S · f Mn % Mn
where a TiN is the activity of TiN (pure substance), and a TiN = 1 ; a MnS is the activity of MnS (pure substance), and a MnS = 1 ; a Ti is the activity of Ti element; a N is the activity of the N element; a S is the activity of S element; a Mn is the activity of Mn element; f Ti is the activity coefficient of Ti element; % Ti is the mass percentage concentration of Ti element; f N is the activity coefficient of N element; % N is the mass percentage concentration of N element; f S is the activity coefficient of S, and % S is the mass percentage of S; f Mn is the activity coefficient of Mn; and % Mn is the mass percentage of Mn.
According to Equation (8), the relationship between the equilibrium activity product a Ti · a N eq (the following standard ‘eq’ represents the equilibrium state) and a S · a Mn eq and the equilibrium constants K TiN 0 and K MnS 0 can be found in Equation (11) and Equation (12), respectively:
a Ti · a N eq = 1 K TiN
a S · a Mn eq = 1 K MnS
Under liquid and solid conditions, the relationship between the equilibrium activity product of TiN and temperature is shown in Equations (13) and (14) [24]. The relationship between the equilibrium activity product of MnS and temperature is calculated by Equations (12), (15) and (16) [25]:
lg K TiN = 15,220 T 5.64
lg K TiN = 13,850 T 4.01
lg K MnS = 9281 T 5.19
lg K MnS = 9020 T 2.929
It can be seen from the conditions of material precipitation that when the actual activity product is greater than the equilibrium activity product, TiN and MnS can meet the thermodynamic conditions of precipitation and precipitate from this state. Using the interaction coefficients given in Table 4 [26,27], respectively, and combined with Equations (17) and (18), the activity coefficients and activities of TiN and MnS can be calculated. The actual concentrations were calculated according to the solidification distribution, and then the actual activity product was calculated according to the activity interaction coefficients of the four elements. To simplify the calculation of Ti, N, Mn and S activity coefficients, we used the total interaction coefficient of molten steel at 1600 °C instead of the total interaction coefficient at different temperatures, without considering the segregation of other elements during solidification. This will not increase the accuracy of calculation even if the concentration of all elements is considered, because relevant basic thermodynamic data, especially the interaction coefficient of each element at different temperatures, are relatively lacking. Finally, the actual activity products of TiN and MnS, namely a Ti · a N ac and a S · a Mn ac (subscript ‘ac’ represents the actual state), can be obtained:
lgf i = j = 1 n e i j · % j
a i = f i % i
where i is the element to be calculated; f i is the activity coefficient of element i; e i j is the activity interaction coefficient of element j to element i; % j is the mass percent concentration of j element.
According to the calculated data, the relationship between the equilibrium activity product and the actual activity product of TiN and MnS in the liquid phase region and solid phase region of the solid–liquid phase region, the solid fraction can be obtained, as shown in Figure 18 and Figure 19.
The diagram shows that, in the liquid phase and solid phase of the solid–liquid two-phase region during the solidification process, the equilibrium activity product of TiN and MnS decreases gradually with the increase in solid fraction, and the actual activity product increases gradually. The final actual activity product is greater than the equilibrium activity product, and TiN and MnS begin to precipitate. The solid fraction corresponding to the intersection point is the initial solid fraction of TiN, and the corresponding temperature can be obtained by Equation (3).
The initial solid fraction and initial precipitation temperature of TiN and MnS in the solid–liquid two-phase region of the three samples were compared, as shown in Table 5.
It can be seen from Table 5 that when the solid fraction reaches the value shown in the table, TiN begins to precipitate in the liquid and solid phase of the solid–liquid two-phase region, respectively. In the absence of intersection, TiN has been precipitated in the liquid phase. Whether in solid or liquid phase, when the solid fraction is greater than the initial solid fraction, the actual activity product of MnS will rapidly increase, and the equilibrium activity product will accelerate and decrease. The gap between the two will rapidly widen, resulting in a large amount of MnS precipitation at the end of solidification. Thermodynamically, the higher the content of Ti and N in steel, the more likely TiN precipitates before MnS, even from the liquid or solid–liquid two-phase region. With the increase of Ti content, the initial precipitation temperature of MnS shows little difference, but the precipitation temperature of TiN has obvious changes. The initial precipitation temperature of steel with 0.055% Ti content has exceeded the liquidus temperature.
When TiN precipitates prior to MnS, MnS with TiN as heterogeneous nucleation can be formed; when TiN and MnS precipitate simultaneously, MnS associated with TiN will be formed; when MnS precipitates prior to TiN, it will form MnS pinned by TiN. The formation of sulfide inclusions runs through the whole solidification process. With a different Ti content and composition system, the types of composite sulfide precipitation are different. With the increase in Ti and N contents in steel, TiN precipitates earlier than MnS, and the number also increases, providing more nucleation centers for MnS. Therefore, the proportion of MnS with TiN as the core increases. 0.055% Ti steel has the highest proportion of MnS with TiN as the core, as shown in Table 2.
Only one steel was used in this experiment, but the results should be feasible for similar steel with the same S content range (about 0.02–0.08%).

5. Conclusions

The main conclusions of this study are as follows:
(1)
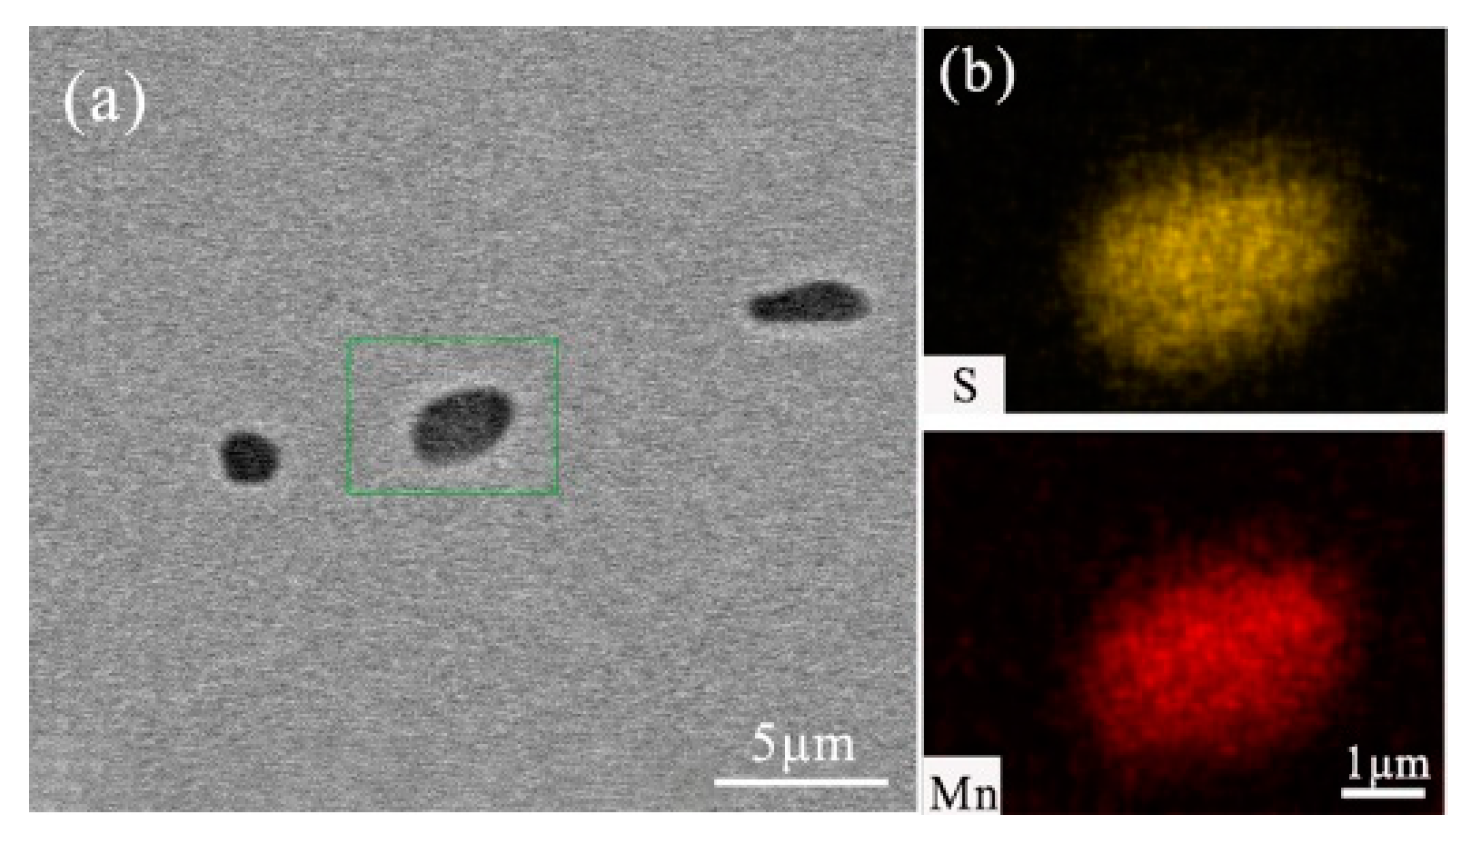
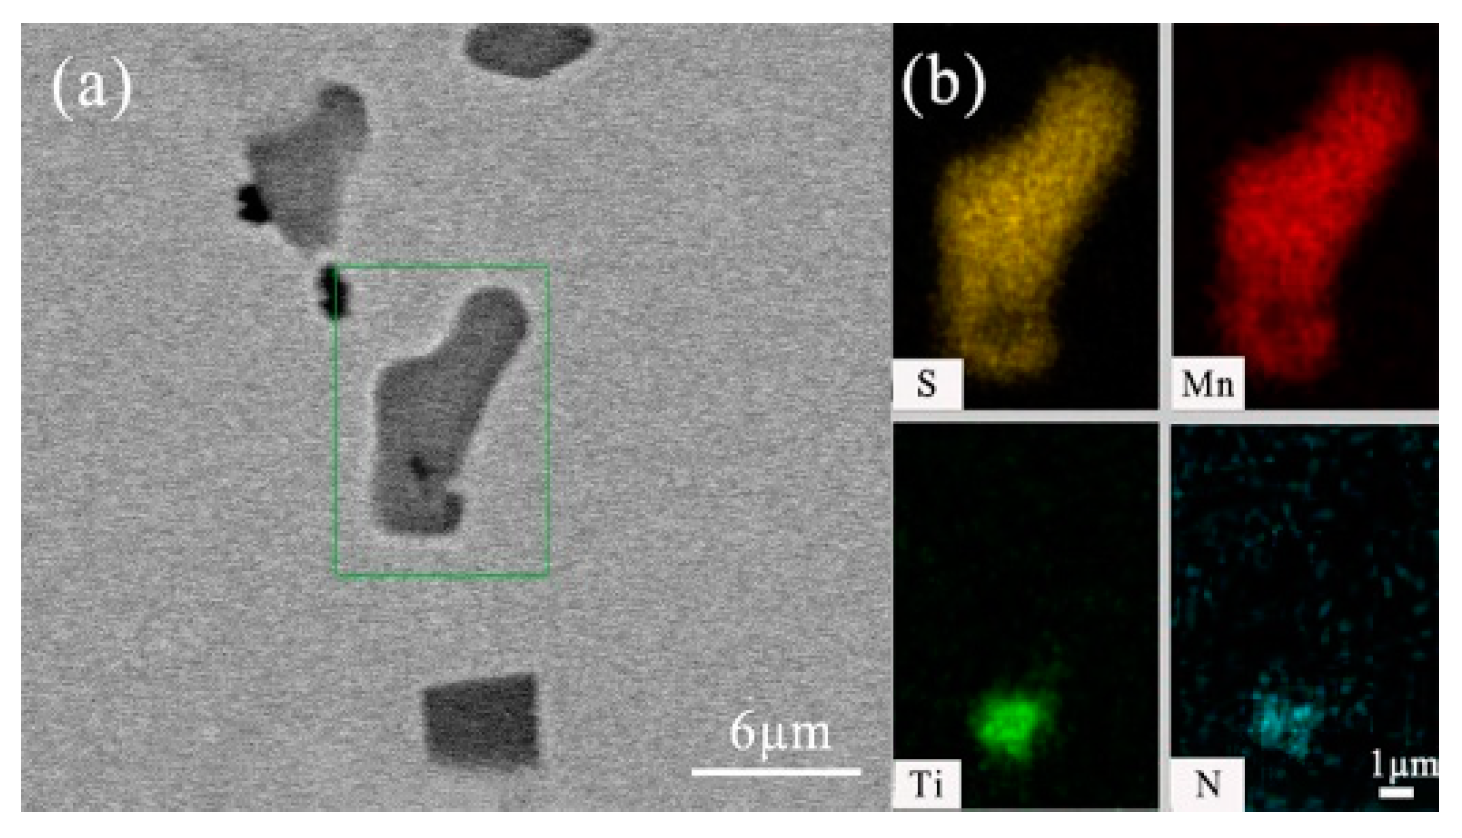
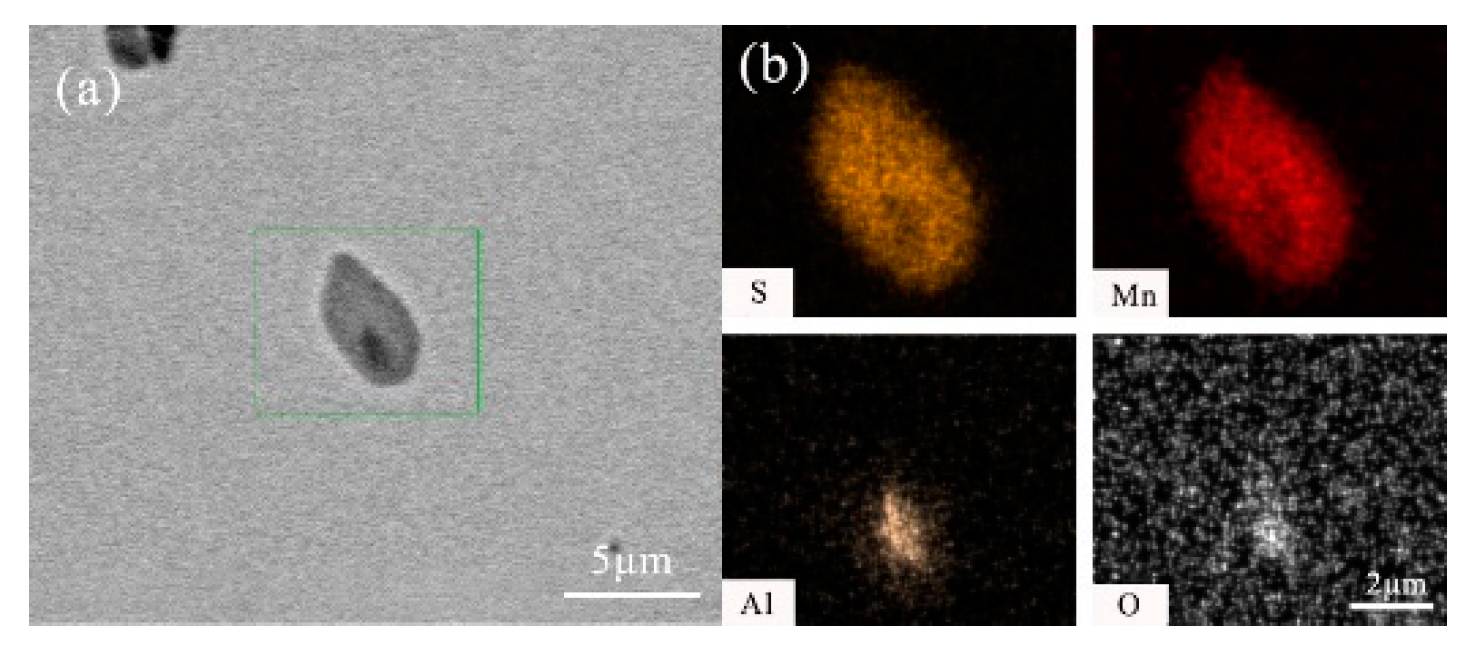
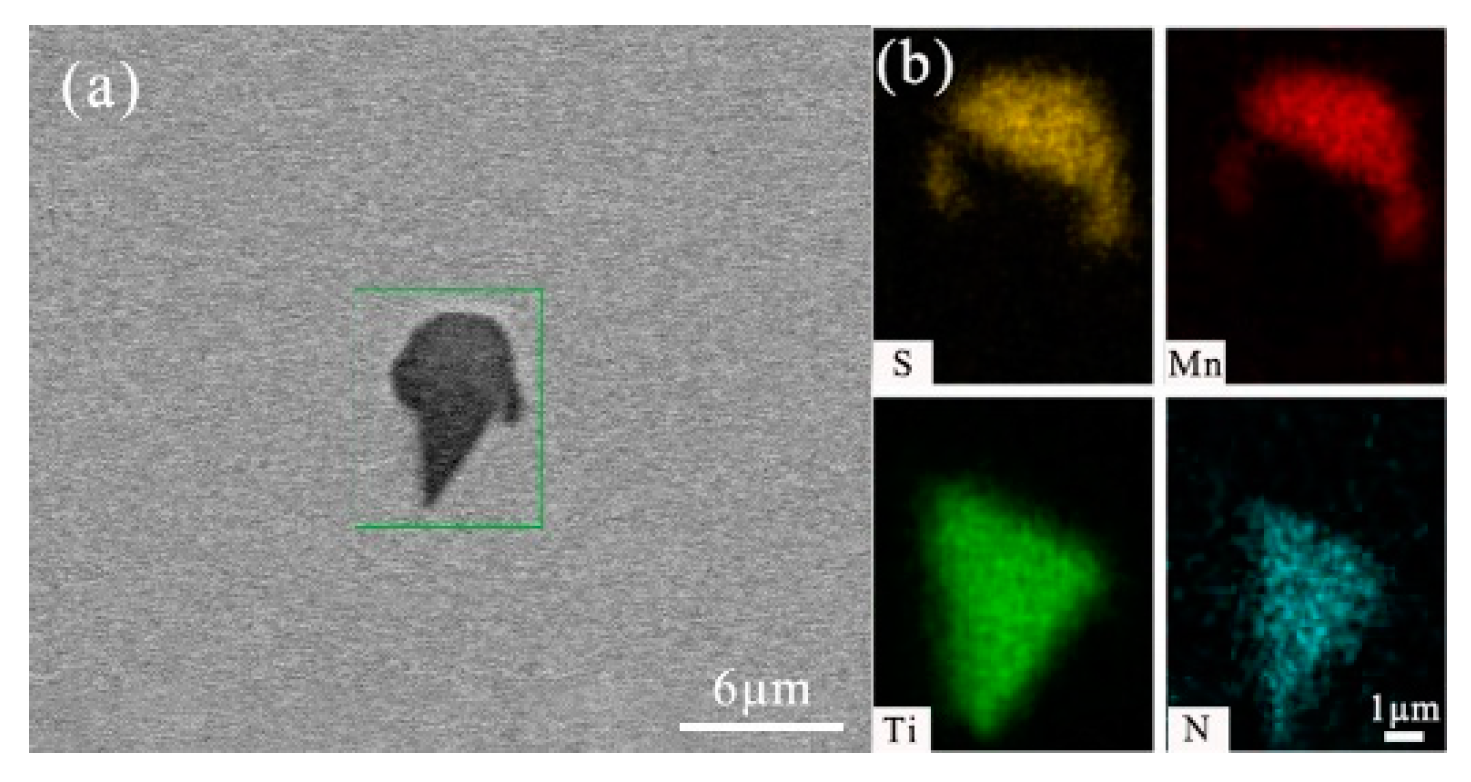
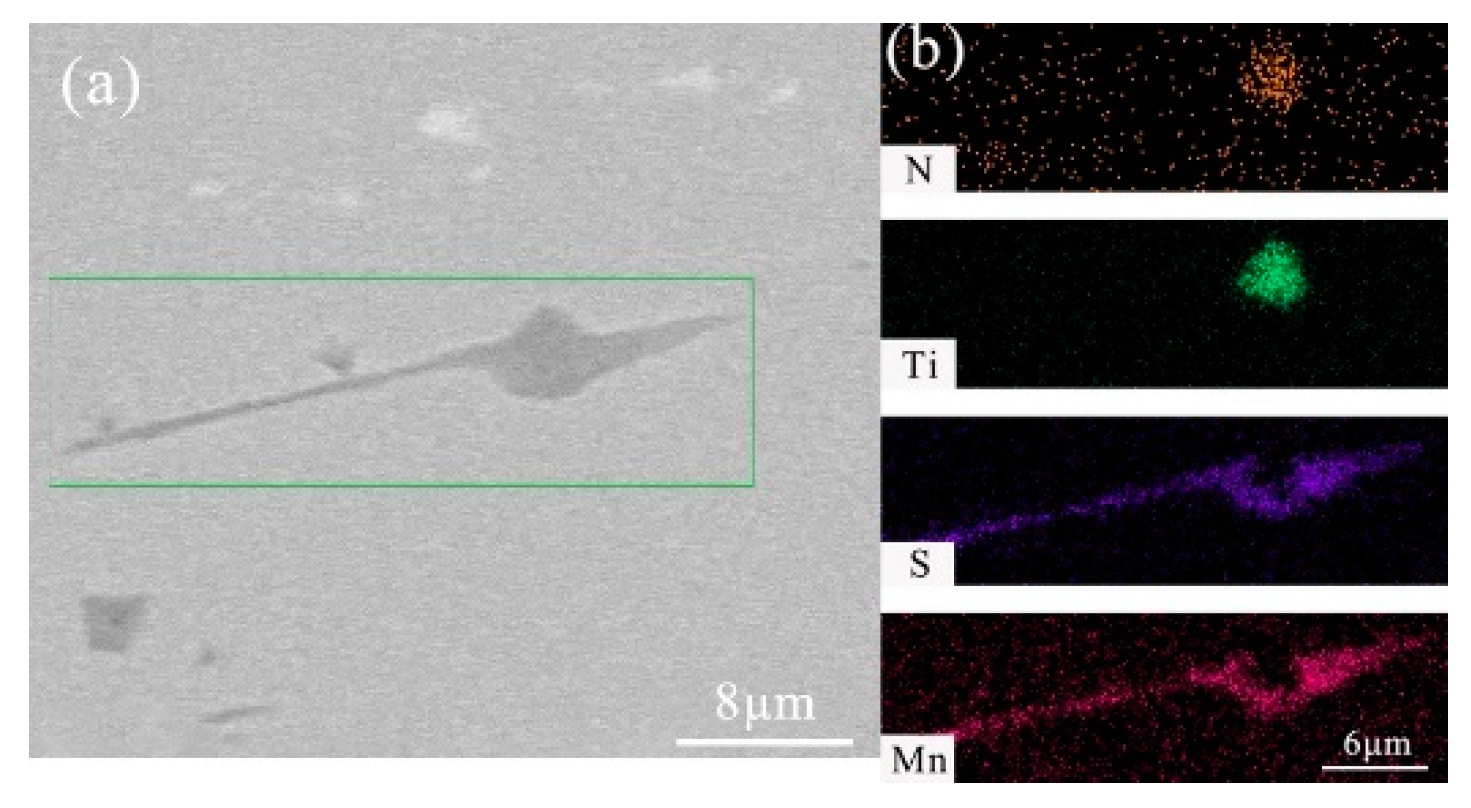
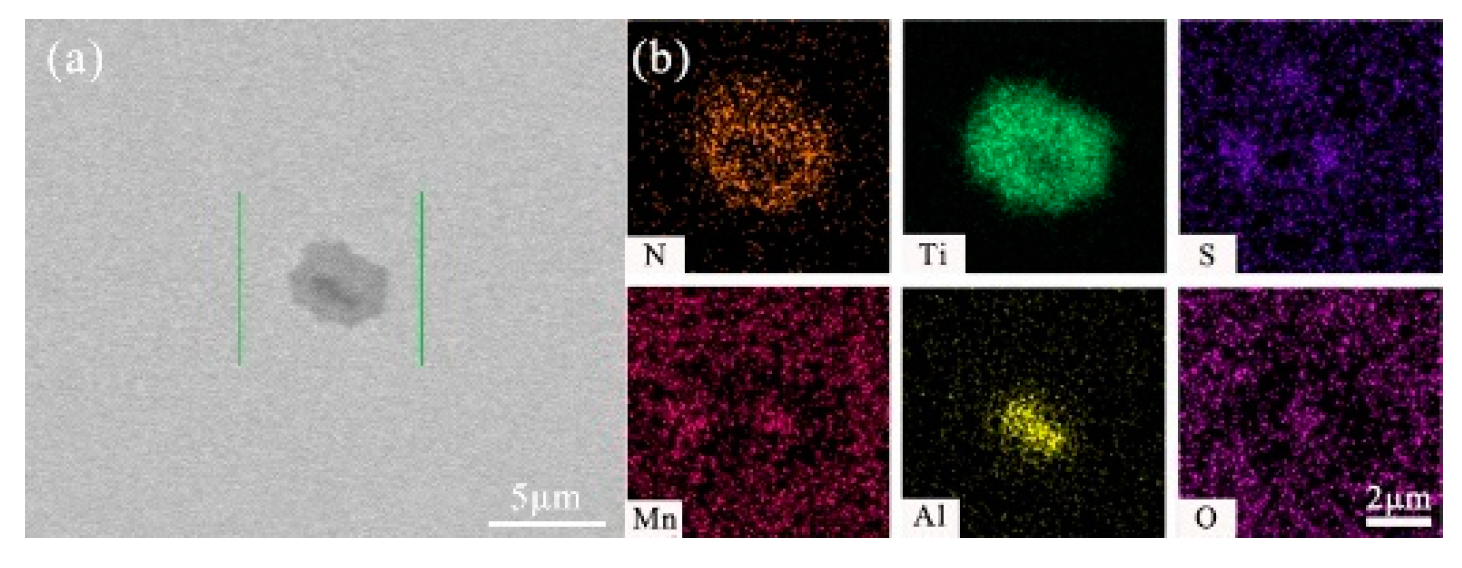
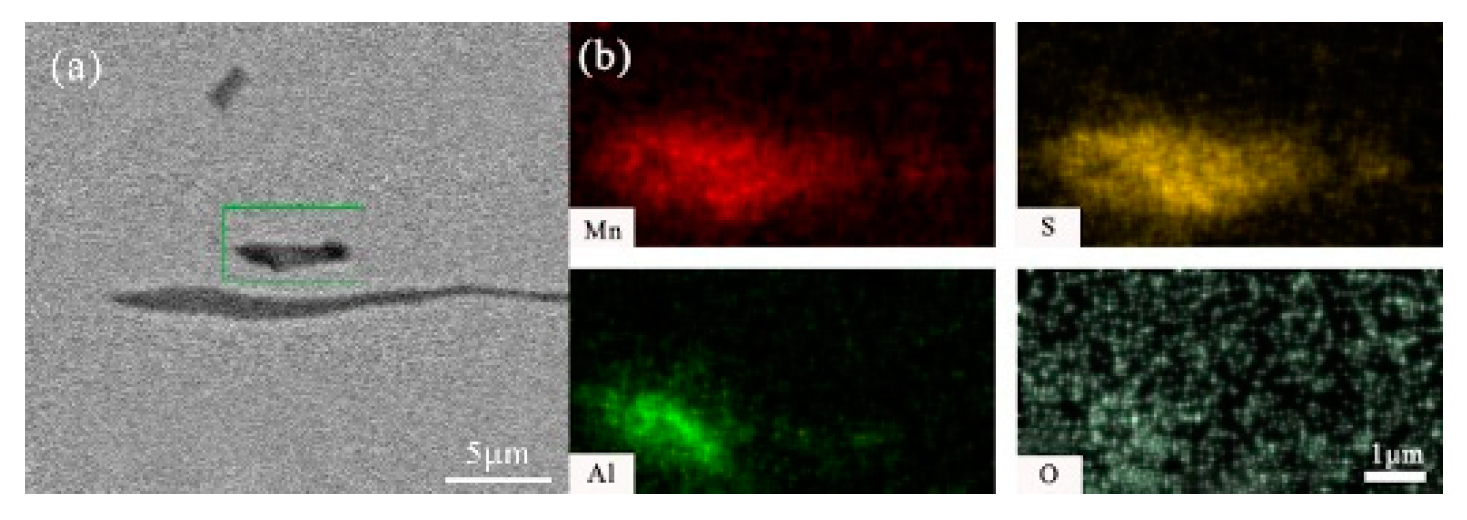
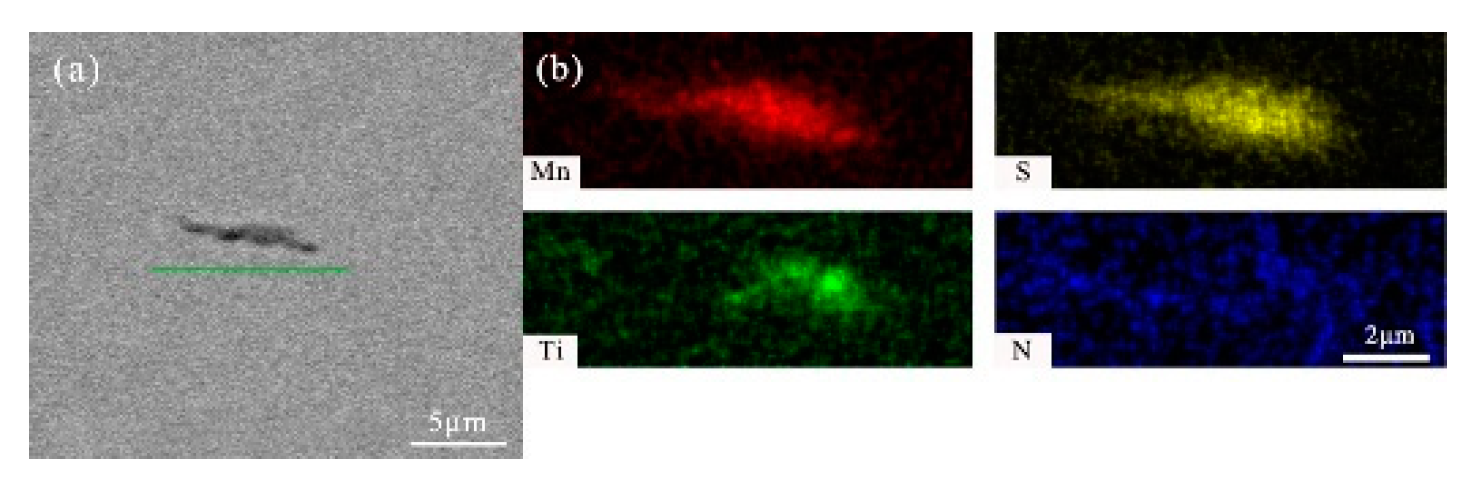
After titanium treatment, there are four main kinds of Ti-containing composite sulfides in non-quenched and tempered steel: MnS with TiN as nucleation core, MnS with Al2O3 and TiN as nucleation core, MnS precipitated with TiN and MnS pinned by TiN. The as-cast pure MnS and composite sulfides are basically point or spindle-like, while the forged pure MnS is strip-like, and the composite sulfides tend to be spindle-like.
(2)
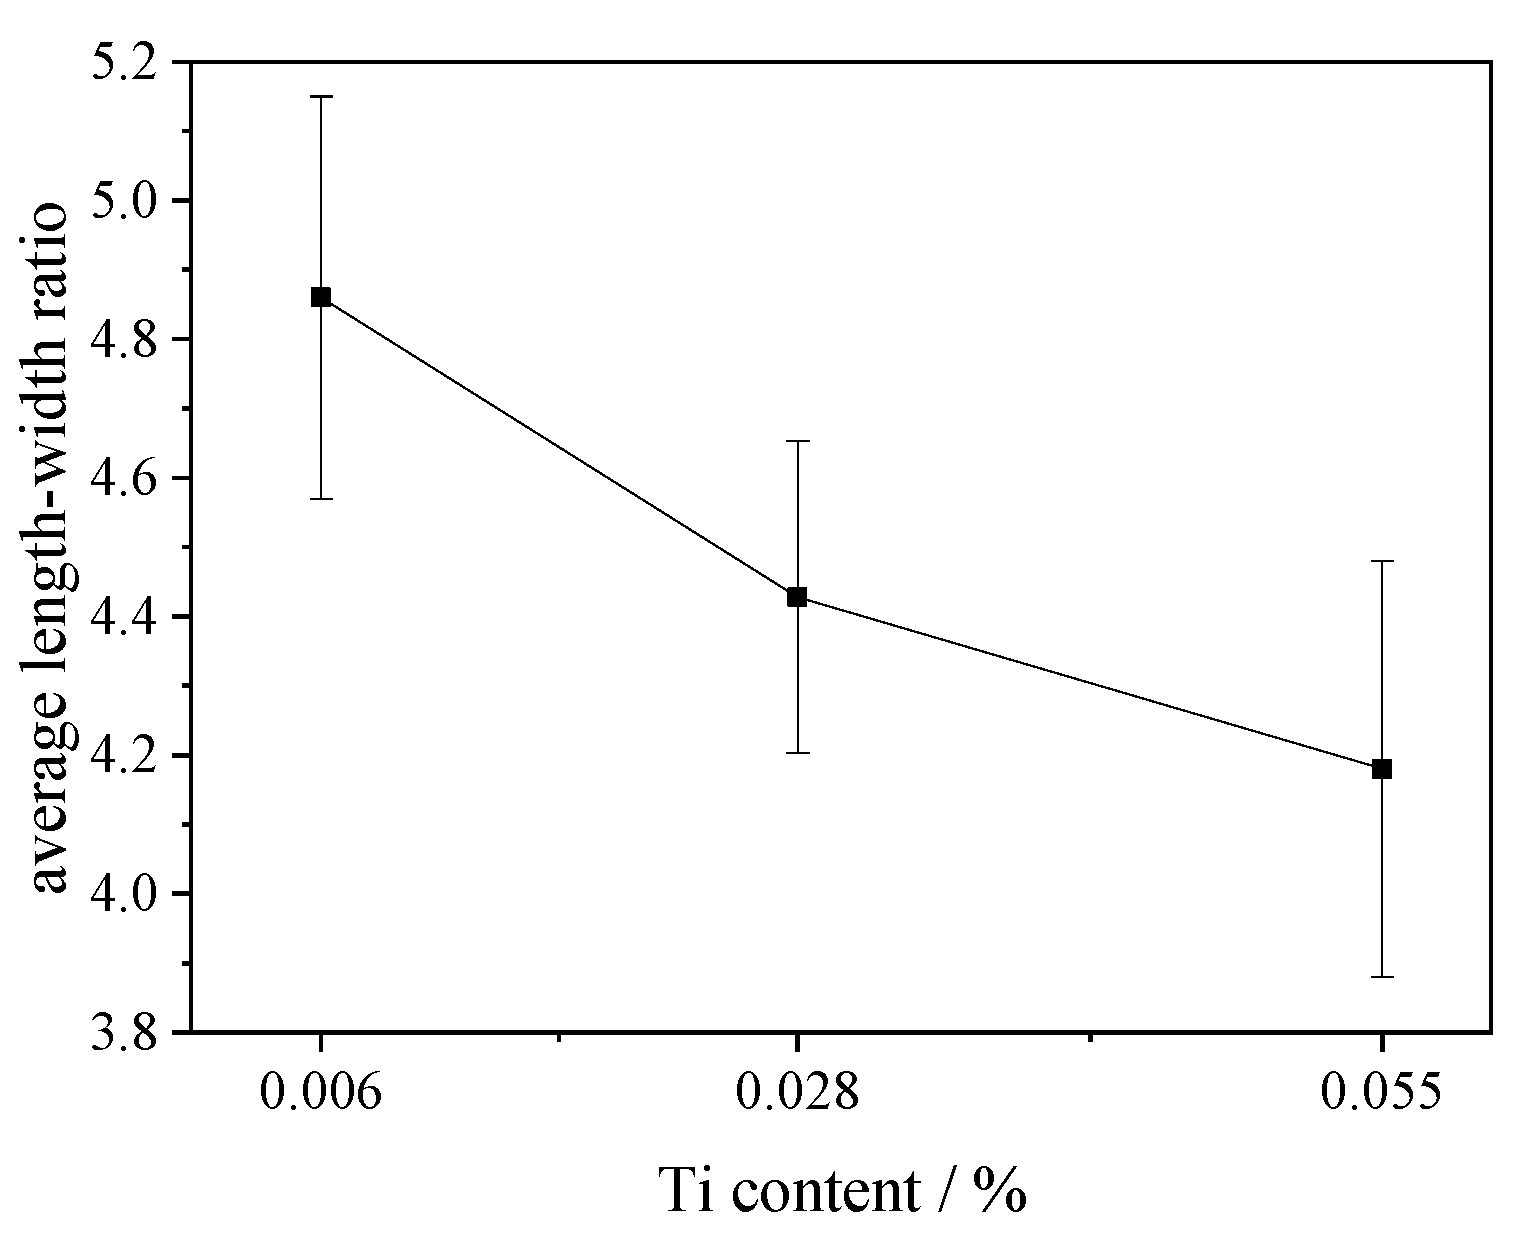
With the increase in TiN content, the aspect ratio of sulfide decreases from 4.86 to 4.18, and the shape of inclusions tends to be cylindrical, spindle or spherical.
(3)
With different Ti contents, the types of sulfide precipitation interval and proportion are different. The increase of Ti and N content will increase the corresponding composite sulfide content. The number of MnS with TiN as the nucleation core increases most, indicating that increasing the content of TiN in steel can increase the proportion of composite sulfide in steel.
(4)
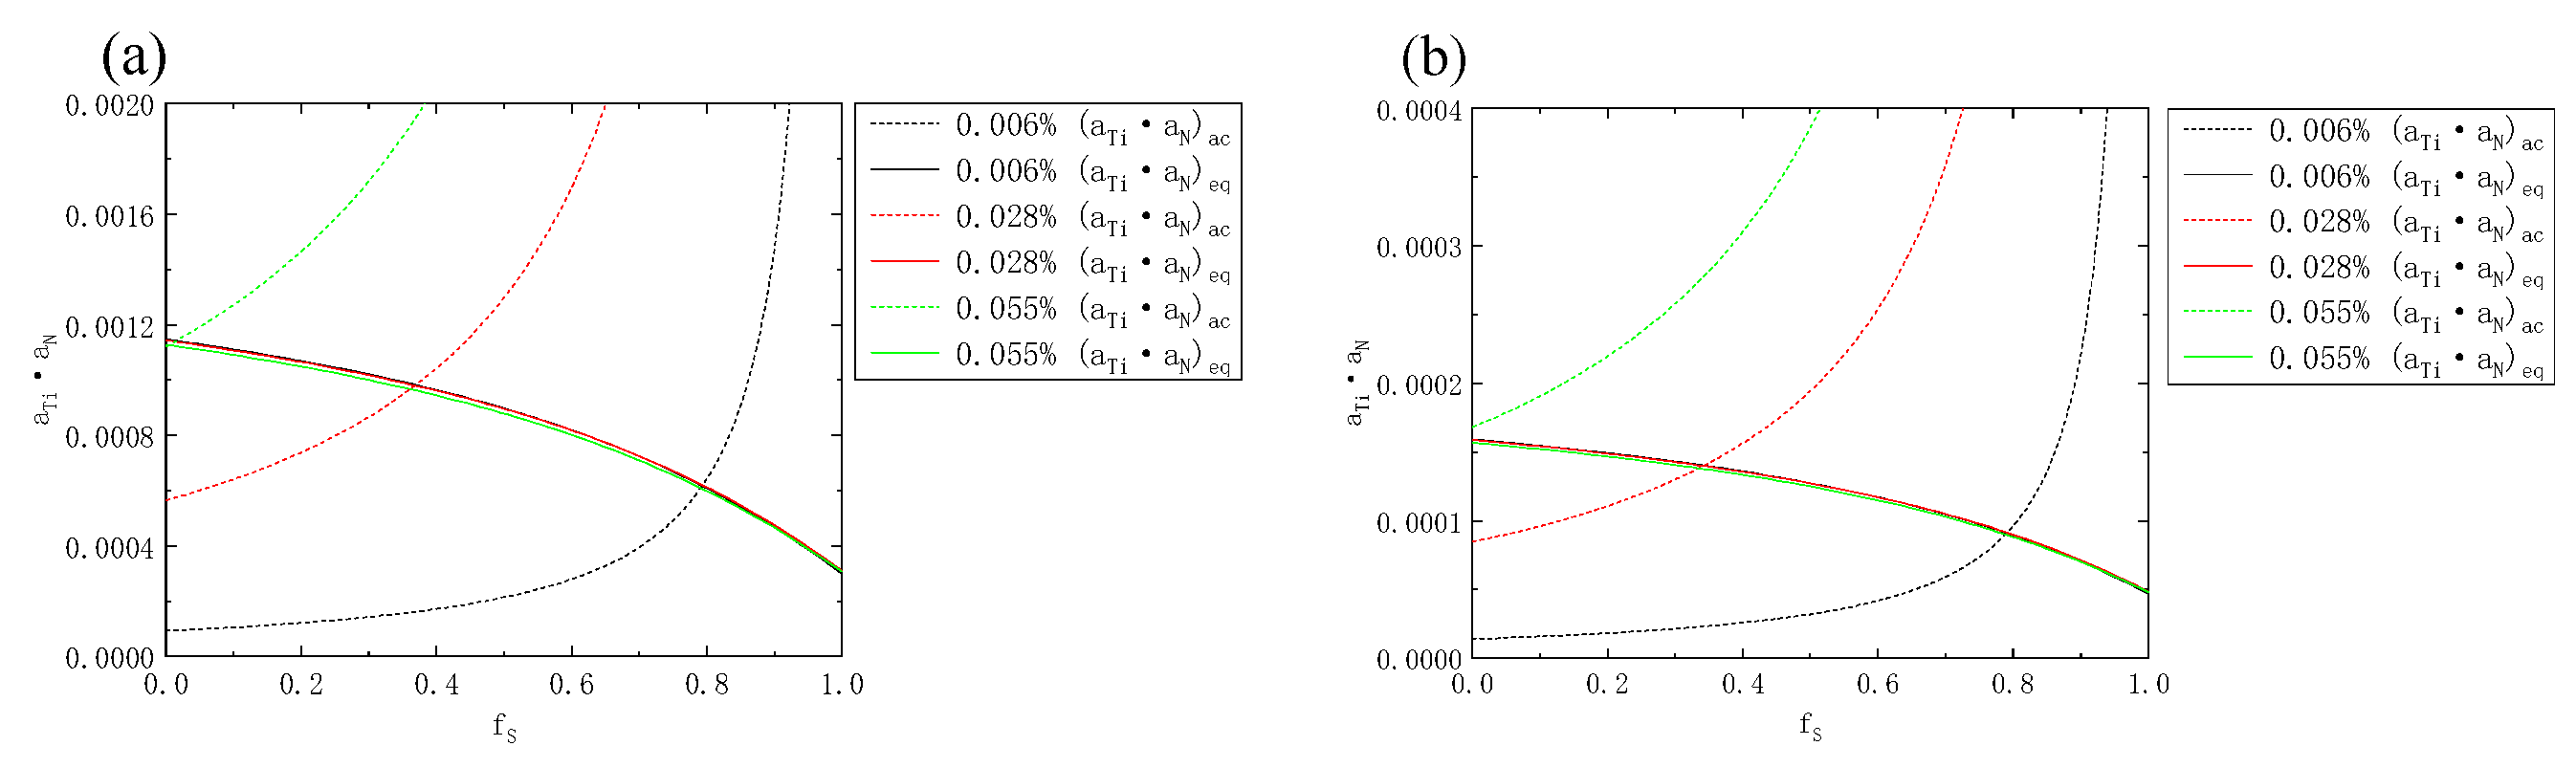
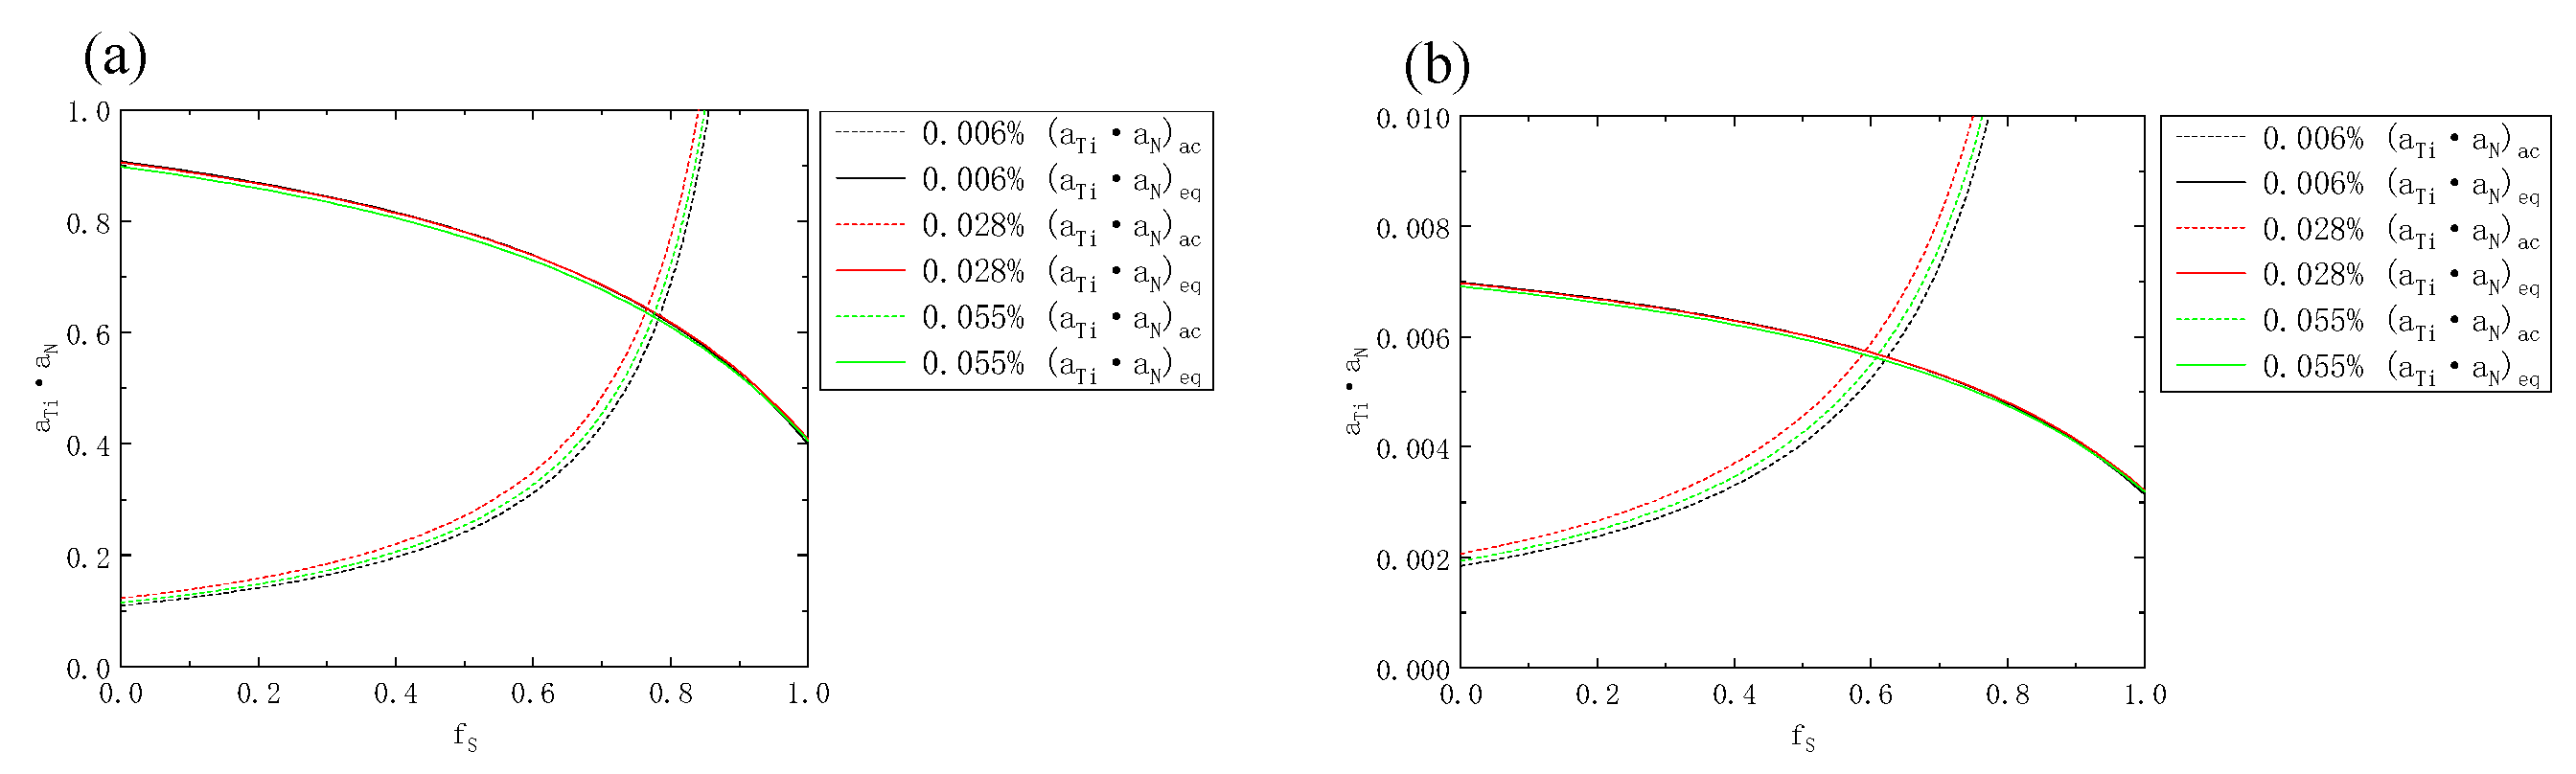
The Ti content of the three samples increased from 0.006% to 0.055%. In both the liquid phase and the solid phase of the solid–liquid two-phase region, the solid phase rate of the initial precipitation of TiN decreased from 0.79 to 0, and the initial precipitation temperature increased from 1447 °C to higher than the liquidus temperature. The initial precipitation solid fraction of MnS was about 0.77 and 0.60, respectively, and the initial precipitation temperature was about 1450 °C and 1470 °C, respectively.
(5)
Titanium treatment provides a new idea for improving the morphology of sulfides. The formation of composite sulfides by using TiN precipitated at high temperatures is conducive to improving the morphology control and distribution uniformity of sulfides in steel. The determination of reasonable Ti and N contents according to the composition ranges of Mn and S, and the guarantee that the precipitation temperature is higher than the precipitation temperature of MnS are crucial to the morphology control of sulfides in steel. At present, it is not enough to judge whether the effect of the current treatment is sufficent, but the experimental results can clearly provide us with a direction of regulation. At the same time, the possible negative effects of titanium addition should be considered, such as leading to TiN coarsening, increased TiO2 formation and nozzle clogging. In the future, more experiments and industrial experiments should be combined to determine the reasonable control effect.

Author Contributions

Conceptualization, H.W.; methodology, H.W. and X.L.; formal analysis, X.L. and Z.W.; investigation, X.L. and Z.W.; data curation, X.L., Z.W. and W.L.; writing—original draft preparation, X.L.; writing—review and editing, H.W., X.L. and W.L.; supervision, H.W.; project administration, H.W.; funding acquisition, H.W. All authors have read and agreed to the published version of the manuscript.

Funding

This research was funded by the National Natural Science Foundation of China, grant number U1660113.

Institutional Review Board Statement

Not applicable.

Informed Consent Statement

Not applicable.

Data Availability Statement

Not applicable.

Acknowledgments

The authors appreciate the financial support for this work from the National Natural Science Foundation of China (U1660113).

Conflicts of Interest

The authors declare no conflict of interest.

References

  1. Chang, K.D.; Wang, P.; Liu, W.P. Development status and application prospect of non-quenched tempered steel. Heat Treat. Metals 2011, 36, 80–85. [Google Scholar]
  2. Pi, J.H.; Bai, Y.Q.; Zhen, R. A Study on the Effect of Aging on Mechanical Properties of Cold-Formed Non-quenched Steel via Nanoindentation. J. Mater. Eng. Perform. 2017, 26, 28–33. [Google Scholar] [CrossRef]
  3. Lu, J.L.; Wang, Y.P.; Wang, Q.M.; Cheng, H.J.; Cheng, G.G. Effect of MnS Inclusions Distribution on Intragranular Ferrite Formation in Medium Carbon Non-Quenched and Tempered Steel for Large-Sized Crankshaft. ISIJ Int. 2019, 59, 524–530. [Google Scholar] [CrossRef]
  4. Subramanian, S.V.; Gekonde, H.O.; Zhang, X. Design of steels for high speed machining. Ironmak. Steelmak. 1999, 26, 333–338. [Google Scholar] [CrossRef]
  5. Ghosh, A.; Sahoo, S.; Ghosh, M.; Ghosh, R.N.; Chakrabarti, D. Effect of microstructural parameters, microtexture and matrix strain on the Charpy impact properties of low carbon HSLA steel containing MnS inclusions. Mater. Sci. Eng. A 2014, 613, 37–47. [Google Scholar] [CrossRef]
  6. Ito, Y.; Yonezawa, N.; Matsubara, K. The Effect of Carbon on the Composition of the Eutectic Conjugation in the Fe-Mn-S System and the Equilibrium of Sulfides in Solid Steels. Tetsu-Hagane 1979, 65, 1149–1158. [Google Scholar] [CrossRef]
  7. Ito, Y.; Masumitsu, N.; Matsubara, K. Formation of Manganese Sulfide in Steel. Iron Steel Inst. Jpn. 1981, 21, 477–484. [Google Scholar] [CrossRef]
  8. Ito, Y.; Yonezawa, N.; Matsubara, K. The Composition of Eutectic Conjugation in Fe-Mn-S System. Trans. Iron Steel Inst. Jpn. 2019, 20, 19–25. [Google Scholar] [CrossRef]
  9. Bigelow, L.K.; Flemings, M.C. Sulfide inclusions in steel. Metall. Mater. Trans. B 1975, 6, 275–283. [Google Scholar] [CrossRef]
  10. Ray, A.; Paul, S.K.; Jha, S. Effect of Inclusions and Microstructural Characteristics on the Mechanical Properties and Fracture Behavior of a High- Strength Low-Alloy Steel. J. Mater. Eng. Perform. 1995, 4, 679–688. [Google Scholar] [CrossRef]
  11. Xiao, G.H.; Dong, H.; Wang, M.Q.; Hui, W.J. Effect of Mg/Ca-Treatment on Morphology of Sulfide in Non-Quenched and Tempered Steel. Iron Steel 2011, 46, 65–69. [Google Scholar]
  12. Fu, J.X.; Zhu, Y.Y.; Li, X.; Liu, H.; Gong, T.; Li, J.; Hu, D.L.; Xu, J.; Zhang, M.; Wu, Y.X.; et al. A 45MnVS Easy—Cutting Non—Quenched and Tempered Steel Containing Magnesium and Calcium and Its Manufacturing Method. Chinese Patent Application CN105803308A, 19 March 2016. [Google Scholar]
  13. Liu, W.; Yang, S.F.; Li, J.S.; Li, J.K.; Zhang, S. Modification of sulphide inclusions in 20 CrMnTi steel by calcium-magnesium treatment. Iron Steel 2017, 52, 21–27. [Google Scholar]
  14. Li, D.Z. Globularizing of sulfide inclusions and its influence on the propesties of steel. J. Iron Steel Res. 1992, 4, 97–101. [Google Scholar]
  15. Lu, J.L.; Cheng, G.G.; Chen, L.; Xiong, G.J.; Wang, L.S. Distribution and Morphology of MnS Inclusions in Resulfurized Non-Quenched and Tempered Steel with Zr Addition. ISIJ Int. 2018, 58, 1307–1315. [Google Scholar] [CrossRef] [Green Version]
  16. Xia, Y.J.; Li, J.; Fan, D.D.; Dong, H.B. The Effect of Aluminum on the Divorced Eutectic Transformation of MnS Inclusions. Metall. Mater. Trans. B 2021, 52, 1118–1131. [Google Scholar] [CrossRef]
  17. Li, M.L.; Wang, F.M.; Li, C.R.; Yang, Z.B.; Meng, Q.Y.; Tao, S.F. Effects of cooling rate and Al on MnS formation in medium-carbon non-quenched and tempered steels. Int. J. Miner. Metall. Mater. 2015, 22, 589–597. [Google Scholar] [CrossRef]
  18. Tomita, Y.; Saito, N.; Tsuzuki, T.; Tokunaga, Y.; Okamoto, K. Improvement in HAZ Toughness of Steel by TiN-MnS Addition. ISIJ Int. 1994, 34, 829–835. [Google Scholar] [CrossRef]
  19. Oikawa, K.; Ishida, K.; Nishizawa, T. Effect of Titanium Addition on the Formation and Distribution of MnS Inclusions in Steel during Solidification. ISIJ Int. 1997, 37, 332–338. [Google Scholar] [CrossRef]
  20. Yin, X.; Sun, Y.H.; Yang, Y.D.; Bai, X.F.; Barati, M.; Mclean, A. Formation of Inclusions in Ti-Stabilized 17Cr Austenitic Stainless Steel. Metall. Mater. Trans. B 2016, 47, 3274–3284. [Google Scholar] [CrossRef]
  21. Cai, K.K. Casting and Solidification; The Metallurgical Industry Press: Beijing, China, 1987; pp. 108–120. [Google Scholar]
  22. Luo, Y.Z.; Zhang, J.M.; Liu, Z.M.; Xiao, C.; Wu, S.Z. In situ observation and thermodynamic calculation of MnS in 49MnVS3 non-quenched and tempered steel. Acta Metall. Sin. 2011, 24, 326–334. [Google Scholar]
  23. Chen, J.X. Manual of Chart and Data in Common Use of Steel Making; The Metallurgical Industry Press: Beijing, China, 1998; pp. 221–227. [Google Scholar]
  24. Fu, J.; Zhu, J.; Di, L.; Tong, F.S.; Liu, D.L.; Wang, L.Y. Study on the precipitation behavior of TiN in the microalloyed steels. Metall. Trans. 2000, 8, 801–804. [Google Scholar]
  25. Cicutti, C.E.; Madias, J.; Gonzalez, J.C. Control of microinclusions in calcium treated aluminum killed steels. Ironmak. Steelmak. 1997, 24, 155–159. [Google Scholar]
  26. Hino, M.; Ito, K. Thermodynamic Data for Steelmaking; Senda, Tohoku University Press: Tokyo, Japan, 2010; pp. 259–264. [Google Scholar]
  27. Huang, X.H. Ferrous Metallurgy Principle, 4th ed.; The Metallurgical Industry Press: Beijing, China, 1997; p. 181. [Google Scholar]
Figure 1. Sample cutting diagram (a) ingot; (b) rod.
Metals 12 01402 g001
Figure 2. Pure MnS inclusions in test steel (a) SEM morphology of inclusions; (b) composition distribution of inclusions.
Metals 12 01402 g002
Figure 3. Typical MnS diagram with TiN as nucleation core (a) SEM morphology of inclusions; (b) composition distribution of inclusions.
Metals 12 01402 g003
Figure 4. Typical MnS diagrams with Al2O3 and TiN as nucleation cores (a) SEM morphology of inclusions; (b) composition distribution of inclusions.
Metals 12 01402 g004
Figure 5. Typical MnS diagram with oxide as the nucleation core (a) SEM morphology of inclusions; (b) composition distribution of inclusions.
Metals 12 01402 g005
Figure 6. Typical MnS diagram associated with TiN precipitation (a) SEM morphology of inclusions; (b) composition distribution of inclusions.
Metals 12 01402 g006
Figure 7. Typical MnS patterns pinned by TiN with oxide as the core (a) SEM morphology of inclusions; (b) composition distribution of inclusions.
Metals 12 01402 g007
Figure 8. The proportion of Ti-containing composite sulfides in total sulfides in steels with different Ti contents in as-cast samples.
Metals 12 01402 g008
Figure 9. Typical diagrams of pure MnS inclusions (a) SEM morphology of inclusions; (b) composition distribution of inclusions.
Metals 12 01402 g009
Figure 10. Typical MnS diagrams with TiN as nucleation core (a) SEM morphology of inclusions; (b) composition distribution of inclusions.
Metals 12 01402 g010
Figure 11. Typical MnS diagrams with oxides and TiN as cores (a) SEM morphology of inclusions; (b) composition distribution of inclusions.
Metals 12 01402 g011
Figure 12. MnS with oxide as the nucleus (a) SEM morphology of inclusions; (b) composition distribution of inclusions.
Metals 12 01402 g012
Figure 13. MnS typical diagram associated with TiN precipitation (a) SEM morphology of inclusions; (b) composition distribution of inclusions.
Metals 12 01402 g013
Figure 14. Typical MnS patterns pinned by TiN (a) SEM morphology of inclusions; (b) composition distribution of inclusions.
Metals 12 01402 g014
Figure 15. Typical morphology of sulfides in experimental steels with different composition under rolling condition (a) 0.006% Ti; (b) 0.028% Ti; (c) 0.055% Ti.
Metals 12 01402 g015
Figure 16. Variation of length–width ratio of sulfides in steels with different compositions under rolling condition.
Metals 12 01402 g016
Figure 17. Variation of average length–width ratio of sulfides in steels with different compositions under rolling condition.
Metals 12 01402 g017
Figure 18. Relationship between TiN activity product and solid fraction of steel with different Ti content (a) liquid phase; (b) solid phase.
Metals 12 01402 g018
Figure 19. Relationship between MnS activity product and solid fraction of steel with different Ti content (a) liquid phase; (b) solid phase.
Metals 12 01402 g019
Table 1. Composition and element contents of non-quenched and tempered steel for test (ωt%).
No.CSiPMnSTiNAlVNbO
10.3330.3880.0091.8120.0440.0060.0180.0050.0260.0240.0019
20.3140.5380.0091.6590.0460.0280.0240.0060.0260.0210.0030
30.3300.5470.0091.5660.0450.0550.0250.0160.0270.0240.0025
Table 2. Composition and proportion statistics of sulfides in three steel samples under rolling.
Ti Content/ωt %Pure MnSTi-Containing Composite SulfidesOther Composite Sulfides
MnS with TiN as the CoreMnS Precipitated with TiNMnS Pinned by TiNMnS with Oxide as the CoreMnS Precipitated with Oxide
0.00685.5%-4.8%1.6%6.5%1.6%
0.02874.4%5.1%20.1%-0.4%-
0.05561.5%19.2%9.6%7.7%2.0%-
Table 3. Liquidus and solidus temperatures of three experimental steels.
Ti Content/ωt %0.0060.0280.055
T L 1501 °C1500 °C1499 °C
T S 1388 °C1390 °C1390 °C
Table 4. Interaction coefficients of elements to Ti, N, Mn and S elements at 1600 °C.
Element jCSiMnPSTiAlVNbON
e Ti j [26]−0.165 [27]0.05 [27]0.0043 [27]−0.06−0.270.042000−3.4−2.041
e N j [26]0.130.048−0.020.0590.007−0.590.01−0.123−0.068−0.120
e Mn j [27]−0.070.390−0.0035−0.0480000.0035−0.083−0.091
e s j [27]0.1120.063−0.0260.29−0.028−0.0720.035−0.016−0.013−0.270.01
Table 5. Initial solid phase ratio and initial precipitation temperature of MnS and TiN in solid–liquid two-phase region.
Ti Content/ωt %0.0060.0280.055
MnS liquid fs/solid fs0.78/0.620.77/0.590.77/0.59
TiN liquid fs/solid fs0.79/0.790.37/0.340/0
MnS T (liquid fs)/T (solid fs)1449 °C/1469 °C1451 °C/1472 °C1449 °C/1470 °C
TiN T (liquid fs)/T (solid fs)1447 °C/1447 °C1487 °C/1488 °C>1499 °C/>1499 °C
Publisher’s Note: MDPI stays neutral with regard to jurisdictional claims in published maps and institutional affiliations.

