Article

Stir Casting Process Analysis and Optimization for Better Properties in Al-MWCNT-GR-Based Hybrid Composites

by
Kanchiraya Shivalingaiah
1,
Vinayaka Nagarajaiah
2,*,
Chithirai Pon Selvan
3,
Smitha Thothera Kariappa
4,
Nandini Gowdru Chandrashekarappa
5,
Avinash Lakshmikanthan
6,
Manjunath Patel Gowdru Chandrashekarappa
7 and
Emanoil Linul
8,*
1
Department of Mechanical Engineering, Government Engineering College, Visvesvaraya Technological University, Belagavi 573201, India
2
Department of Aeronautical Engineering, Nitte Meenakshi Institute of Technology, Affiliated to Visvesvaraya Technological University, Belagavi 590018, India
3
School of Science and Engineering, Curtin University, Dubai 345031, United Arab Emirates
4
Department of Technical Education, Sri Jayachamarajendra (Govt) Polytechnic, Bangalore 560008, India
5
Department of Technical Education, Govt. Women’s Polytechnic, Shiralkoppa 577428, India
6
Department of Mechanical Engineering, Nitte Meenakshi Institute of Technology, Affiliated to Visvesvaraya Technological University, Belagavi 590018, India
7
Department of Mechanical Engineering, PES Institute of Technology and Management, Visvesvaraya Technological University, Belagavi 577204, India
8
Department of Mechanics and Strength of Materials, Politehnica University Timisoara, 300 222 Timisoara, Romania
*
Authors to whom correspondence should be addressed.
Metals 2022, 12(8), 1297; https://doi.org/10.3390/met12081297
Submission received: 4 July 2022 / Revised: 27 July 2022 / Accepted: 29 July 2022 / Published: 1 August 2022
(This article belongs to the Section Metal Matrix Composites)

Abstract

:
Pure aluminium poses inferior properties that limit its use in load-bearing applications. Reinforcing multiwall carbon nano-tube (solid lubricant) and graphene to aluminium matrix offers better (antifriction, hardness, and wear resistance) properties in composites for such applications. A stir casting processing route is employed to prepare the hybrid composite (aluminium-multiwall carbon nanotube-graphene Al-MWCNT-GR). The Taguchi L16 experimental matrix representing four variables (percent reinforcement of graphene, die temperature, melt temperature, and stir speed) operating at four levels were studied to analyze and obtain higher hardness and low wear rate in hybrid composites. Percent reinforcement of graphene showed maximum impact, and die temperature resulted with the least contribution towards both the responses. Criteria importance through intercriteria correlation (CRITIC) method is applied to determine the weight fractions (importance) for hardness and wear rate equal to 0.4752 and 0.5482, respectively. Grey relational analysis (GRA) and multi-objective optimization by the ratio analysis (MOORA) method converts multiple objective functions into a single objective function with weight fractions assigned to each output. Taguchi-CRITIC-MOORA outperformed the Taguchi-CRITIC-GRA method, which could result in 31.77% increase in hardness and a 36.33% decrease in wear rate compared to initial conditions. The optimal conditions ensure a dense microstructure with minimal pores, result in enhanced properties compared to that obtained for initial and average stir casting conditions. The worn-out surface results in a few thin and slender grooves between tracks with less crack propagation, ensuring self-lubrication in composites fabricated with the optimized condition. The better properties resulted in the hybrid composites correspond to optimized stir casting conditions and can be implemented in industries for large-scale applications.

1. Introduction

Modern industries aimed at developing components possessing attractive properties (strength, stiffness, corrosion, wear resistance, etc.) [1]. Composites constitute two or more constituent materials and offer distinguished physical and chemical properties that ensure desired properties [2,3]. Compared to individual constituent materials, the composite materials showed superior properties [4]. In composite materials, the metal matrix (rather than polymer or mineral) offers better conductivity (thermal and electrical), moisture-free, mechanical, and tribological properties [5,6,7,8]. Thereby, metal matrix composites (MMCs) are widely used in biomedical (knives, blades), electrical, automotive, and aerospace applications (such as engine valves, connecting rods, impeller, jet engine propulsion, chassis, transmission shafts, cables tracks, discs, suspension arms, nozzles, etc.) [9,10,11]. MMCs used in automotive industries are replacing steel parts with composite materials for economic benefits (i.e., reduced fuel consumption) [3,12,13]. To ascertain both technological and economic benefits with desired properties, an extensive study on the selection of constituent materials for developing composites is of industrial relevance.
MMCs are fabricated with the combination of a matrix (Al, Ti, Mg, Cu, etc.) and reinforcement materials (metallic: oxides, nitrides, borides, carbides, etc.; non-metallic: fly ash, red mud) materials [14,15]. Reinforcement materials (particles or fibers) are stronger than the matrix material and dispersed in the matrix to fabricate the composites [10]. Thus, the composites pose better properties than the matrix and deteriorate slower than reinforcement materials [11]. Reinforcing metallic materials in aluminium matrix ensures better strength (due to interfacial bonding between matrix-reinforcement) in composites and is therefore used in many industrial applications [3,16,17,18]. In the last decade, 2235 worldwide published Scopus documents reported on metallic reinforcements to fabricate composites with potential strength and stiffness properties [2,7]. Using hard constituent reinforcement materials (i.e., carbides, oxides, nitrides, and borides) in composites poses problems with machining, abrades the mating surface during sliding, is prone to cracking during mechanical loading, extricates materials as fragments, and reduces ductility and premature failure of composites [19,20]. Tribological properties are affected greatly by the abrasive action of reinforcement materials during mating surfaces [21]. Therefore, the selection of ideal candidature reinforcement material for aluminium matrix is of industrial concern and requires intense research.
In recent years, carbon-based reinforcement materials (namely, carbon nanotubes CNTs and graphene) showed remarkable properties (i.e., stiffness and strength) in composites suitable for energy absorbers in body armor applications [1]. The CNTs and graphene possess anti-frictional properties and therefore act as self-lubricating composites [22,23]. CNTs have hallow nano-size fiber structure evolving from a graphene layer, wherein walls of nanotubes consist of strong carbon atoms bonded together like graphene [24]. Graphene is the thinnest material stronger than 300 times that of steel, possessing a harder structure and heat conductor than diamonds [25]. Carbon-based reinforcement materials possessing nano dimensions ensure superior properties (better strength, low density, formability, thermal and electrical conductivity, tribological, etc.) [1,25]. The properties mentioned ensure that carbon reinforcement materials are suitable for almost all applications such as automotive, aerospace, energy, electrical and electronics, biomedical, and so on [25,26]. Graphene reinforcement to aluminium matrix resulted in a 62% increase in the tensile strength [27]. Uniformly distributed 0.3 wt.% of graphene in an Al matrix resulted in a 62% increase in the strength of the composites. CNTs as a reinforcement to the Al matrix resulted in better properties (strength, hardness, ductility) [28]. The influence of graphene/CNTs in the Al matrix resulted in improved mechanical properties. The use of graphene material ensures better technological and economical (production from waste graphite from metal smelting) benefits in composites [29]. Although a lot of research is reported in developing composites (reinforcing individual materials to aluminium matrix), most of them are fabricated, viz., powder metallurgy, extrusion, and the forming process route [25]. It is imperative from the above literature review that the study of the economical processing route for fabricating composites (reinforcing graphene and CNTs in aluminium matrix) are of industrial relevance.
Metal matrix and reinforcing phases are combined to prepare composites, viz., liquid state processing (casting route: centrifugal, squeeze, gravity die, compo-casting, rheo-casting, stir casting, etc.). In addition, other processing routes (powder metallurgy, in-situ process, spray deposition, accumulative roll bonding, etc.) and solid-state fabrication routes (such as friction stir, mechanical alloying, accumulative roll bonding, sintering techniques are spark plasma, microwave, vacuum, or gas) were also employed to prepare the composites [30,31]. The stir cast processing route poses advantages over other processing routes, such as simplicity, flexibility, versatility over a wide range of materials, an economical, and high production rate with large size composite production [7,31,32]. The stir casting route suffers major drawbacks such as agglomeration and fracture of reinforcement particles, gas entrapment, and creating a vortex with impurities during mechanical agitation and local solidification [33,34,35,36]. In MMCs, optimal properties rely on fairly dispersed reinforcements in matrix material, wettable characteristics between matrix-reinforcements, and porosity levels. Note that appropriate control of stir casting variables (metal-mold temperature, stirring duration and speed, reinforcement size and type, and so on) resulted in optimized properties in the composites [2,31]. Therefore, optimizing the stir casting variables is indeed essential for offering better properties in composites.
Recently, worldwide research attention is focused on predicting the optimized stir casting conditions viz. traditional one-factor-at-a-time approach [37,38], analytical [39], and numerical approaches [40,41]. However, determining optimal stir casting conditions with the above methods suffers major drawbacks; the traditional approach requires many experimental trials and is treated impractically, whereas many assumptions are made with numerical and analytical methods, which are often difficult to meet with experimental conditions. The Taguchi method optimizes multiple factors with limited experimental trials that ensure improved quality in manufactured parts [42,43,44]. The Taguchi method optimizes the stir casting parameters (stir speed and time, percent reinforcement, processing temperature) for better strength [45], hardness and ultimate tensile strength [46,47], corrosion rate [48], and wear performance [49] of composites. Stir speed is the major contributing factor influencing the strength of the composites [45]. Stirring time of 10 min and MWCNT significantly influence the hardness and ultimate tensile strength in the composites [46]. Percent reinforcement followed by stir speed showed maximum impact on hardness, tensile strength, and corrosion rate in the composite samples [47,48]. Higher hardness and wear resistance in composite samples are the essential properties suitable for load-bearing applications [50,51]. Taguchi determined optimal stir casting conditions for multiple outputs are different. Furthermore, the Taguchi method limits optimizing multiple outputs with the effect of multiple factors. However, the stir casting process output performances are affected by multiple inputs (percent reinforcement, stir speed, stir time). Therefore, attempts thus required to develop hybrid methods that optimize multiple-input variables for multiple outputs (i.e., composite properties) fabricated through the stir casting process.
Stir casting parameters are optimized for multiple responses using different techniques such as GRA [30], technique for order preference by similarity to ideal solution (TOPSIS) [30], and so on. The MOORA optimization method outperforms TOPSIS, GRA, and Vlsekriterijumska Optimizacija I KOmpromisno Resenje (VIKOR) methods while optimizing multiple responses with less computation time and steps [52]. The above methods convert multiple outputs to single output while performing multiple-objective optimization. The major drawbacks are equal weights assigned to all responses while conducting multi-objective optimization. Assigning equal weights to all outputs may not always yield optimal process conditions while solving real-life engineering problems, and therefore suitable scientific weight determining methods are essential [53,54,55]. In literature, weights for each response are determined using analytical hierarchy process [56], equal weights [57,58], principal component analysis [59,60], entropy [56], CRITIC [61], and so on. The above literature review proved that no acceptable universal method has been defined yet to determine weights for individual responses and perform multiple-objective optimization.
From the thorough literature review: (1) the Taguchi method estimates the factor effects and details the process insights with minimum experimental trials; (2) the Taguchi method limit to simultaneously optimize multiple outputs, and can be solved by the said problem mentioned effectively, viz., GRA and MOORA methods; (3) CRITIC is an efficient method to predict weights for all outputs that could help to determine the best processing conditions. The above methods possess their strengths and weakness. Therefore, developing a hybrid approach is essential to capitalize on the strengths and eliminate the weaknesses of different techniques. Not many research efforts are being made to fabricate hybrid composites (Al-CNTs-Gr) viz. a stir casting route. In addition, the hybrid composites properties (hardness and wear rate) are not analyzed and optimized considering the influencing stir casting parameters (percent reinforcement of graphene, die temperature, melt temperature, and stir speed). Furthermore, hybrid optimization methods are not applied to optimize the stir casting parameters for higher hardness and lesser wear rate in hybrid composites.
The present research aims to optimize the stir casting parameters that produce higher hardness with a reduced wear rate. In addition, this research work possesses significant novelty in fabricating hybrid composites (Al-MWCNT-Gr) using a stir cast process route and optimizing viz. hybrid approaches (Taguchi-CRITIC-GRA and Taguchi-CRITIC-MOORA) that could offer better hardness and wear resistance suitable for load bearing applications. Furthermore, SEM morphologies of composites (with and without wear examinations) fabricated with different stir casting conditions were examined and validated with optimized conditions, viz. hybrid optimization approaches.

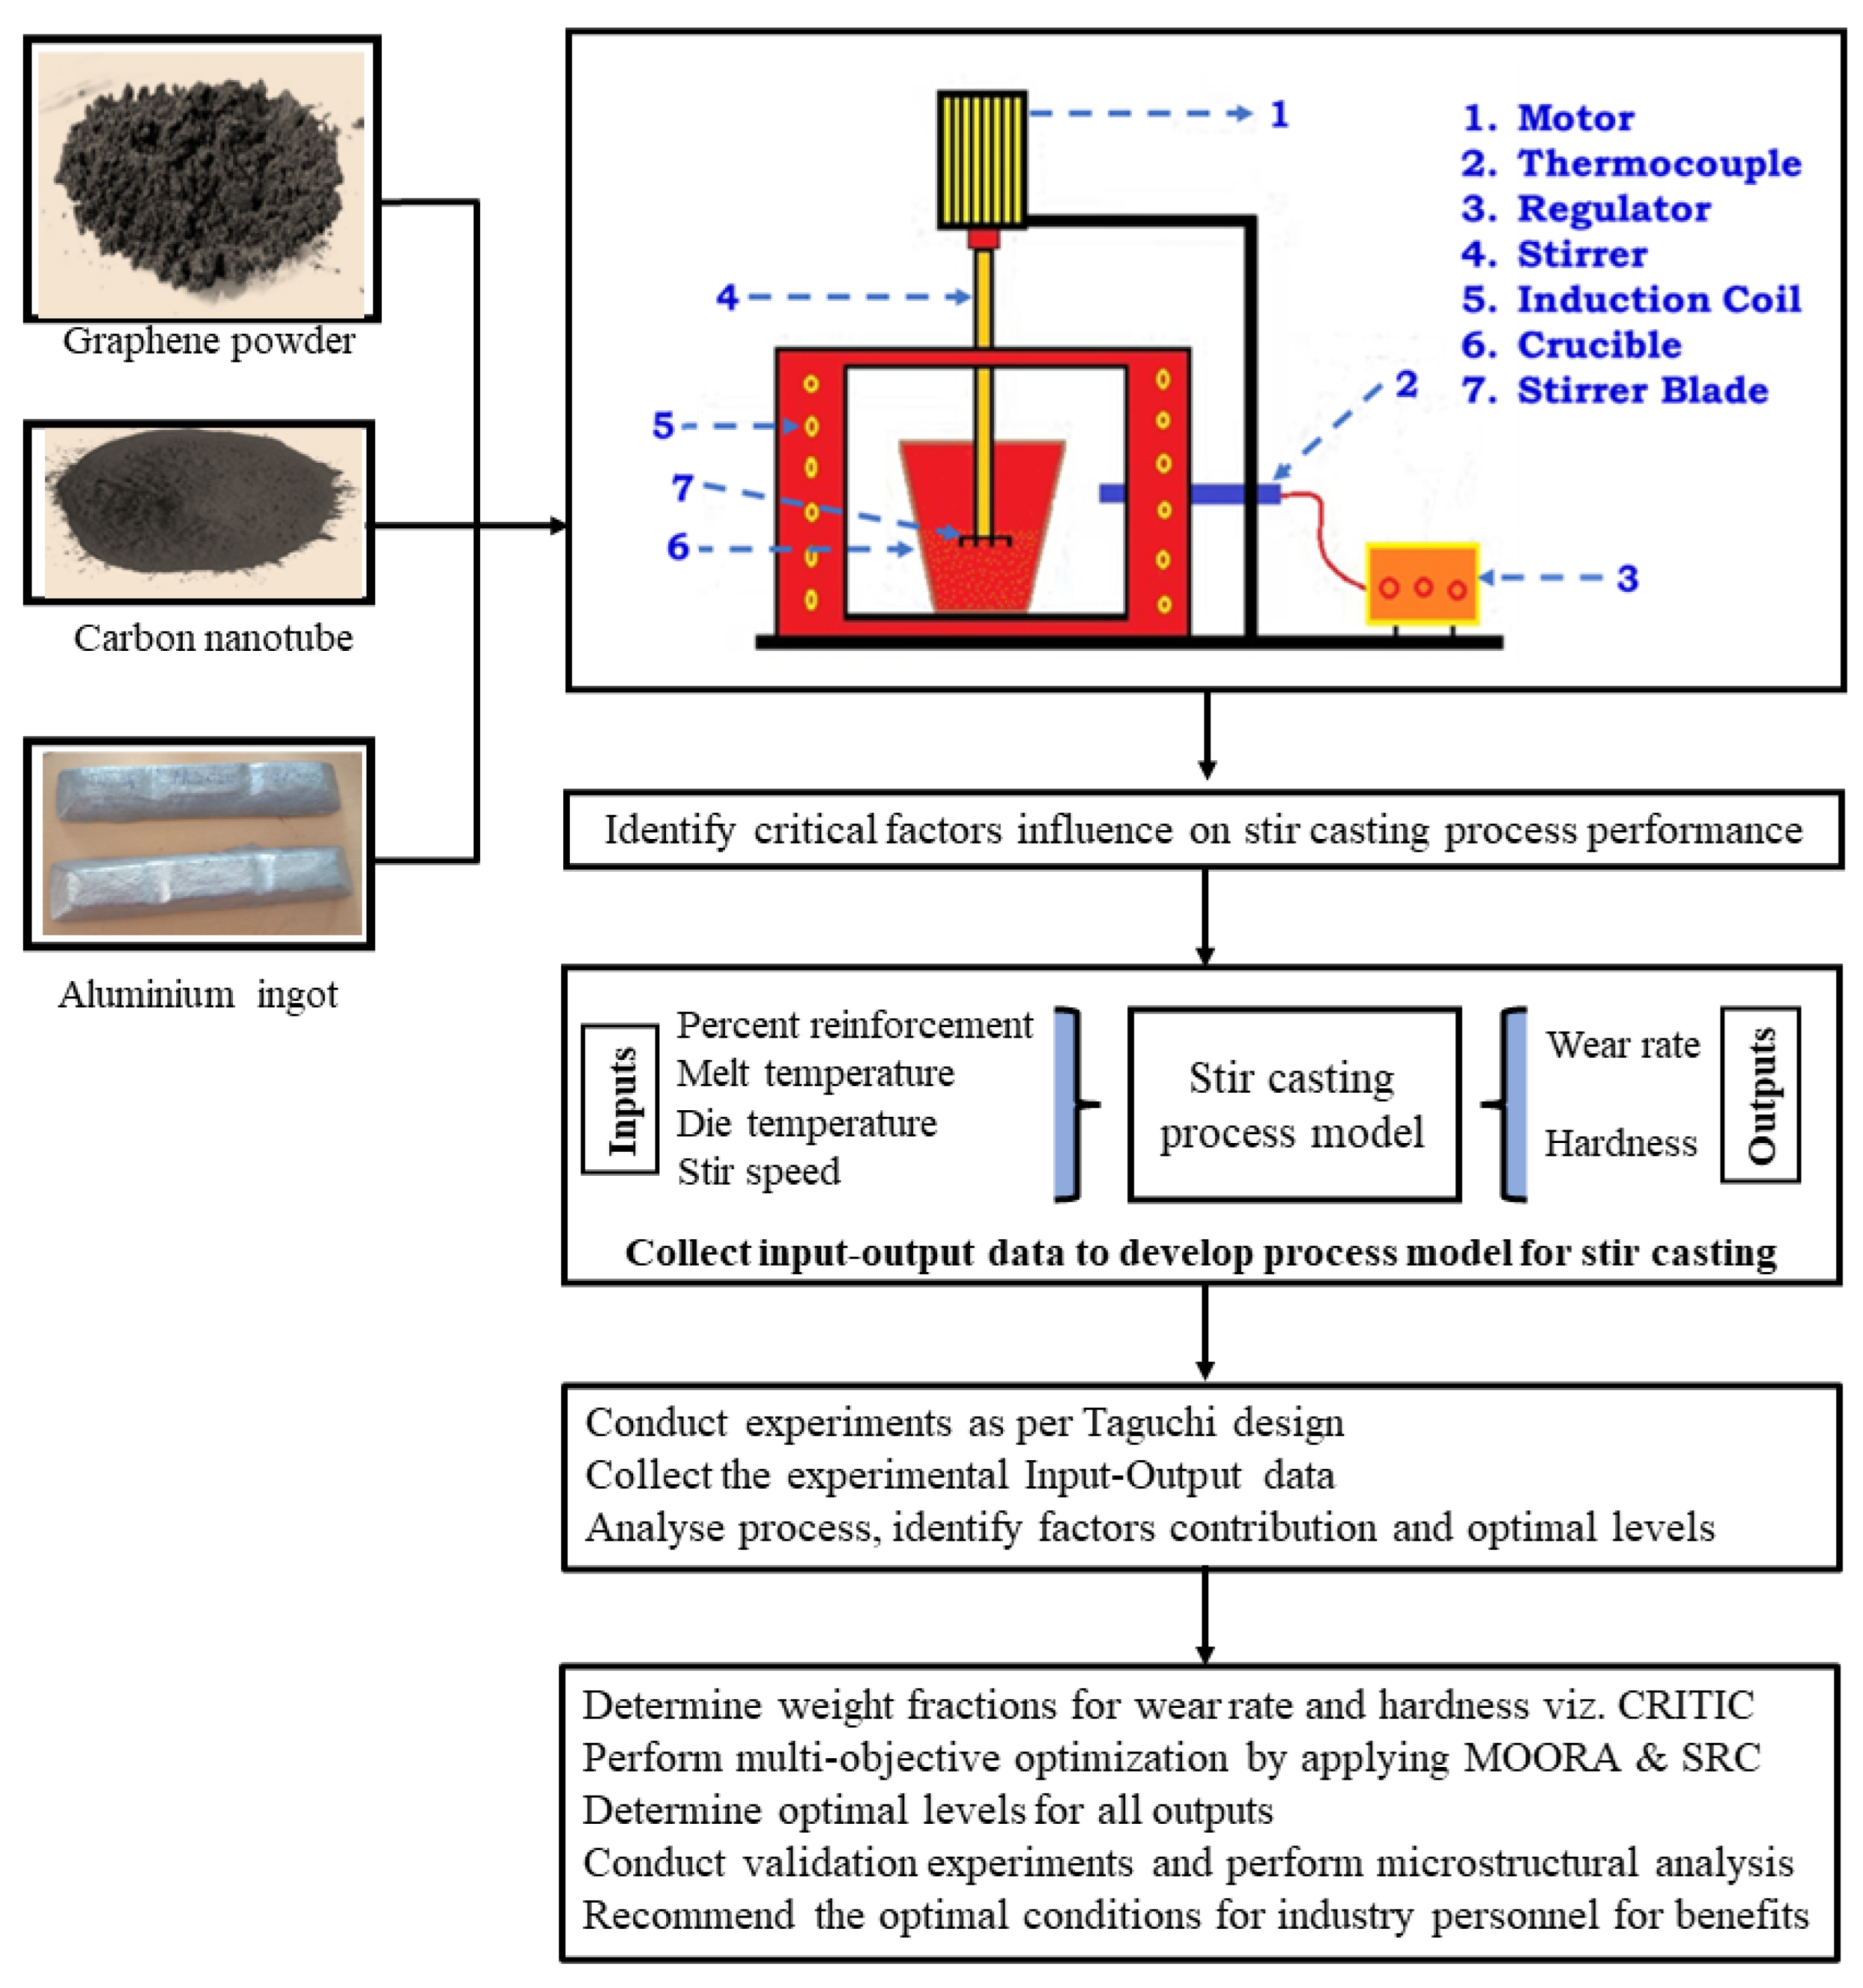
2. Materials and Experimental Set-up

2.1. Materials

MMCs were prepared viz. a stir casting route, wherein matrix material (i.e., pure aluminium > 98.5% purity) is supplied by FENFE Metallurgical, Bangalore, India. The MWCNT powder of >98% purity having ~95 vol% (O.D × L (20 ± 10 nm; × 10 ± 5 μm); ρ ~ 1–2 g/cc) and graphene powder of >99% purity have an average flake thickness of 10 ± 5 nm as assessed through SEM analysis and were procured from Sigma-Aldrich, USA. The reinforcement (MWCNT + graphene) materials were added to the pure aluminium matrix that could fabricate hybrid composites (Al-2%MWCNT-GR) viz. stir casting route.

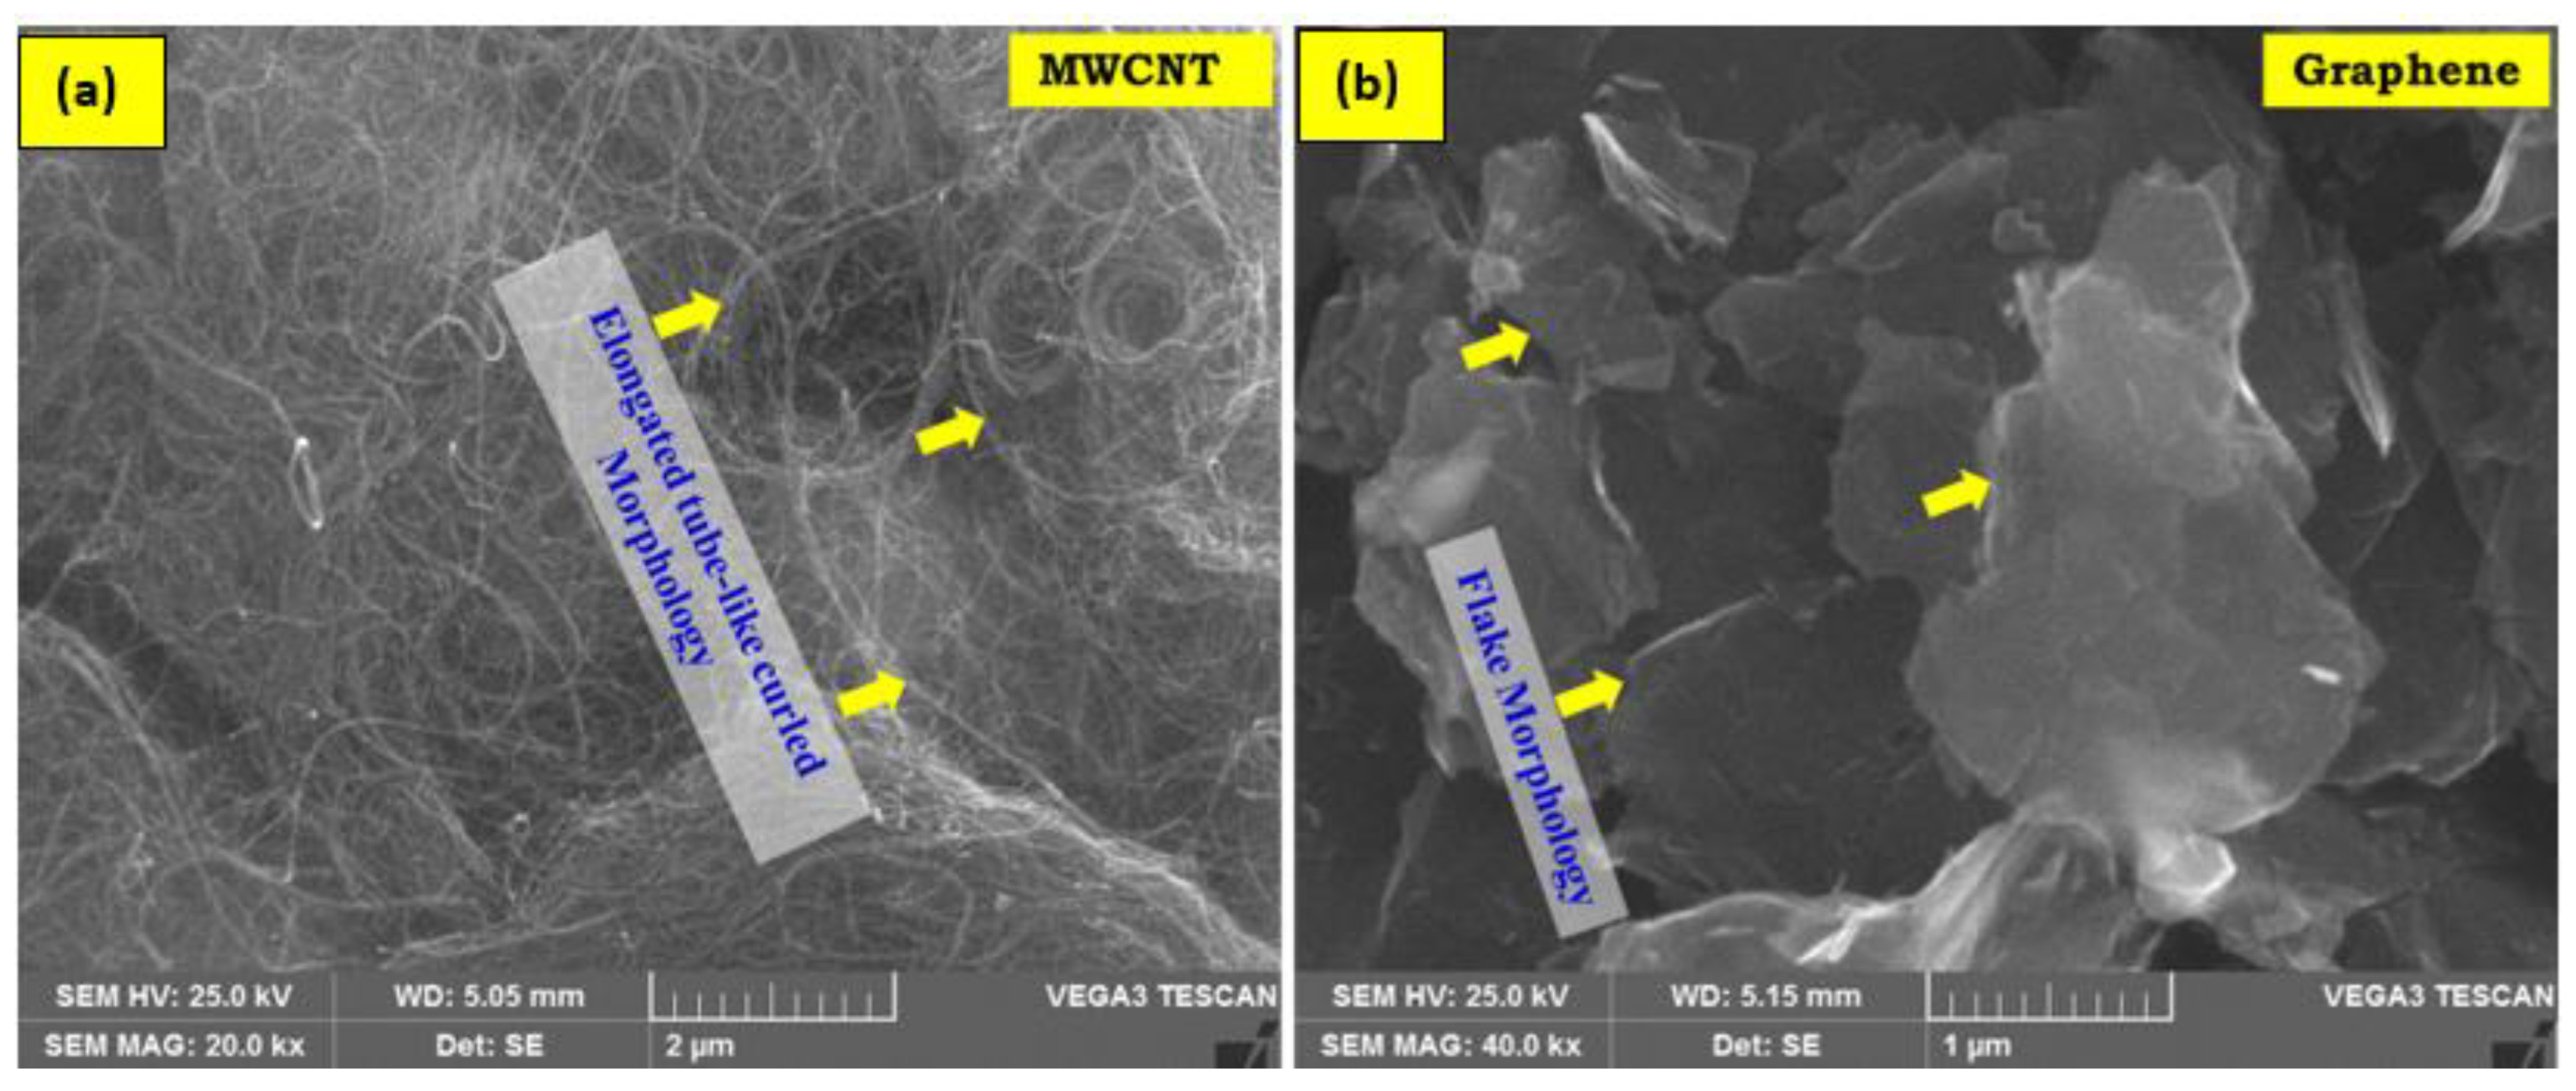
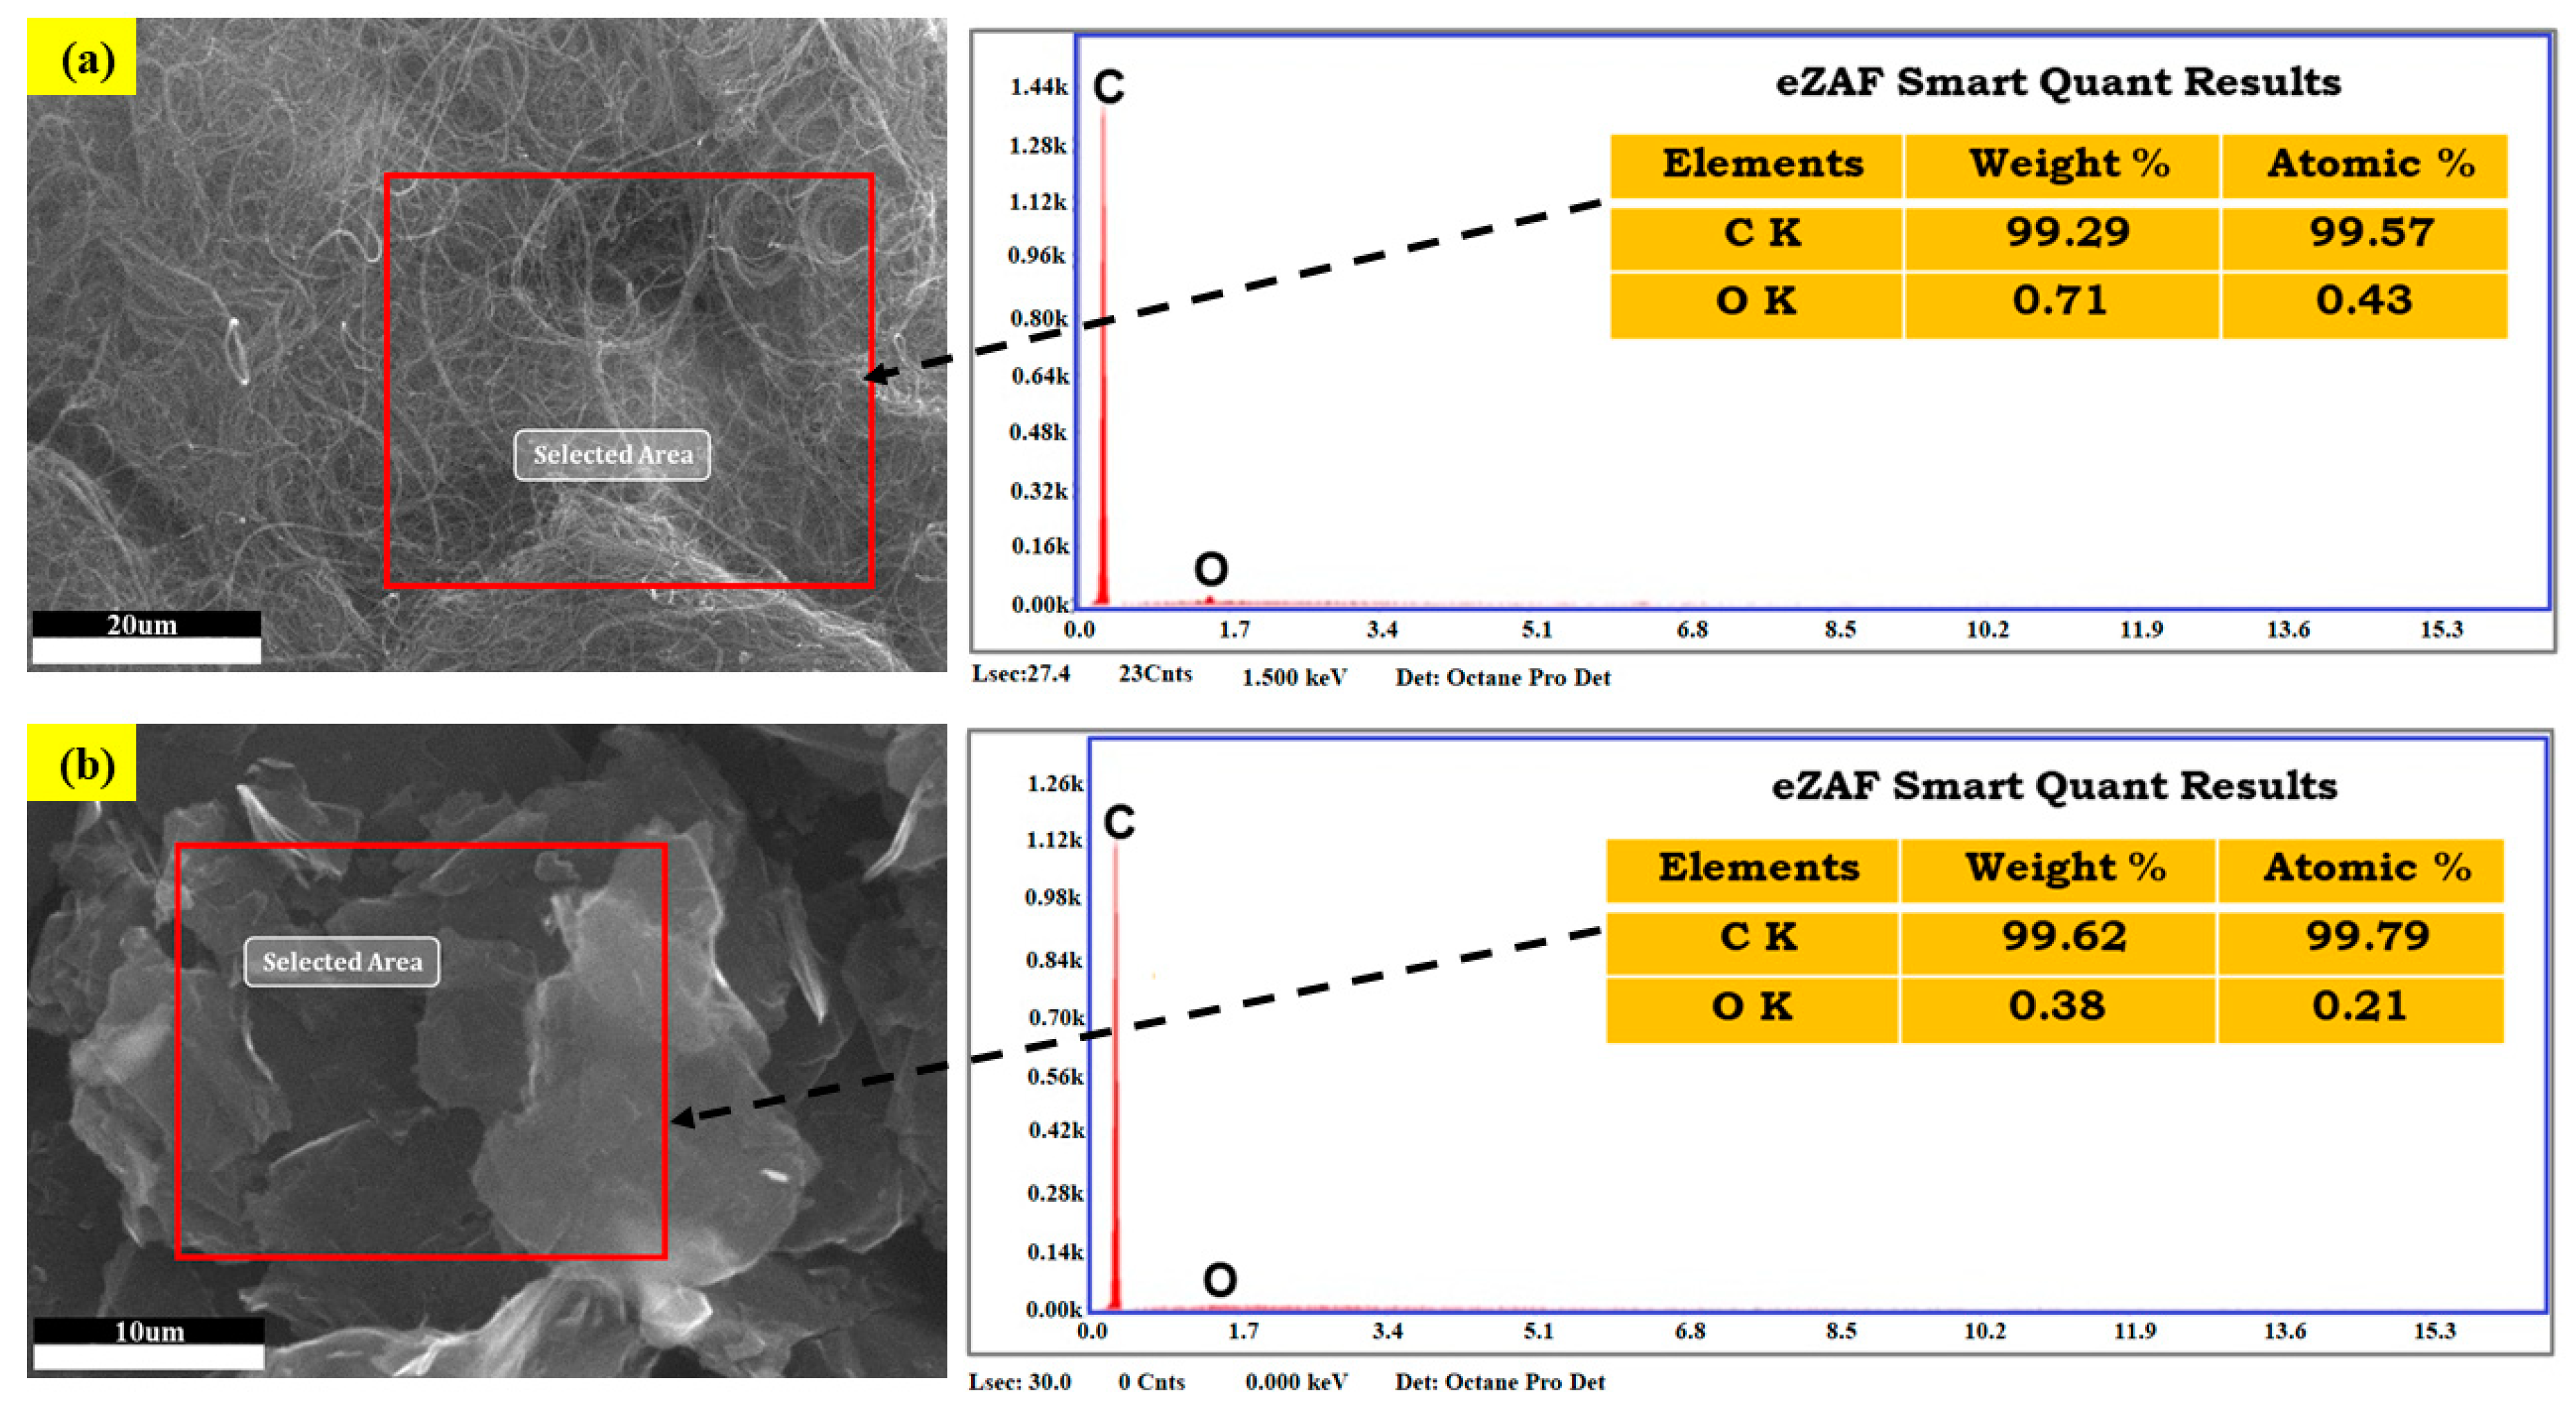
2.2. Powder Morphology Studies

Figure 1a,b reveals the SEM image of Gr and MWCNT in their pristine state. Figure 1a shows the morphology of MWCNT as an elongated tube-like structure curled and agglomerated in a few places. Figure 1b shows flake morphology like structured graphene nanoparticles possessing irregular shapes.
EDS analysis of reinforcement (Graphene and MWCNT) materials is presented in Figure 2a,b. EDS assessment confirms the presence of high carbon content (>99%) in Graphene and MWCNT with negligible traces of oxygen (refer to Figure 2).

2.3. Experimental Set-Up

Fair distribution of reinforcement in the aluminium matrix and fabricating hybrid composites with better properties at reduced cost ensures stir casting as an efficient process [16]. Aluminium ingot sliced into small pieces viz. power hacksaw, followed by cleaning with acetone (to remove dirt, grease, carbon deposits, etc.), drying and melting in a graphite crucible. The reinforcement materials were preheated in an electric resistance furnace (say 400 °C). Preheating reinforcement removes moisture, impurities, and reduces dampness (present, if any) and particle agglomeration. Later, 2.5% wt. of MWCNTs and graphene (1, 2, 3 & 4 wt.%) materials with desired weight proportions taken with traces of magnesium powder in an aluminium foil were introduced to the bottom of the prepared aluminium melt with the help of a plunger and stirred mechanically for 6 min of duration.
The critical factors (percent reinforcement of graphene, melt temperature, die temperature, and stir speed) and their levels are selected after conducting pilot experimental trials at a research laboratory and consulting literature review [45,46,47,53]. The mechanical stirrer immersed inside the surface of the melt was rotated with the pre-set stirring speed and time. Stirring time has been kept fixed to 6 min after conducting pilot experimental trials, which ensure that better properties (hardness and wear rate) might be due to fair and uniform dispersion of reinforcement material in the Al matrix. Degassing is performed to remove the presence of absorbed gases in the melt. The application of cover flux cleans the foreign materials (if any) present in the molten matrix. The cleaned and degasified molten metal was allowed to fill the preheated mold cavity. Finally, the solidified composites are subjected to hardness and wear rate characterizations. The framework was employed to perform stir casting experiments that could analyze the process insights and optimization for better quality (higher hardness and lower wear rate) in composites are illustrated in Figure 3.

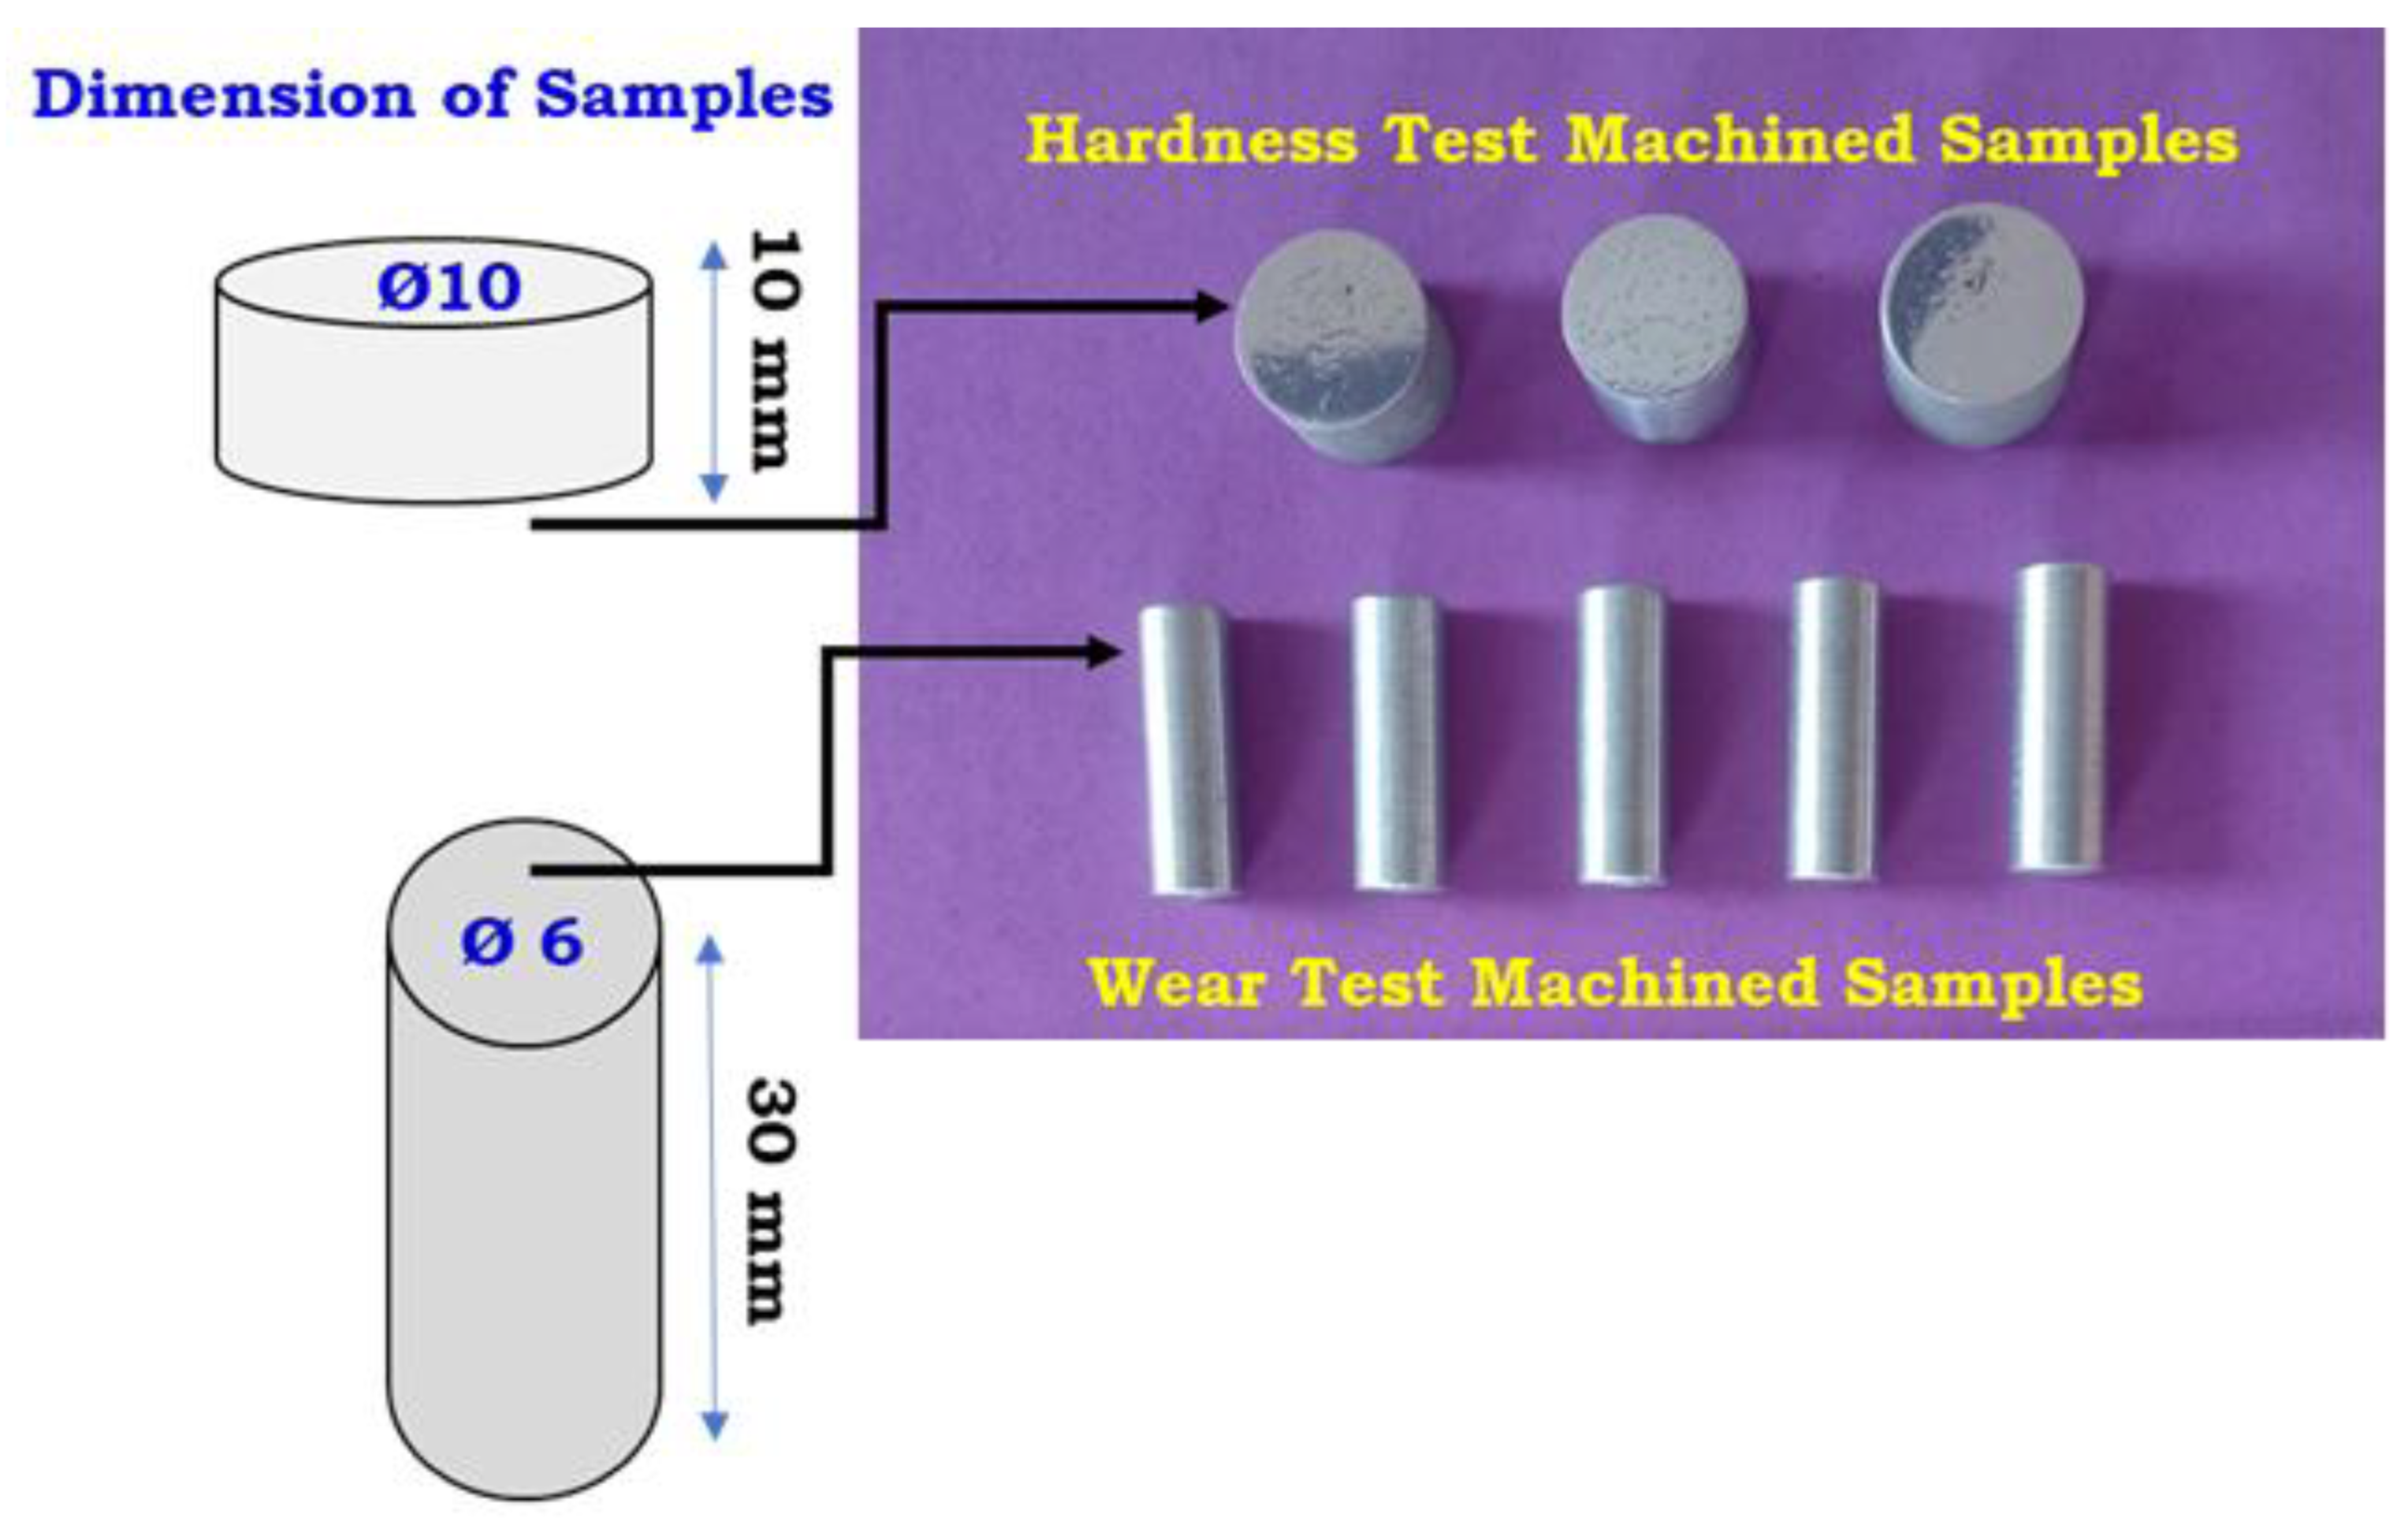
Response Measurements and Characterization

The stir cast specimens’ dimensions are Ø 20 mm and 50 mm in height. The stir cast specimens were subjected to mechanical (hardness), wear rate, and worn surface morphology characterizations. The composite specimens were machined viz. milling to ensure a flat surface before hardness measurements, followed by cleaning and air drying. ASTM E384 standards were followed to record the hardness on the stir cast specimens possessing dimensions of Ø 10 mm × 10 mm (refer to Figure 4). Vickers hardness tester is used to carry out the hardness of the samples as per ASTM E384 standard. A Vickers hardness tester possessing standard rectangular pyramid diamond indenter (136° ± 0.5°) was used to apply a load of 1 kg for about 30 s.
Note that the average (five indentations on three replicates = 3 × 5 = 15) of fifteen hardness indentation values are recorded corresponding to each experimental trial. This work examined the wear rate measurements on the dimensions (Ø 6 mm × 30 mm) of the composite samples (pin material) as per the ASTM G99 standard (refer to Figure 4). The wear rate investigations are conducted viz. pin-on-disc wear test rig. The testing conditions (load: 30 N; sliding velocity: 2 m/s; sliding distance: 1200 m) for performing wear rate measurements on the composite samples are done against the counter-face disc of a hard surface possessing the hardness of 60 HRC. The wear test conditions are selected after fixing successive trials and consulting published literature [62]. The top and bottom section of the stir casting specimen is made flat subjected to belt grinder and milling operation. The composite samples’ average surface roughness (Ra) before wear test examination is kept equal to 1.0 ± 0.1 µm. The specimens are subjected to wear examination at room temperature (i.e., 30 °C). Before and after wear tests, the composite samples were cleaned with acetone, followed by drying. The measurement of wear test samples is performed viz. digital weighing balance (accuracy of ±0.0001 g). The wear rate of composite samples is computed based on weight loss measurements after wear tests, and the same is transformed to volume loss per unit of sliding distance. The resulting wear rate of composite specimens is recorded mm3/min. The average wear rate values of three composite sample replicates (correspond to each experimental condition) were used to perform analysis and optimization. After conducting the wear tests, the worn surface morphology corresponding to composite test samples was subjected to microstructural characterizations (scanning electron microscope).

2.4. Hybrid Optimization Approach

Genichi Taguchi proposed the Taguchi method for planning and conducting experimental trials that could analyze the process variables influencing the improvement of product quality. Stir casting parameters affect the quality (hardness and wear rate) of fabricated composites. Most influencing factors that affect the composite quality are presented in Table 1. Please note that pilot experimental studies are conducted at research laboratories by varying carbon nanotubes from 1% to 5%. The results showed that, after 2.5 wt.% of MWCNT in the Al matrix, no significant improvement in the properties is observed. Experiments are also performed for the fixed 2.5 wt.% of MWCNT, with variations in graphene addition (1–5 wt.%) to the Al matrix. The results revealed that, after 4 wt.% in graphene, no significant improvement in properties is recorded. Therefore, the present work employed 2.5 wt.% of MWCNTs and varied the graphene from 1 to 4 wt.% to examine properties viz. Taguchi method. Similarly, die temperature (100–300 °C), melt temperature (650–790 °C), and stir speed (450–600 rpm) parameters are examined. The critical factors (melt temperature, die temperature, and stir speed) and their levels are selected after conducting pilot experimental trials and consulting the literature review [45,46,47,53]. The stir casting experimental factors and operating levels are presented in Table 1.
Taguchi L16 orthogonal array experimental trials (each trial is repeated three times, which increases precision in measurements and analysis) were used to conduct experiments and perform input factor analysis on outputs that could result in process insights and locate optimal solutions. The Taguchi L16 experimental plan for four parameters operating at four levels is selected using Minitab Software. The Taguchi method applied the Pareto Analysis of Variance that could analyze and optimize process offline with limited experiments [63]. Pareto Analysis of Variance was carried out to analyze and optimize the process variables for higher hardness and lesser wear rate viz. Microsoft Excel. Taguchi’s method optimizes only a single response at once while analyzing multiple factors. Attempts are required to transform the multiple responses into a single response that performs multi-objective optimization.
The Taguchi method is applied to conduct minimum experiments and perform factor analysis that could optimize individual outputs. The Taguchi method is limited to optimizing multiple outputs and therefore requires multiple objective optimization tools (for example, GRA and MOORA). GRA and MOORA methods optimize the multiple factors for multiple outputs and are carried out viz. Microsoft Excel Software platform. The necessary steps to transform multiple responses to a single response function with GRA and MOORA methods that are essential for conducting multiple-objective optimization are presented in Figure 5. The individual outputs were combined to form single objective function (grey relational grading: GRA; MOORA index: MOORA) with weight fractions. The solution accuracy depends on weight factors assigned to the individual output function. Trial-and-error methods, expert’s advice, and equal weight approaches could result in local solutions [53,54,55,56,57,58,59,60,61]. Therefore, using the Microsoft Excel Software platform, the CRITIC method estimates the weight fractions for individual output functions.
Pareto analysis of variance was carried out with the computed values of grey relational grading and MOORA Index. The optimal conditions with factors contribution for both outputs (hardness and wear rate) are estimated. The developed two hybrid methods (Taguchi-CRITIC-GRA; Taguchi-CRITIC-MOORA) are tested experimentally and validated the models suitable for the stir casting process.

3. Results

The results of the hybrid approach (Taguchi-CRITIC-GRA and Taguchi-CRITIC-MOORA) were developed for the stir casting process that develop a model and optimize the composites for better quality (hardness and wear rate). The composite samples’ microstructure and wear surface morphologies are examined to validate the hybrid approaches.

3.1. Response: Hardness

Table 2 shows the stir casing experimental conditions and corresponding output data. The experimental hardness values are converted to signal-to-noise ratio values with larger-the-better quality characteristics. Pareto analysis of variance is the quick and easiest method to analyze parameters on outputs that do not require F-tests [64]. Pareto ANOVA results for the hardness of the composite samples are presented in Table 3. For each factor, the sum at individual levels was calculated, which helps engineers or industrial personnel to know the optimal levels for a factor. The mean values correspond to the sum at factor levels of all stir casting parameters are estimated, and the same is presented in Figure 6. The SSD values between each factor level and combining all factors were determined (refer to Table 3). The percent contribution of individual control variables is computed considering the ratio of individual factor sum of squares and the total sum of the square of all factors (refer to Table 3). Pareto ANOVA results showed that the percent reinforcement of graphene (PC: 76.77%) material contributes more to the hardness of composites. Note that the other three parameters’ (stirring speed: 10.43%; melt temperature: 7.22%; die temperature: 5.58%) contributions cannot be neglected as their percent contributions are greater than 5%. PR3DT2MT4SS2 is the optimal factor level for achieving higher hardness in hybrid composites (refer to Table 3 and Figure 6).
The graphene reinforcements up to 3% in an aluminium matrix increases the hardness values and thereafter decreases. This could be because beyond the critical limit of graphene addition results in large pit formation and surface deterioration in the hybrid composites. Similar observations are reported in AA7075 aluminium nanocomposites [65]. The processing temperatures, such as die temperature of 180 °C and melt temperature of 770 °C (negligible changes in hardness values after melting temperature of 740 °C), resulted in higher hardness values in hybrid composites. Low processing temperatures cause premature solidification, whereas prolonged solidification (longer cycle time) occurs at higher processing temperatures [66,67]. Stirring speed after crossing 520 rpm resulted in decreased hardness values. It was observed that the viscosity of aluminium melt was affected with stirring speed [68]. Lower stirring speed may suspend and hold the reinforcement particles at any location (resulted in agglomeration), whereas, beyond the critical stirring speed, the hardness of composites decreases. This occurs because vigorous stirring enables gas pick-ups, oxide-skins, and contaminants to melt [69,70]. The determined optimal levels (PR3DT2MT4SS2) were not one among the set of L16 experiments presented in Table 3. This might be due to the multi-factor nature among the possible combinations (44 = levelsfactors) of 256 experiments [71].

3.2. Response: Wear Rate

For prolonged service life (during mating surfaces), the performance of composite samples with a lesser wear rate is desired. Therefore, the lower-the-better quality characteristic is employed for performing S/N ratio computation. The collected wear rate data at each experimental trial and converted S/N ratio data are presented in Table 2. Table 4 presents the effect of stir casting factors operating at four levels on wear rate. The mean values of the S/N ratio at each factor level were explained on the wear rate in Figure 7.
The percent reinforcement of graphene showed a dominant effect (80.31%), followed by melt temperature, stirring speed, and die temperature equal to 8.03%, 6.83%, and 4.83%, respectively. The main effect line of three factors (stirring speed, melt temperature, and die temperature) clearly shows a minimal effect compared to percent reinforcement of graphene towards wear rate (refer to Figure 7). The effects and percent contribution of hardness and wear rate are approximately similar. Similar observations are reported in the published literature [72,73], which occurs because of strong dependency among both outputs. Pareto ANOVA results showed the optimal levels (percent reinforcement of graphene: 3%, melt temperature: 740 °C, die temperature: 180 °C, and stirring speed: 520 rpm) for reduced wear rate. The analysis also confirmed that the optimal stir casting conditions for minimizing wear rate are different from those of L16 experimental runs.
The Taguchi method determined separate optimal factor sets, i.e., PR3DT2MT3SS2 for WR and PR3DT2MT4SS2 for the hardness of hybrid composites fabricated with the stir casting process. However, engineers or industry personnel require a single set of stir casting conditions that could optimize multiple objective functions simultaneously. The optimized stir casting conditions vary with weight fractions and are determined with the scientific method. Therefore, hybrid approaches are to be developed that could locate single optimal conditions for better quality in composite samples [59,74].

3.3. Multiple-Objective Optimization for the Stir Casting Process

Multi-objective optimization has been conducted with the help of GRA and MOORA. Note that the weights to be assigned for each output are determined viz. CRITIC method. The hybrid approaches (Taguchi-CRITIC-GRA and Taguchi-CRITIC-MOORA) are developed to conduct the optimization task.

3.3.1. CRITIC

The purpose of the CRITIC method is to determine weights for each response. The CRITIC method employs both beneficial and non-beneficial criteria to optimize conflicting objective functions. In the present work, hardness is treated as a beneficial criterion requiring higher values. In contrast, wear rate is a non-beneficial criterion requiring lower values for better quality in hybrid composites. The steps to determine weights for each output are presented in Figure 5. The Taguchi L16 experiment output data were considered to select the potential alternative to decision-making (Table 2 and Table 4). The experimental output data were normalized to limit the numerical overflow between large and small values (refer to Table 5). Standard deviation (SD) values that correspond to individual quality characteristics are computed (refer to Table 5).
The correlation coefficient (measuring the strength of the relationship between two variables) that corresponds to each criterion was determined and presented their correlation coefficient values associated with different responses (refer to Table 6).
Correlation coefficient matrixes (m × m) are deducted with one, and the computed sum of all responses is presented in Table 7.
The criterion information (Cj) corresponding to each response was calculated to determine the weights for individual responses (refer to Table 8). Higher Cj values indicate a maximum source of information transformed by that criterion, and relative importance (weight fraction) for decision-making [75]. Weights (Wj) correspond to each output were determined by applying the normalization technique (refer to Table 8).
The CRITIC method determined that the weights correspond to HV, and WR is equal to 0.4752 and 0.5428, respectively (refer Table 8). These weights help in transforming multiple outputs into individual output viz., applying GRA and MOORA while conducting multiple objective optimizations.

3.3.2. Multi-Objective Optimization: Taguchi-CRITIC-GRA

The grey system lies between two limits such as the white (complete information of the system is known) and black (completely unknown information of the system) system [59]. Grey systems are more useful where the explicit mechanisms responsible for obtaining the quality in hybrid composites are unclear, but most relevant information and limited data are available [76]. Hybrid methodology approaches combine different methodologies that proved an improved approach in predicting optimal conditions for manufacturing systems [42,52,53,59]. The GRA method ensures transforming multiple (two or more) outputs to individual output functions that could determine optimal conditions for both hardness and wear rate of hybrid composites (Al-MWCNT-Gr). Figure 5 illustrates the steps employed in grey relational analysis for the optimization task. Here, the S/N ratio of each output value is normalized to fall in the ranges between 0 and 1 (refer to Table 9). The grey relational coefficients (GRC) that correspond to normalized S/N ratio values are presented in Table 9.
The grey relational grading (GRG) represents the average values corresponding to the responses (hardness and wear rate) of GRC, with multiplied weights (HV: 0.4752 and WR: 0.5428) supplied by the CRITIC method. The Pareto ANOVA was constructed for the determined GRG values (refer to Table 10).

3.3.3. Multi-Objective Optimization: Taguchi-CRITIC-MOORA

In 2006, Brauers and Zavadskas were credited for developing the MOORA-based multiobjective optimization method, which works with three fundamental principles: ratio system, reference point and full multiplicative [77]. Figure 8 presented the steps in ratio system based on the MOORA method. MOORA uses a decision matrix (consisting of alternatives and responses) based on the S/N ratio. The sum of squares and their square root of summations correspond to S/N ratio values associated with each alternative determined (refer to Table 11).
Normalization steps ensure the values are minimized to lower values (with the ratio of the S/N ratio of individual output to the square root of the sum of squares of that response) (refer to Table 11). The weighted normalized values of each alternative are calculated with those normalized values and corresponding supplied weights by the CRITIC method of hardness and wear rate (refer to Table 8). MOORA index values are computed by adding all weighted normalized values of the responses (refer to Table 11). MOORA Index values are utilized to compute and construct the Pareto ANOVA, and the resulted values are presented in Table 12.

3.4. Summary Results of Multiobjective Optimization

Hybrid tools (Taguchi-CRITIC-MOORA and Taguchi-CRITIC-GRA) were applied to know process insights and determine the set of optimal stir casting conditions for better composite properties (higher hardness and lower wear rate). The computed GRG from Taguchi-CRITIC-GRA and MOORA index by Taguchi-CRITIC-MORRA based on the composite values of responses (i.e., hardness and wear rate) were used to perform the task mentioned (refer to Table 10 and Table 12). The SFL and SSD are computed such that factors of percent contribution and optimal levels are computed. Note that percent reinforcement of graphene showed maximum contribution followed by melt temperature determined by both optimization methods (refer to Table 10 and Table 12). The percent reinforcement is found to have a maximum impact on the hardness of the composite samples in the published literature [47,48]. An increased percent of Graphene reinforcement (3 wt.%) tends to increase the hardness of composites, which increases the abrasion resistance in the composite samples, resulting in reduced wear rate. This might be due to the rubbing action between the hard constituent reinforcement materials and the counter face disc, which causes surface deformation in composite samples. Beyond the critical value of Gr reinforcement (i.e., 4wt.%) in aluminium matrix particles, debonding and cracking resulted in predominant failure mechanisms (higher reinforcement tends to agglomerate in Al matrix) in the composite specimens. Increased stirring speed increases the homogeneity of reinforcement particles in an aluminium matrix [2,7,8,16,23,25,36]. However, beyond the critical value (>520 rpm) resulted in reduced properties. This could be attributed to increased interparticle distance and the possibility of induced porosities in composite samples. Higher stirring speed creates a deep vortex with increased interparticle distance, which causes the atmospheric air to get trapped in an aluminium melt due to higher-pressure differences [78]. Trapped gasses cause porosity in composite samples and reduce their properties. The combination of holding temperature (die temperature: 180 °C, and melt temperature: 740 °C) ensures eutectic temperature that restricts the pore growth in melt and thereby restricts the porosity in composite specimens [34]. Similar observations are reported in the published literature [79]. The optimal factor and operating levels correspond to Taguchi-CRITIC-GRA, and Taguchi-CRITIC-MOORA were found to be equal to PR3DT2MT4SS2 PR3DT2MT3SS2, respectively (refer to Table 13). It is interesting to note that both methods estimated different optimal conditions that are different from those of L16 experiments (refer to Table 10 and Table 12). The rank and optimal levels for both models are found to be different from one another. This might be due to the steps and procedures involved in determining the composite responses being found to be different.
Confirmation experiments were performed for optimal conditions determined by both methods. To know the practical utility of models developed, the results of optimal conditions were compared with initial conditions (refer to Table 13). The Taguchi-CRITIC-MOORA method outperformed Taguchi-CRITIC-GRA in producing higher hardness and lower wear rate in hybrid composites. In addition, the MOORA method solves an optimization task with relatively simple mathematical steps compared to complex equations employed by GRA.
Figure 8 depicts SEM images of the current investigation’s initial, average, and optimal conditions. Figure 8a shows the SEM images of PR1DT1MT1SS1 i.e., initial condition (PR-1%; DT-140 °C; MT-680 °C; SS-480 rpm). Figure 8b shows the SEM images of PR3DT2MT3SS2 i.e., optimal condition (PR-3%; DT-180 °C; MT-740 °C; SS-520 rpm). Figure 8c shows the SEM images of PR2DT3MT4SS1 i.e., average condition (PR-2%; DT-220 °C; MT-770 °C; SS-480 rpm).
Figure 8a shows the pores and particle clusters, which cause reduced material properties. Figure 8b shows the dense microstructure with minimal pores and particle clusters in a few places, which may enhance the materials’ properties. The increase in the properties can be ascribed to consistent dispersal of MWCNTs and Graphene with no clusters or MWCNT-free regions, no porosity, enhanced adherence amongst Al/MWCNT, and retaining graphene properties [80,81,82,83]. In Figure 8c, slight cracks and particle clumps are seen in a few areas that are minimal compared to Figure 8a, which may reduce material characteristics to some extent. Altogether, deep structures with distinct granular boundary sites are identified with the presence of little porosity.

Microhardness Indentation Images

Figure 9 depicts the microhardness indentation images of the current investigation’s initial, average, and optimal conditions. Figure 9a shows the microhardness indentation of PR1DT1MT1SS1, i.e., initial condition (PR-1%; DT-140 °C; MT-680 °C; SS-480 rpm). Figure 8b shows the microhardness indentation of PR3DT2MT3SS2 i.e., average condition (PR-3%; DT-180 °C; MT-740 °C; SS-520 rpm). Figure 9c shows the microhardness indentation of PR2DT3MT4SS1, i.e., optimal condition (PR-2%; DT-220 °C; MT-770 °C; SS-480 rpm). Optimal conditions showed a lesser indentation dimension than initial and average stir casting conditions.

4. Wear Track and Wear Debris Analysis

Figure 10 shows wear track and wear debris SEM images of the current investigation’s initial, average, and optimal conditions. Figure 10a,b shows the SEM images of PR1DT1MT1SS1, i.e., the initial condition. Figure 10c,d shows the SEM images of PR3DT2MT3SS2, i.e., optimal condition. Figure 10e,f shows the SEM images of PR2DT3MT4SS1, i.e., average condition.
Figure 10a,c,e (i.e., wear track images) numbering 1 to 5 denote slithering direction, abrasions, speckles, and deep and shallow grooves, respectively. Figure 10a reveals a sizeable wear-out area with thick and deep furrows between the tracks. The abrasion effect is more vital, indicating that plowing has occurred. Material softening occurs faster in composites, characterized by extensive crack propagation. Because of the insufficient lubrication, there is increased nucleation in the wear track, resulting in abrupt wear out [84]. Several researchers have observed that a modest percentage of graphite exhibited a lower amount of solid-lubricant characteristics [85,86]. Figure 10c clearly shows the wear out in a few areas with thin and slender grooves in-between the tracks. It may also be due to the higher amount of reinforcement (graphene) in the matrix, which may shield the material from undergoing more wear. In addition, crack propagation in the surface is lower, which shows higher lubrication formation, causing the mild wear surface [14]. Figure 10e shows distinct wear behavior, i.e., wear out in a few areas with thin and slender grooves between the tracks and a small wear-out area with thick and deep grooves. Wear tracks are often limited and filled with the lubricating layer, which appears to have narrow grooves due to the higher graphite concentration compared to Figure 10a.
Figure 10b,d,f (i.e., wear debris images) numbering 1 to 5 denote large specks, thread type debris, globular debris, tiny size flakes, and micro-cracks, respectively. Figure 10b shows the large specks, which can be related to a high wear rate evident from the wear track (Figure 10a). Most of the flake sizes are >150 µm. In addition, softening of material followed by extensive crack propagation may be the reason for large size and thread type specks [87,88]. From Figure 9, tiny size specks along with globular debris are observed, which dictates a lower wear rate, which is quite evident from the wear track (Figure 10c). Most of the flake sizes are around 20 to 30 µm. In addition, a higher amount of reinforcement (graphene) in the matrix may shield the material from undergoing more wear out. Figure 10f shows the specks ranging from medium to small size along with globular debris at a few places, which may be related to moderate wear rate, which is quite evident from the wear track (Figure 10e). Most of the flake sizes are around 40 to 60 µm. In addition, the moderate presence of graphene concentration in the matrix may shield the material from undergoing more wear out.

5. Conclusions

For the proper functioning of fabricated hybrid composites in load-bearing applications, the properties of composites are to be optimized (higher hardness and lesser wear rate) subjected to appropriate control of stir casting parameters. A systematic framework has been established to detail the process insights (analysis and optimization of stir casting parameters) by developing hybrid optimization methods. The following conclusions are drawn from the exploration of fabricating hybrid composites by the stir casting processing route:
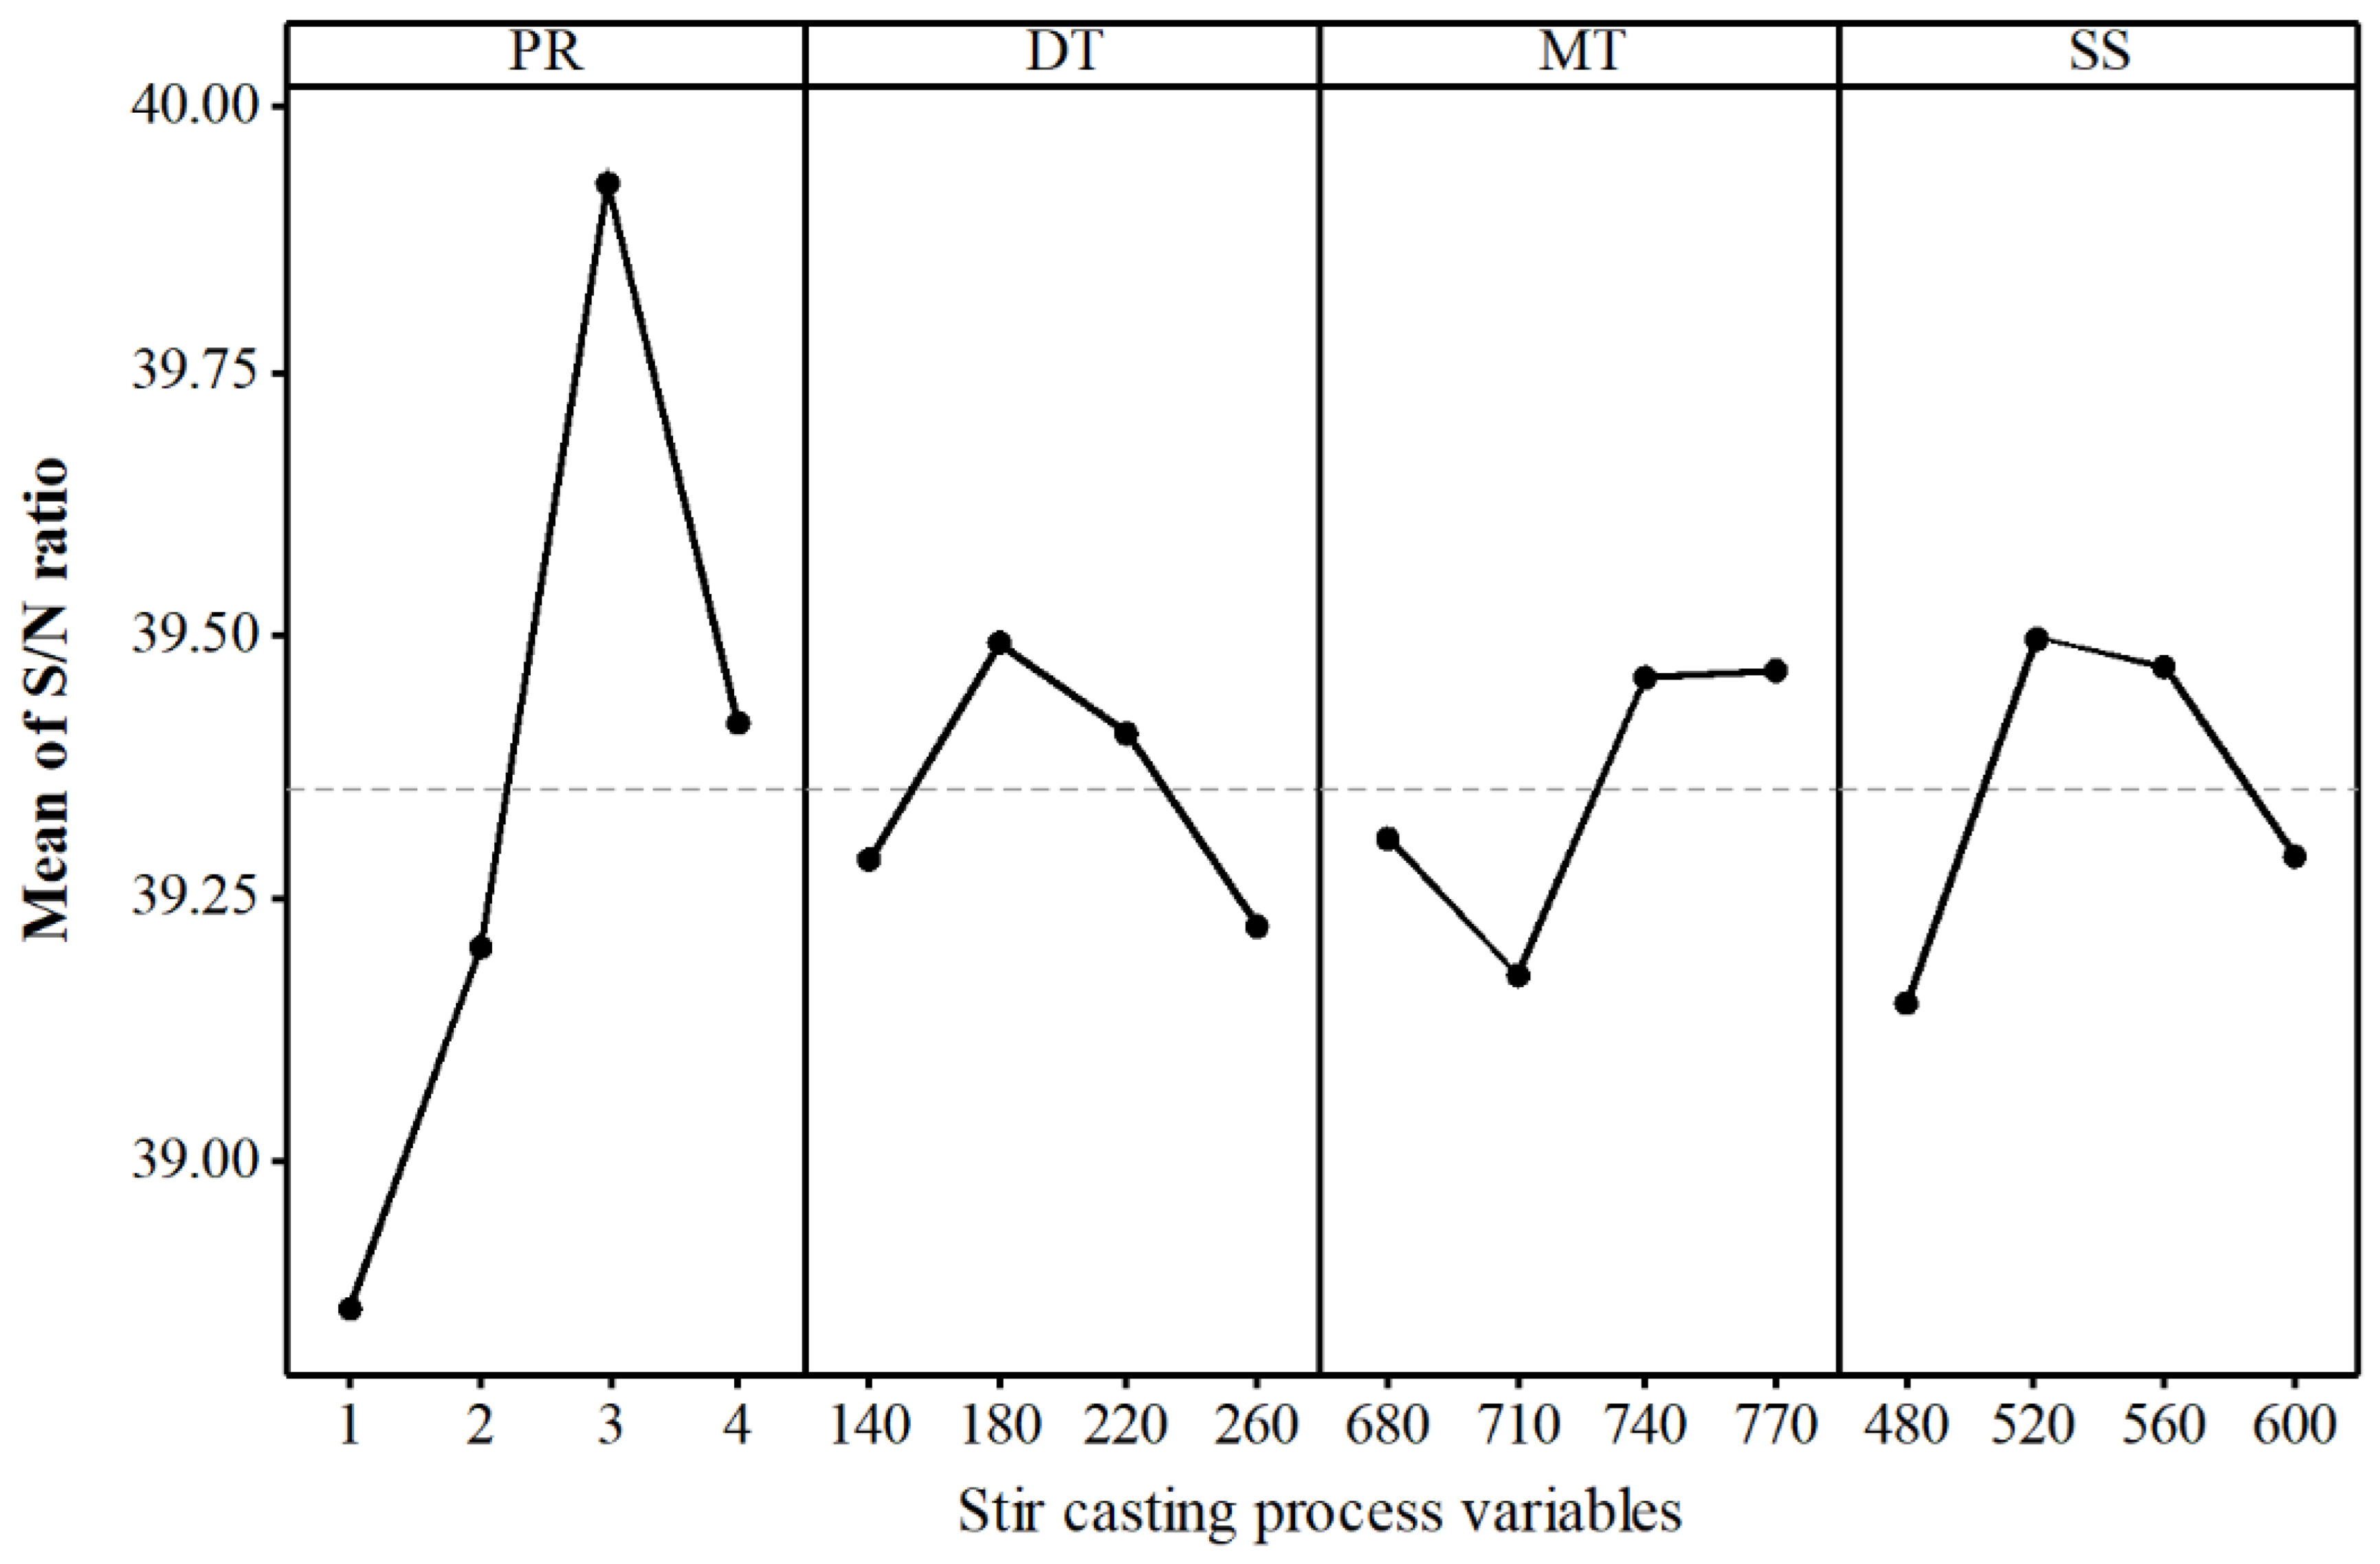
  • Taguchi L16 experiments were conducted and collected the experimental output (hardness and wear rate) data. Percent reinforcement of graphene showed the highest effect, whereas die temperature has the least effect on both hardness and wear rate. The optimal factor levels for hardness were found equal to PR3DT2MT4SS2 (percent reinforcement of graphene: 3%, die temperature: 180 °C, melt temperature: 770 °C, stir speed: 520 rpm), whereas PR3DT2MT3SS2 (percent reinforcement of graphene: 3%, die temperature: 180 °C, melt temperature: 740 °C, stir speed: 520 rpm) are the optimal conditions for wear rate.
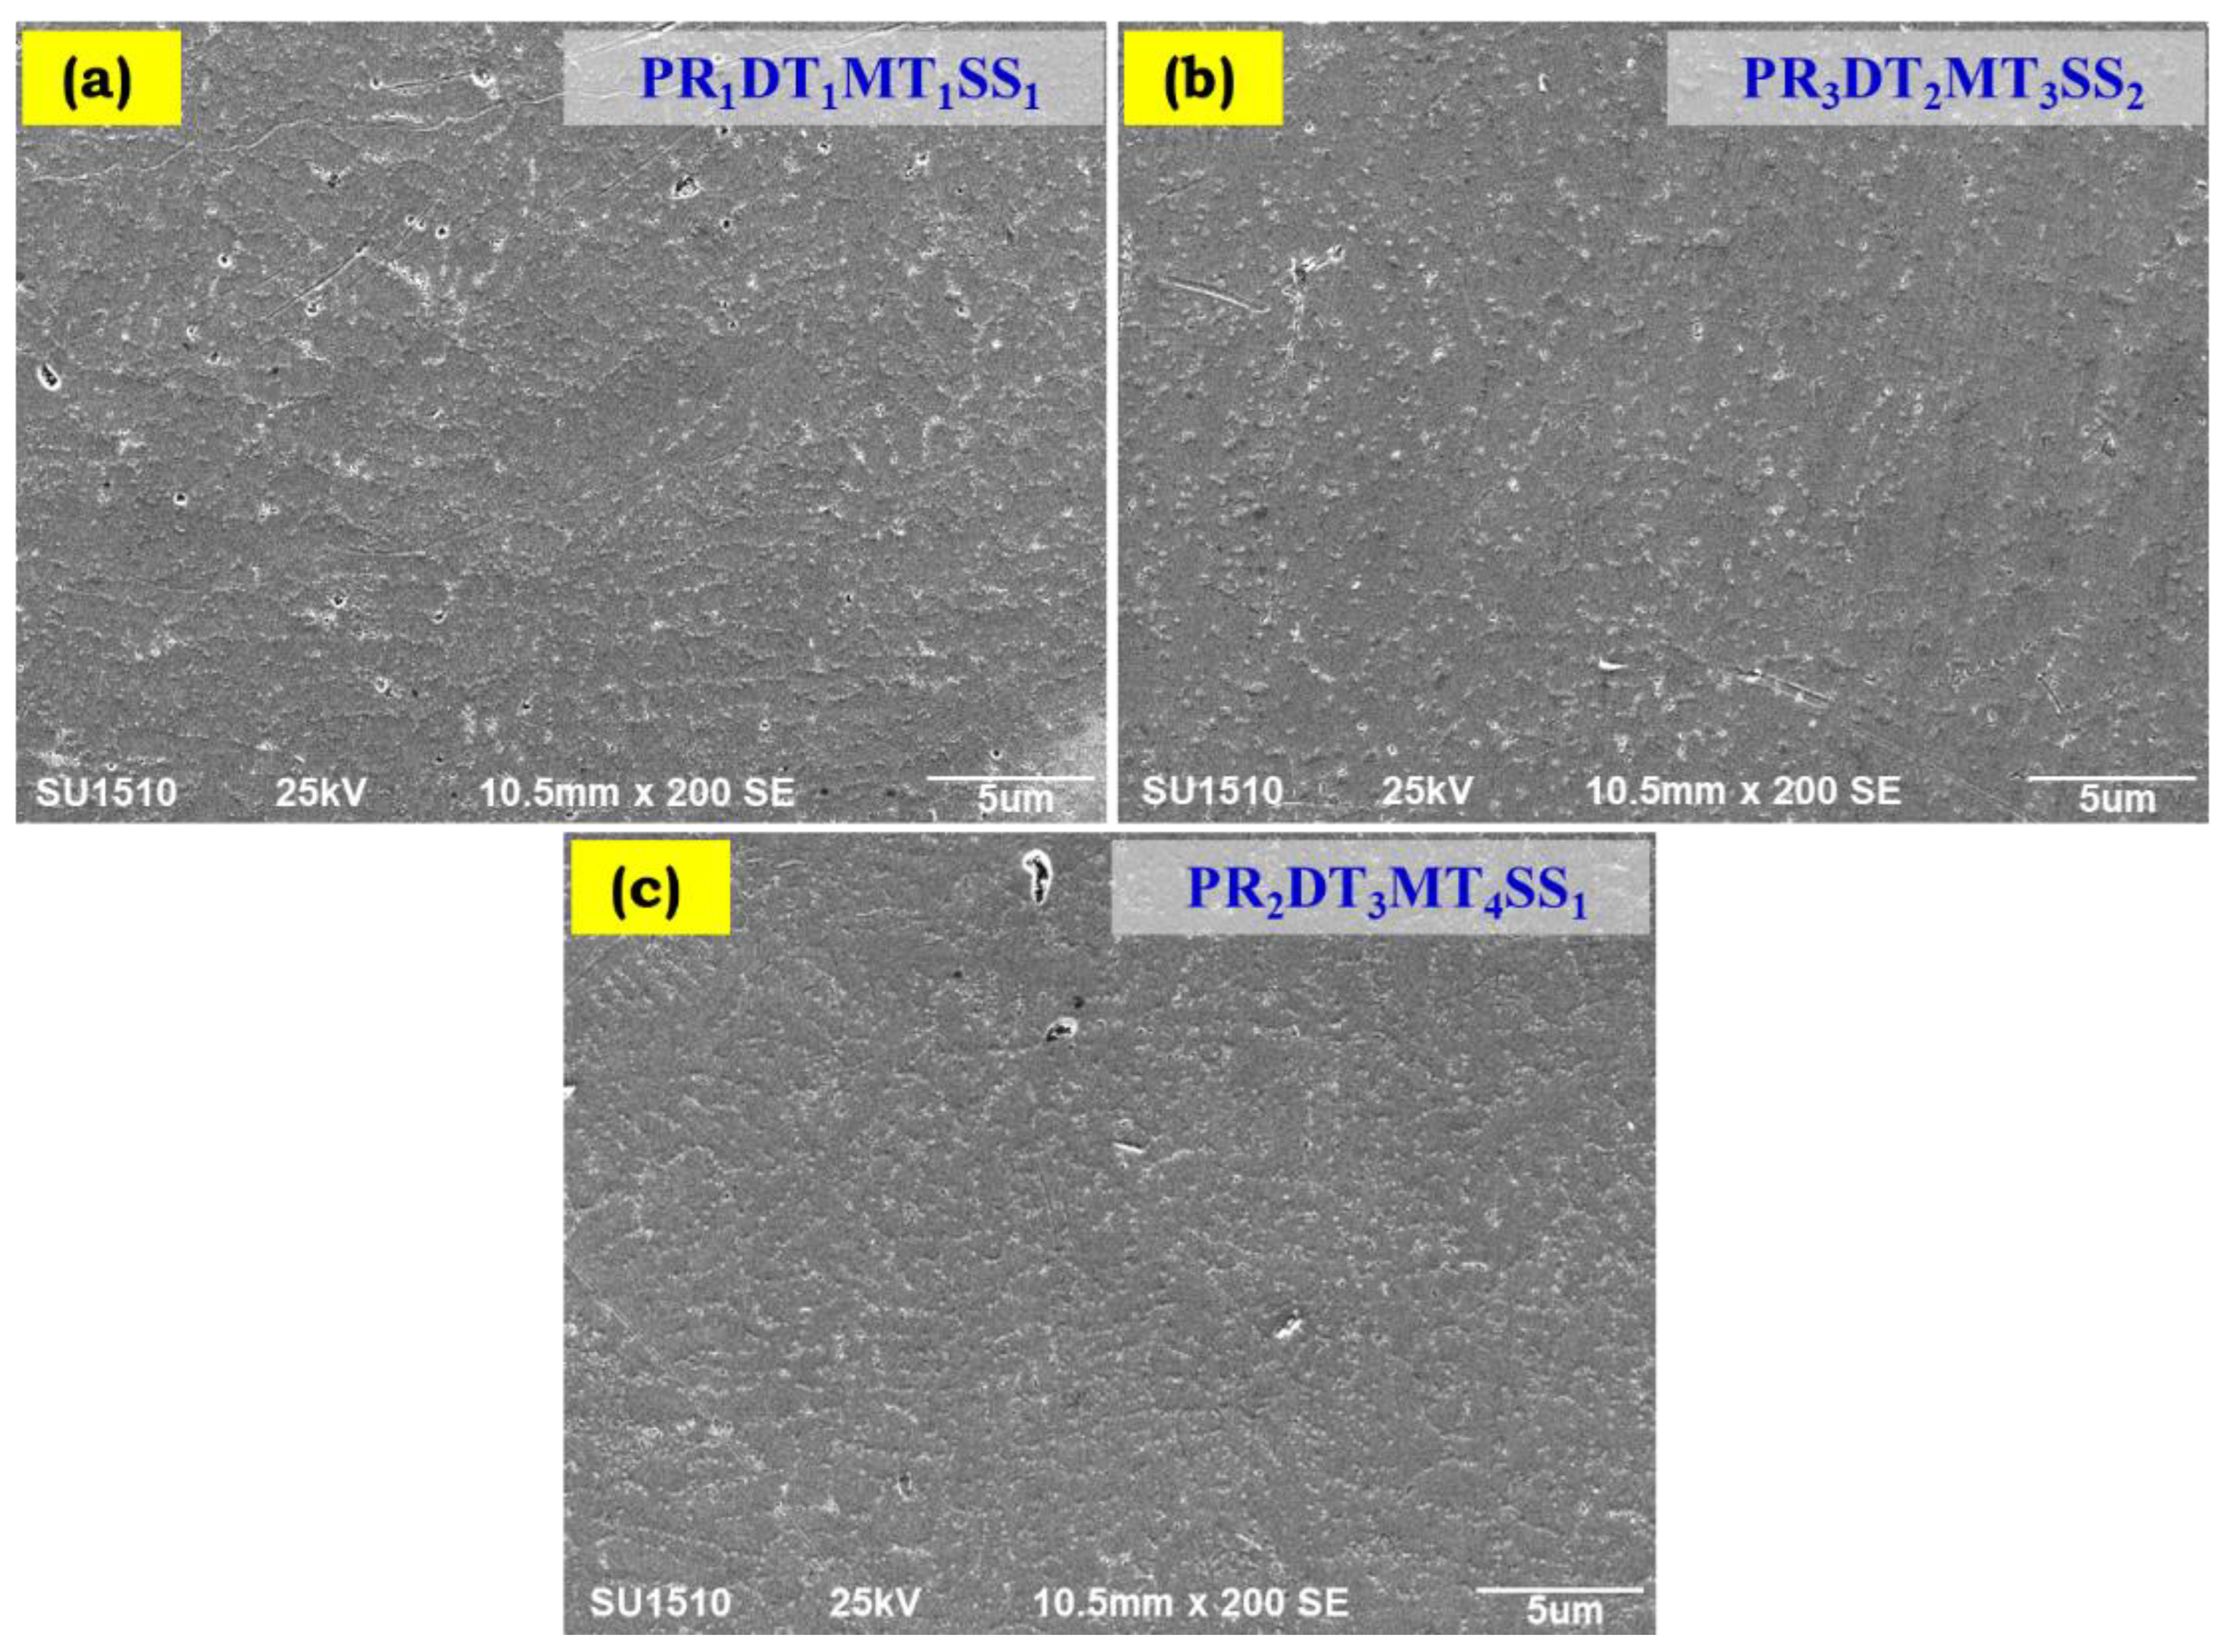
  • SEM analysis of MWCNT resulted in elongated tube-like curl structure and flake-like irregularly shaped structure obtained for graphene nanoparticles. EDS analysis confirms the composition of graphene and carbon nanotube particles.
  • The weights corresponding to hardness and wear rate determined viz. CRITIC method were found equal to 0.4752 and 0.5428, respectively. This indicates that the weight fraction for the hardness of stir casting composites is 47.52% and 54.28% for wear rate, respectively.
  • Hybrid optimization approaches such as Taguchi-CRITIC-GRA and Taguchi-CRITIC-MOORA determined the optimal factors, and levels were found equal to PR3DT2MT4SS2 and PR3DT2MT3SS2, respectively. Percent reinforcement of graphene is the most dominant effect, followed by melt temperature on the hybrid composites. The Taguchi-CRITIC-MOORA method performs marginally better than Taguchi-CRITIC-GRA in determining optimal conditions (percent reinforcement: 3 wt.%, die temperature: 180 °C, melt temperature: 740 °C, and stir speed: 520 rpm) that could improve the hardness and wear resistance properties with a value equal to the hardness of 112 and wear rate of 1.84 × 10⁻³ mm3/min. The Taguchi-CRITIC-MOORA method resulted in a 31.77% increase in hardness and a 36.33% decrease in wear rate compared to initial stir casting (percent reinforcement: 1 wt.%, die temperature: 140 °C, melt temperature: 680 °C, and stir speed: 480 rpm) conditions.
  • The optimal condition determined viz. the Taguchi-CRITIC-MOORA method ensures a dense microstructure with minimal pores (compared to initial and average conditions) resulting in enhanced properties in composite material.
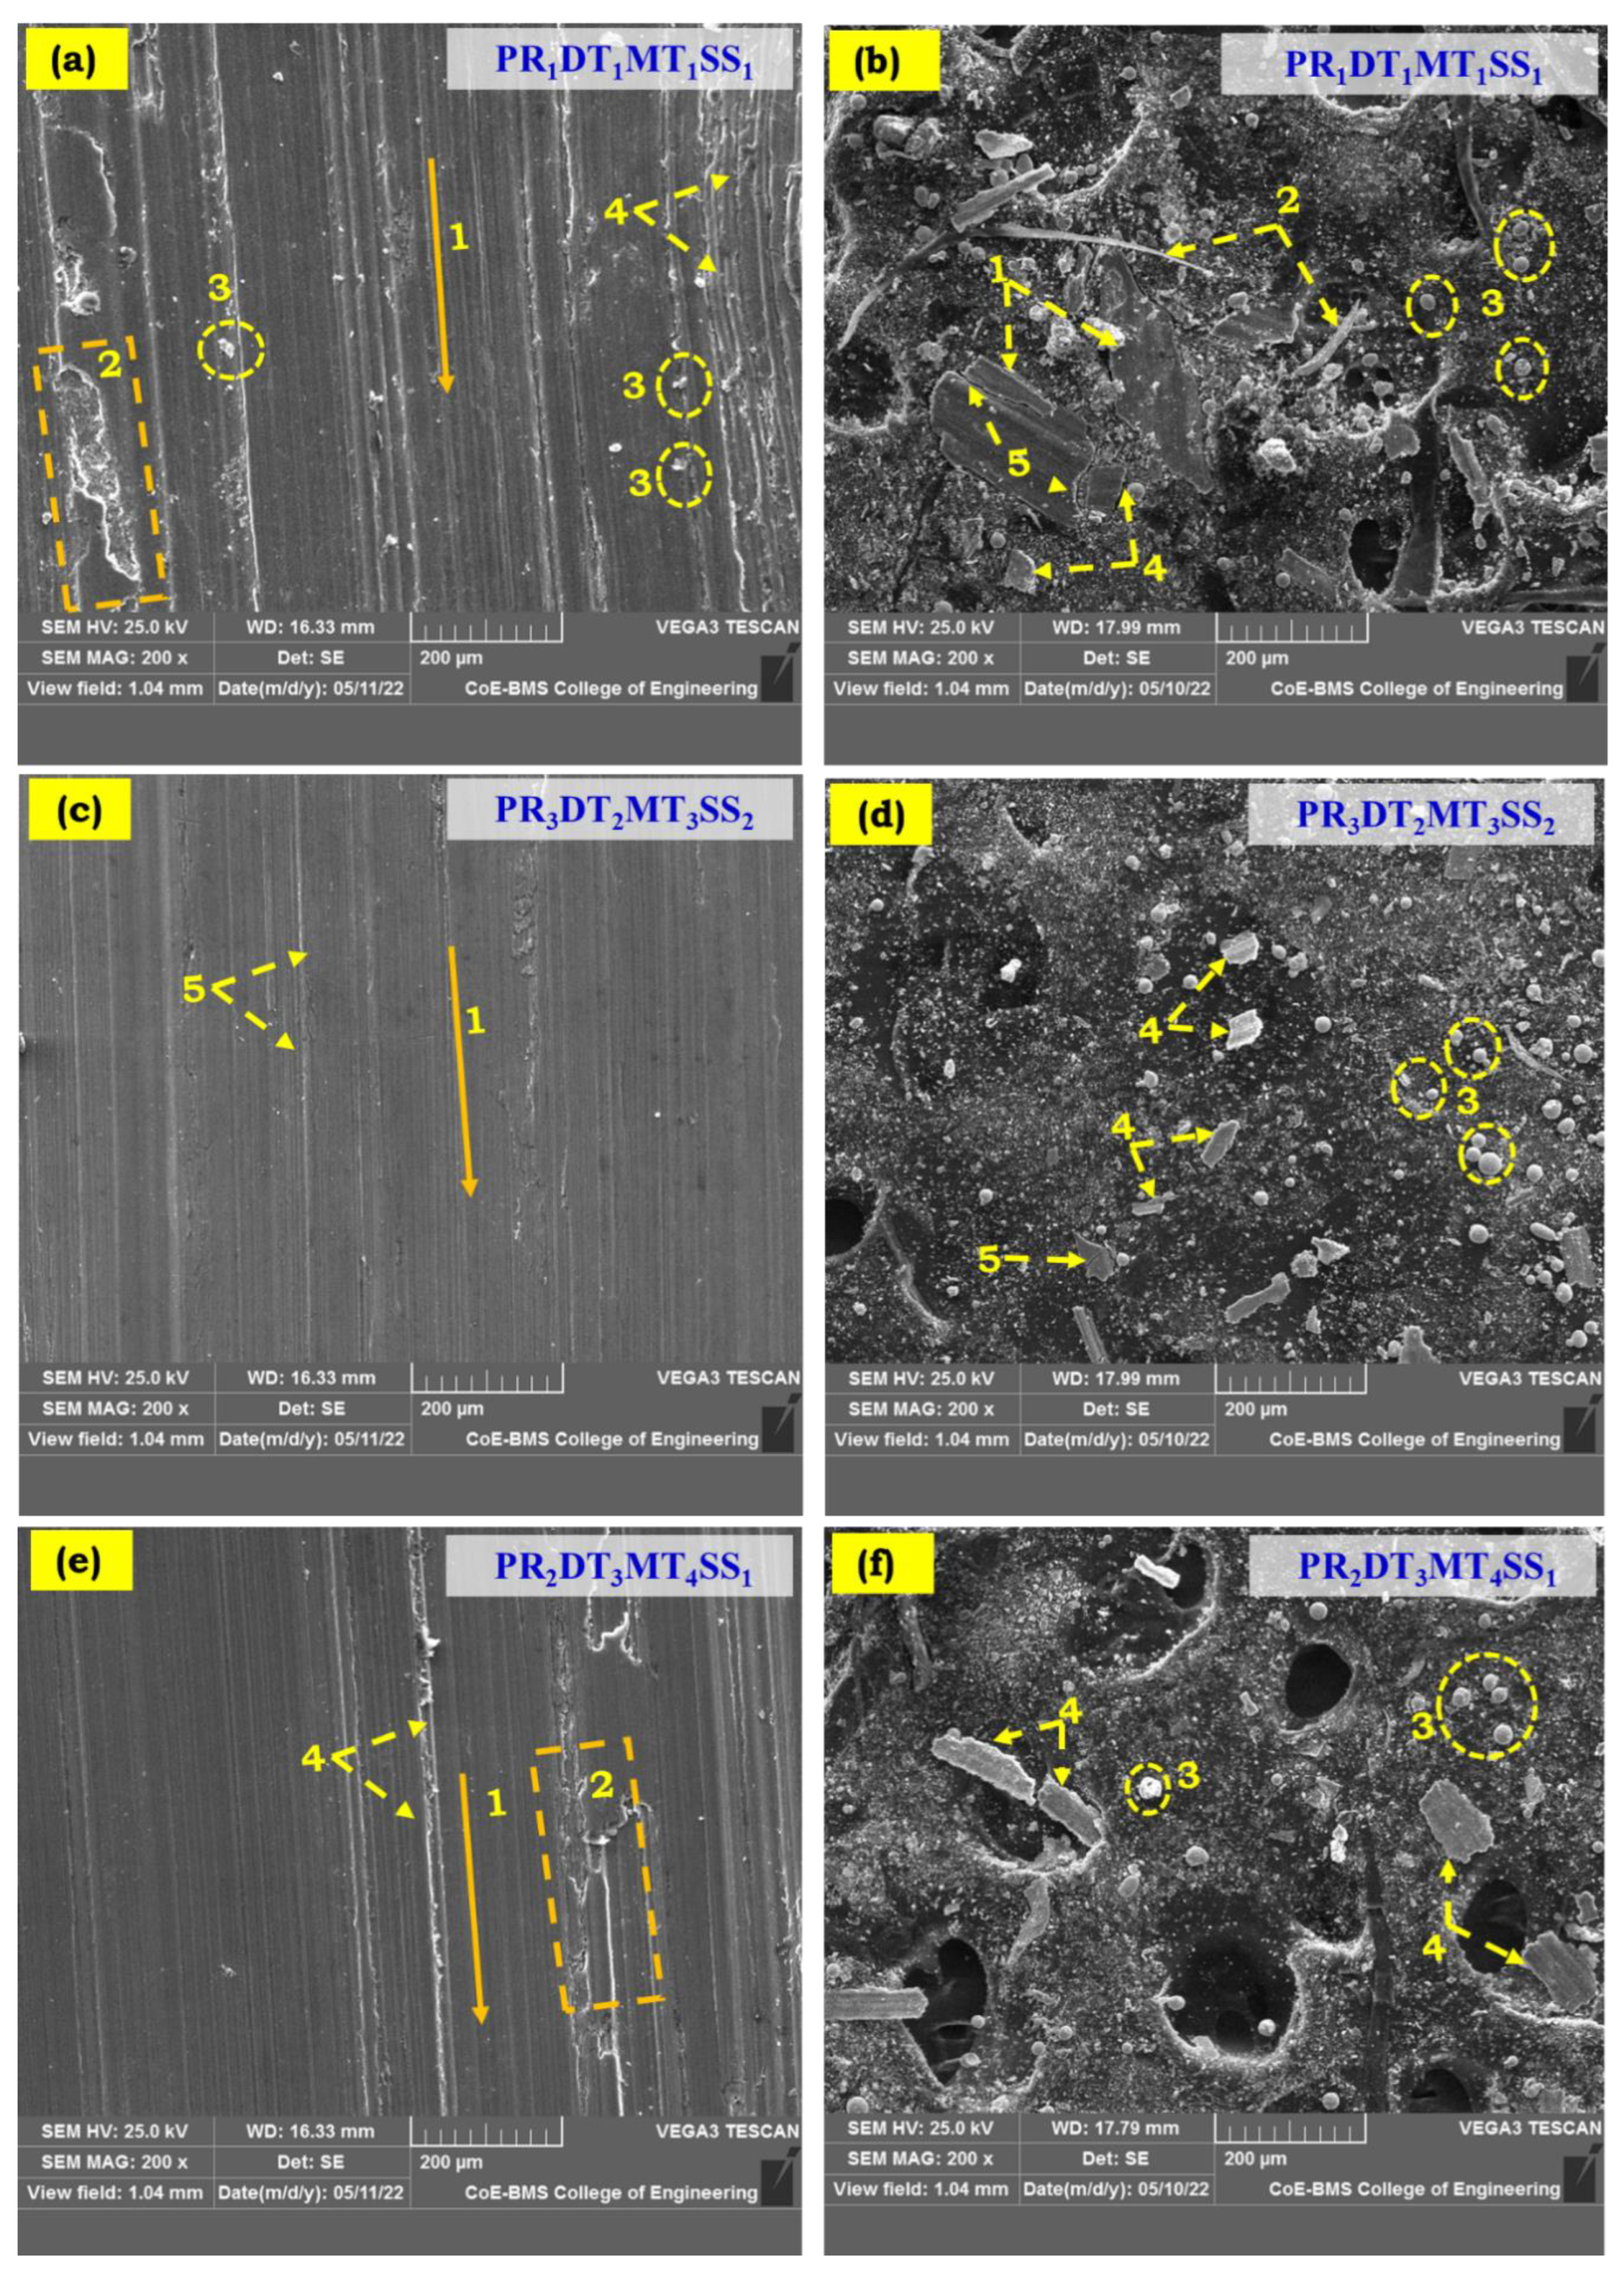
  • The worn-out surface of optimal conditions resulted in a few thin and slender grooves between wear tracks compared to average and initial conditions. Furthermore, less crack propagation on the wear-out surface shows better lubricant formation and causes self-lubrication composites.

Author Contributions

Conceptualization, K.S., V.N., C.P.S., N.G.C. and M.P.G.C.; methodology, A.L., M.P.G.C., S.T.K. and E.L.; software, K.S., V.N., M.P.G.C., S.T.K., N.G.C. and A.L.; validation, A.L., M.P.G.C. and E.L.; formal analysis, N.G.C., V.N., K.S., C.P.S. and S.T.K.; investigation, K.S. and V.N.; resources, M.P.G.C., S.T.K., E.L. and A.L.; data curation, E.L.; writing—original draft preparation, K.S., V.N., C.P.S., N.G.C., S.T.K. and A.L.; writing—review and editing, M.P.G.C. and E.L. All authors have read and agreed to the published version of the manuscript.

Funding

This research was funded by a grant from the Romanian Ministry of Research, Innovation and Digitalization, project number PFE 26/30.12.2021, PERFORM-CDI@UPT100—The increasing of the performance of the Polytechnic University of Timișoara by strengthening the research, development and technological transfer capacity in the field of “Energy, Environment and Climate Change” at the beginning of the second century of its existence, within Program 1—Development of the national system of Research and Development, Subprogram 1.2—Institutional Performance—Institutional Development Projects—Excellence Funding Projects in RDI, PNCDI III.

Institutional Review Board Statement

Not applicable.

Informed Consent Statement

Not applicable.

Data Availability Statement

Not applicable.

Conflicts of Interest

The authors declare no conflict of interest.

Nomenclature

MWCNTMultiwall carbon nano-tube
GRGraphene
CRITICCriteria importance through intercriteria correlation
MOORAMulti-objective optimization on the basis of ratio analysis
TOPSISTechnique for order preference by similarity to ideal solution
GRAGrey relational analysis
MMCsMetal matrix composites
PRPercent reinforcement
DTDie temperature
MTMelt temperature
SSStir speed
OLOptimal level
SSDSum of squares of differences
PCPercent contribution
ANOVAAnalysis of variance
GRCGrey relational coefficient
GRGGrey relational grading
WGRGWeighted grey relational grading
CjCriterion information
WjObjective weights
SDStandard deviation
SFLSum at factor levels
S/N ratioSignal-to-noise ratio
HVHardness value
WRWear rate

References

  1. Swamy, P.K.; Mylaraiah, S.; Gowdru Chandrashekarappa, M.P.; Lakshmikanthan, A.; Pimenov, D.Y.; Giasin, K.; Krishna, M. Corrosion Behaviour of High-Strength Al 7005 Alloy and Its Composites Reinforced with Industrial Waste-Based Fly Ash and Glass Fibre: Comparison of Stir Cast and Extrusion Conditions. Materials 2021, 14, 3929. [Google Scholar] [CrossRef]
  2. Ramanathan, A.; Krishnan, P.K.; Muraliraja, R. A review on the production of metal matrix composites through stir casting—Furnace design, properties, challenges, and research opportunities. J. Manuf. Processes 2019, 42, 213–245. [Google Scholar] [CrossRef]
  3. Bhoi, N.K.; Singh, H.; Pratap, S. Developments in the aluminum metal matrix composites reinforced by micro/nano particles—A review. J. Compos. Mater. 2020, 54, 813–833. [Google Scholar] [CrossRef]
  4. Chawla, K.K. Metal Matrix Composites. In Composite Materials; Springer: New York, NY, USA, 2012; pp. 197–248. [Google Scholar] [CrossRef]
  5. Altenbach, H.; Altenbach, J.; Kissing, W. Classification of Composite Materials. In Mechanics of Composite Structural Elements; Springer: Berlin/Heidelberg, Germany, 2004; pp. 1–14. [Google Scholar] [CrossRef]
  6. Rajan, T.P.D.; Pillai, R.M.; Pai, B.C. Reinforcement coatings and interfaces in aluminium metal matrix composites. J. Mater. Sci. 1998, 33, 3491–3503. [Google Scholar] [CrossRef]
  7. Yigezu, B.S.; Jha, P.K.; Mahapatra, M.M. The key attributes of synthesizing ceramic particulate reinforced Al-based matrix composites through stir casting process: A review. Mater. Manuf. Processes 2013, 28, 969–979. [Google Scholar] [CrossRef]
  8. Imran, M.; Khan, A.A. Characterization of Al-7075 metal matrix composites: A review. J. Mater. Res. Technol. 2019, 8, 3347–3356. [Google Scholar] [CrossRef]
  9. Hayat, M.D.; Singh, H.; He, Z.; Cao, P. Titanium metal matrix composites: An overview. Compos. Part A Appl. Sci. Manuf. 2019, 121, 418–438. [Google Scholar] [CrossRef]
  10. Gay, D. Composite Materials: Design and Applications; CRC Press: Boca Raton, FL, USA, 2014. [Google Scholar]
  11. Suthar, J.; Patel, K.M. Processing issues, machining, and applications of aluminum metal matrix composites. Mater. Manuf. Processes 2018, 33, 499–527. [Google Scholar] [CrossRef]
  12. Prasad, S.V.; Asthana, R. Aluminum metal-matrix composites for automotive applications: Tribological considerations. Tribol. Lett. 2004, 17, 445–453. [Google Scholar] [CrossRef]
  13. Safri, S.N.A.; Sultan, M.T.H.; Jawaid, M.; Jayakrishna, K. Impact behaviour of hybrid composites for structural applications: A review. Compos. B Eng. 2018, 133, 112–121. [Google Scholar] [CrossRef]
  14. Vinayaka, N.; Lakshmikanthan, A.; Patel, G.M.; Pon, C. Mechanical, Microstructure and Wear properties of Al 6113 Fly Ash reinforced Composites: Comparison of as-cast and Heat-treated Conditions. Adv. Mater. Processing Technol. 2021, 1–16. [Google Scholar] [CrossRef]
  15. Avinash, L.; Kumar, H.; Parthasarathy, A.; Kumar, K.N.V.; Sajjan, B. The Effect of Ceramic Reinforcement on the Microstructure, Mechanical Properties and Tribological Behavior of Al-7.5%Si-0.5%Mg alloy. Appl. Mech. Mater. 2017, 867, 39. [Google Scholar] [CrossRef]
  16. Kareem, A.; Qudeiri, J.A.; Abdudeen, A.; Ahammed, T.; Ziout, A. A review on AA 6061 metal matrix composites produced by stir casting. Materials 2021, 14, 175. [Google Scholar] [CrossRef] [PubMed]
  17. Nturanabo, F.; Masu, L.; Kirabira, J.B. Novel applications of aluminium metal matrix composites. In Aluminium Alloys and Composites; Cooke, K.O., Ed.; IntechOpen: London, UK, 2019; pp. 1–25. [Google Scholar] [CrossRef] [Green Version]
  18. Sharma, D.K.; Mahant, D.; Upadhyay, G. Manufacturing of metal matrix composites: A state of review. Mater. Today Proc. 2020, 26, 506–519. [Google Scholar] [CrossRef]
  19. Minasyan, T.; Hussainova, I. Laser Powder-Bed Fusion of Ceramic Particulate Reinforced Aluminum Alloys: A Review. Materials 2022, 15, 2467. [Google Scholar] [CrossRef] [PubMed]
  20. Abbasipour, B.; Niroumand, B.; Vaghefi, S.M.M.; Abedi, M. Tribological behavior of A356—CNT nanocomposites fabricated by various casting techniques. Trans. Nonferrous Met. Soc. China 2019, 29, 1993–2004. [Google Scholar] [CrossRef]
  21. Ayyanar, S.; Gnanavelbabu, A.; Rajkumar, K.; Loganathan, P. Studies on high temperature wear and friction behaviour of AA6061/B 4 C/hBN hybrid composites. Met. Mater. Int. 2020, 27, 3040–3057. [Google Scholar] [CrossRef]
  22. Singh, R.K.; Dixit, A.R.; Sharma, A.K.; Tiwari, A.K.; Mandal, V.; Pramanik, A. Influence of graphene and multi-walled carbon nanotube additives on tribological behaviour of lubricants. Int. J. Surf. Sci. Eng. 2018, 12, 207–227. [Google Scholar] [CrossRef] [Green Version]
  23. Moghadam, A.D.; Omrani, E.; Menezes, P.L.; Rohatgi, P.K. Mechanical and tribological properties of self-lubricating metal matrix nanocomposites reinforced by carbon nanotubes (CNTs) and graphene—A review. Compos. B Eng. 2015, 77, 402–420. [Google Scholar] [CrossRef]
  24. Johnson, P.J.; Setsuda, D.J.; Williams, R.S. Carbon Materials for Advanced Technology; Pergamon: Amsterdam, The Netherlands, 1999; pp. 235–268. [Google Scholar]
  25. Güler, Ö.; Bağcı, N. A short review on mechanical properties of graphene reinforced metal matrix composites. J. Mater. Res. Technol. 2020, 9, 6808–6833. [Google Scholar] [CrossRef]
  26. Merino, C.A.I.; Sillas, J.L.; Meza, J.M.; Ramirez, J.H. Metal matrix composites reinforced with carbon nanotubes by an alternative technique. J. Alloys Compd. 2017, 707, 257–263. [Google Scholar] [CrossRef]
  27. Wang, J.; Li, Z.; Fan, G.; Pan, H.; Chen, Z.; Zhang, D. Reinforcement with graphene nanosheets in aluminum matrix composites. Scr. Mater. 2012, 66, 594–597. [Google Scholar] [CrossRef] [Green Version]
  28. Khanna, V.; Kumar, V.; Bansal, S.A. Mechanical properties of aluminium-graphene/carbon nanotubes (CNTs) metal matrix composites: Advancement, opportunities, and perspective. Mater. Res. Bull. 2021, 138, 111224. [Google Scholar] [CrossRef]
  29. Tumnantong, D.; Poompradub, S.; Prasassarakich, P. Poly (methyl methacrylate)-graphene emulsion prepared via RAFT polymerization and the properties of NR/PMMA-graphene composites. Eur. Polym. J. 2020, 139, 109983. [Google Scholar] [CrossRef]
  30. Sharma, A.; Belokar, R.M.; Kumar, S. Optimization of gas protected stir casting process using GRA and TOPSIS. Indian J. Eng. Mater. Sci. 2017, 24, 437–446. Available online: http://nopr.niscair.res.in/handle/123456789/43712 (accessed on 15 May 2022).
  31. Samal, P.; Vundavilli, P.R.; Meher, A.; Mahapatra, M.M. Recent progress in aluminum metal matrix composites: A review on processing, mechanical and wear properties. J. Manuf. Process. 2020, 59, 131–152. [Google Scholar] [CrossRef]
  32. Aqida, S.N.; Ghazali, M.I.; Hashim, J. Effect of porosity on mechanical properties of metal matrix composite: An overview. J. Teknol. 2004, 40, 17–32. [Google Scholar] [CrossRef] [Green Version]
  33. Ambhai, K.G. Study on Machinability of Al-SiC Particulate Metal Matrix Composite. Ph.D. Thesis, Metallurgical Engineering Department, IIT Roorkee, Roorkee, India, 2007. [Google Scholar]
  34. Hashim, J.; Looney, L.; Hashmi, M.S.J. Metal matrix composites: Production by the stir casting method. J. Mater. Process. Technol. 1999, 92, 1–7. [Google Scholar] [CrossRef]
  35. Soltani, S.; Khosroshahi, R.A.; Mousavian, R.T.; Jiang, Z.Y.; Boostani, A.F.; Brabazon, D. Stir casting process for manufacture of Al–SiC composites. Rare Metals 2017, 36, 581–590. [Google Scholar] [CrossRef] [Green Version]
  36. Kumar, U.K.A.V. Method of stir casting of aluminum metal matrix composites: A review. Mater. Today Proc. 2017, 4, 1140–1146. [Google Scholar] [CrossRef]
  37. Srinivas, V.; Jayaraj, A.; Venkataramana, V.S.N.; Avinash, T.; Dhanyakanth, P. Effect of ultrasonic stir casting technique on mechanical and tribological properties of aluminium–multi-walled carbon nanotube nanocomposites. J. Bio-Tribo-Corros 2020, 6, 30. [Google Scholar] [CrossRef]
  38. Coyal, A.; Yuvaraj, N.; Butola, R.; Tyagi, L. An experimental analysis of tensile, hardness and wear properties of aluminium metal matrix composite through stir casting process. SN Appl. Sci. 2020, 2, 892. [Google Scholar] [CrossRef] [Green Version]
  39. Jena, P.C.; Parhi, D.R.; Pohit, G.; Samal, B.P. Crack assessment by FEM of AMMC beam produced by modified stir casting method. Mater. Today Proc. 2015, 2, 2267–2276. [Google Scholar] [CrossRef]
  40. Su, H.; Gao, W.; Zhang, H.; Liu, H.; Lu, J.; Lu, Z. Optimization of stirring parameters through numerical simulation for the preparation of aluminum matrix composite by stir casting process. J. Manuf. Sci. Eng. 2010, 132, 061007. [Google Scholar] [CrossRef]
  41. George, J.; Janardhanan, S.; Sijo, T.M. A numerical study on stir casting process in a metal matrix composite using CFD approach. Adv. Mater. Res. 2015, 1119, 533–541. [Google Scholar] [CrossRef]
  42. Rangaswamy, H.; Sogalad, I.; Basavarajappa, S.; Acharya, S.; Manjunath Patel, G.C. Experimental analysis and prediction of strength of adhesive-bonded single-lap composite joints: Taguchi and artificial neural network approaches. SN Appl. Sci. 2020, 2, 1055. [Google Scholar] [CrossRef]
  43. Patel, G.C.M.; Krishna, P.; Parappagoudar, M.B. Optimization of squeeze cast process parameters using Taguchi and grey relational analysis. Proc. Technol. 2014, 14, 157–164. [Google Scholar] [CrossRef] [Green Version]
  44. Patel, G.C.M.; Pradeep, N.B.; Harsha, H.M.; Shettigar, A.K. Experimental analysis and optimization of plasma spray parameters on microhardness and wear loss of Mo-Ni-Cr coated super duplex stainless steel. Aust. J. Mech. Eng. 2020, 1–13. [Google Scholar] [CrossRef]
  45. Arulraj, M.; Palani, P.K.; Venkatesh, L. Optimization of process parameters in stir casting of hybrid metal matrix (LM25/SiC/B4C) composite using taguchi method. J. Adv. Chem. 2017, 13, 6475–6479. [Google Scholar] [CrossRef]
  46. Hanizam, H.; Salleh, M.S.; Omar, M.Z.; Sulong, A.B. Optimisation of mechanical stir casting parameters for fabrication of carbon nanotubes–aluminium alloy composite through Taguchi method. J. Mater. Res. Technol. 2019, 8, 2223–2231. [Google Scholar] [CrossRef]
  47. Rajeswari, B.; Amirthagadeswaran, K.S.; Anbarasu, K.G. Investigation on mechanical properties of aluminium 7075-silicon carbide-alumina hybrid composite using Taguchi method. Aust. J. Mech. Eng. 2015, 13, 127–135. [Google Scholar] [CrossRef]
  48. Gurusami, K.; Shalini, S.; Sathish, T. Optimization of stir casting parameters for corrosion rate analysis of AA7068–Boron carbide composites. Mater. Today Proc. 2020, 33, 4650–4655. [Google Scholar] [CrossRef]
  49. Udaya Prakash, J.; Jebarose Juliyana, S.; Saleem, M.; Moorthy, T.V. Optimisation of dry sliding wear parameters of aluminium matrix composites (356/B4C) using Taguchi technique. Int. J. Ambient. Energy 2018, 42, 140–142. [Google Scholar] [CrossRef]
  50. Iacob, G.; Ghica, V.G.; Buzatu, M.; Buzatu, T.; Petrescu, M.I. Studies on wear rate and micro-hardness of the Al/Al2O3/Gr hybrid composites produced via powder metallurgy. Compos. B Eng. 2015, 69, 603–611. [Google Scholar] [CrossRef]
  51. David Raja Selvam, J.; Dinaharan, I.; Rai, R.S.; Mashinini, P.M. Dry sliding wear behaviour of in-situ fabricated TiC particulate reinforced AA6061 aluminium alloy. Tribol.—Mater. Surf. Interfaces 2019, 13, 1–11. [Google Scholar] [CrossRef]
  52. Tansel, İ.Y.; Yıldırım, S. MOORA-based Taguchi optimisation for improving product or process quality. Int. J. Prod. Res. 2013, 51, 3321–3341. [Google Scholar] [CrossRef]
  53. Arunachalam, R.; Piya, S.; Krishnan, P.K.; Muraliraja, R.; Christy, J.V.; Mourad, A.H.I.; Al-Maharbi, M. Optimization of stir–squeeze casting parameters for production of metal matrix composites using a hybrid analytical hierarchy process—Taguchi-Grey approach. Eng. Optim. 2020, 52, 1166–1183. [Google Scholar] [CrossRef]
  54. Patel, J.D.; Maniya, K.D. Application of AHP/MOORA method to select wire cut electrical discharge machining process parameter to cut EN31 alloys steel with brasswire. Mater. Today: Proc. 2015, 2, 2496–2503. [Google Scholar] [CrossRef]
  55. Luthra, S.; Mangla, S.K.; Xu, L.; Diabat, A. Using AHP to evaluate barriers in adopting sustainable consumption and production initiatives in a supply chain. Int. J. Prod. Econ. 2016, 181, 342–349. [Google Scholar] [CrossRef]
  56. Kumar, R.; Bilga, P.S.; Singh, S. Multi objective optimization using different methods of assigning weights to energy consumption responses, surface roughness and material removal rate during rough turning operation. J. Clean. Prod. 2017, 164, 45–57. [Google Scholar] [CrossRef]
  57. Rangaswamy, H.; Sogalad, I.; Basavarajappa, S.; Chandrashekarappa, M.P.G. A comprehensive modelling, analysis and optimisation of adhesive bonded single lap glass fibre reinforced composite joints. Int. J. Mater. Eng. Innov. 2019, 10, 286–309. [Google Scholar] [CrossRef]
  58. Chate, G.R.; Patel, G.C.M.; Bhushan, S.B.; Parappagoudar, M.B.; Deshpande, A.S. Comprehensive modelling, analysis and optimization of furan resin-based moulding sand system with sawdust as an additive. J. Braz. Soc. Mech. Sci 2019, 41, 183. [Google Scholar] [CrossRef]
  59. Patel, G.C.M.; Jagadish; Kumar, R.S.; Naidu, N.S. Optimization of Abrasive Water Jet Machining for Green Composites Using Multi-Variant Hybrid Techniques. In Optimization of Manufacturing Processes; Springer: Cham, Switzerland, 2020; pp. 129–162. [Google Scholar] [CrossRef]
  60. Chate, G.R.; Patel, G.C.M.; Kulkarni, R.M.; Vernekar, P.; Deshpande, A.S.; Parappagoudar, M.B. Study of the effect of nano-silica particles on resin-bonded moulding sand properties and quality of casting. Silicon 2018, 10, 1921–1936. [Google Scholar] [CrossRef]
  61. Abdel-Basset, M.; Mohamed, R. A novel plithogenic TOPSIS-CRITIC model for sustainable supply chain risk management. J. Clean. Prod. 2020, 247, 119586. [Google Scholar] [CrossRef]
  62. Arunagiri, K.S.; Radhika, N. Studies on adhesive wear characteristics of heat treated aluminium LM25/AlB2 composites. Tribol. Ind. 2016, 38, 277. [Google Scholar]
  63. Mukherjee, I.; Ray, P.K. A review of optimization techniques in metal cutting processes. Comput. Ind. Eng. 2006, 50, 15–34. [Google Scholar] [CrossRef]
  64. Park, S.H. Robust Design and Analysis for Quality Engineering; Chapman & Hall: London, UK, 1996. [Google Scholar] [CrossRef]
  65. Raj, R.R.; Yoganandh, J.; Saravanan, M.S.; Kumar, S.S. Effect of graphene addition on the mechanical characteristics of AA7075 aluminium nanocomposites. Carbon Lett. 2021, 31, 125–136. [Google Scholar] [CrossRef]
  66. Patel, G.C.M.; Krishna, P.; Parappagoudar, M.B. Squeeze casting process modeling by a conventional statistical regression analysis approach. Appl. Math. Model. 2016, 40, 6869–6888. [Google Scholar] [CrossRef]
  67. Patel, G.C.M.; Shettigar, A.K.; Parappagoudar, M.B. A systematic approach to model and optimize wear behaviour of castings produced by squeeze casting process. J. Manuf. Processes 2018, 32, 199–212. [Google Scholar] [CrossRef]
  68. Prasad, K.V.; Jayadevan, K.R. Simulation of stirring in stir casting. Proc. Technol. 2016, 24, 356–363. [Google Scholar] [CrossRef] [Green Version]
  69. Campbell, J. Castings Practice: The Ten Rules of Castings; Elsevier: Amsterdam, The Netherlands, 2004. [Google Scholar]
  70. Allison, J.E.; Cole, G.S. Metal-matrix composites in the automotive industry: Opportunities and challenges. JoM 1993, 45, 19–24. [Google Scholar] [CrossRef]
  71. Sheshadri, R.; Nagaraj, M.; Lakshmikanthan, A.; Chandrashekarappa, M.P.G.; Pimenov, D.Y.; Giasin, K.; Prasad, R.V.S.; Wojciechowski, S. Experimental investigation of selective laser melting parameters for higher surface quality and microhardness properties: Taguchi and super ranking concept approaches. J. Mater. Res. Technol. 2021, 14, 2586–2600. [Google Scholar] [CrossRef]
  72. Chate, G.R.; Kulkarni, R.M.; Chandrashekarappa, M.P.G.; Lakshmikanthan, A.; Harsha, H.M.; Tophakhane, S.; Shaikh, N.; Kongi, S.; Iranava, P. Synthesis and Characterization of Fe2O3 Nanoparticles Reinforced to Recycled Industrial Aluminium Scrap & Waste Aluminium Beverage Cans for Preparing Metal Matrix Nanocomposites. Frat. E Integrita Strutt. 2022, 16, 229–242. [Google Scholar] [CrossRef]
  73. Raghuvaran, P.; Baskaran, J.; Aagash, C.; Ganesh, A.; Krishna, S.G. Evaluation of mechanical properties of Al7075-SiC composites fabricated through stir casting technique. Mater. Today Proc. 2021, 45, 1914–1918. [Google Scholar] [CrossRef]
  74. Chandrashekarappa, M.P.G.; Kumar, S.; Pimenov, D.Y.; Giasin, K.; Jagadish, J. Experimental analysis and optimization of EDM parameters on HcHcr steel in context with different electrodes and dielectric fluids using hybrid taguchi-based PCA-utility and CRITIC-utility approaches. Metals 2021, 11, 419. [Google Scholar] [CrossRef]
  75. Diakoulaki, D.; Mavrotas, G.; Papayannakis, L. Determining objective weights in multiple criteria problems: The critic method. Comput. Oper. Res. 1995, 22, 763–770. [Google Scholar] [CrossRef]
  76. Lu, P.; Rosenbaum, M.S. Artificial neural networks and grey systems for the prediction of slope stability. Nat. Hazards 2003, 30, 383–398. [Google Scholar] [CrossRef]
  77. Brauers, W.K.; Zavadskas, E.K. The MOORA method and its application to privatization in a transition economy. Control Cybern 2006, 35, 445–469. [Google Scholar]
  78. Singh, J.; Chauhan, A. A review of microstructure, mechanical properties and wear behavior of hybrid aluminium matrix composites fabricated via stir casting route. Sādhanā 2019, 44, 16. [Google Scholar] [CrossRef] [Green Version]
  79. Jebeen Moses, J.; Joseph Sekhar, S. Investigation on the tensile strength and microhardness of AA6061/TiC composites by stir casting. Trans. Indian Inst. Met. 2017, 70, 1035–1046. [Google Scholar] [CrossRef]
  80. Liao, J.; Tan, M.J. A simple approach to prepare Al/CNT composite: Spread–Dispersion (SD) method. Mater. Lett. 2011, 65, 2742–2744. [Google Scholar] [CrossRef]
  81. Singla, D.; Amulya, K.; Murtaza, Q. CNT reinforced aluminium matrix composite-a review. Mater. Today Proc. 2015, 2, 2886–2895. [Google Scholar] [CrossRef]
  82. Naik, M.H.; Manjunath, L.H.; Koti, V.; Lakshmikanthan, A.; Koppad, P.G.; Kumaran, S.P. Al/Graphene/CNT hybrid composites: Hardness and sliding wear studies. FME Trans. 2021, 49, 414–421. [Google Scholar] [CrossRef]
  83. Naik, H.R.; Manjunath, L.H.; Malik, V.; Patel, G.C.M.; Saxena, K.K.; Lakshmikanthan, A. Effect of microstructure, mechanical and wear on Al-CNTs/graphene hybrid MMC’S. Adv. Mater. Process. Technol. 2021, 1–14. [Google Scholar] [CrossRef]
  84. Singh Yadav, S.P.; Lakshmikanthan, A.; Ranganath, S.; Gowdru Chandrashekarappa, M.P.; Anand, P.B.; Shankar, V.K.; Avvari, M. Effect of Pin Geometry and Orientation on Friction and Wear Behavior of Nickel-Coated EN8 Steel Pin and Al6061 Alloy Disc Pair. Adv. Mater. Sci. Eng. 2022, 2022, 327467. [Google Scholar] [CrossRef]
  85. Suresha, S.; Sridhara, B.K. Wear characteristics of hybrid aluminium matrix composites reinforced with graphite and silicon carbide particulates. Compos. Sci. Technol. 2010, 70, 1652–1659. [Google Scholar] [CrossRef]
  86. Babu, J.S.S.; Kang, C.A.; Kim, H.H. Dry sliding wear behavior of aluminum-based hybrid composites with graphite nanofiber–alumina fiber. Mater. Des. 2011, 32, 3920–3925. [Google Scholar] [CrossRef]
  87. Lakshmikanthan, A.; Udayagiri, S.B.; Koppad, P.G.; Gupta, M.; Munishamaiah, K.; Bontha, S. The effect of heat treatment on the mechanical and tribological properties of dual size SiC reinforced A357 matrix composites. J. Mater. Res. Technol. 2020, 9, 6434–6452. [Google Scholar] [CrossRef]
  88. Lakshmikanthan, A.; Bontha, S.; Krishna, M.; Koppad, P.G.; Ramprabhu, T. Microstructure, mechanical and wear properties of the A357 composites reinforced with dual sized SiC particles. J. Alloys Compd. 2019, 786, 570–580. [Google Scholar] [CrossRef]
Figure 1. SEM morphologies of reinforcement materials: (a) MWCNT Nano-powder and (b) Graphene Nano-powder in pristine state.
Metals 12 01297 g001
Figure 2. EDS analysis of reinforcement materials: (a) MWCNT Nano-powder and (b) Graphene Nano-powder in pristine state.
Metals 12 01297 g002
Figure 3. Schematic representation and framework of stir cast process modeling and optimization.
Metals 12 01297 g003
Figure 4. Details of dimensions of wear rate and hardness of stir cast composite samples.
Metals 12 01297 g004
Figure 5. Framework of the hybrid approach to perform modeling and optimization.
Metals 12 01297 g005
Figure 6. Main effect plots of hardness of stir casting composites.
Metals 12 01297 g006
Figure 7. Main effect plots of wear rate of stir casting composites.
Metals 12 01297 g007
Figure 8. SEM Morphology studies for different stir casting conditions: (a) PR1DT1MT1SS1 Condition (initial experiment: PR: 1%, DT: 140 °C, MT: 680 °C, and SS: 480 rpm), (b) PR3DT2MT3SS2 Condition (optimal condition: PR: 3%, DT: 180 °C, MT: 740 °C, and SS: 520 rpm), (c) PR2DT3MT4SS1 Condition (PR: 2%, DT: 220 °C, MT: 770 °C, and SS: 480 rpm).
Metals 12 01297 g008
Figure 9. Microhardness indentation images of the present investigation. Where (a) PR1DT1MT1SS1 Condition (initial experiment: PR: 1%, DT: 140 °C, MT: 680 °C, and SS: 480 rpm), (b) PR3DT2MT3SS2 Condition (optimal condition: PR: 3%, DT: 180 °C, MT: 740 °C, and SS: 520 rpm), (c) PR2DT3MT4SS1 Condition (PR: 2%, DT: 220 °C, MT: 770 °C, and SS: 480 rpm).
Metals 12 01297 g009
Figure 10. Wear Track and Wear Debris SEM images of the present investigation. (a,b) PR1DT1MT1SS1 Condition; (c,d) PR3DT2MT3SS2 Condition; (e,f) PR2DT3MT4SS1 Condition.
Metals 12 01297 g010
Table 1. Input factors and levels of stir casting process.
Control VariablesUnitsRange (1, 2, 3, 4)
Percent reinforcement, PR 1, 2, 3 & 4
Die temperature, DT°C140, 180, 220 & 260
Melt temperature, MT°C680, 710, 740 & 770
Stir speed, SSrpm480, 520, 560, 600
Table 2. Stir casting L16 experimental data.
Exp. No.DesignationControl VariablesOutput VariablesS/N Ratio (dB)
PR,
%
DT,
°C
MT,
°C
SS,
rpm
HVWR (×10−3),
mm3/min
HVWR
E1PR1DT1MT1SS11140680480852.8938.59−9.22
E2PR1DT2MT2SS21180710520882.7638.89−8.82
E3PR1DT3MT3SS31220740560912.5939.18−8.27
E4PR1DT4MT4SS41260770600872.8438.79−9.07
E5PR2DT1MT2SS32140710560902.6339.08−8.4
E6PR2DT2MT1SS42180680600922.4739.28−7.85
E7PR2DT3MT4SS12220770480902.6839.08−8.56
E8PR2DT4MT3SS22260740520932.3839.37−7.53
E9PR3DT1MT3SS43140740600982.2639.82−7.08
E10PR3DT2MT4SS331807705601042.0540.34−6.24
E11PR3DT3MT1SS232206805201012.1440.09−6.61
E12PR3DT4MT2SS13260710480942.2639.46−7.08
E13PR4DT1MT4SS24140770520962.1739.65−6.73
E14PR4DT2MT3SS14180740480942.2239.46−6.93
E15PR4DT3MT2SS44220710600922.5139.28−7.99
E16PR4DT4MT1SS34260680560922.5539.28−8.13
Table 3. Results of Pareto ANOVA for HV (S/N ratio).
FactorsLevelsPRDTMTSSTotal
SFL1155.45157.14157.24156.59629.4
2156.81157.97156.71158.00
3159.71157.63157.83157.88
4157.67156.90157.86157.17
SSD38.242.783.595.2049.80
PC76.775.587.2210.43100
OL: PR3DT2MT4SS2 (Not found in L16 experiments of Table 2).
Table 4. Results of Pareto ANOVA for Wear rate (S/N ratio).
FactorsLevelsPRDTMTSSTotal
SFL1−35.38−31.43−31.81−31.79−124.5
2−32.34−29.84−32.29−29.69
3−27.01−31.43−29.81−31.04
4−29.78−31.81−30.6−31.99
SSD153.309.2315.3313.03190.87
PC80.314.838.036.83100
OL: PR3DT2MT3SS2 (Not found in L16 experiments of Table 2).
Table 5. Normalization of outputs.
Exp. No.HardnessWear Rate
E10.00000.0000
E20.15790.1548
E30.31580.3571
E40.10530.0595
E50.26320.3095
E60.36840.5000
E70.26320.2500
E80.42110.6071
E90.68420.7500
E101.00001.0000
E110.84210.8929
E120.47370.7500
E130.57890.8571
E140.47370.7976
E150.36840.4524
E160.36840.4048
SD0.26170.3108
Table 6. Correlation coefficient of responses.
ResponsesHardnessWear Rate
Hardness1.00000.9333
Wear rate0.93331.0000
Table 7. Determining the summation of different responses.
ResponsesHardnessWear RateSummation
Hardness0.00000.06770.0677
Wear rate0.06670.00000.0677
Table 8. Weight fractions of different outputs.
ResponsesCjWj
Hardness0.0174620.457118
Wear rate0.0207380.542883
Table 9. Results of multiobjective optimization—GRA.
Exp. No.S/N ratioNormalizationGRCGRG
HVWRHVWRHVWR
E138.59−9.220.000 0.0000.333 0.3330.333
E238.89−8.820.1710.1340.3760.3660.371
E339.18−8.270.3370.3190.4300.4230.426
E438.79−9.070.1140.0500.3610.3450.352
E539.08−8.40.2800.2750.4100.4080.409
E639.28−7.850.3940.4600.4520.4810.468
E739.08−8.560.2800.2210.4100.3910.400
E839.37−7.530.4460.5670.4740.5360.508
E939.82−7.080.7030.7180.6270.6390.634
E1040.34−6.241.0001.0001.0001.0001.000
E1140.09−6.610.8570.8760.7780.8010.790
E1239.46−7.080.4970.7180.4990.6390.575
E1339.65−6.730.6060.8360.5590.7530.664
E1439.46−6.930.4970.7680.4990.6830.599
E1539.28−7.990.3940.4130.4520.4600.456
E1639.28−8.130.3940.3660.4520.4410.446
Max.40.34−6.24
Min.38.59−9.22
Normalization computation: (38.59 − 38.59)/(40.34 − 38.59) = 0.000
Computation of GRC: [0 + (0.5 × 1)]/[(1 − 0.000) + 0.5] = 0.333
Computation of WGRG: [(0.333 × 0.4572) + (0.333 × 0.5428)] = 0.333
Table 10. The Taguchi-CRITIC-GRA method for combined outputs: Pareto ANOVA.
FactorsLevelsPRDTMTSSTotal
SFL11.4822.042.0371.9078.431
21.7852.4381.8112.333
32.9992.0722.1672.281
42.1651.8812.4161.91
SSD5.170.660.770.647.25
PC71.369.1810.578.84100
OL: PR3DT2MT4SS2 (Not found in L16 experiments of Table 2).
Table 11. Taguchi-CRITIC-MOORA based multiple objective optimization.
Exp. No.S/N RatioSum of SquaresNormalizationWeighted NormalizationMOORA Index
HVWRHVWRHVWRHVWR
E138.59−9.221489.2 85.00.000 0.0000.333 0.3330.333
E238.89−8.821512.477.80.1710.1340.3760.3660.371
E339.18−8.271535.168.40.3370.3190.4300.4230.426
E438.79−9.071504.782.30.1140.0500.3610.3450.352
E539.08−8.41527.270.60.2800.2750.4100.4080.409
E639.28−7.851542.961.60.3940.4600.4520.4810.468
E739.08−8.561527.273.30.2800.2210.4100.3910.400
E839.37−7.531550.056.70.4460.5670.4740.5360.508
E939.82−7.081585.650.10.7030.7180.6270.6390.634
E1040.34−6.241627.338.91.0001.0001.0001.0001.000
E1140.09−6.611607.243.70.8570.8760.7780.8010.790
E1239.46−7.081557.150.10.4970.7180.4990.6390.575
E1339.65−6.731572.145.30.6060.8360.5590.7530.664
E1439.46−6.931557.148.00.4970.7680.4990.6830.599
E1539.28−7.991542.963.80.3940.4130.4520.4600.456
E1639.28−8.131542.966.10.3940.3660.4520.4410.446
Sum of squares: 38.59 × 38.59 = 1489.2
Normalization value for HV: S/N ratio/√(Total sum of squares) = 38.59/√ (1489.2 + … 1542.9) = 0.245
Computation of weighted normalization: 0.112 × 0.4572 = 0.112
Computation of MOORA Index: 0.112 − 0.160 = −0.048
Table 12. The Taguchi-CRITIC-MOORA method for combined outputs: Pareto ANOVA.
FactorsLevelsPRDTMTSSTotal
SFL1−0.161−0.088−0.095−0.096−0.327
2−0.105−0.058−0.104−0.055
3−0.004−0.086−0.057−0.079
4−0.057−0.095−0.071−0.097
SSD0.05390.00320.00560.00460.06733
PC80.084.738.316.88100
OL: PR3DT2MT3SS2 (Not found in L16 experiments of Table 2).
Table 13. Confirmation experiments results of optimized conditions.
ModelsOptimal Factor LevelsExperimental Output ValuesPercent Improvement
Initial ConditionPR1DT1MT1SS1HV = 85; WR = 2.89 × 10⁻³ mm3/min
Taguchi-CRITIC- GRAPR3DT2MT4SS2HV = 108; WR = 1.95 × 10⁻³ mm3/min27.06% increase in HV;
32.53% decrease in WR
Taguchi-CRITIC- MOORAPR3DT2MT3SS2HV = 112; WR = 1.84 × 10⁻³ mm3/min31.77% increase in HV;
36.33% decrease in WR
Publisher’s Note: MDPI stays neutral with regard to jurisdictional claims in published maps and institutional affiliations.

