Article

Numerical Study on Combustion Behavior of Semi-Coke in Blast Furnace Blowpipe-Tuyere-Combustion Zone

1
College of Materials Science and Engineering, Chongqing University, Chongqing 400044, China
2
School of Information Science and Engineering, Chongqing Jiaotong University, Chongqing 400074, China
*
Author to whom correspondence should be addressed.
Metals 2022, 12(8), 1272; https://doi.org/10.3390/met12081272
Submission received: 2 July 2022 / Revised: 26 July 2022 / Accepted: 27 July 2022 / Published: 28 July 2022
(This article belongs to the Special Issue Mathematical Modelling of the Ironmaking Blast Furnace)

Abstract

:
Injecting low-cost semi-coke is critical to reducing blast furnace production costs. The combustion behavior of the co-injection of semi-coke and undersized coke powder is still rarely studied. In this work, a three-dimensional CFD mathematical model was established to simulate the gas velocity, temperature, composition distribution and burnout of semi-coke during the combustion of pulverized semi-coke. The influence of mass fraction of semi-coke on the composition and burnout in the combustion zone of blast furnace was also studied. The results show that the maximum concentrations of CO and H2 in the combustion zone are 36% and 8%, respectively. With the decrease of the semi-coke ratio in the blended coal, the fixed carbon content and the calorific value of the blended coal increase, but the burnout of the blended coal reduces. When bituminous coal is single injected, the burnout reaches 70%, which is higher than that of semi-coke. In actual production, for the semi-coke and coke powder injecting into the blast furnace, a proportion of bituminous coal can be appropriately added to improve the burnout rate of the coal blends and increase the H2 content in reducing gas.

1. Introduction

Blast furnace pulverized coal injection is an important technology to reduce production cost and stabilize operations [1,2]. After the pulverized coal is injected into the blast furnace combustion zone from the tuyere, a violent and complex multiphase chemical reaction occurs in the limited space with high temperature and high pressure. At present, blast furnaces in China are mainly based on injected bituminous coal and anthracite. However, production is faced with the problem that high-quality coal resources are increasingly depleted and some local governments are restricting the total coal consumption of enterprises [3]. On the other hand, semi-coke is mainly produced from low-temperature pyrolysis of weakly cohesive or non-cohesive coal with high volatile content [4,5,6]. Due to the abundance of low-rank coal resources in China and the fact that local governments have not included semi-coke in the restricted sequence of corporate energy products [7], the efficient utilization of semi-coke in blast furnaces has become the focus of attention.
In the past, the comprehensive properties of semi-coke as a blast furnace injection fuel have been extensively studied. Zou et al. [8] investigated the inherent characteristics and injection effect of semi-coke, and determined the basic conditions which satisfy the blast furnace production. Li et al. [9] carried out the experimental analysis of semi-coke used as blast furnace injection fuel. Bi et al. [10] pointed out the optimal ratio of blast furnace injection of semi-coke to replace part of the bituminous coal and anthracite from the perspective of combustibility. In addition, some iron and steel enterprises have carried out industrial tests and production practices of blast furnace injection of semi-coke, proving its feasibility and cost superiority [11,12]. Recently, considering the advantages of numerical simulation in terms of cost and efficiency, especially the fact that it can provide detailed furnace phenomena, it has become an important tool to study semi-coke injection in blast furnace [13,14,15,16,17]. Goto et al. [18] established a three-dimensional model to simulate the combustion process of pulverized coal-plastic and coal-gas in the blowpipe. Du [19,20] and Gu et al. [21] constructed a three-dimensional mathematical model of the blowpipe-tuyere area to describe the combustion behavior of pulverized coal under different operating conditions. However, they did not pay attention to the shape of the raceway and the development process of the pulverized coal after leaving the tuyere. Shen et al. [22,23,24,25] developed a series of mathematical models and conducted a detailed study on the combustion behavior of blast furnace pulverized coal injection, which provided a theoretical basis for guiding and optimizing the blast furnace pulverized coal injection process. Recently, Hu et al. [26] established a blast furnace raceway model and compared the differences between the individual injection of semi-coke and the mixed injection of semi-coke and pulverized coal. The previous studies provided effective information for guiding the blast furnace injection of semi-coke. However, the combustion behavior of the injection of semi-coke and undersized coke powder is still rarely studied, and especially the effect of different semi-coke ratios on the combustion behavior needs to be clarified.
In this work, a three-dimensional model of blast furnace blowpipe-tuyere-combustion zone based on computational fluid dynamics (CFD) is established to explore the velocity, temperature, component concentration distribution and burnout rate of semi-coke injection in blast furnace. The effect of the proportion of semi-coke on the composition of the combustion zone and the burnout rate is investigated, and the differences between injection semi-coke and bituminous coal are analyzed. The findings of this work will be useful for the control and optimization of blast furnace injection of semi-coke.

2. Model Description

2.1. Governing Equations

In the simulation of the combustion process of the injection semi-coke, the fluid phase was treated as an incompressible ideal gas. The Euler method was adopted to solve the three-dimensional Reynolds-averaged Navier–Stokes equation. The governing equations include mass conservation, momentum conservation, energy conservation and component conservation equations, as shown in Table 1. Particularly, the gas velocity at the inlet of the blowpipe reaches more than 160 m/s, and the turbulence is fully developed. To accurately and effectively predict the turbulent mixing and diffusion behavior of dust and pulverized coal particles in high-speed airflow, realizable k-ε equations were employed to describe the turbulent diffusion [27]. The equations of turbulent kinetic energy k and turbulent dissipation ε can be written as:
( ρ k u i ) x i = x j [ ( μ + μ t σ k ) k x j ] + G k + G b ρ ε
( ρ ε u i ) x i = x j [ ( μ + μ t σ ε ) ε x j ] + ρ C 1 S ε ρ C 2 ε 2 k + v ε + C 1 σ ε k C 3 σ G b
where Gk and Gb are the turbulent kinetic energy terms generated by laminar velocity gradient and buoyancy, respectively. σk and σε are the turbulent Prandtl number of the k equation and ε equation, respectively. Particularly, C1ε = 1.44, C2 = 1.92, σk = 1.0, σε = 1.2.
The pulverized coal was treated as a discrete phase and solved by the Langrangian method in the simulation. Considering that the pulverized coal was rapidly diluted by the gas phase after entering the blowpipe from the coal lance, the interaction between pulverized coal particles was therefore ignored [28]. The trajectory of the pulverized coal particles was solved by the random trajectory model, and its motion followed Newton’s second law, given by,
d u p d t = F D ( u u p ) + g x ( ρ p ρ ) ρ p + F x
where FD(uup) is the drag force per unit particle mass. up and u are the velocities of the particles and the gas phase, respectively. ρp and ρ are the densities of the particles and the gas phase, respectively. Fx is the sum of other forces on the particle. FD can be written as,
F D = 18 μ ρ p d p 2 C D Re 24
The mass, momentum and energy equations of the particle phase are listed in Table 2. The temperature variation of the particle phase occurs in three ways, namely convective heat transfer, conduction heat transfer and radiation heat transfer. Among them, radiation heat transfer was solved by the P-1 radiation model, where the emissivity was estimated by the Gray Gas Weighted Average Model (WSGGM) [4].

2.2. Chemical Reaction Model

The combustion of pulverized coal in the tuyere and raceway is a complex reaction process. Generally, the combustion of pulverized coal undergoes four stages, namely preheating, releasing of volatile matter (VM), combustion of VM, oxidation and gasification of residual carbon in the turbulent gas phase. The chemical reaction models for these stages are as follows.

2.2.1. Releasing of Volatile Matter

A two-step competitive reaction model was adopted to describe the releasing process of VM. In other words, two chemical reactions with different reaction rates and volatilization rates compete with each other, and the expression is shown in Equation (5).
R a w C o a l α 1 V M 1 + ( 1 α 1 ) C h a r 1 R 1 ( lowtemperature ) α 2 V M 2 + ( 1 α 2 ) C h a r 2 R 2 ( hightemperature )
where VM1 and VM2 are volatile matters, Char1 and Char2 are residual carbon, and α1 and α2 are the stoichiometric coefficients of the volatile pyrolysis reaction of the pulverized coal, respectively. α1 is the content of VM in the industrial analysis of pulverized coal, and the value of α2 is related to α1. The chemical reaction rate constants k1 and k2 are expressed by the Arrhenius formula, given by,
k = A exp ( E / T )
where A is the pre-exponential factor constant and E is the activation energy. A and E at low temperature are 3.7 × 10⁵ s−1 and 1.5 × 10⁸ J/kmol, respectively, but they are 1.46 × 10¹³ s−1 and 2.51 × 10⁸ J/kmol, respectively, at high temperature. Particularly, this setting is based on previous work [24].

2.2.2. Combustion Reaction of Gas Phase

The VM generated by the pyrolysis of raw coal react with O2 to produce CO2 and H2O. This reaction was regarded as a one-step reaction and solved by the Finite Rate/Eddy Dissipation model. The effects of turbulent diffusion and chemical reaction rates were both considered in this model, and as a result, the reaction rate was expressed by the Arrhenius formula and the turbulent diffusion equation. The final net reaction rate depends on the smaller of the two, given by,
R r e a c t , i , r = ( v r i v r i ) ( k r e a c t , r f i = 1 N [ c i ] η i , r f k r e a c t , r b i = 1 N [ c i ] η i , r b )
R r e a c t , i , r = min ( R r e a c t , i , r ( r e a c t a n s ) , R r e a c t , i , r ( p r o d u c t s ) ) with   R r e a c t , i , r ( r e a c t a n t s ) = v r i M w , i A ρ ε k m i n R ( Y R v r R M i , R ) and   R r e a c t , i , r ( p r o d u c t s ) = v r i M w , i A B ρ ε k m i n R P Y R i = 1 N v r i M w , i
k r = A r T β r e E r / R T

2.2.3. Oxidation and Gasification Models of Residual Carbon

Another product after the pyrolysis of pulverized coal is considered to be pure carbon, that is, residual carbon, which will participate in the relevant oxidation and gasification reactions after being completely separated from the raw coal. Heterogeneous reactions involving carbon residues mainly include C(s)-O2, C(s)-CO2 and C(s)-H2O, as shown in Equations (10)–(12).
C(s) + 0.5O2  CO
C(s) + CO2  2CO
C(s) + H2O CO + H2
In the simulations, a multi-interface chemical reaction model, which assumed that particle-phase surface species could be consumed or produced stoichiometrically by particle surface reactions, was employed to express the chemical reaction rates of these processes. The surface material of pulverized coal particle was regarded as pure carbon and participated in oxidation and gasification reactions. In addition, the kinetic rate kr of the chemical reaction was calculated by the Arrhenius formula, given by,
k r = A r T p β e ( E r / T P )
The apparent order of chemical reaction r was 1; as a result, the carbon consumption rate Rj,r on the surface of pulverized coal particles was calculated by Equation (14).
R j , r = A p η r Y j P n k r D 0 , r D 0 , r + k r
where Ap and ηr are particle surface area and effective factor, respectively. Yj denotes the mass fraction of material j on the particle surface. Pn is the partial pressure of the gas phase. D0,r is the diffusion rate coefficient of the chemical reaction r, given by
D 0 , r = C 1 , r [ ( T p + T ) / 2 ] 0.75 d p
where C1,r is the molar concentration of substance j in chemical reaction r. The kinetic parameters associated with the above heterogeneous chemical reactions are summarized and listed in Table 3.

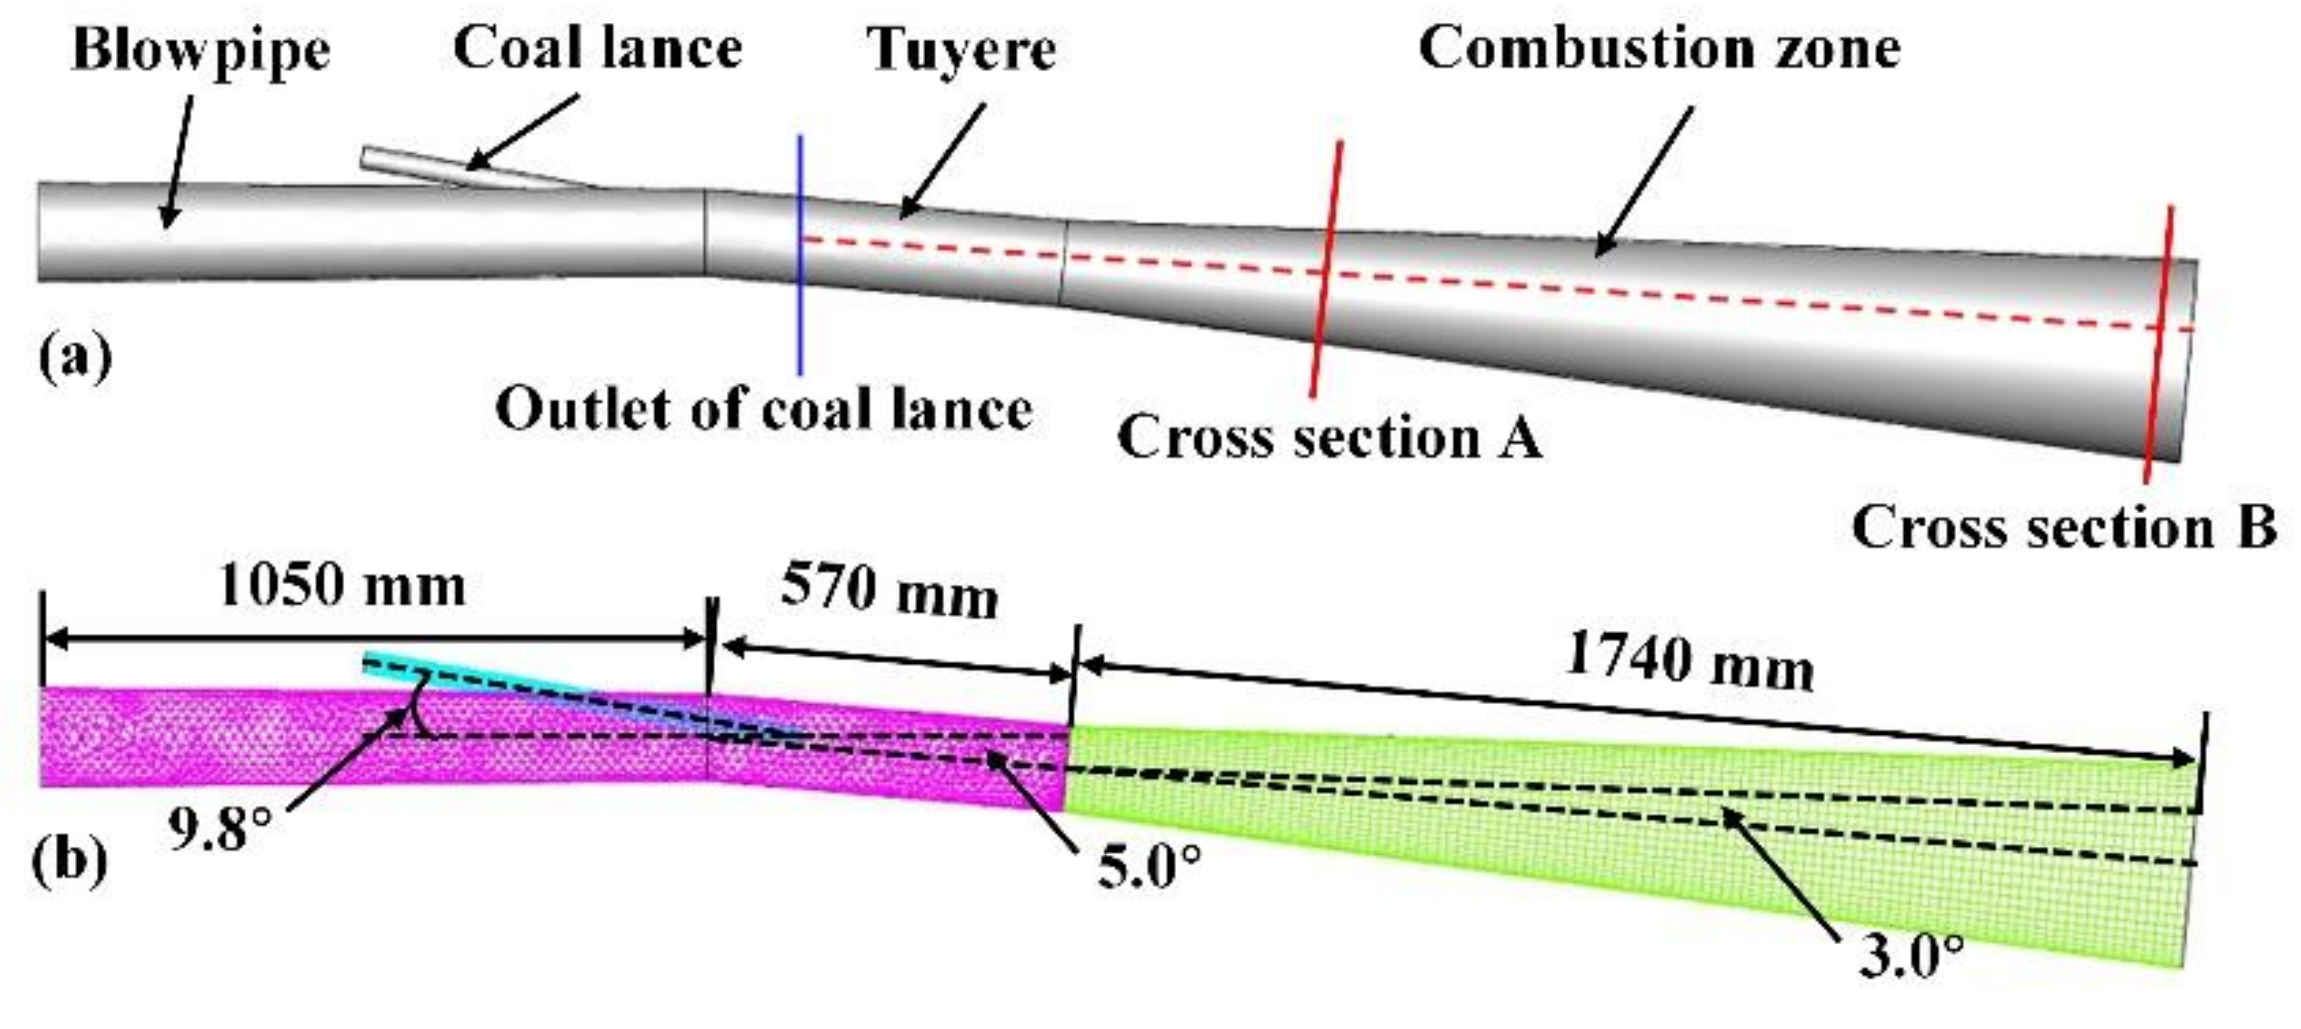
2.3. Geometric Model

The geometric model of this work was the same as the actual size of the blast furnace air supply pipe in a steel plant, including the blowpipe, the tuyere, the combustion zone and the coal injection lance, as shown in Figure 1a. The coal lance with a diameter of 35 mm was obliquely inserted into the blowpipe and the tuyere, and the outlet tip of the coal lance intersected the centerline of the blowpipe with an included angle of 9.8°. The blowpipe was a tapered pipe structure with a length of 1050 mm, and its inlet and outlet diameters were 150 mm and 130 mm, respectively. The right side of the blowpipe was connected to a tuyere with a length of 570 mm and the included angle was 5°. The combustion zone was set as a gradually expanding area with a length of 1740 mm and an expansion angle of 3°. In the simulations, the pipe wall was treated with adiabatic no-slip boundary conditions, and the pressure at the inlet of blowpipe was set to 437 kPa. The outlet of the combustion zone was set as pressure outlet. The geometric model was divided in the form of mixed mesh with a mesh number of 120,000. Note that mesh refinement was performed in the coal injection lance section, as shown in Figure 1b. Particularly, the mesh-independence tests were conducted before the simulation. Four different mesh resolutions with cell numbers of about 60,000, 120,000, 180,000 and 240,000 were tested. The simulation results with a cell number of 60,000 are significantly different from the other conditions. To balance calculation accuracy and speed, the cell number of 120000 was thus selected in the simulations.

2.4. Simulation Conditions

The pulverized coal in the simulations is mainly composed of 90% semi-coke and 10% coke powder. Table 4 lists the data of industrial analysis and elemental analysis of semi-coke and coke powder. Particularly, the industrial analysis process was performed according to the national standards GB/T 2001–2013. The element analysis of the fuel was conducted in an YX-CHN5000 analyzer. The blended coal had a uniform particle size of 60 μm, a density of 1400 kg/m3, and a calorific value of 30,472.301 kJ/kg.
All simulation cases were performed on FLUENT 18.0. The SIMPLE algorithm was used to calculate the pressure-velocity coupled equations. The gradient and pressure in spatial discretization were calculated by least-square cell-based and PRESTO algorithms, respectively. The convergence standard required the residual curves of each index to be less than 1 × 10⁻⁵, and especially the residual curves of energy were less than 1 × 10⁻⁶. In the simulations, the operational parameters were set according to the actual production conditions of the blast furnace, which are listed in Table 5.

3. Results and Discussion

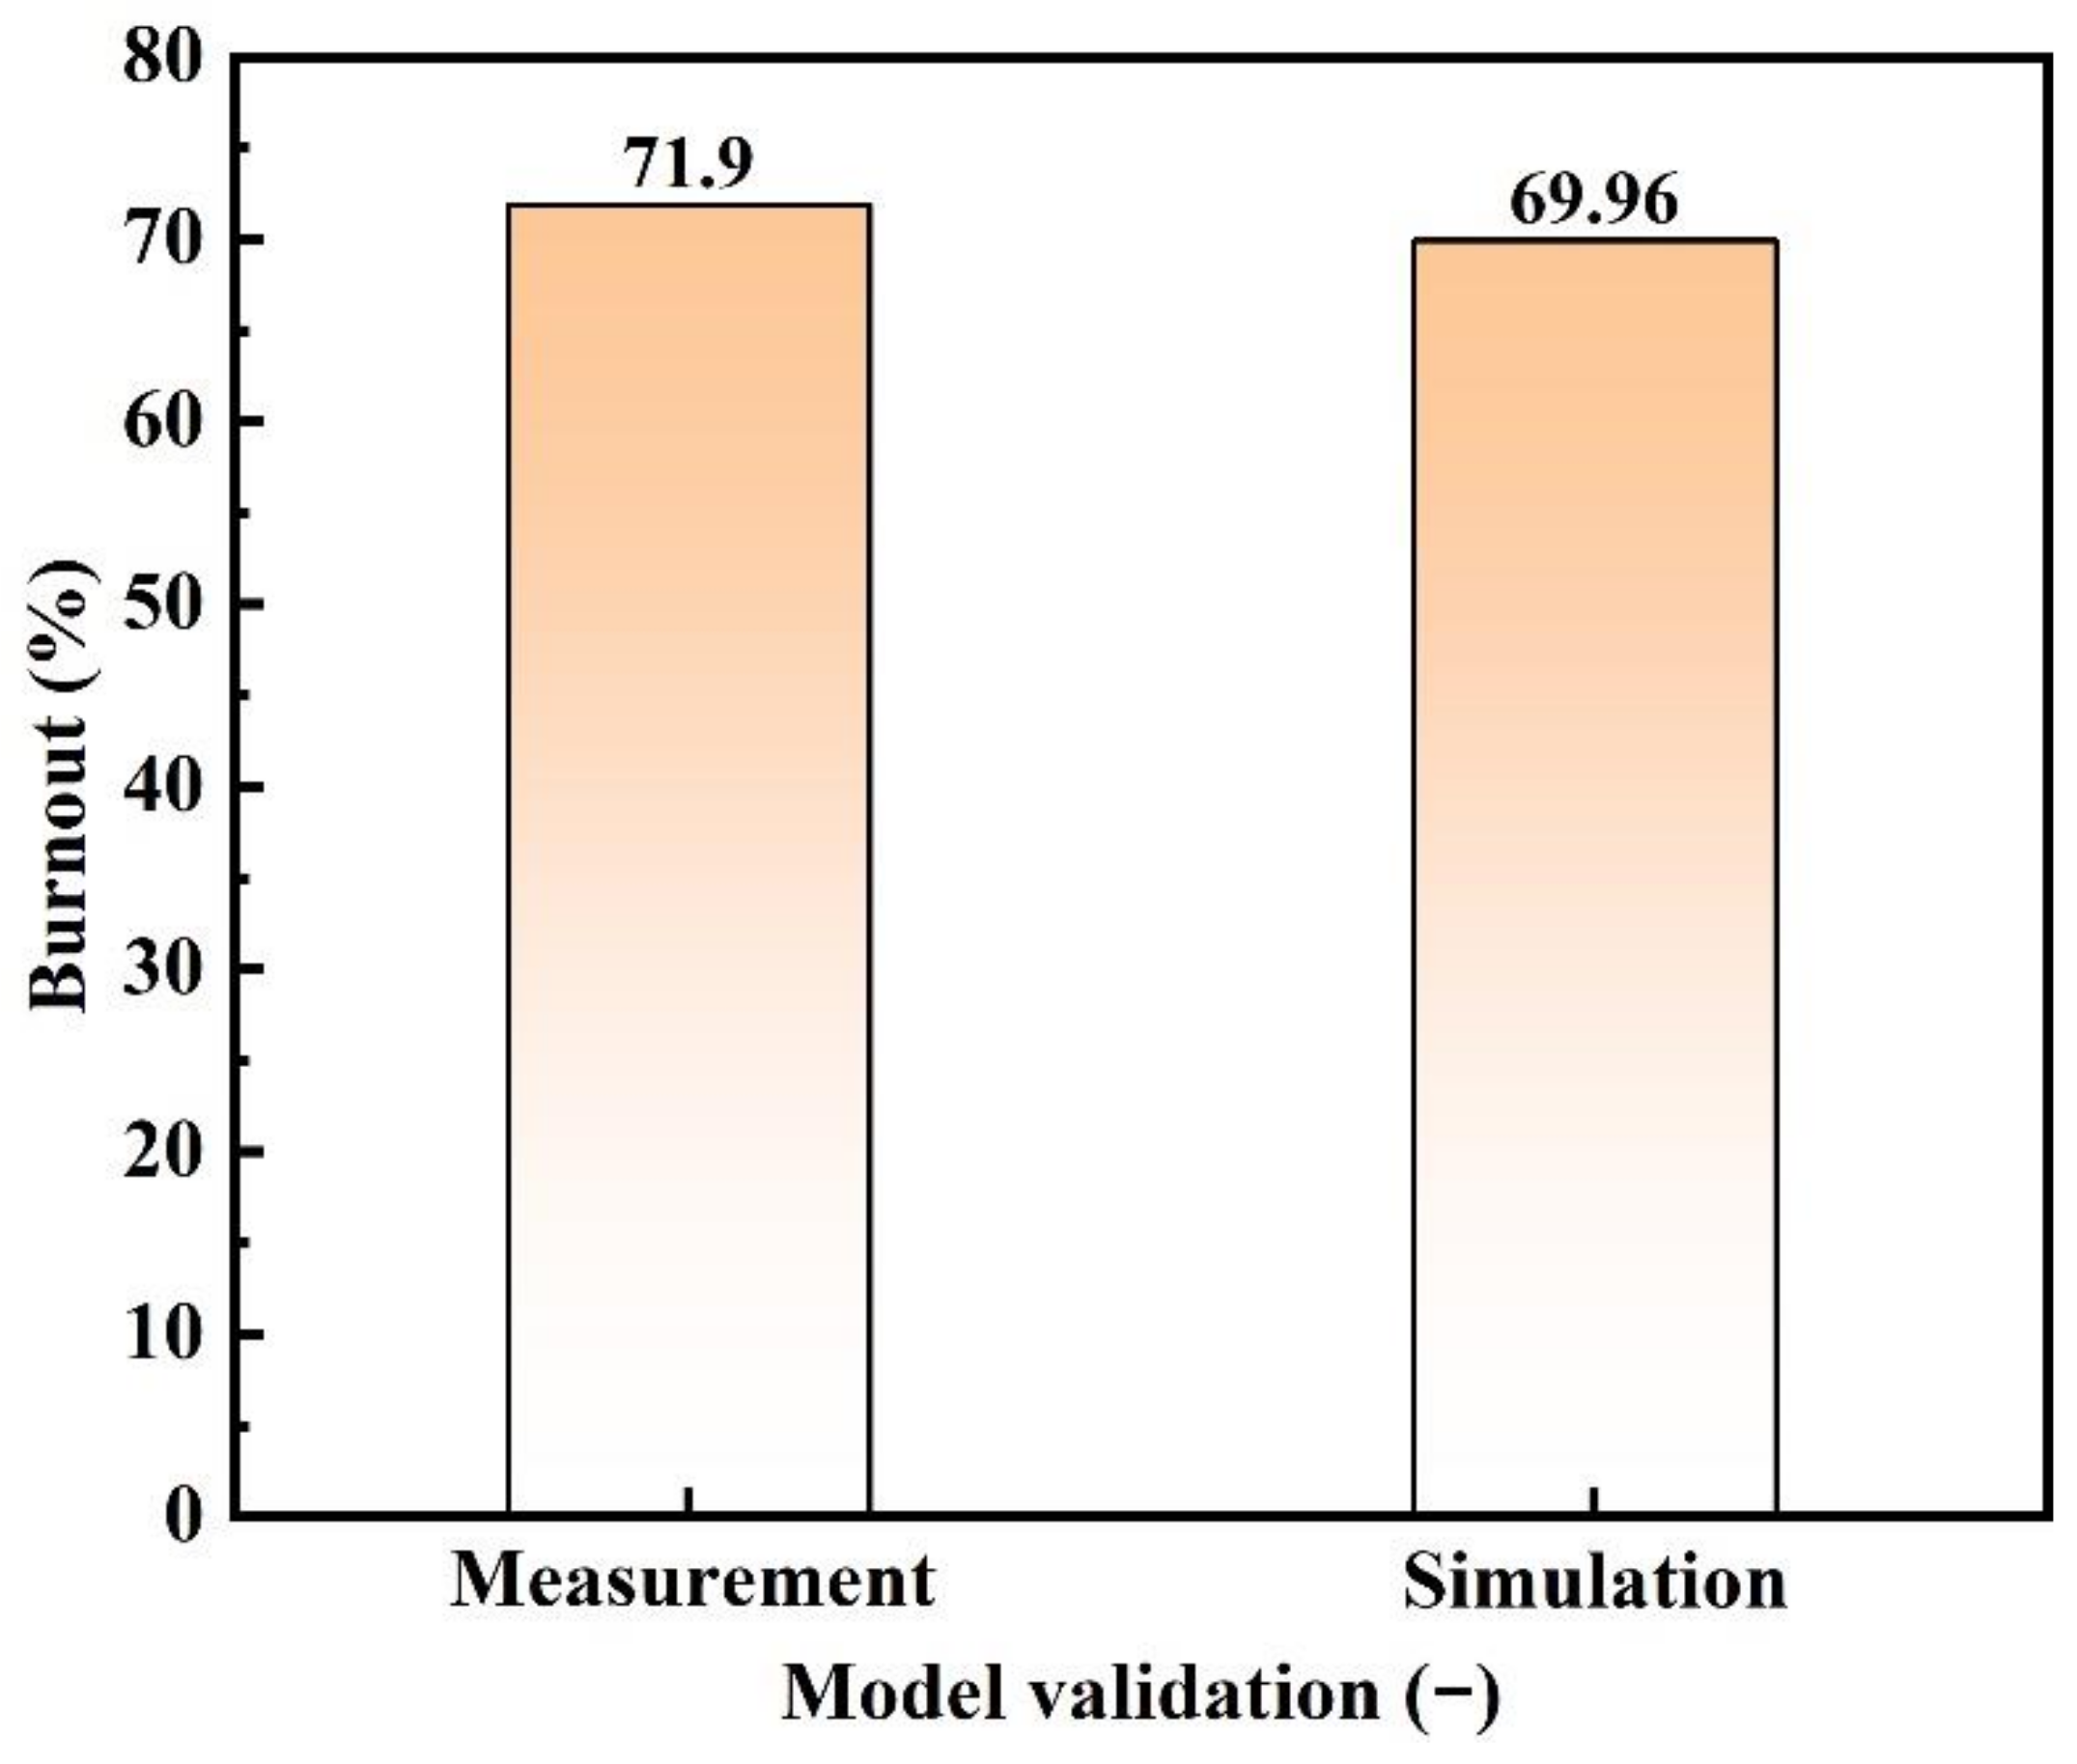
3.1. Model Validation

Blast furnace coal injection is a complex black-box process with high temperature and high pressure, and the combustion effect of pulverized coal in the actual blast furnace is often difficult to detect. To validate the model, the measurement results from a pilot scale test rig in terms of coal burnout along the tuyere centerline were used to compare with simulation results. Note that the coal properties in the reference are close to that in this work (PC-4 in Section 3.3). The burnout indicates the combustion efficiency of coal, which is defined as:
Burnout = 1 m 0   /   m 1   /   1   m 0  
where m0 is the ash content in the original coal, and m1 is the ash content in the burnt residual collected. Figure 2 shows the comparison of the predicted burnout with the experimental results [29]. Obviously, the simulated burnout (69.96%) is very close to the experimental result (91.7%), and the relative error is about 2.7%. This means that the model used in this work can accurately simulate the combustion behavior of pulverized coal.

3.2. Transmission Phenomenon in the Blowpipe-Tuyere-Combustion Zone

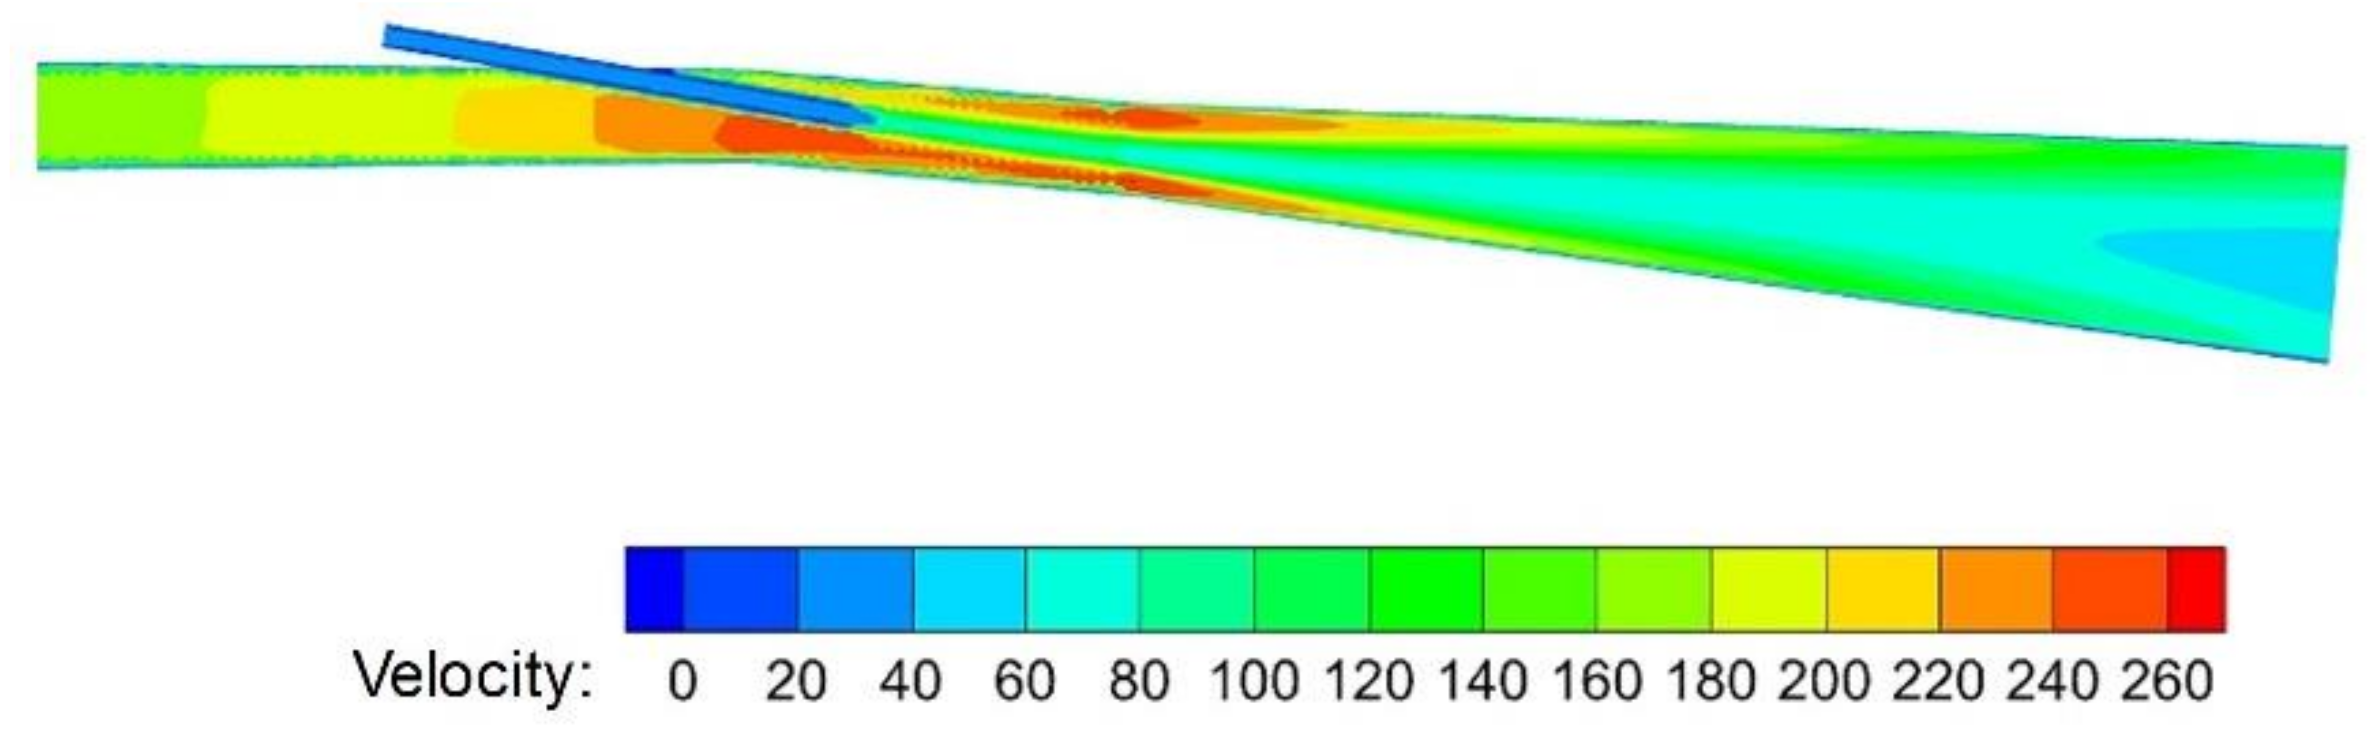
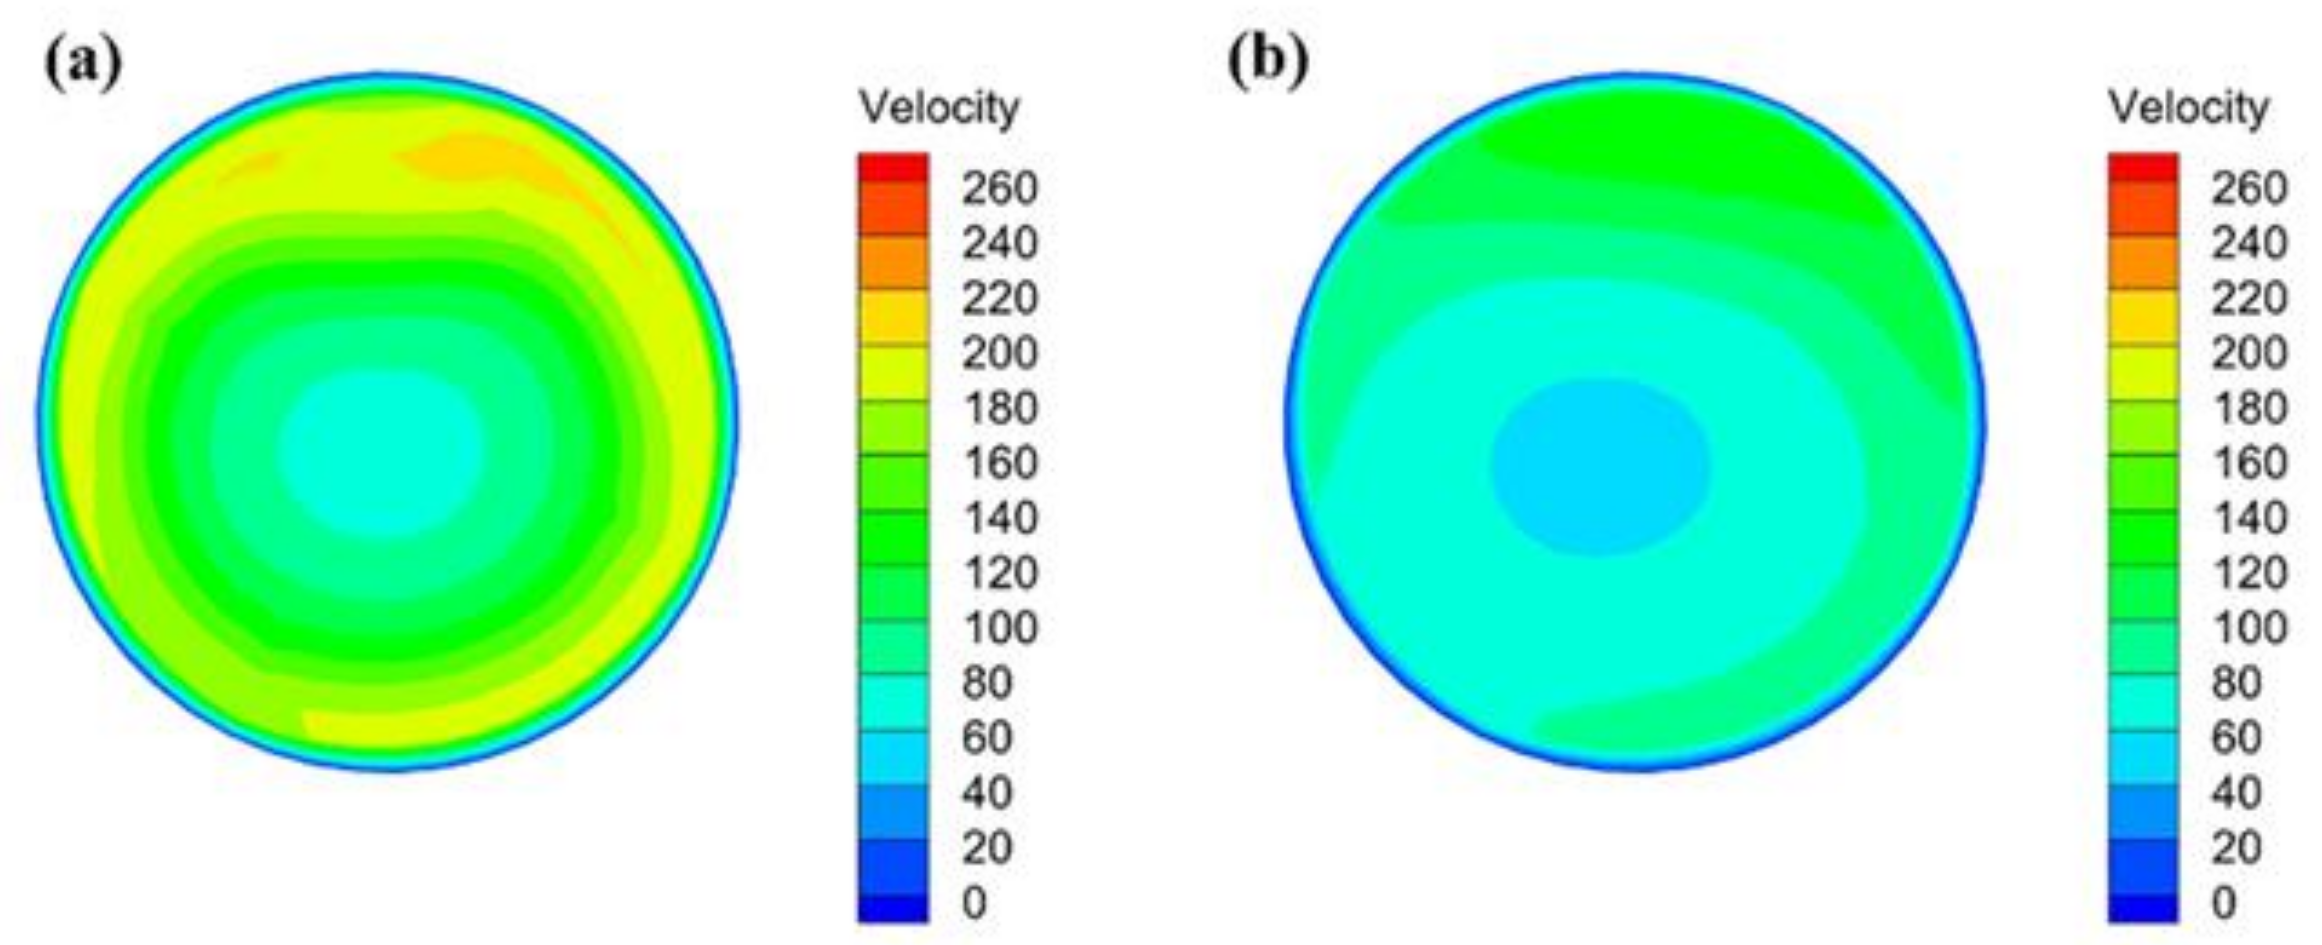
3.2.1. Velocity Distribution

Figure 3 shows the velocity distribution in the symmetrical section of the blowpipe-tuyere-combustion zone. As the diameter of the blowpipe decreases from 150 mm to 130 mm, the gas velocity shows a gradual increasing trend, and the gas velocity at the outlet of the blowpipe is about 250 m/s. The velocity of the gas used for conveying pulverized coal is 22 m/s at the outlet of the injection lance. In addition, the two airflows from the blowpipe and injection lance converge at the tuyere with the maximum gas velocity of 260 m/s. Due to the existence of the pulverized coal gas stream, the gas velocity in the central region is significantly lower than that in the edge region. Since the combustion zone is an expansion area with an included angle of 3°, the gas velocity gradually decreases when it approaches the end of the combustion zone. A coke bed is located around the raceway in the blast furnace, and the high-speed gas will circulate after encountering the packed coke bed area. This work focuses primarily on combustion and thus simplifies the process.
Figure 4 plots the velocity distribution at cross sections A and B of the combustion zone (marked in Figure 1). Obviously, the velocity in the central region of the combustion zone is lower than that in the edge region, which is due to the impediment of the jet flow by the low-velocity pulverized coal, and the complex chemical reaction around the pulverized coal also affects the flow of the gas. This phenomenon gradually weakens with the backward development of the combustion zone, and the velocity distribution of the flow field tends to be uniform.

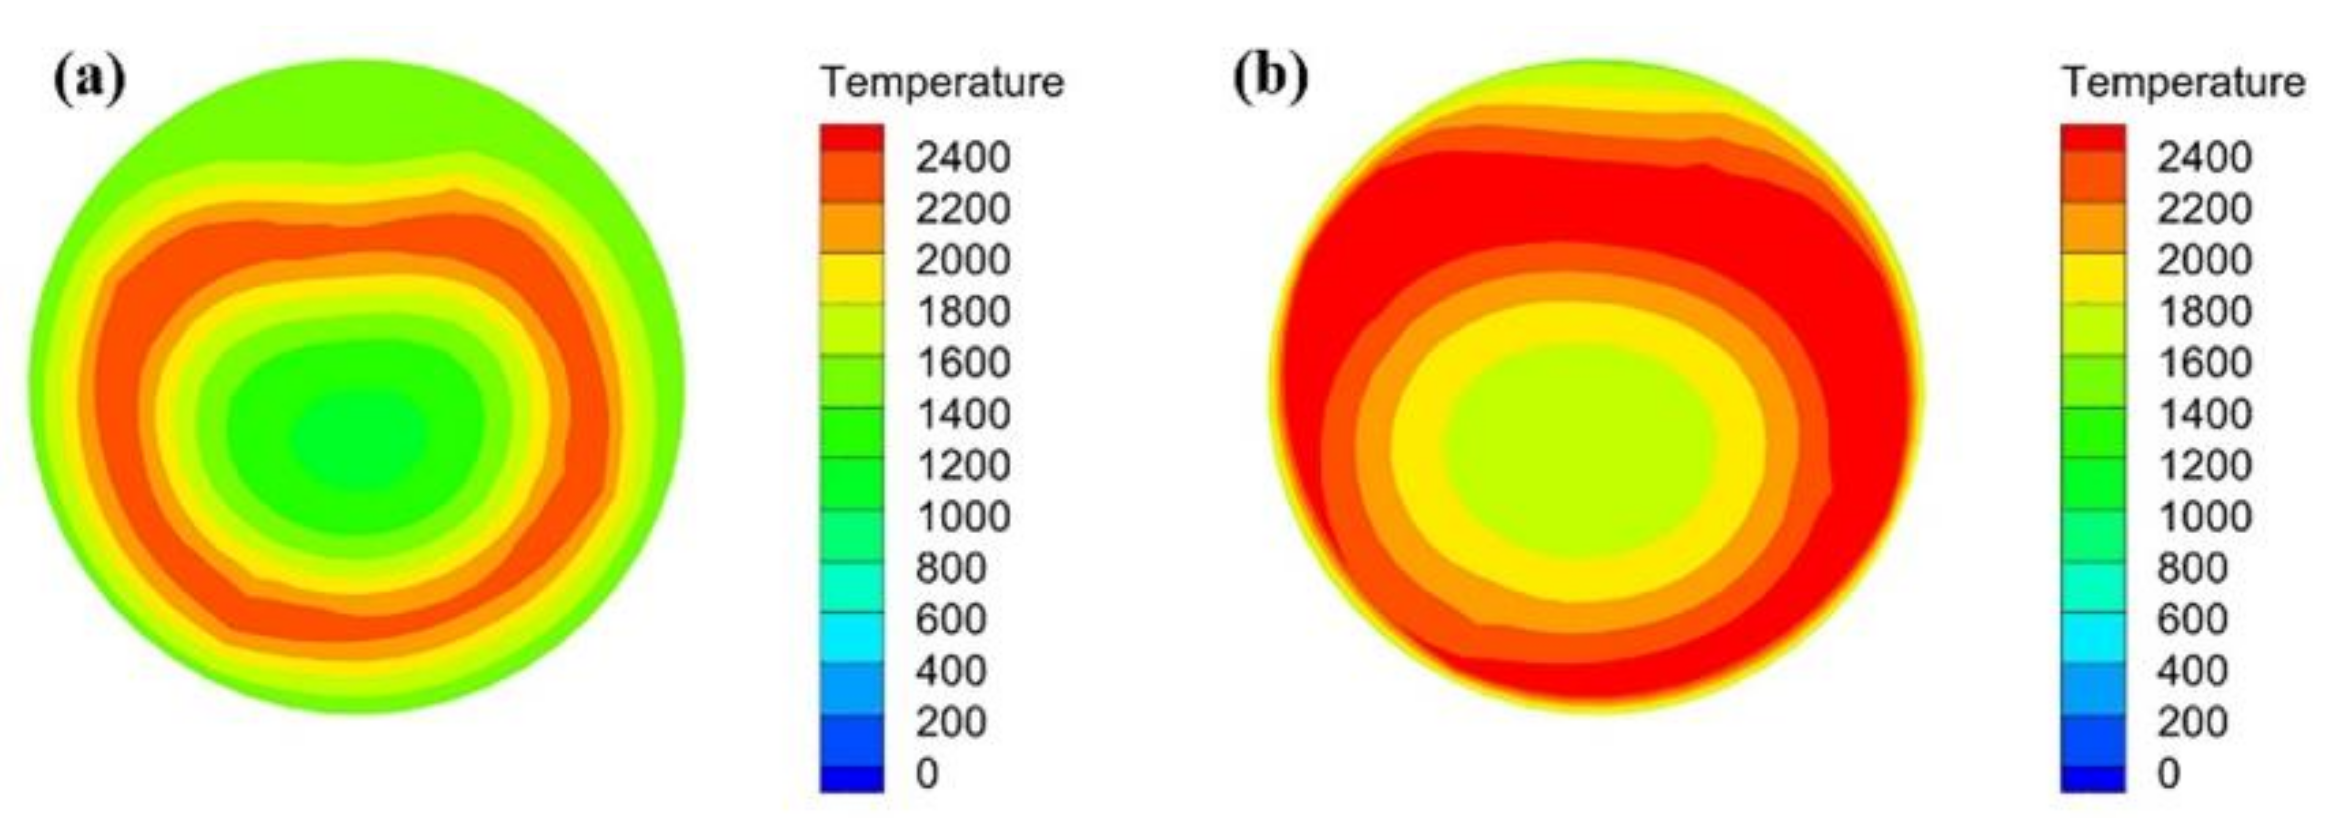
3.2.2. Temperature Distribution

The temperature distribution contour on the symmetrical section is shown in Figure 5. It can be seen that the gas with 1190 °C is evenly distributed at the inlet of the blowpipe. The low-temperature pulverized coal is continuously heated during the process of entering the tuyere zone from the injection lance. The temperature of the gas and powder phases increase continuously in the injection lance, but no combustion occurred in this process due to the fast flow rate of the pulverized coal. There is an enriched low temperature zone at the tip of the injection lance, which is due to the release of volatiles in the pulverized coal as an endothermic process. With the release of volatiles, they undergo combustion reaction at a higher O2 concentration near the pipe wall and release a lot of heat. Particularly, the maximum temperature reaches more than 2400 K. In addition, the temperature area at the front and upper of the combustion zone is significantly larger. This is because the injection lance is inserted into the tuyere at a certain inclination angle, and the pulverized coal is concentrated in the lower part of the combustion zone, so there is sufficient reaction space and oxygen concentration on the upper side to satisfy the oxidation reaction.
As shown in Figure 6, the high temperature zone on the cross section of the combustion zone is annularly distributed. The central pulverized coal stream is not exposed to enough oxygen and can only be continuously heated during the process, thereby releasing volatiles. On the other hand, a vigorous combustion reaction occurs where the pulverized coal stream is in sufficient contact with the oxygen, thus forming an annular high temperature zone. With the extension of the depth of the raceway, more volatiles and residual carbon in the pulverized coal participate in the combustion reaction; the distribution of high temperature zones in the radial direction is therefore continuously expanding. This verifies that the high temperature zone formed in the raceway can provide sufficient heat for the hearth.

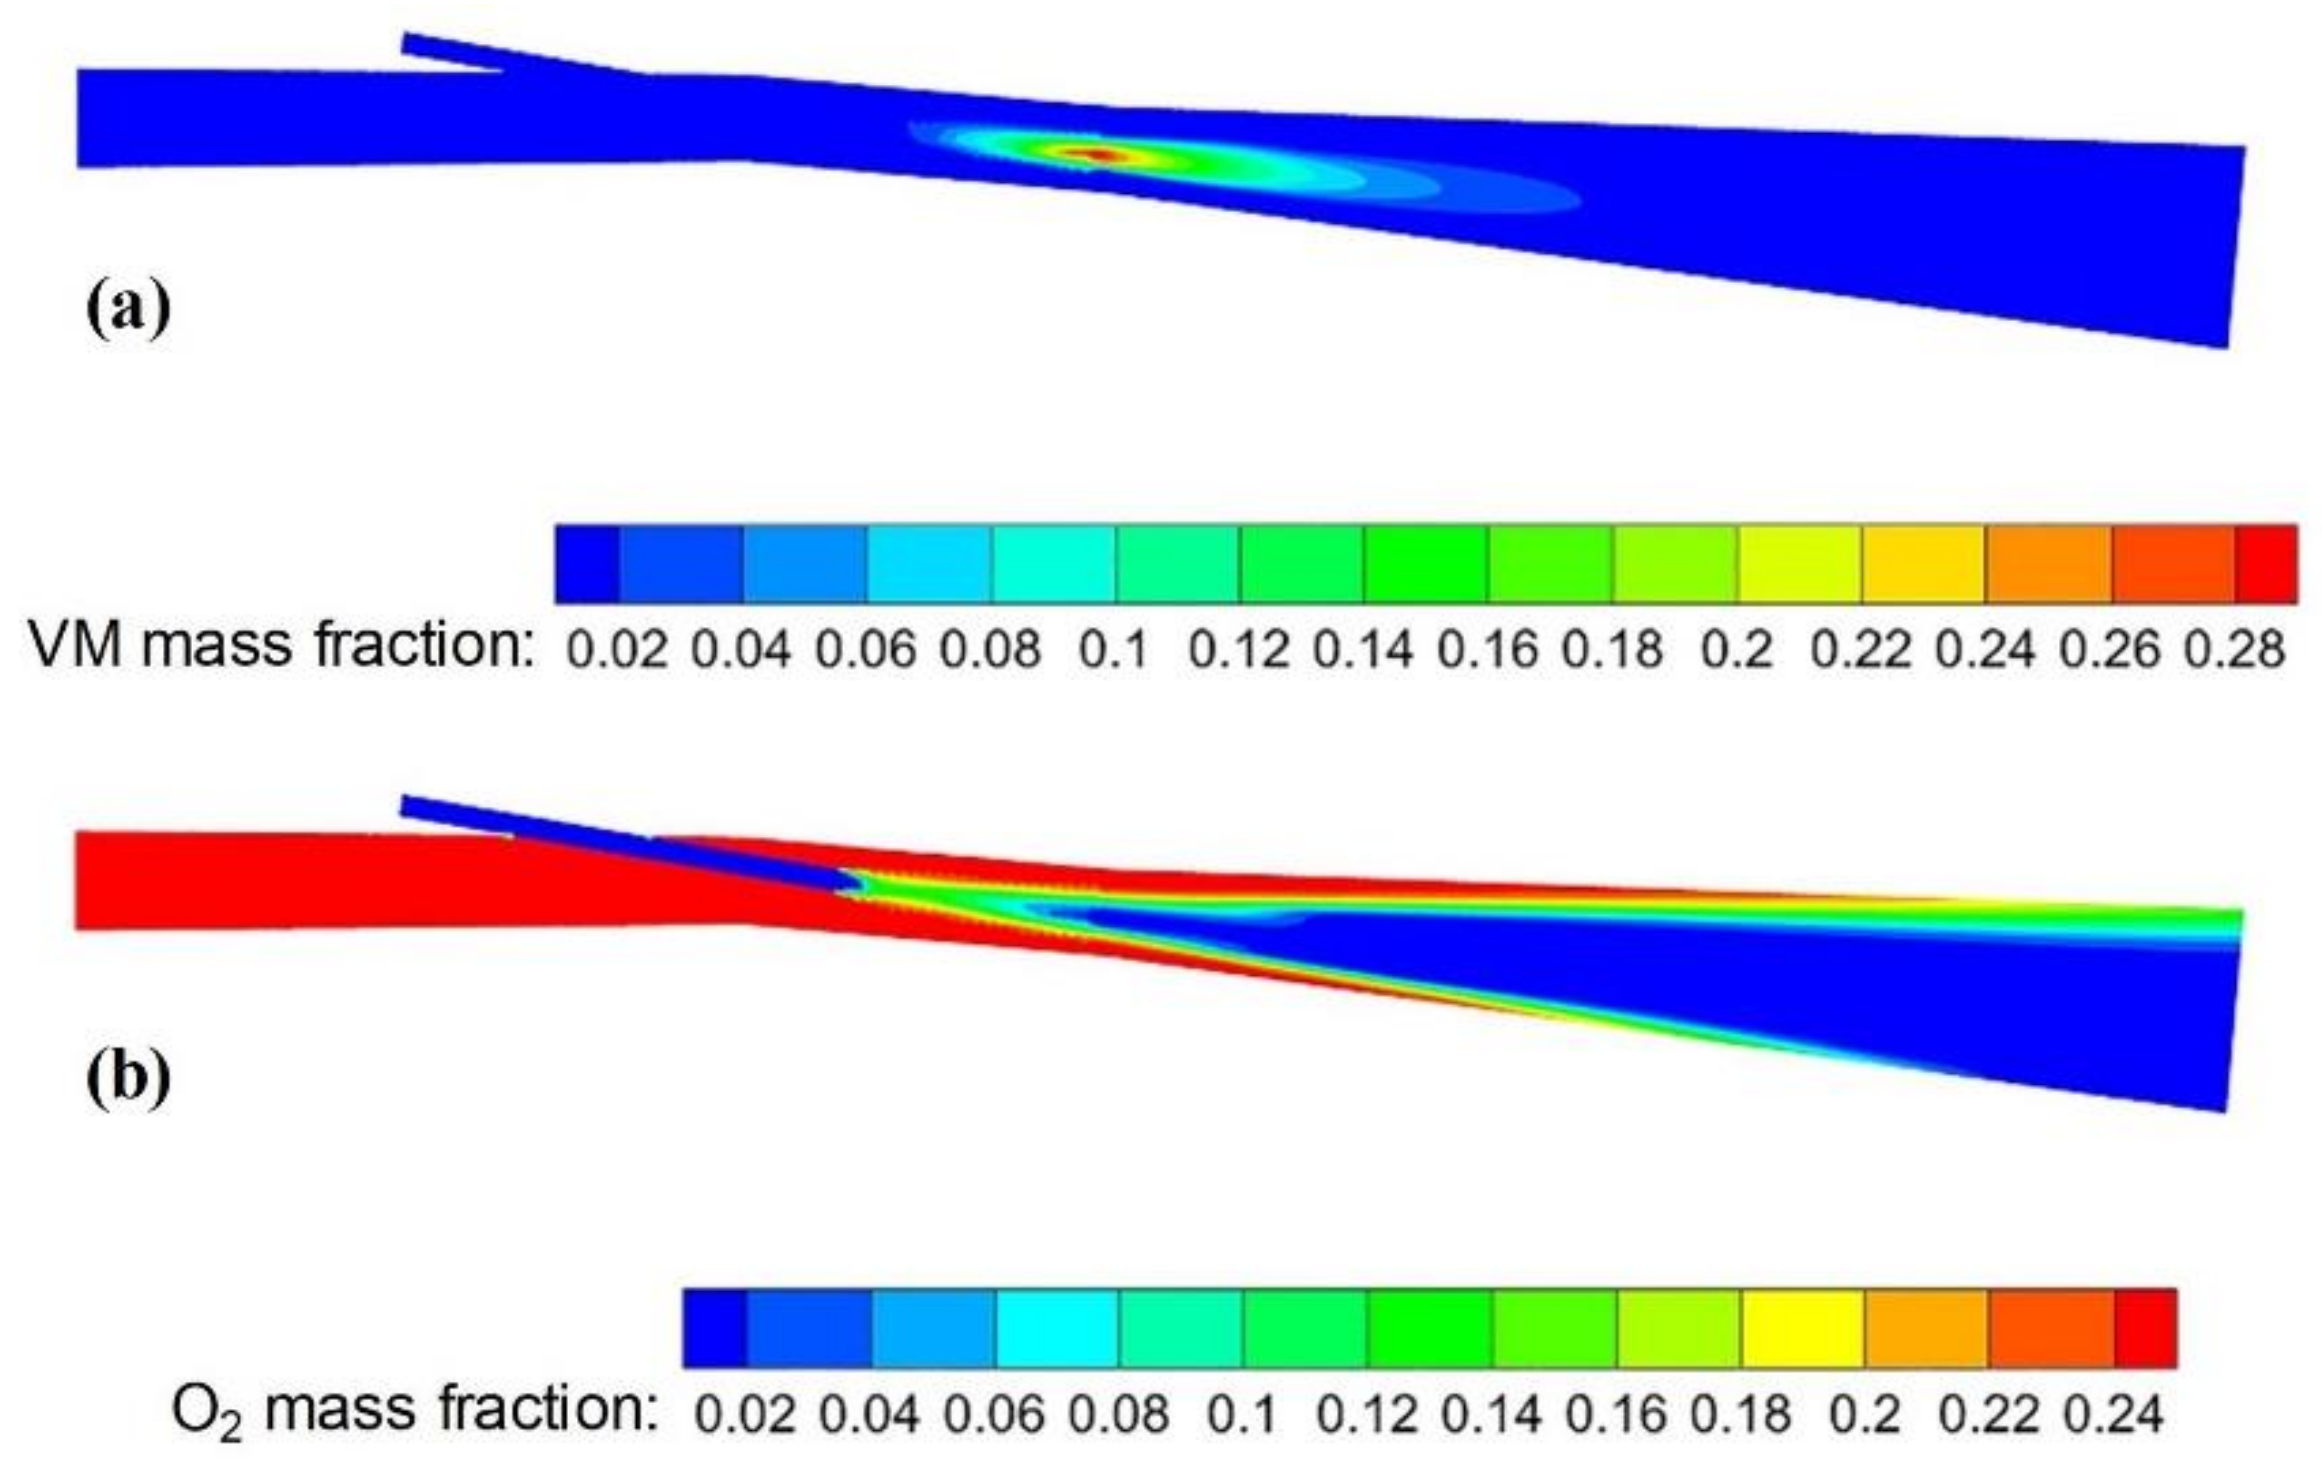
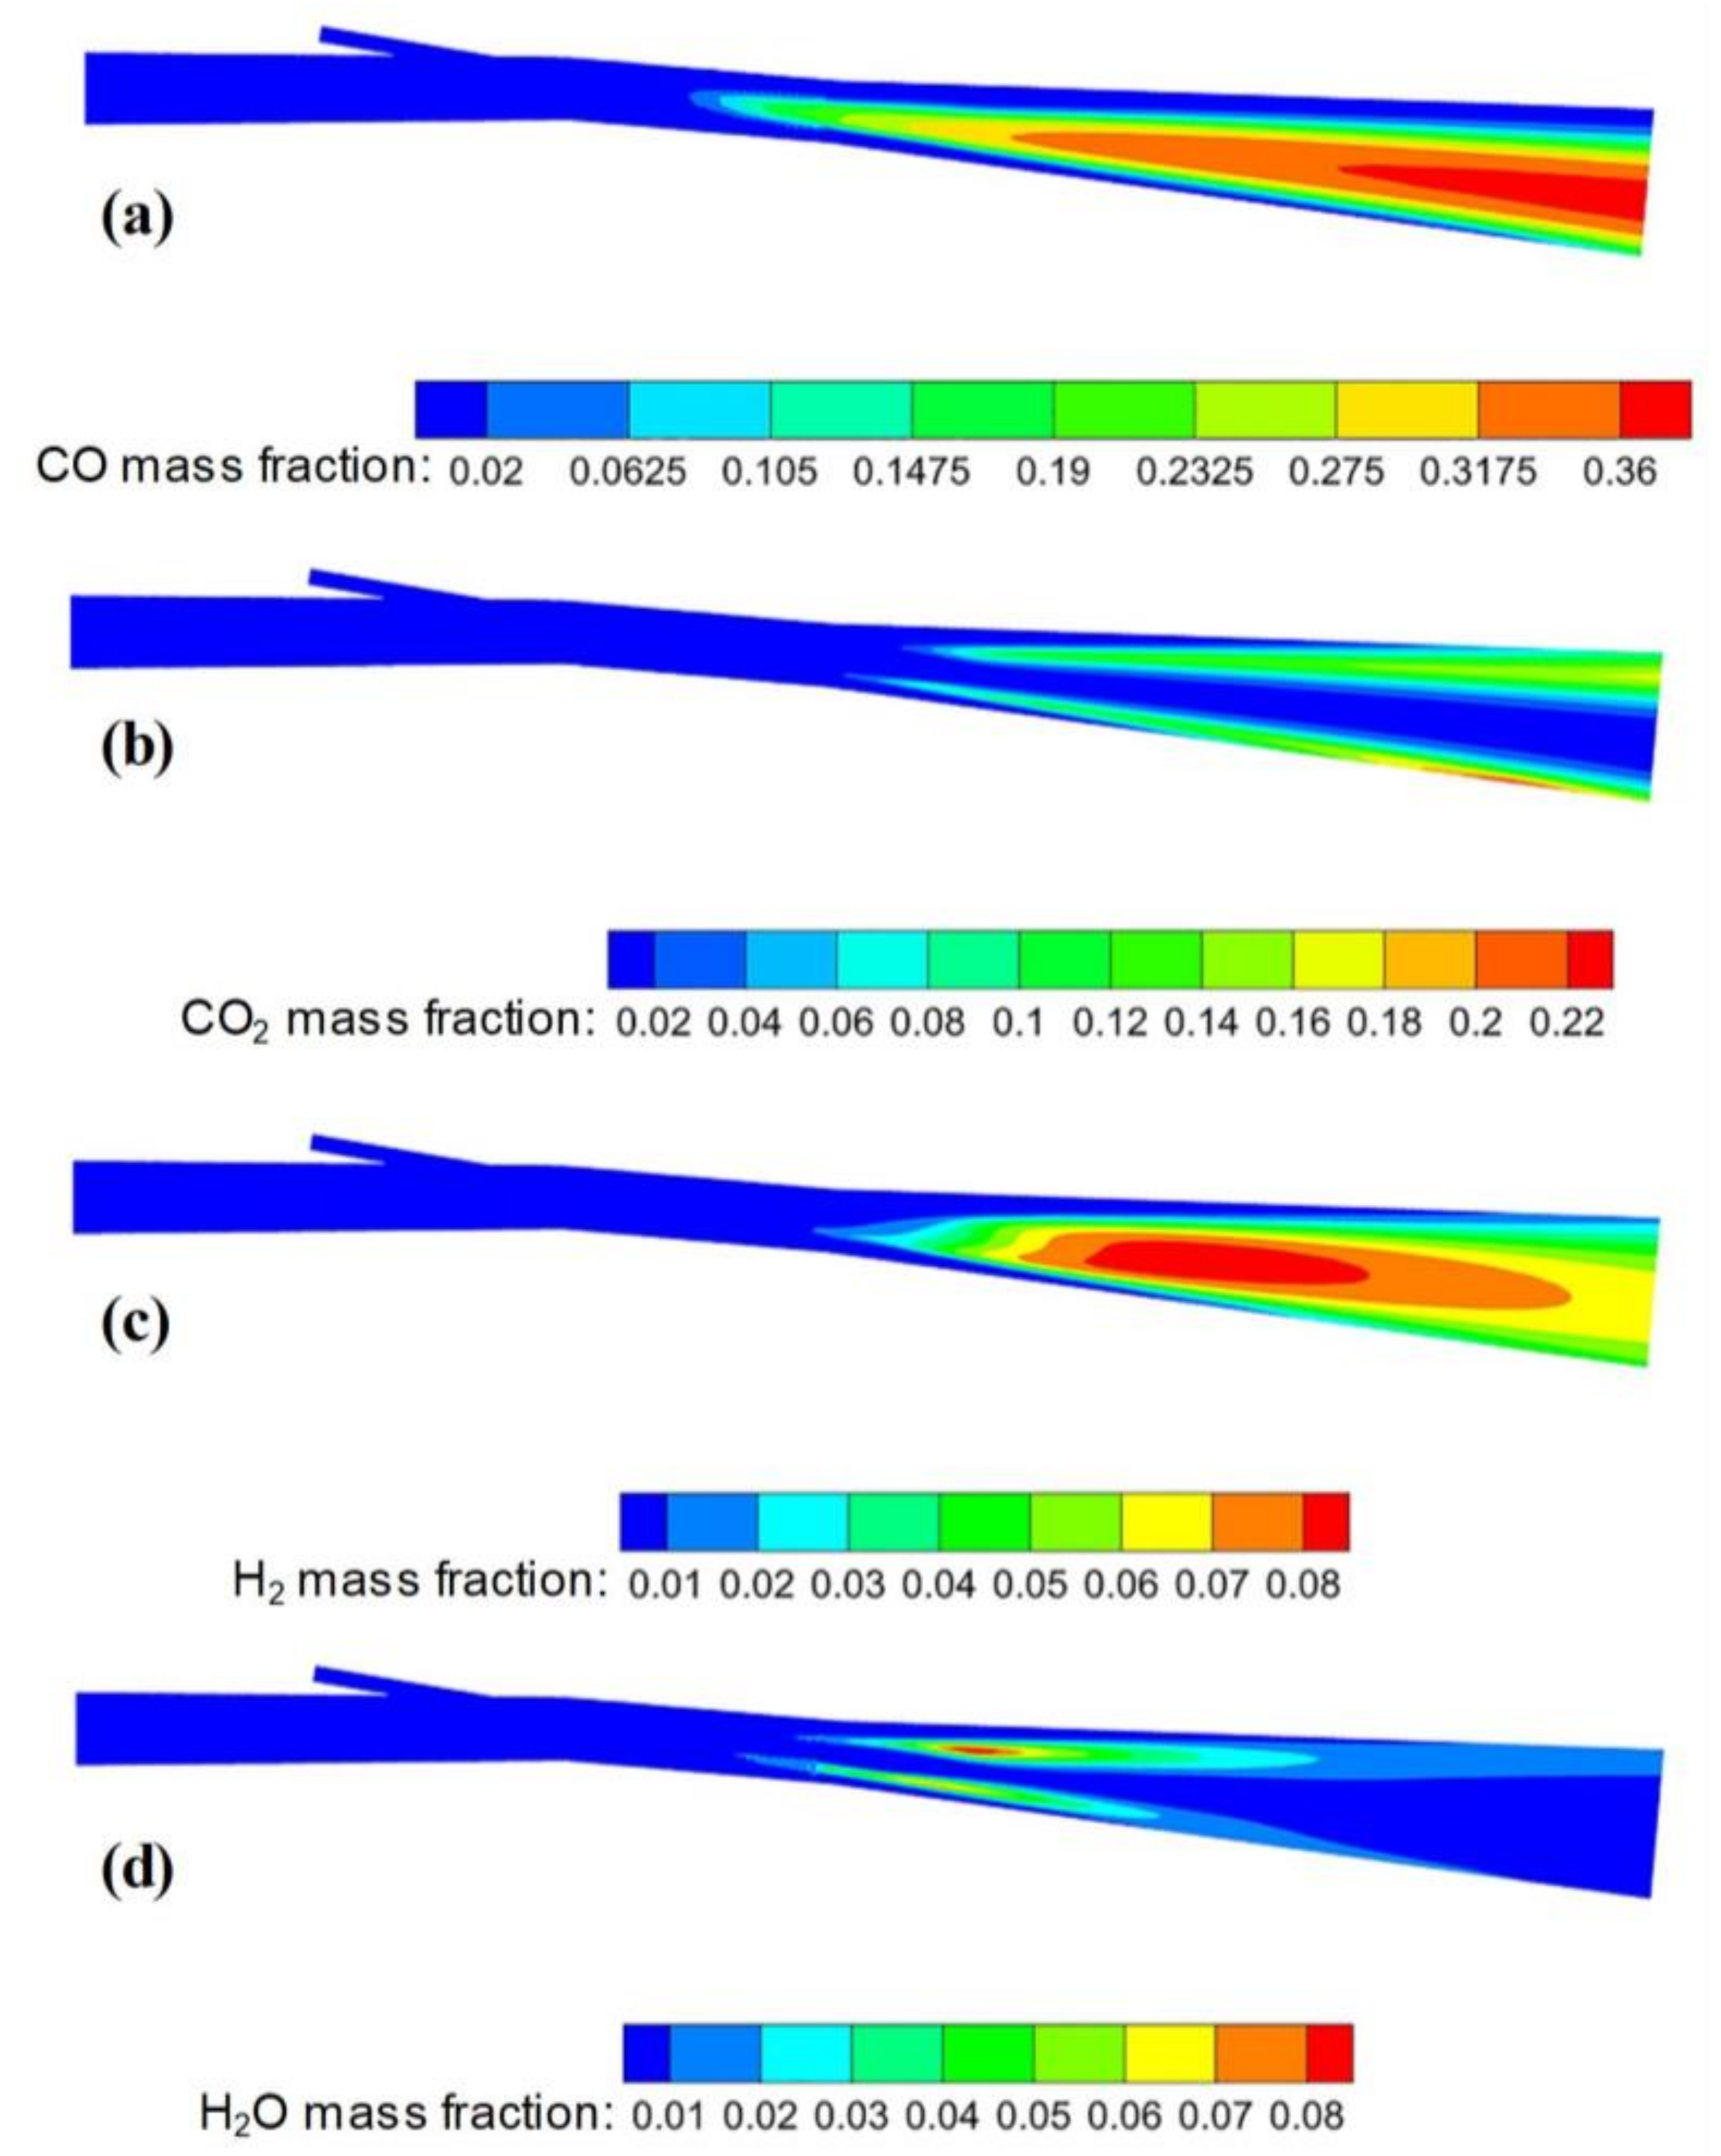
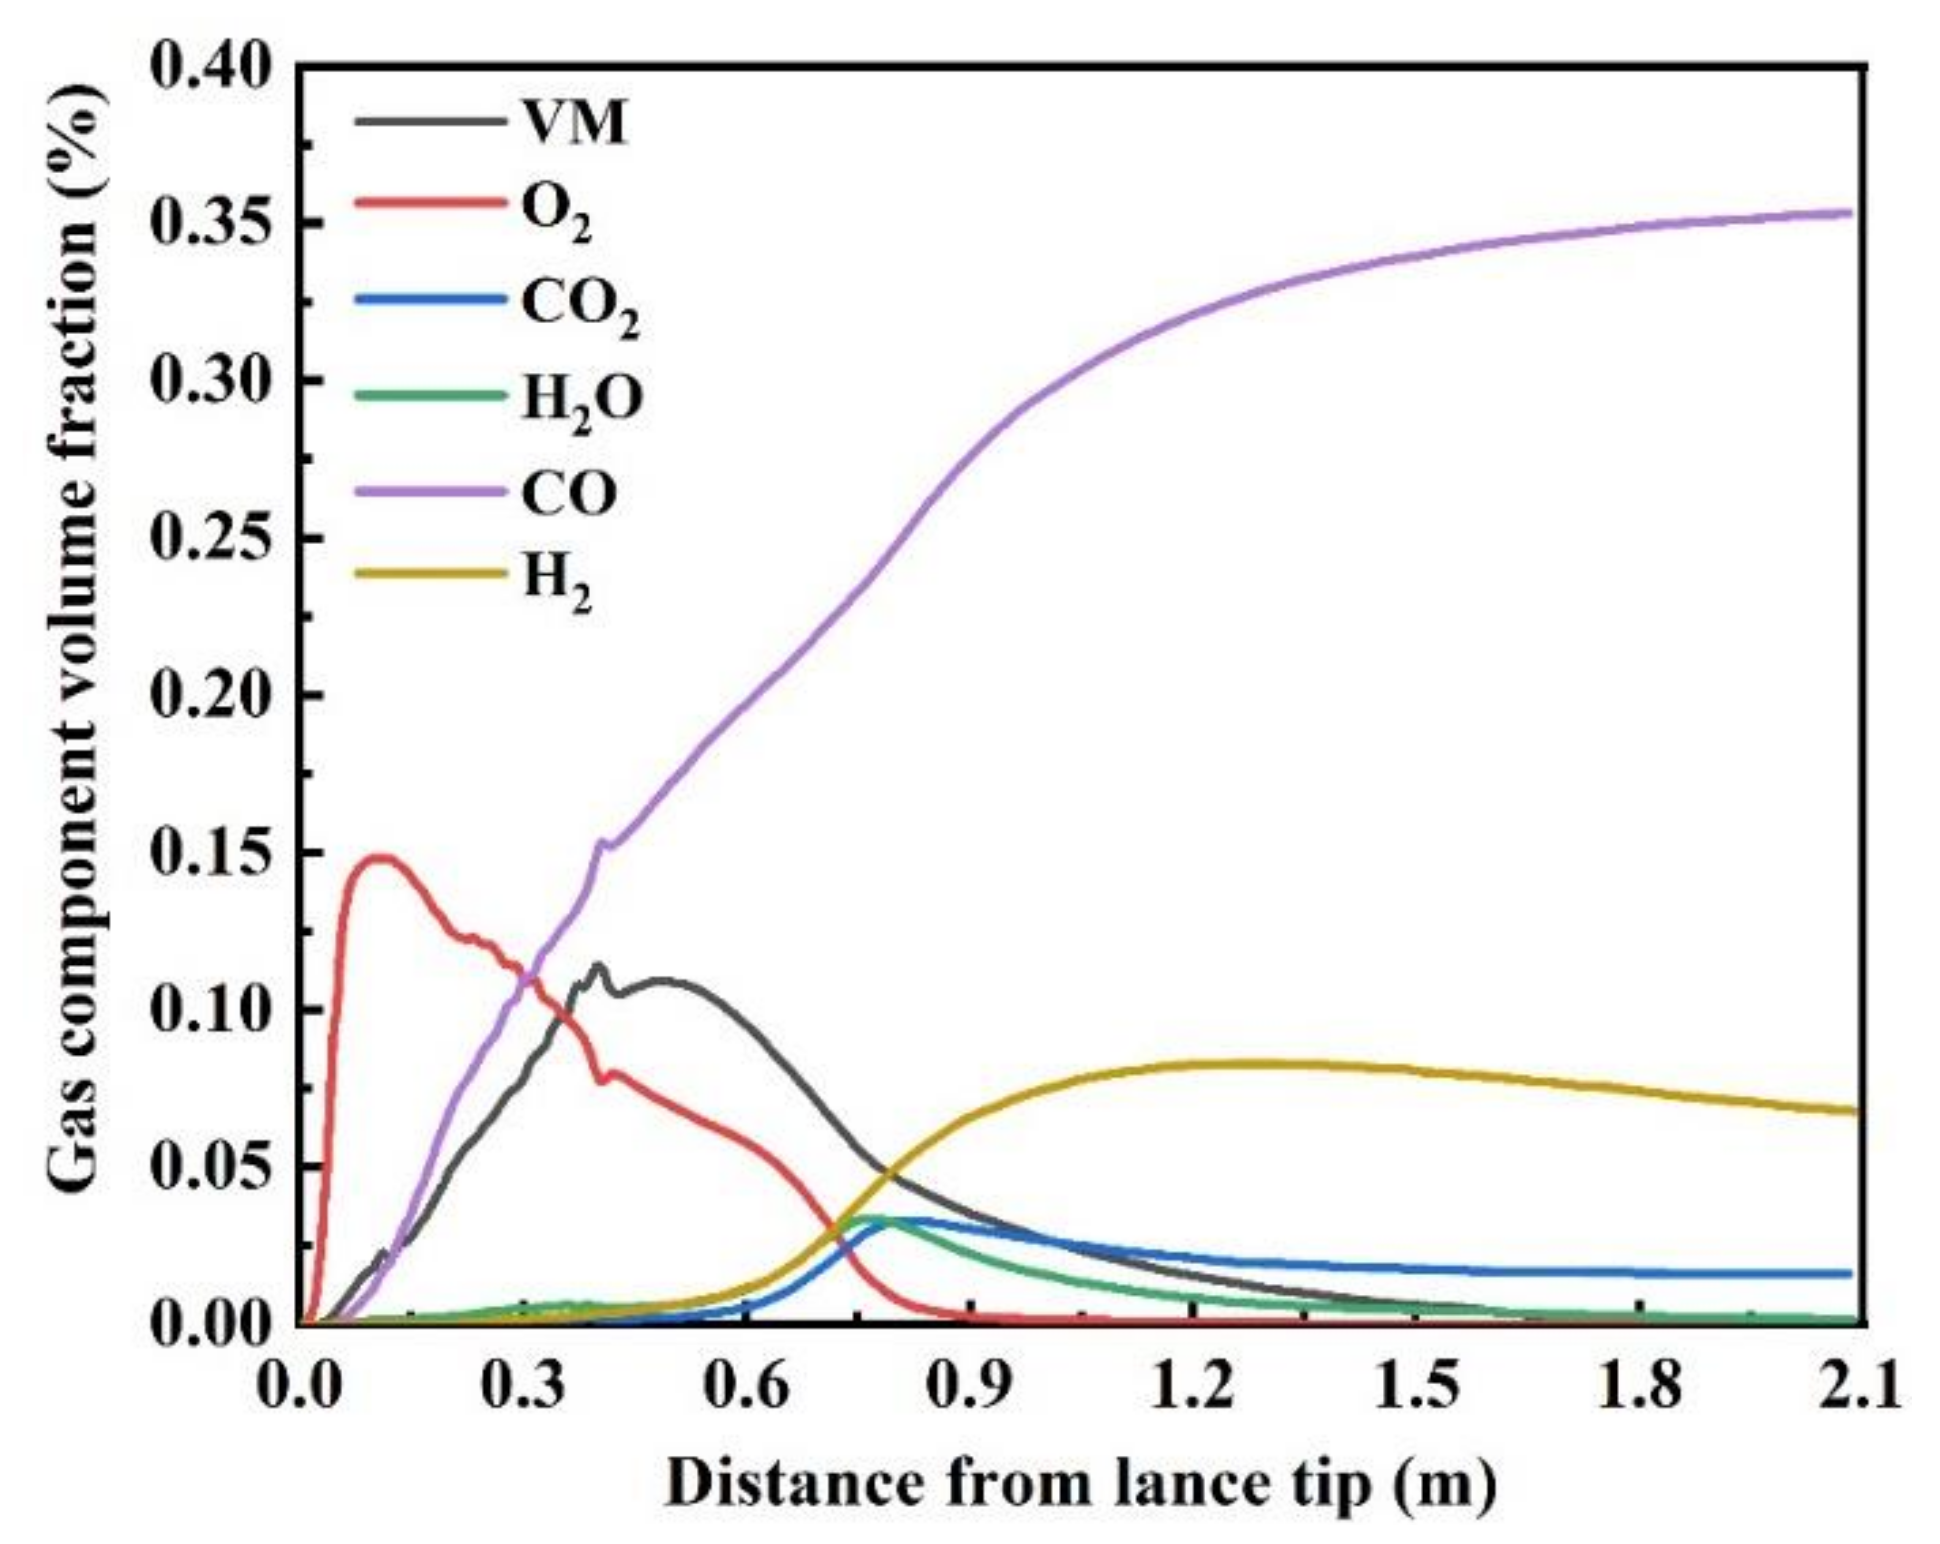
3.2.3. Composition Distribution

After the pulverized coal leaves the lance, it is quickly mixed with the high-temperature blast injected by the blowpipe, so the pulverized coal particles will be heated to the temperature condition for the release of VM in a short period of time, as shown in Figure 7. The pulverized coal begins to release VM after it leaves the injection lance at about 200 mm. Due to the continuous supply of pulverized coal, an enriched region with the highest volatiles content of 28% appeared at 200–600 mm. On the other hand, the concentration distribution of VM and O2 are just opposite, which is caused by the oxidation reaction of volatiles and O2. Generally, O2 is continuously consumed as the reaction proceeds, and there is essentially no O2 at the end of the raceway.
Figure 8 shows the gas composition distribution in the blowpipe-tuyere-combustion zone. CO2 and H2O are the main products of VM combustion, so their concentrations are higher near the annular high temperature region. With the removal of VM from the pulverized coal, the remaining residual carbon will continue to undergo oxidation or gasification reactions. CO and H2 are the main products of C(s)-O2, C(s)-CO2, C(s)-H2O reactions. Thus, the enriched regions of CO and H2 exist in regions with lower oxygen concentrations, and the highest concentrations of CO and H2 are 36% and 8%, respectively. It should be noted that the concentration of H2 is slightly reduced at the end of the raceway; this is because of the dilution of the H2 concentration by the surrounding CO or CO2 gas.
To further clarify the reaction mechanism of each gas component in the blowpipe-tuyere-combustion zone, the gas distribution data along the direction of the coal lance tip were extracted, as shown in Figure 9. Obviously, there are only two gases, O2 and N2, at the discontinuity of the coal lance, and the concentration of O2 decreases quickly. This is because the VM released by the pulverized coal consume O2 in the combustion reaction, and the concentration of the combustion products CO2 and H2O continues to increase. According to the above discussion, it can be determined that the residual carbon after the removal of VM from the pulverized coal will undergo a gasification reaction with CO2 and H2O, but the CO concentration has been rising at the beginning. The main reason is that the concentration of O2 is still higher at the position closer to the coal lance and more generated residual carbon will burn with O2 to produce CO. Therefore, the concentration of CO increases continuously throughout the process, and finally becomes conserved. Particularly, in the mixed gas at the outlet of the raceway, the reducing gases CO and H2 account for about 45%, while CO2 and H2O are less than 10%.

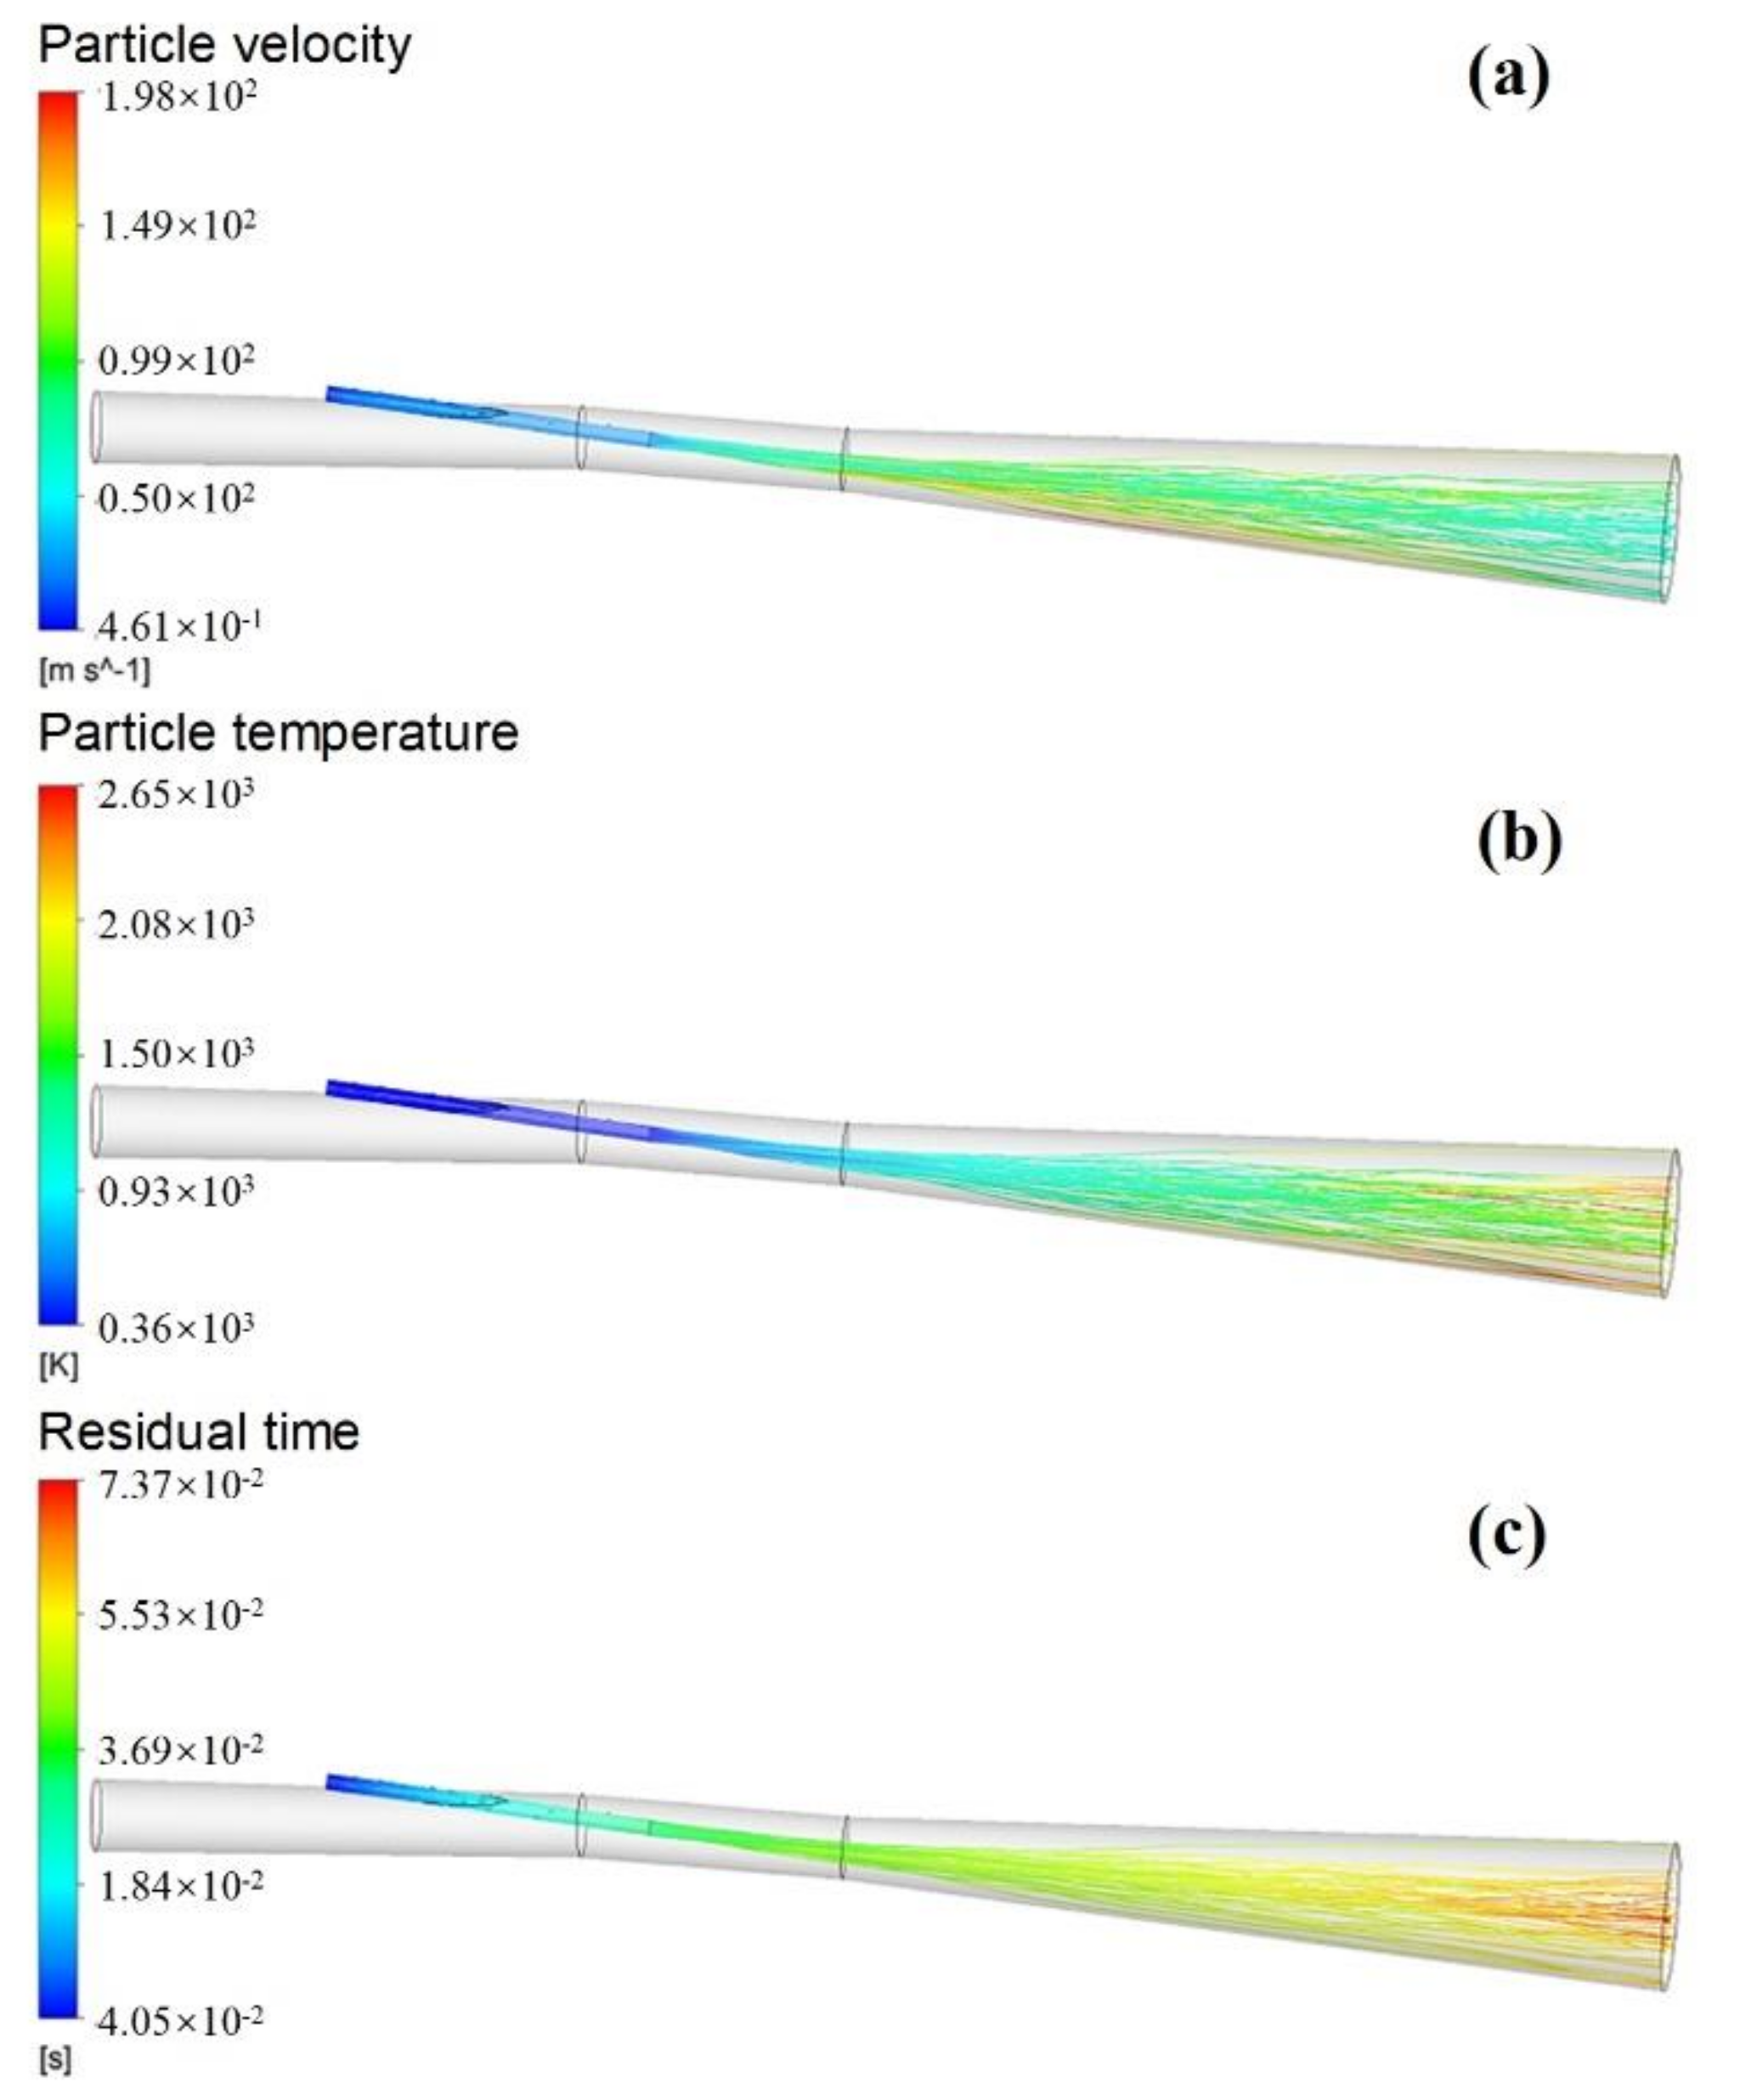
3.2.4. Motion Behavior of Pulverized Coal Particles

Pulverized coal injection technology has been widely used in blast furnace ironmaking due to its advantages of economical, operational and environmental benefits. However, the high pulverized coal injection rate often leads to low burnout rate, and the unburned pulverized coal accumulates at the edge of the raceway, reducing the permeability of the coke bed and the stability of the blast furnace. Improving the burnout rate of pulverized coal is crucial to increase the amount of pulverized coal injection and reduce the production cost. A comprehensive understanding of the pulverized coal combustion process in the blast furnace tuyere raceway is critical for optimal selection of injection rates and blast parameters. Hence, the particle trajectories are employed to explore the motion behavior of the pulverized coal particles in the tuyere raceway.
Figure 10 shows the velocity, temperature and residual time distribution of pulverized coal particles. The velocity distribution of pulverized coal particles is almost the same as the flow field in the model, which indicates that the high-speed hot wind flow and conveying gas flow determine the motion state of pulverized coal in the tuyere and the combustion zone. The pulverized coal particles are quickly diluted after entering the tuyere, so the interaction between the particles can be ignored. In addition, the temperature variation of pulverized coal particles also confirms the rationality of the distribution of gas components. The continuously heated pulverized coal undergoes the process of VM removal, residual carbon combustion and gasification, providing a large amount of reducing gas and heat for the raceway. The pulverized coal is covered by the high-speed hot air flow during the movement. Since there is no circulation flow in the model, the longest residence time of the pulverized coal particles is only 70 ms. Therefore, the efficient combustion of pulverized coal in a very short period of time is one of the keys to maintaining the stable operation of the blast furnace.
To clarify the combustion of the blended coal in the raceway, the variation of the burnout of the pulverized coal particles during the movement process was calculated, as shown in Figure 11. It can be found that the low-temperature pulverized coal moves faster near the tip of the coal lance, and the combustion is not sufficient. The VM in the pulverized coal are gradually released with the increase of temperature, and more residual carbon participates in the oxidation and gasification reactions, resulting in a sharp increase in the burnout of the pulverized coal. Since the O2 is consumed in the end of the raceway, the composition and temperature distribution of the gas tends to be uniform; the burnout of pulverized coal changes little and finally stabilizes at about 67%.

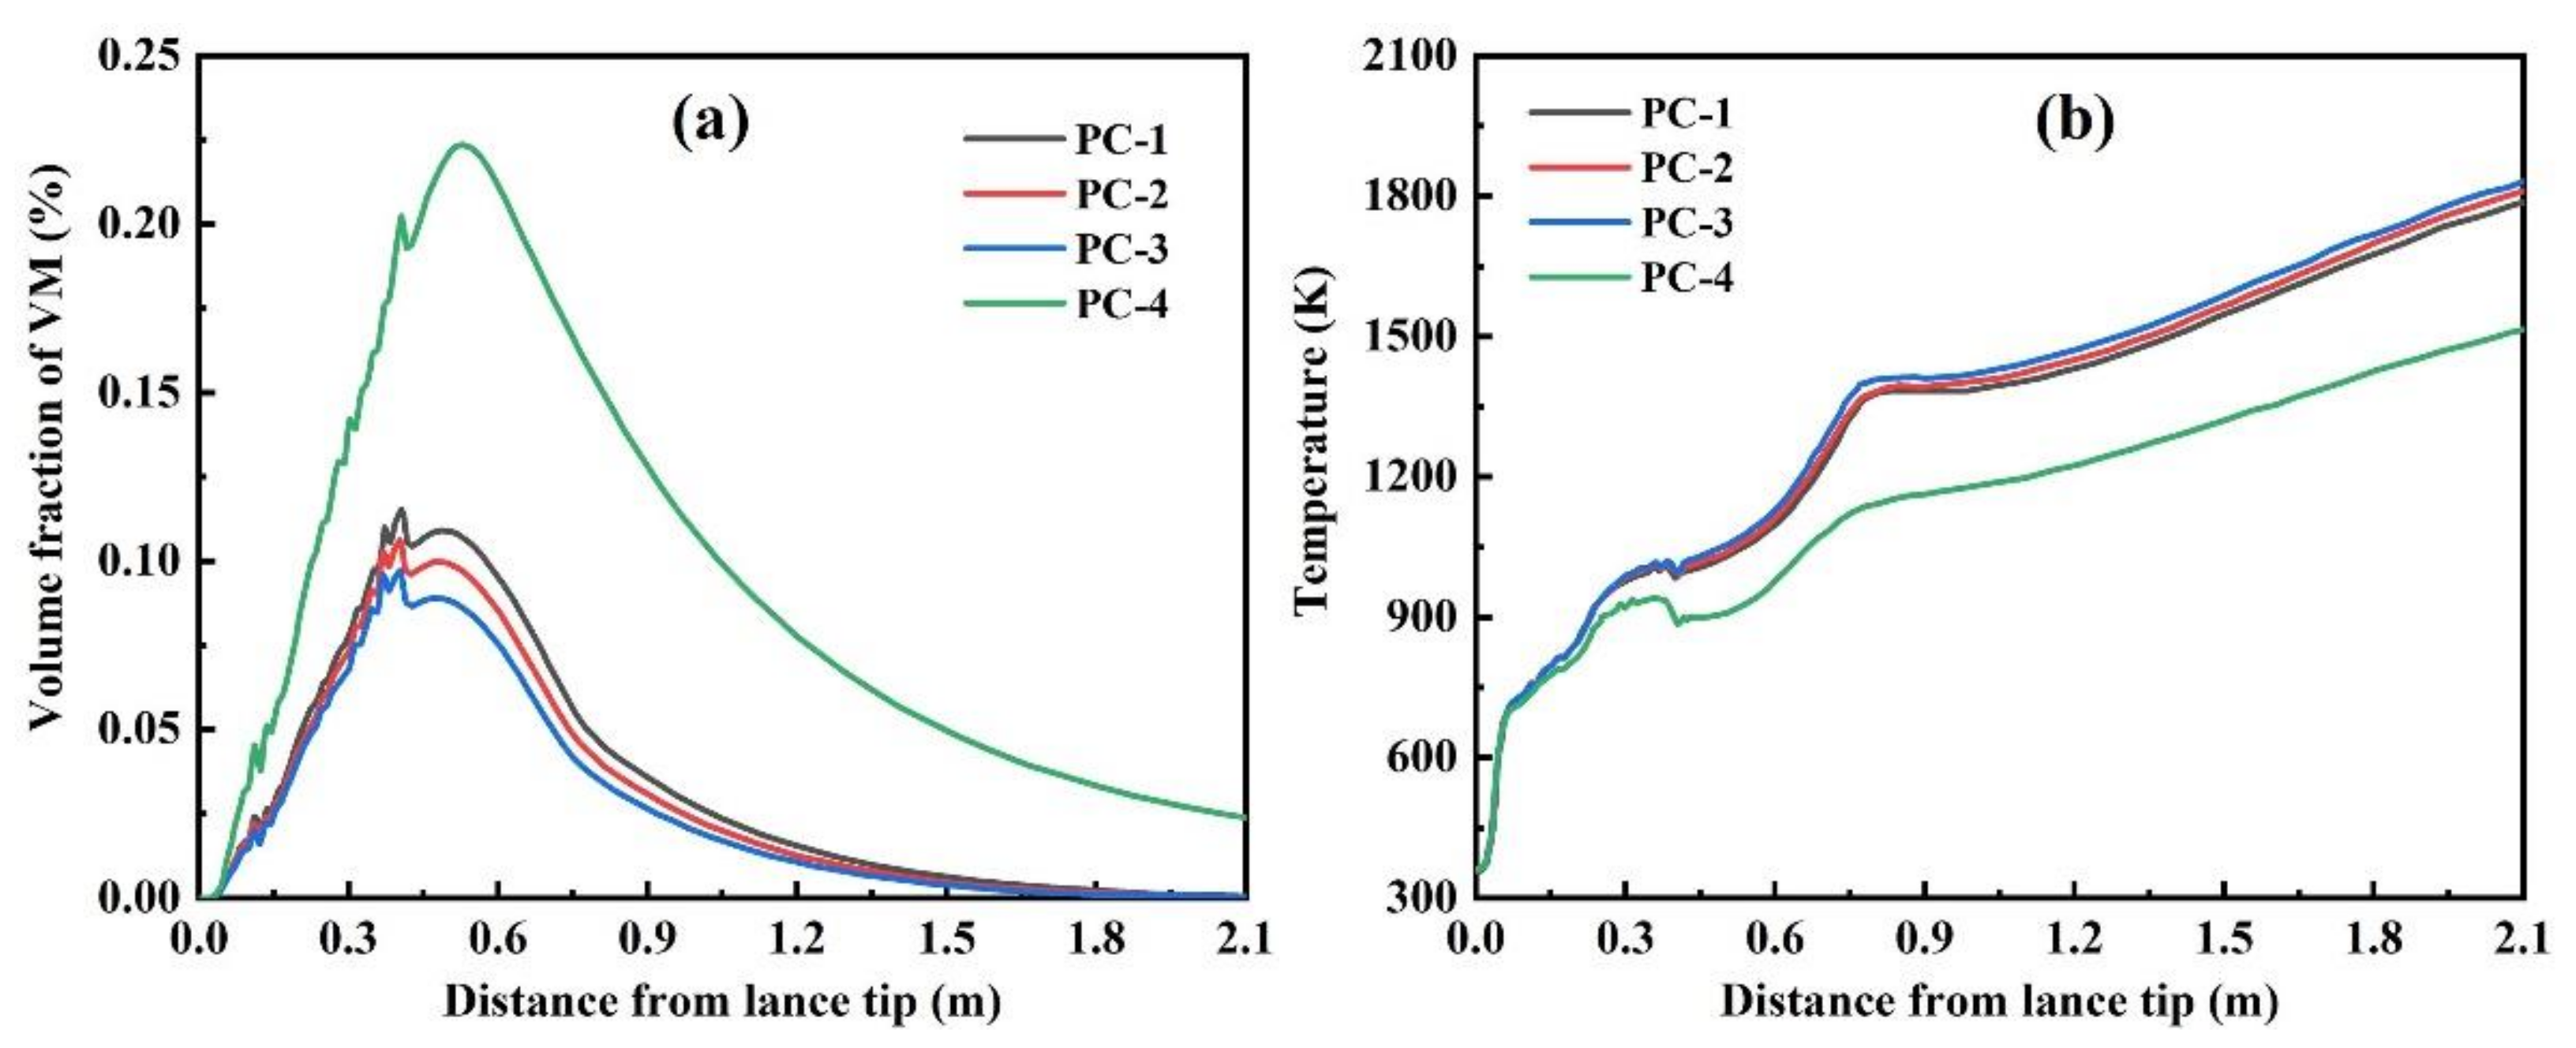
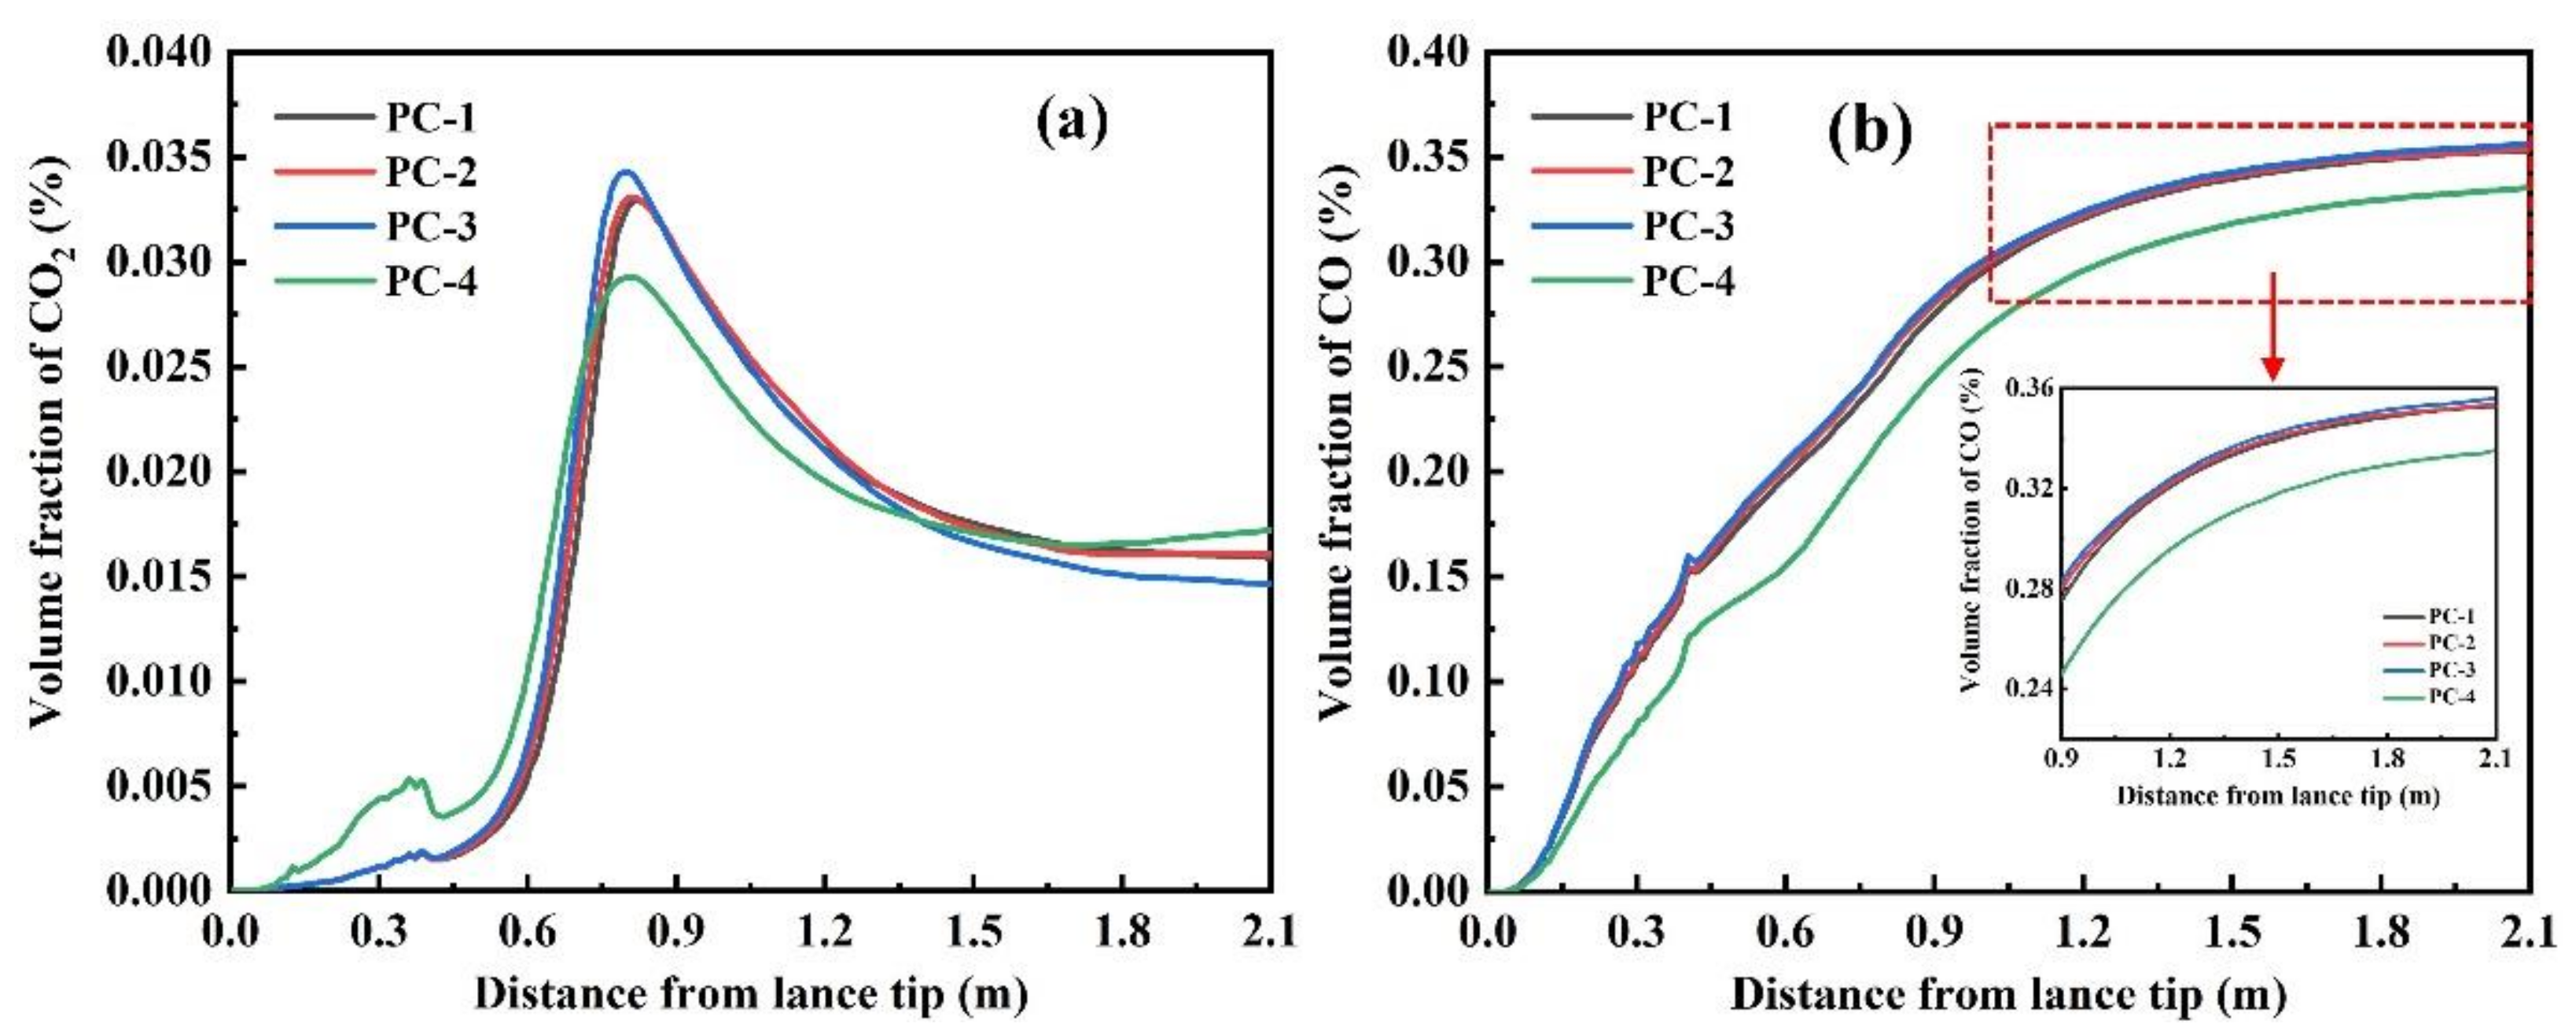
3.3. Effect of Semi-Coke Ratio

In this section, the effect of the ratio of semi-coke to coke powder on the tuyere raceway is explored, and the scheme is listed in Table 6. Among them, PC-1 to PC-3 are blended coals composed of 90% semi-coke + 10% coke powder, 80% semi-coke + 20% coke powder and 70% semi-coke + 30% coke powder, respectively. PC-4 is a bituminous coal commonly used in blast furnaces for comparison. It can be seen that with the increase of the semi-coke ratio, the content of fixed carbon in the blended coal increases gradually, while the content of volatiles decreases. As a comparison, bituminous coal has a VM content of 31.33%, which is about 20% higher than that of blended coal.
Figure 12 shows the variation trend of VM volume fraction and temperature along the tip of the coal lance with different ratios of semi-coke. With the decrease of semi-coke ratio in the blended coal, the VM content in the blended coal decreases, resulting in a decrease in the VM content precipitated at the tip of the coal lance. Obviously, due to the high VM content of bituminous coal (PC-4), the highest concentration of VM precipitated from bituminous coal reaches more than 20%. The compensation heat and O2 required for complete combustion of bituminous coal per unit mass are more than that of blended coal. Thus, the maximum allowable injection amount of bituminous coal is smaller than that of semi-coke under the same conditions, and the injection of the same flow of bituminous coal will lead to a decrease in the overall temperature of the raceway and a decrease in heat income. In fact, the injection of bituminous coal is more favorable for operation with high air temperature and high oxygen enrichment.
Due to the variation of the pulverized coal composition, the volume fraction of gas in the combustion zone also changes, as shown in Figure 13. When the blended coal is injected, the fixed carbon content and the overall temperature in the combustion zone are higher, which is conducive to the gasification reaction of the residual carbon. Hence, compared with bituminous coal (PC-4), blended coal (PC-1 to PC-3) has a lower CO concentration and a higher CO2 concentration. In addition, with the increase in the proportion of coke powder in the blended coal, the same rule is also presented. It should be noted that the CO concentration of bituminous coal (PC-4) is significantly lower. This is because the volatiles in bituminous coal contain a lot of H2, and the proportion of CO in the reducing gas is therefore reduced. On the other hand, the increase of the proportion of H2 enhances the reducibility of the generated gas, which is more conducive to the indirect reduction in the blast furnace.
Figure 14 shows the variation of pulverized coal burnout rate with different ratios of semi-coke. Bituminous coal has the characteristics of high VM content, low ignition point and flammability, so its burnout rate (about 70%) is significantly higher than that of blended coal. For the blended coal, with the increase of the proportion of coke powder, the burnout rate decreases. This indicates that although the calorific value of the blended coal increases, the combustion performance is poor, and it still cannot provide sufficient heat for the operation of the blast furnace. Therefore, it is necessary to control the blending ratio of coke powder. In practice, in addition to semi-coke and coke powder, bituminous coal can be appropriately added. On the one hand, it can improve the combustion performance of pulverized coal, and on the other hand, it can provide H2 with higher reduction efficiency, which is also in line with the current needs of hydrogen metallurgy.

4. Conclusions

In this work, a three-dimensional mathematical model of blast furnace injection of semi-coke was established to investigate the velocity, temperature, component concentration distribution and the combustion behavior of pulverized coal in the blowpipe-tuyere-combustion zone. The effect of the semi-coke ratio on the combustion behavior was discussed. The main findings can be summarized as:
(1)
During the blast furnace injection of semi-coke, the velocity in the central region of the combustion zone is lower than that in the edge region, but with the development of the combustion zone, the velocity distribution of the flow field tends to be uniform. The high temperature zone of the combustion zone is annularly distributed, and its radial distribution continues to expand with the extension of the depth of the combustion zone.
(2)
The highest concentrations of CO and H2 in the combustion zone reach 36% and 8%, respectively. The longest residence time of semi-coke particles in the combustion zone is 70 ms under the current simulation conditions.
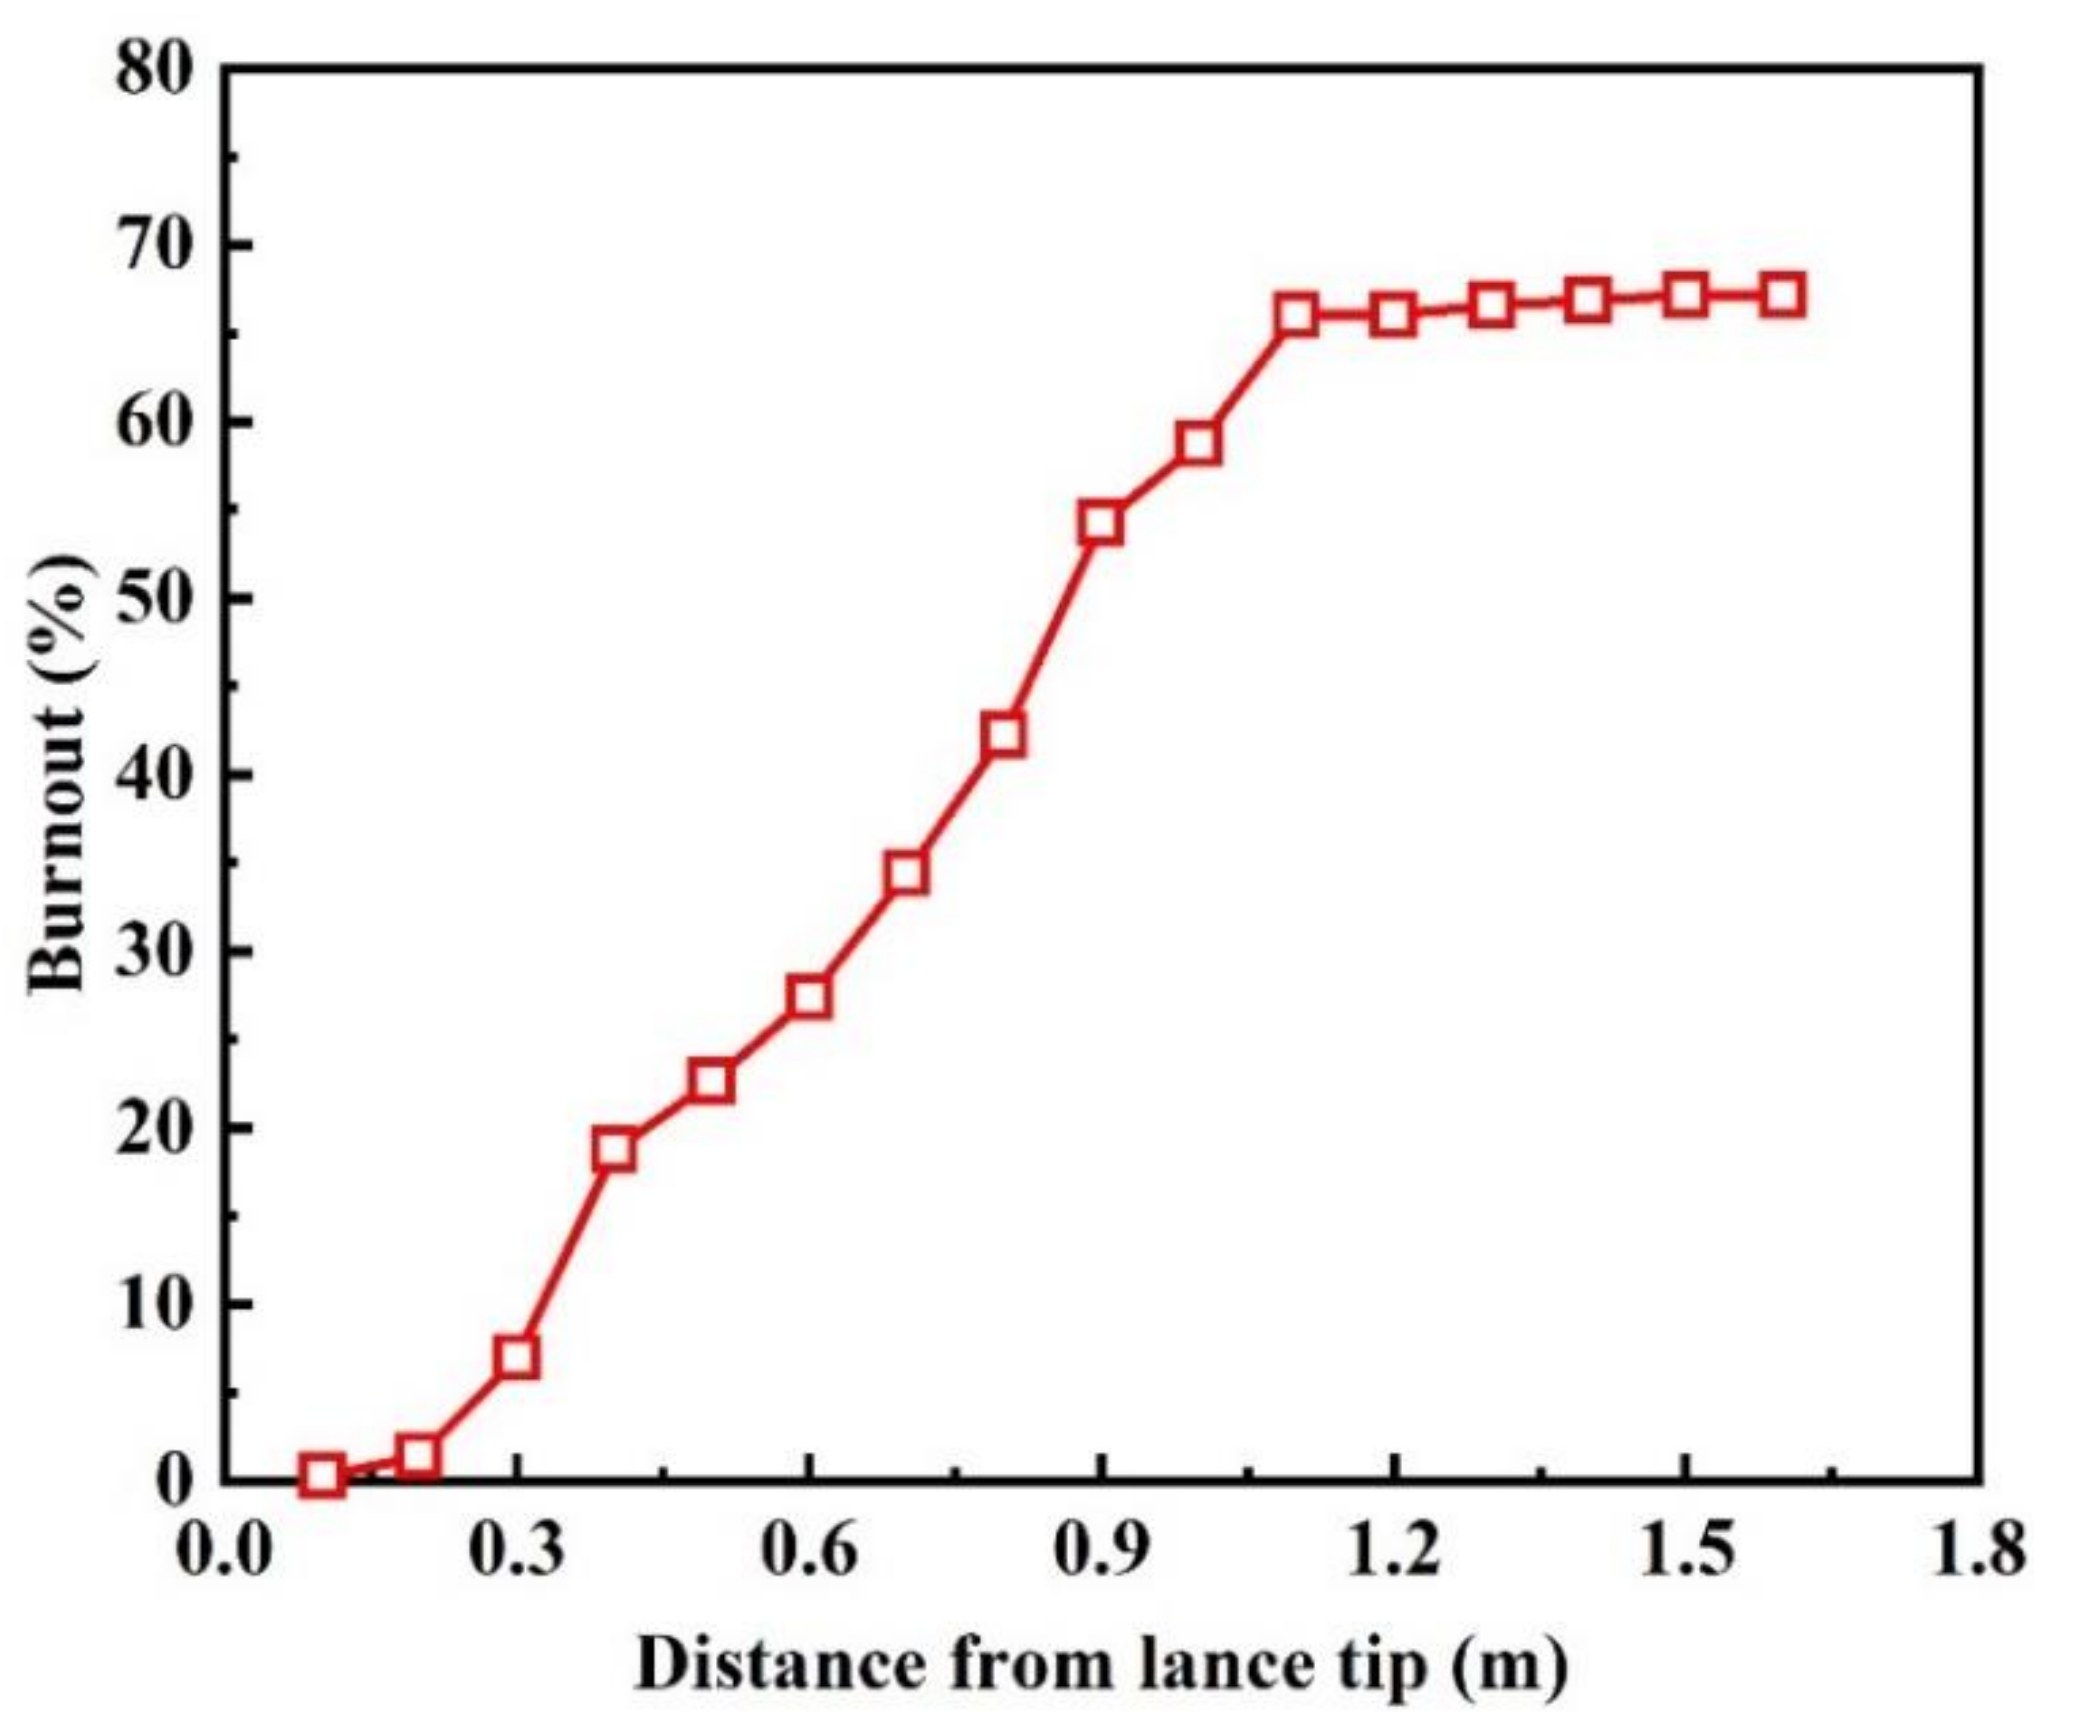
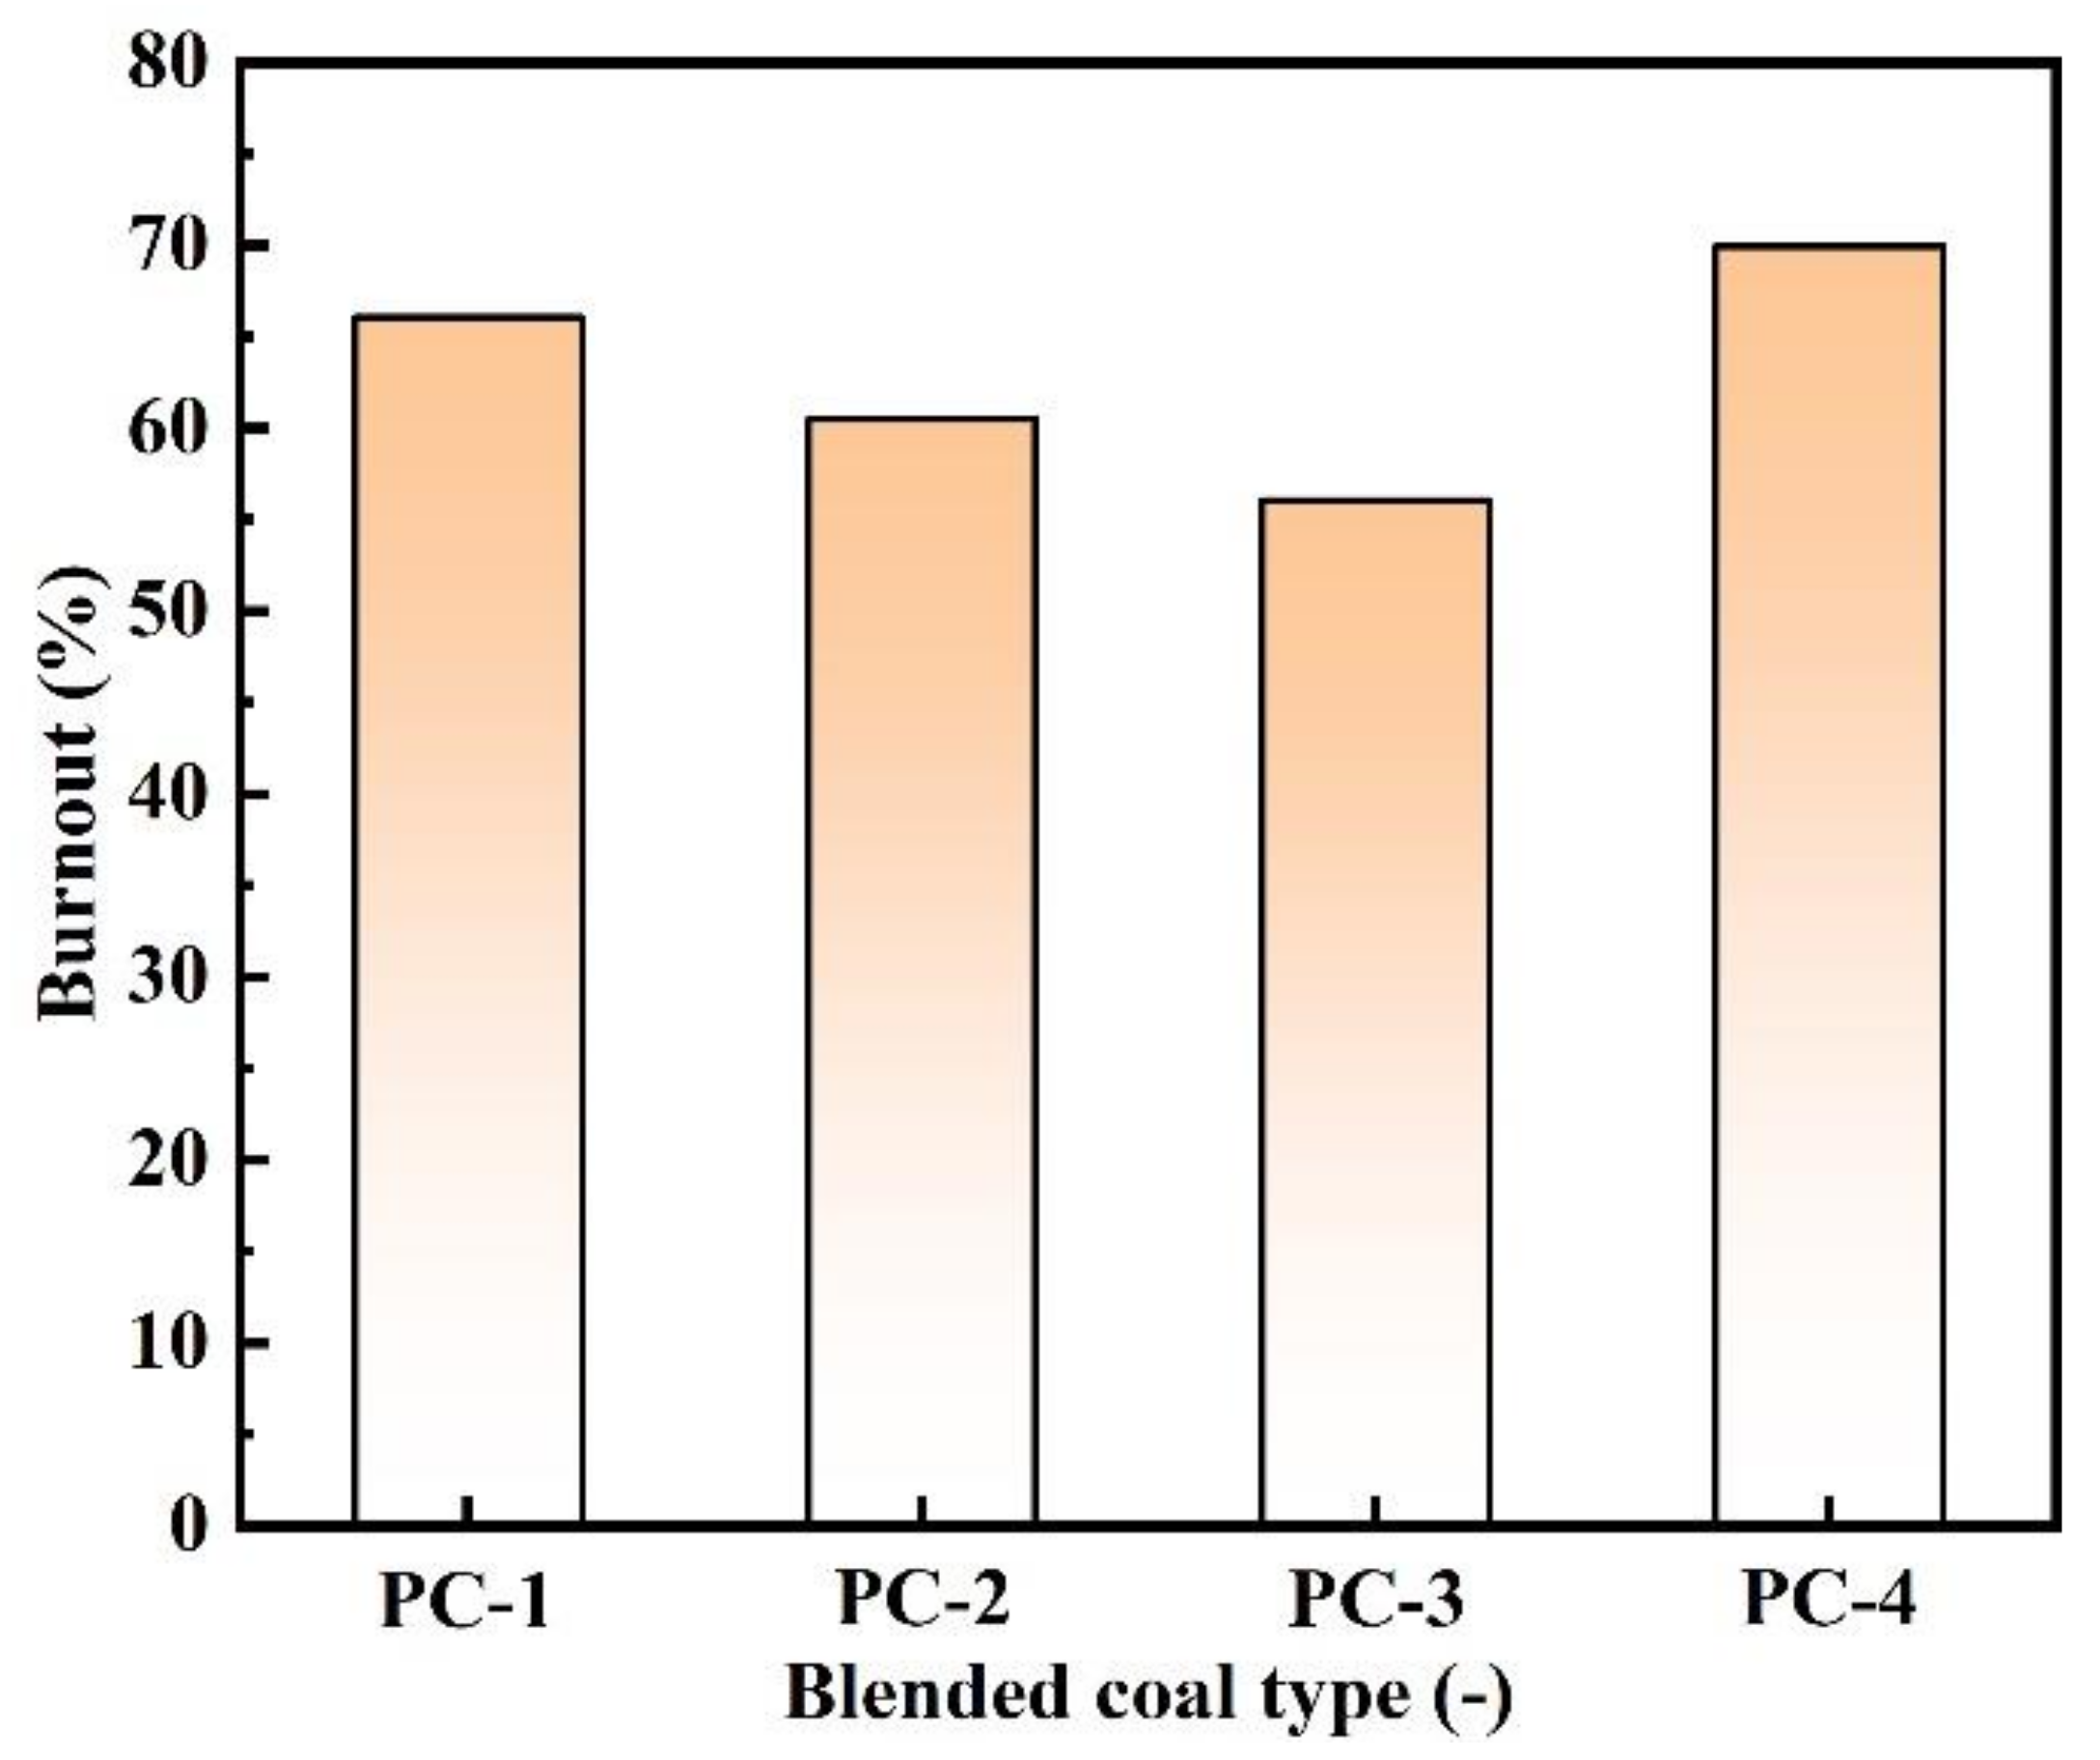
(3)
With the decrease of the semi-coke ratio in the blended coal, the fixed carbon content and the calorific value of the blended coal increase, but the burnout of the blended coal reduces. The burnout of bituminous coal is about 70%, which is significantly higher than that of blended coal. Therefore, an appropriate amount of bituminous coal can be added to improve the combustion performance of pulverized coal in actual production.

Author Contributions

Conceptualization, Y.Y. and Y.L.; methodology, Y.L.; investigation, Z.Z., R.W. and Q.H.; writing—original draft preparation, Y.Y. and Z.Z.; writing—review and editing, Z.Y.; funding acquisition, Y.L. All authors have read and agreed to the published version of the manuscript.

Funding

This research was supported by the Opening Project of Shanghai Key Laboratory of Integrated Administration Technologies for Information Security (AGK2020006), the Science and Technology Research Program of Chongqing Municipal Education Commission (Grant No. KJQN202000707), and the National Natural Science Foundation on China (Grant No. 52004046 and 62002036).

Data Availability Statement

Not applicable.

Conflicts of Interest

The authors declare no conflict of interest.

References

  1. Liu, Y.; Shen, Y. Modelling and optimisation of biomass injection in ironmaking blast furnaces. Prog. Energy Combust. Sci. 2021, 87, 100952. [Google Scholar] [CrossRef]
  2. Nielson, S.; Okosun, T.; Damstedt, B.; Jampani, M.; Zhou, C.Q. Tuyere-Level Syngas Injection in the Blast Furnace: A Computational Fluid Dynamics Investigation. Processes 2021, 9, 1447. [Google Scholar] [CrossRef]
  3. Peng, Z.; Zhang, J.; Bi, C.; Ning, X.; Tan, P.; Wang, G. Effect of coke powder and semi-coke on combustion characteristics of blast furnace blended coal. Iron Steel 2019, 54, 10–18. [Google Scholar]
  4. Chen, S.; Cheng, M.; Xu, J.; Liu, X.; Yu, D.; Xu, M. Numerical analysis on reduction of ultrafine particulate matter by a kaolin additive during pulverized coal combustion. Energy Fuels 2021, 35, 9538–9549. [Google Scholar] [CrossRef]
  5. He, J.; Zou, C.; Zhao, J.; Liang, D.; Xi, J.; Ma, C. Comparison of semi-coke with traditional pulverized coal injection and iron ore sintering fuels based on chemical structure and combustion behavior. J. Iron Steel Res. Int. 2022, 29, 725–740. [Google Scholar] [CrossRef]
  6. Li, T.; Wang, G.; Zhou, H.; Ning, X.; Zhang, C. Numerical Simulation Study on the Effects of Co-Injection of Pulverized Coal and Hydrochar into the Blast Furnace. Sustainability 2022, 14, 4407. [Google Scholar] [CrossRef]
  7. Tian, J.; Ni, H.; Han, Y.; Shen, Z.; Wang, Q.; Long, X.; Zhang, Y.; Cao, J. Primary PM2.5 and trace gas emissions from residential coal combustion: Assessing semi-coke briquette for emission reduction in the Beijing-Tianjin-Hebei region, China. Atmos. Environ. 2018, 191, 378–386. [Google Scholar] [CrossRef]
  8. Zou, C.; Ma, C.; Zhao, J.; Wen, L.; Bai, C. Research status and suggestion of mid-low temperature pyrolysis semi-coke as the PCI fuel in blast furnace. Clean Coal Technol. 2017, 23, 57–64. [Google Scholar]
  9. Li, J.; Li, X.J.; Li, B.P.; Song, C.Y.; Zhang, X.P.; Qin, X.W. Experimental analysis on use of semi-coke as fuel for blast furnace injection. China Metall. 2019, 29, 14–18. [Google Scholar]
  10. Bi, C.G.; Huang, C.C.; Ning, X.J.; Zhang, J.L.; Wang, G.W.; Peng, Z.F. Best ratio of semi-coke for blast furnace injection. Iron Steel 2020, 55, 25–32. [Google Scholar]
  11. Gong, L.W. Semi-coke coal injection practice in Taiyuan Steel’s BF. Ironmaking 2018, 37, 16–19. [Google Scholar]
  12. Du, G.; Yang, S. An investigation into coal blending and the addition of semi-coke. Iron Steel Vanadium Titan. 2013, 34, 64–68. [Google Scholar]
  13. Steer, J.; Greenslade, M.; Marsh, R. A Comparison of Laboratory Coal Testing with the Blast Furnace Process and Coal Injection. Metals 2021, 11, 1476. [Google Scholar] [CrossRef]
  14. Liu, L.; Kuang, S.; Jiao, L.; Guo, B.; Yu, A. Optimization of pulverized coal injection (PCI) rate in an ironmaking blast furnace by an integrated process model. Fuel 2022, 315, 122832. [Google Scholar] [CrossRef]
  15. Wang, Y.; Zou, C.; Zhao, J.; Wang, F. Combustion Characteristics of Coal for Pulverized Coal Injection (PCI) Blending with Steel Plant Flying Dust and Waste Oil Sludge. ACS Omega 2021, 6, 28548–28560. [Google Scholar] [CrossRef]
  16. Belošević, S.; Tomanović, I.; Crnomarković, N.; Milićević, A. Full-scale CFD investigation of gas-particle flow, interactions and combustion in tangentially fired pulverized coal furnace. Energy 2019, 179, 1036–1053. [Google Scholar] [CrossRef]
  17. Zhang, J.; Ito, T.; Ishii, H.; Ishihara, S.; Fujimori, T. Numerical investigation on ammonia co-firing in a pulverized coal combustion facility: Effect of ammonia co-firing ratio. Fuel 2020, 267, 117166. [Google Scholar] [CrossRef]
  18. Goto, K.; Murai, R.; Murao, A.; Sato, M.; Asanuma, M.; Ariyama, T. Massive combustion technology of solid fuel injected into blast furnace. In Proceedings of the International Blast Furnace Lower Zone Symposium, Wollongong, Australia, 25 November 2002. [Google Scholar]
  19. Du, S.-W.; Chen, W.-H. Numerical prediction and practical improvement of pulverized coal combustion in blast furnace. Int. Commun. Heat Mass Transf. 2006, 33, 327–334. [Google Scholar] [CrossRef]
  20. Du, S.-W.; Chen, W.-H.; Lucas, J. Performances of pulverized coal injection in blowpipe and tuyere at various operational conditions. Energy Convers. Manag. 2007, 48, 2069–2076. [Google Scholar] [CrossRef]
  21. Gu, M.; Chen, G.; Zhang, M.; Huang, D.; Chaubal, P.; Zhou, C.Q. Three-dimensional simulation of the pulverized coal combustion inside blast furnace tuyere. Appl. Math. Model. 2010, 34, 3536–3546. [Google Scholar] [CrossRef]
  22. Shen, Y.S.; Yu, A.B.; Austin, P.R.; Zulli, P. CFD study of in-furnace phenomena of pulverised coal injection in blast furnace: Effects of operating conditions. Powder Technol. 2012, 223, 27–38. [Google Scholar] [CrossRef]
  23. Shen, Y.S.; Yu, A.B. Modelling of injecting a ternary coal blend into a model ironmaking blast furnace. Miner. Eng. 2016, 90, 89–95. [Google Scholar] [CrossRef]
  24. Liu, Y.; Hu, Z.; Shen, Y. CFD Study of Hydrogen Injection in Blast Furnaces: Tuyere Co-injection of Hydrogen and Coal. Metall. Mater. Trans. B 2021, 52, 2971–2991. [Google Scholar] [CrossRef]
  25. Zhuo, Y.; Hu, Z.; Shen, Y. CFD study of hydrogen injection through tuyeres into ironmaking blast furnaces. Fuel 2021, 302, 120804. [Google Scholar] [CrossRef]
  26. Hu, Z.J.; Liu, Y.R.; Xu, H.; Zhu, J.M.; Wu, S.L.; Shen, Y.S. Co-combustion of semicoke and coal in an industry ironmaking blast furnace: Lab experiments, model study and plant tests. Fuel Process. Technol. 2019, 196, 106165. [Google Scholar] [CrossRef]
  27. Zhang, C.; Wang, G.; Ning, X.; Zhang, J.; Wang, C. Numerical simulation of combustion behaviors of hydrochar derived from low-rank coal in the raceway of blast furnace. Fuel 2020, 278, 118267. [Google Scholar] [CrossRef]
  28. Muto, M.; Yuasa, K.; Kurose, R. Numerical simulation of soot formation in pulverized coal combustion with detailed chemical reaction mechanism. Adv. Powder Technol. 2018, 29, 1119–1127. [Google Scholar] [CrossRef]
  29. Shen, Y.; Guo, B.; Yu, A.; Maldonado, D.; Austin, P.; Zulli, P. Three-dimensional modelling of coal combustion in blast furnace. ISIJ Int. 2008, 48, 777–786. [Google Scholar] [CrossRef] [Green Version]
Figure 1. Geometric model (a) and mesh (b) of the blowpipe-tuyere-combustion zone in the simulation.
Metals 12 01272 g001
Figure 2. Model validation of the simulation results with the experimental results data from [29].
Metals 12 01272 g002
Figure 3. Velocity distribution in the blowpipe-tuyere-combustion zone.
Metals 12 01272 g003
Figure 4. Velocity distribution on the cross sections A (a) and B (b) of the combustion zone.
Metals 12 01272 g004
Figure 5. Temperature distribution in the blowpipe-tuyere-combustion zone.
Metals 12 01272 g005
Figure 6. Temperature distribution on the cross sections A (a) and B (b) of the combustion zone.
Metals 12 01272 g006
Figure 7. Mass fraction distributions of the VM (a) and O2 (b).
Metals 12 01272 g007
Figure 8. Gas composition distributions in blowpipe-tuyere-combustion zone: (a) CO, (b) CO2, (c) H2 and (d) H2O.
Metals 12 01272 g008
Figure 9. Gas distribution in the direction of the coal lance tip.
Metals 12 01272 g009
Figure 10. Velocity (a), temperature (b) and residual time (c) distribution of pulverized coal particles.
Metals 12 01272 g010
Figure 11. Evolution of pulverized coal burnout rate along the coal lance tip.
Metals 12 01272 g011
Figure 12. Variation trend of VM volume fraction (a) and temperature (b) along the tip of the coal lance with different ratios of semi-coke.
Metals 12 01272 g012
Figure 13. Variation trends of CO2 (a) and CO (b) concentrations along the tip of the coal lance with different ratios of semi-coke.
Metals 12 01272 g013
Figure 14. Variation of pulverized coal burnout with different ratios of semi-coke.
Metals 12 01272 g014
Table 1. Governing equations of gas phase in the model.
Mass conservation ρ U = n p m ˙
Momentum conservation ( ρ U U ) ( ( μ + μ t ) ( U + ( U ) T ) ) = ( p + 2 3 ρ τ ) + n p f D
Energy conservation ( ρ U H ( λ C p + μ t σ H ) H ) = n p q
Turbulent kinetic energy ( ρ U k ( μ + μ t σ k ) k ) = ( P k ρ ε )
Turbulent dissipation rate ( ρ U ε ( μ + μ t σ k ) ε ) = ε k ( C 1 P k C 2 ρ ε )
Gas mass fraction ( ρ U Y i ( Γ i + μ t σ Y i ) Y i ) = W i
μ t = C μ ρ k 2 ε ;   P k = ( μ + μ t ) U ( U + ( U ) T ) ;   i = O 2 , C O , C O 2 , H 2 , H 2 O
Table 2. Governing equations of particle phase in the model.
Mass d m p d t = m ˙
Momentum m p d U p d t = f D = 1 8 π d p 2 ρ C D U U p ( U U p )
C D = max ( 24 ( 1 + 0.15 Re 0.687 ) / Re , 0.44 )
Energy m p C p d T p d t = q = π d p λ N u ( T g T p ) + d m p d t H r e a c + A p ε p ( π I σ B T p 4 )
Table 3. Kinetic parameters of heterogeneous chemical reactions.
Heterogeneous Chemical Reactions A r / kg · m 2 · Pa N · s 1 β Er/(J/kmol)
C(s) + 0.5O2 → CO1.36 × 1060.681.30 × 108
C(s) +CO2 → 2CO6.78 × 1040.731.63 × 108
C(s) + H2O → CO + H28.55 × 1040.841.40 × 108
Table 4. Industrial and elemental analysis of fuels.
ParametersSemi-CokeCoke Powder
Fixed carbon75.0684.11
Ash11.6514.62
Volatile13.291.27
C85.8397.83
H2.950.25
O10.440.33
N0.781.59
Table 5. Operational parameters adopted in the simulations.
Operational ParametersValue
Blast flow rate (Nm3/h)7110.67
Blast temperature (K)1463
Coal injection rate (kg/h)0.5707
Pulverized coal temperature (K)360
Conveying gas (N2) volume flux (Nm3/h)2750
Conveying gas (N2) temperature (K)326
Oxygen enrichment ratio (%)3.96
Iron production per day (t)10,436.7
Table 6. Composition of blended coal under different simulation conditions.
Blend CoalIndustrial AnalysisElemental Analysis
Fixed CarbonAshVMCHON
PC-175.9711.9512.0987.032.689.430.86
PC-276.8712.2410.8988.232.418.420.94
PC-377.7812.549.6889.432.147.411.02
PC-463.015.6631.3381.314.0513.351.29
Publisher’s Note: MDPI stays neutral with regard to jurisdictional claims in published maps and institutional affiliations.

