Article

Reliability Analysis of the Welded Bellows for Mechanical Seals Based on Six Sigma

College of Mechanical and Electronic Engineering, Nanjing Forestry University, Nanjing 210037, China
*
Author to whom correspondence should be addressed.
Metals 2022, 12(7), 1073; https://doi.org/10.3390/met12071073
Submission received: 20 May 2022 / Revised: 10 June 2022 / Accepted: 20 June 2022 / Published: 23 June 2022
(This article belongs to the Section Metal Failure Analysis)

Abstract

:
This paper investigates the reliability of welded metal bellows used in mechanical seals under specified working conditions. Firstly, considering the working environment of mechanical seals and the structural characteristics of welded metal bellows, a stress relaxation test bench was developed to obtain projectile loss data of welded metal bellows under different compression loads at elevated temperatures. The creep constants for a stress relaxation simulation were derived from the experimental data, and a stress relaxation finite element analysis (FEA) of the bellows was conducted using Workbench under different compression loads. We found that the stress relaxation simulation of welded metal bellows can accurately simulate the relaxation characteristics of welded metal bellows. The reliability of the welded metal bellows was calculated using Six Sigma response surface reliability by taking the material properties and compression load as variable parameters and the residual elasticity of the bellows as the objective function. We concluded that the reliability calculation method of welded metal bellows promotes reliability research into welded metal bellows for mechanical seals.

1. Introduction

Welded metal bellows are elastic elements that are widely used in mechanical seals. Stress relaxation is the main failure mode of welded metal bellows, which often occurs after long-term use [1,2]. Due to stress relaxation, the failure of the elastic properties of welded metal bellows affects the normal operation of the entire system, so the study of their reliability is important for diverse engineering applications.
At present, there are few studies on the stress relaxation of welded metal bellows. Studying the stress relaxation of springs helps us to evaluate the stress relaxation of welded metal bellows. In the recent past, several studies have been reported by researchers that investigate the stress relaxation and associated failure of metal bellows. For instance, Simon P.A. et al. [3] investigated the stress relaxation performance of the spiral springs of three different materials and evaluated that the stress relaxation of springs at 600 to 700 °C drops at a rate of 1–3 grades faster than predicted by the compression creep data under the action of an equivalent tensile load. Jia et al. [4] studied the AISI 304 stainless steel spring stress relaxation process and the change of microstructure under different temperatures and loading conditions. The research results showed that at a low temperature and under a light load, the dismount austenite phase transformation stress relaxation is the main cause of the formation. Del [5] designed a fatigue testing machine to study springs under different conditions and determine the S–N curves. Through the testing machine, different parameters were investigated, for example, the influence of the cyclic load on the stress elimination of compression springs, the residual stress on the internal and external coils of springs, and the effect of heat treatment on stress relaxation.
The stress relaxation test is performed with specialized equipment and under tight environmental conditions, which make this test costly. At present, the use of numerical simulation methods to explore the law of stress relaxation of materials is receiving increased attention.
Xin [6] conducted stress relaxation tests on spiral compression springs at 90 °C, 110 °C, 130 °C, and 150 °C for 30 h. The creep constitutive relations were established and modified according to the test data. The constitutive relations and material parameters of the spiral compression springs were substituted into finite elements for the stress relaxation analysis. The results showed that the finite element model can effectively predict the whole relaxation process, and that the spring relaxation process occurs from inside to outside. Schedin [7] used finite element methods to simulate the stress relaxation behavior of joints. The study used stress relaxation test data by applying a power-law form of creep expression and simulated stress relaxation behavior by setting up the stress fields linearly, along with sheet thickness. The simulation results agree well with the experimental results.
It is important to highlight that the reliability analysis of bellows using stress relaxation data is still deficient. The existing reliability analysis methods for non-welded metal bellows under failure conditions can provide a certain reference for stress relaxation studies. For example, Zeng [8] used the ABAQUS finite element software to perform a numerical simulation of EPMB metal bellows. In the study, a metal corrugated pipe was studied to predict the limit bending stress distribution. In addition, the bending test of the metal corrugated pipe, repeated bending fatigue test, and the influence of the structural parameters of the waveform were verified. Cao et al. [9] obtained the local strain amplitude value of U-shaped bellows under specified failure loads through an ANSYS finite element analysis. The study predicted the life of bellows using the relationship curve between strain and life, and the mean and standard deviations of the logarithm fatigue life of bellows were obtained by using the first-order Taylor expansion formula. Xie et al. [10] defined the limit state function by applying the stress intensity interference theory to determine the statistical randomness that commonly exists in different parameters, such as the size, material, and load of metal bellows. The study used the PDS module in ANSYS to analyze the strength reliability of bellows through the Monte Carlo probability sampling method.
According to the above literature, most bellow reliability studies today are analyzed from the aspects of fatigue life and structural strength, and the finite element method is used unilaterally to analyze and solve the reliability. The results of such studies are not supported by test data, and the accuracy is poor. In view of the above problems, based on the literature discussed above, this paper studied the reliability of welded metal bellows by experimental testing and numerical simulation. A stress relaxation test rig for welded metal bellows was built to simulate the environment of the mechanical seal of welded metal bellows under a high-temperature medium, and the residual elastic data of the welded metal bellows under different compression amounts were obtained at 250 °C medium environments. According to the test data, the creep parameters needed for the finite element analysis of welded metal bellows were obtained. Finally, the reliability of the welded metal bellows was solved using the Six Sigma analysis module. The Six Sigma method can analyze various material parameters, structural parameters, and working conditions of welded metal bellows, and the obtained reliability is more convincing.

2. The Theory of Process

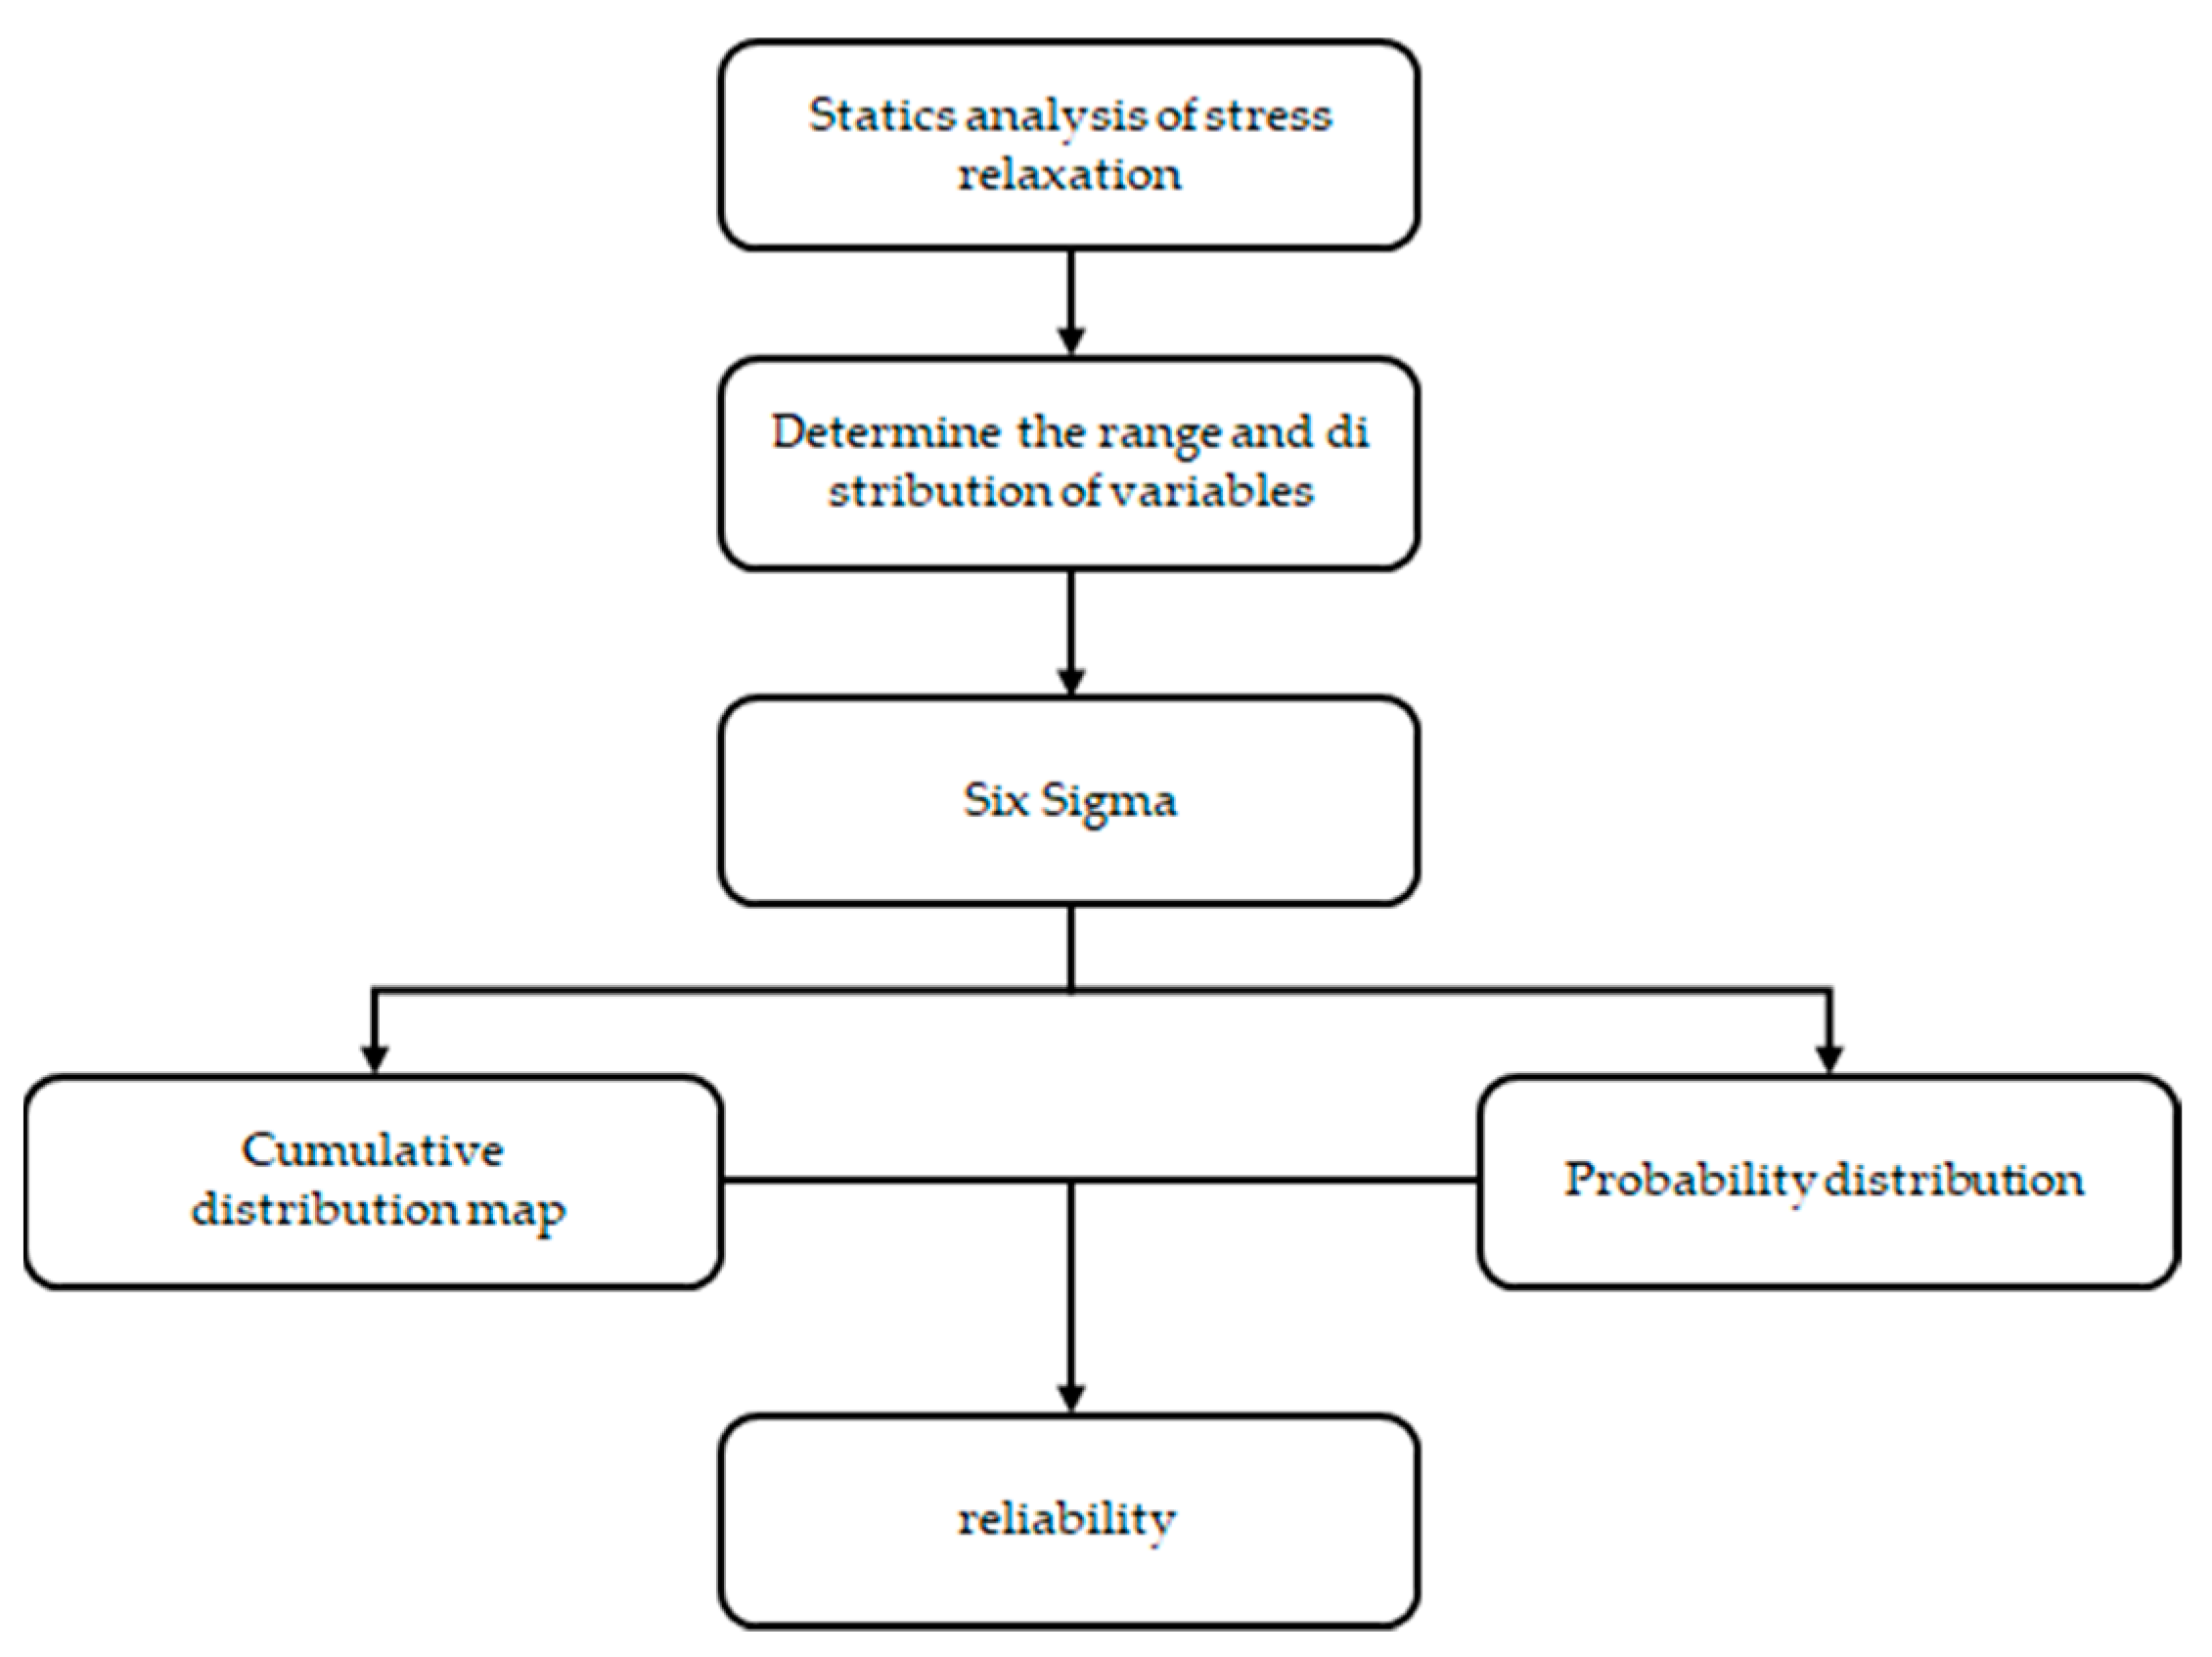
This paper proposes a method for solving the reliability of welded metal bellows. The research workflow diagram adopted in this research is shown in Figure 1.

2.1. Stress Relaxation Test for Welded Metal Bellows

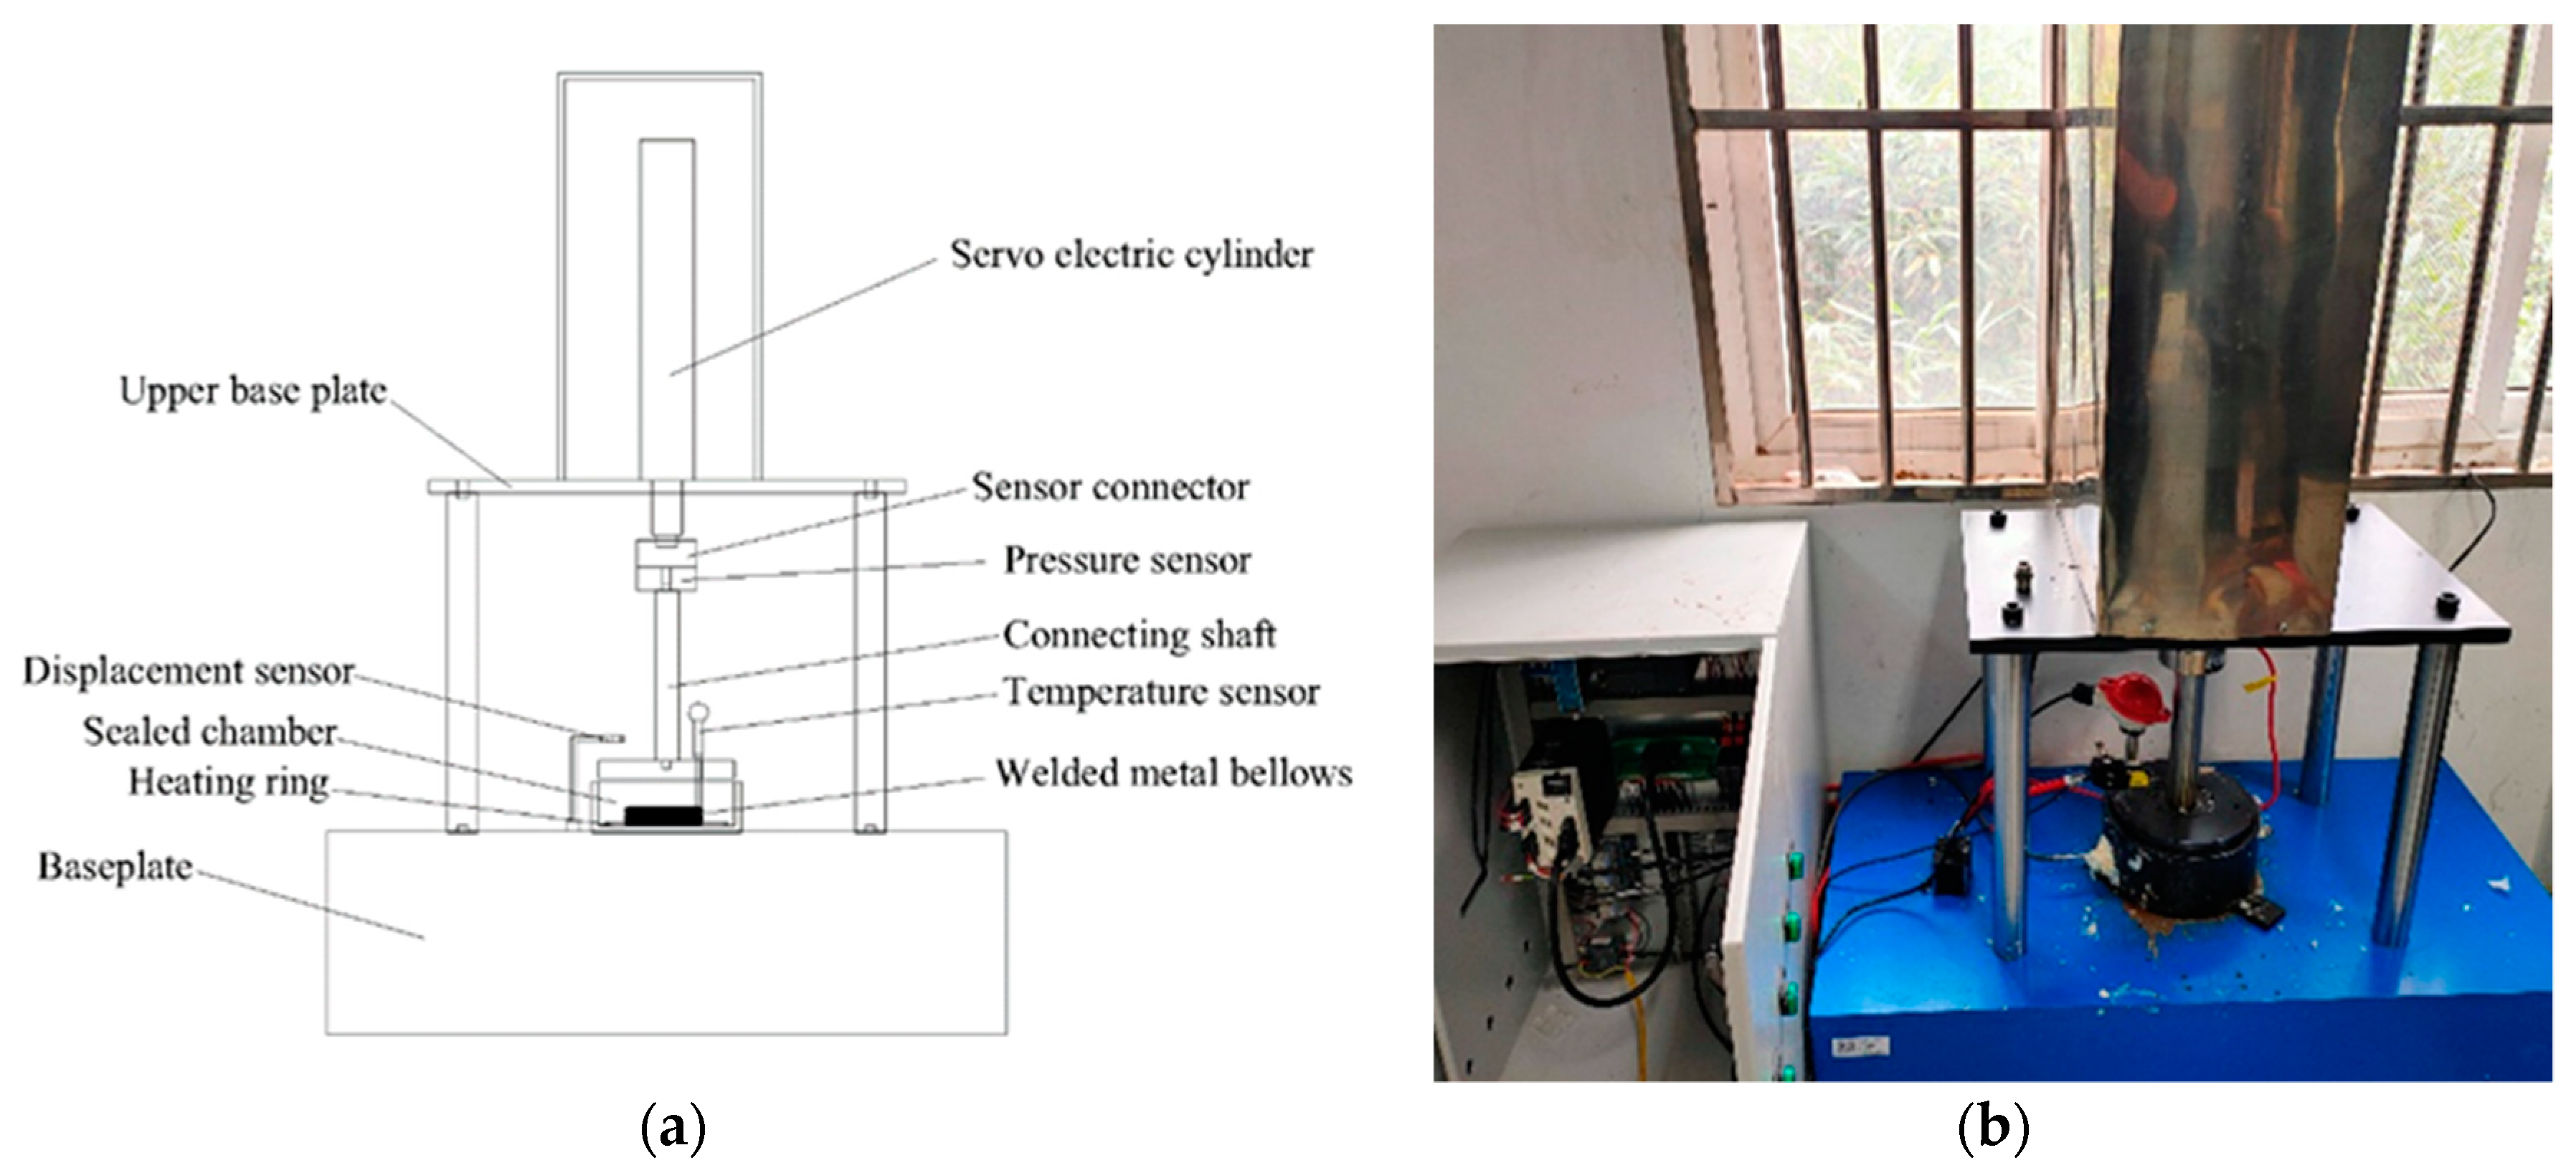
For the stress test, the bellows were placed in a high-temperature box, but the influence of the medium on the relaxation performance of the bellows was not considered. In this research, a stress relaxation test system for welded metal bellows was built considering the defects of the traditional test bench [11]. Figure 2a is a schematic diagram test rig. Figure 2b shows the physical stress relaxation test rig.
The bellows were loaded with different compression loads to observe the elastic changes under different loads in a constant-temperature environment. During the stress relaxation test of the welded metal bellows, the press plate made slight contact with the bellows, and the pressure sensor showed 10 N. Then, the heated phenyl silicone oil was used after reaching the test temperature to attain the actual temperature of the bellows, which was consistent with the temperature in the high-temperature medium chamber. Next, the positioning shift loading was started, and the stress relaxation test of the welded metal bellows was initiated and maintained for 16 h. Finally, elastic relaxation curves under different initial displacement loads were obtained.

2.2. Finite Element Analysis of Stress Relaxation of Welded Metal Bellows

The creep constant of the welded metal bellows was obtained by combining the test data with the derivation of the elastic-loss formula of two different kinds of welded metal bellows [12,13], which are typically used for stress relaxation finite element analysis. The creep analysis module in ANSYS Workbench was used to conduct the FEA of the stress relaxation of the welded metal bellows, and the test data were compared with the simulation outcomes to verify the correctness of the simplified stress relaxation model of the welded metal bellows.

2.3. Reliability Calculation of Welded Metal Bellows

The Six Sigma analysis module in Workbench was used for statistical analysis to predict the influence of uncertain factors. The performance of the factors was predicted by introducing a probability model at the initial stage of design, controlling the influence of random variables on product quality by using the probability analysis method, and obtaining the reliability under various dependent variables through system self-calculation. For example, Pan [14] used Six Sigma to solve the reliability of high-speed spring collet by taking the structural parameters of a high-speed spring collet as variables and the deformation as the objective function. This paper proposes a method for calculating the reliability of welded metal bellows considering the Six Sigma analysis module. A flow chart of the Six Sigma module is shown in Figure 3.
Before using the Six Sigma analysis module, a set of stress relaxation finite element analyses must be carried out first; then, the range, distribution form, and sampling must be performed. Finally, the probability density diagram and the cumulative distribution diagram can be solved using the Six Sigma module to solve the reliability of the welded metal bellows.

3. Concrete Case Calculation

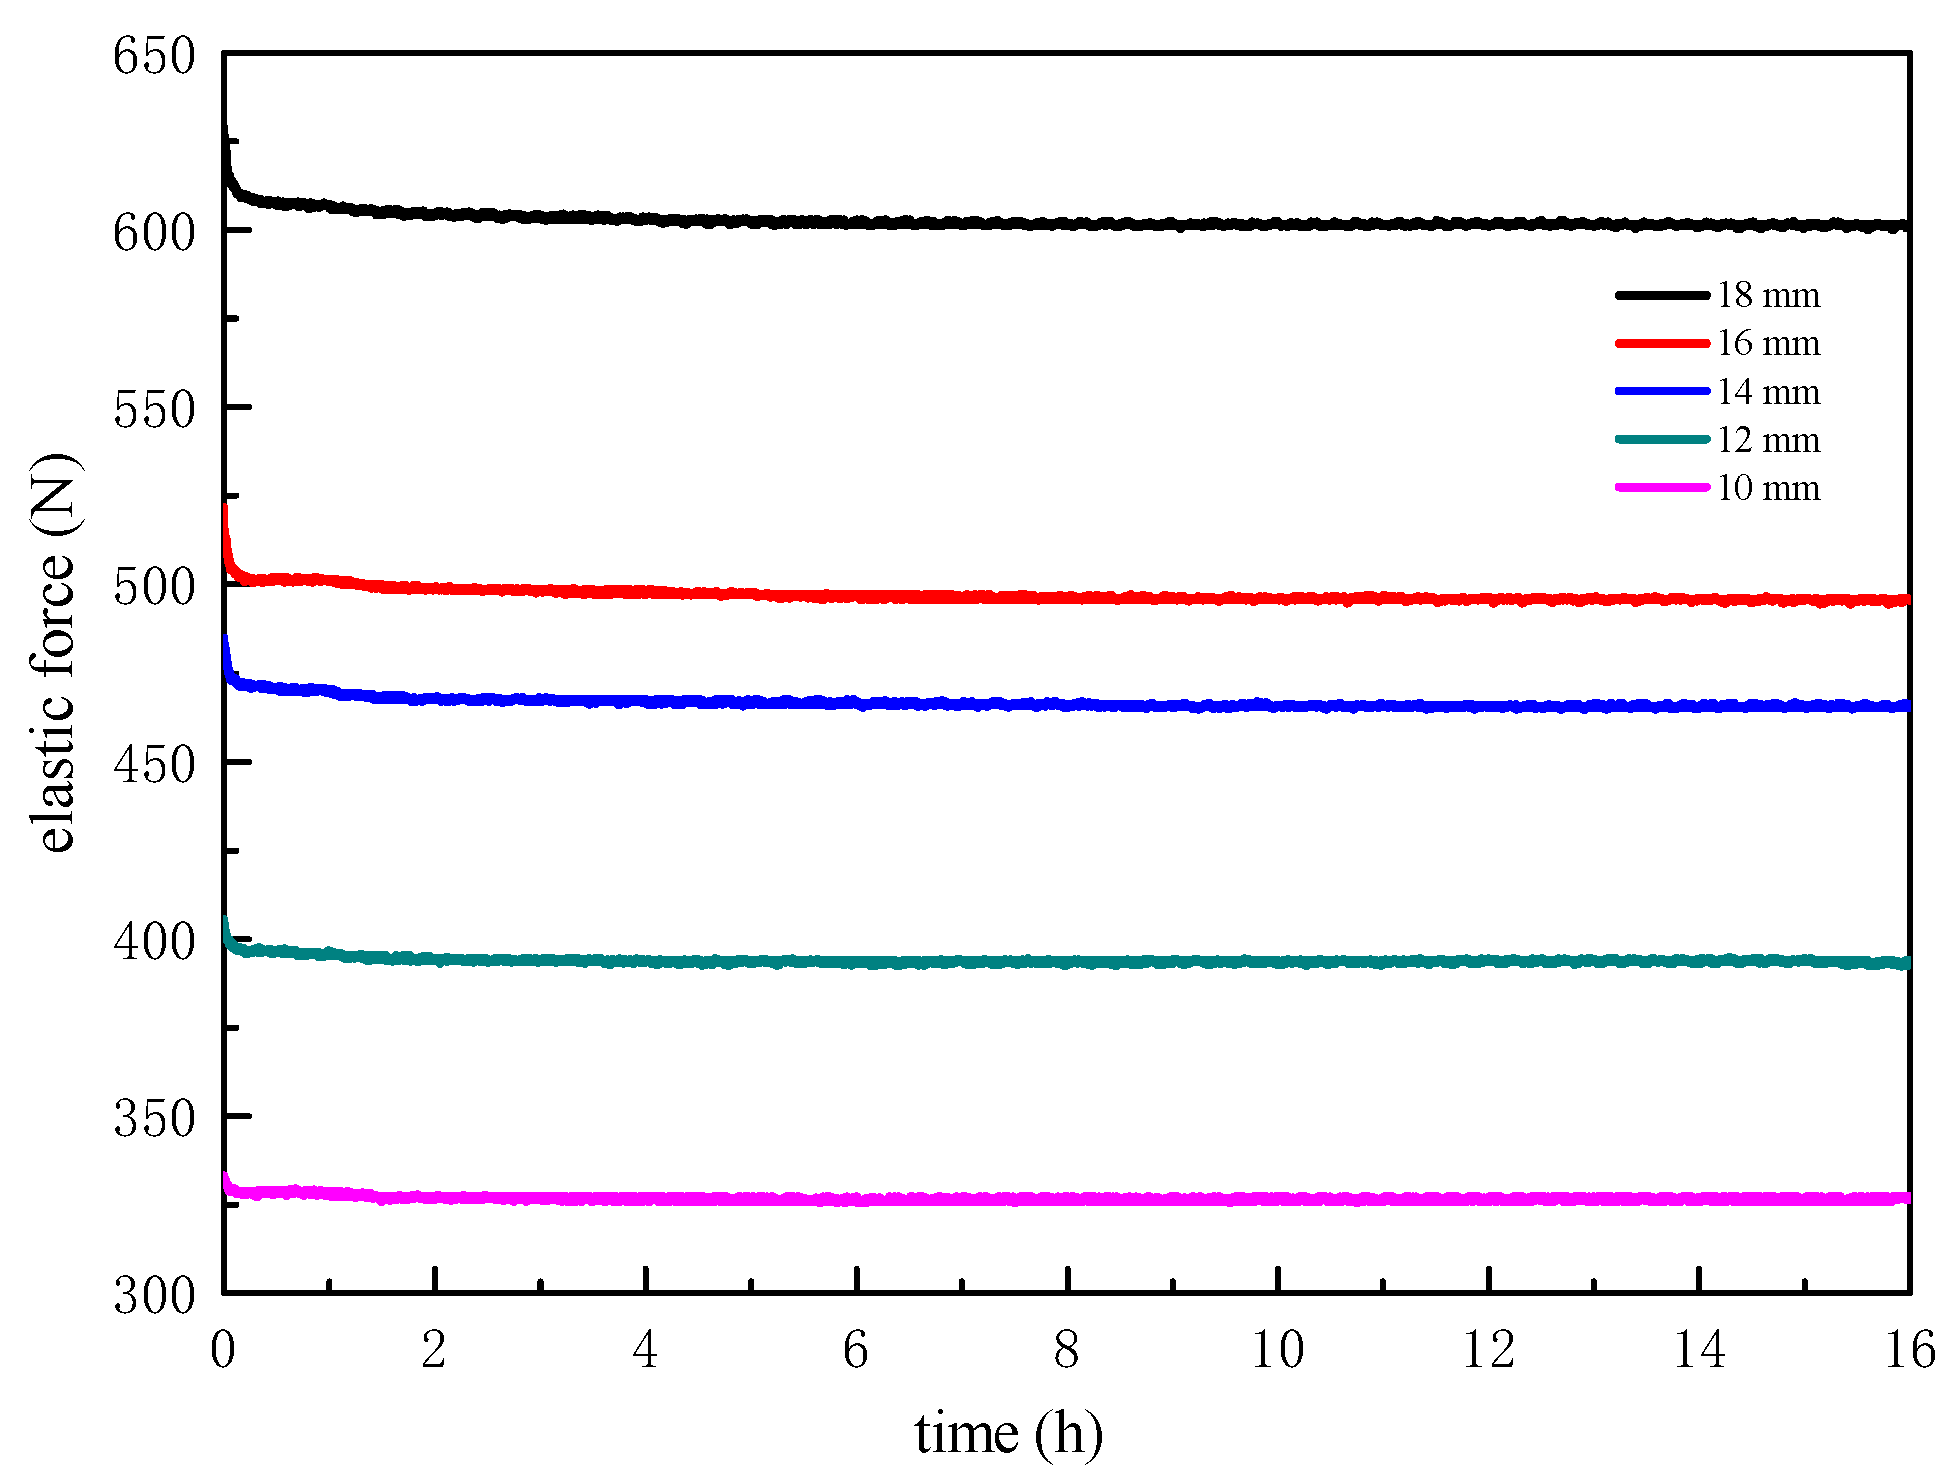
The test material was S-type welded metal bellows. The initial displacement loads of 10 mm, 12 mm, 14 mm, 16 mm, and 18 mm were applied to the welded metal bellows at 250 degrees Celsius. The initial elastic force measured under five different compression loads is shown in Figure 4, and the change of elastic force with loading time is shown in Figure 5.
According to the stress relaxation theory, stress relaxation has two stages. In the first stage of stress relaxation, the elastic force decreases rapidly over time. In the second stage, the relaxation rate becomes slow and has a steady trend. According to Figure 5, the elastic force of welded metal bellows decreases rapidly in the first 2 h and then slows down.
The stress relaxation curve used in this paper is similar to the generalized Aileen model [15]. By fitting the generalized Aileen formula y = y 0 + ke x / t with the test data, where y0 represents the limit value of the function and k and t are constants, the regression equation of the stress relaxation curve under the generalized Aileen model can be obtained. Table 1 lists the important parameters.
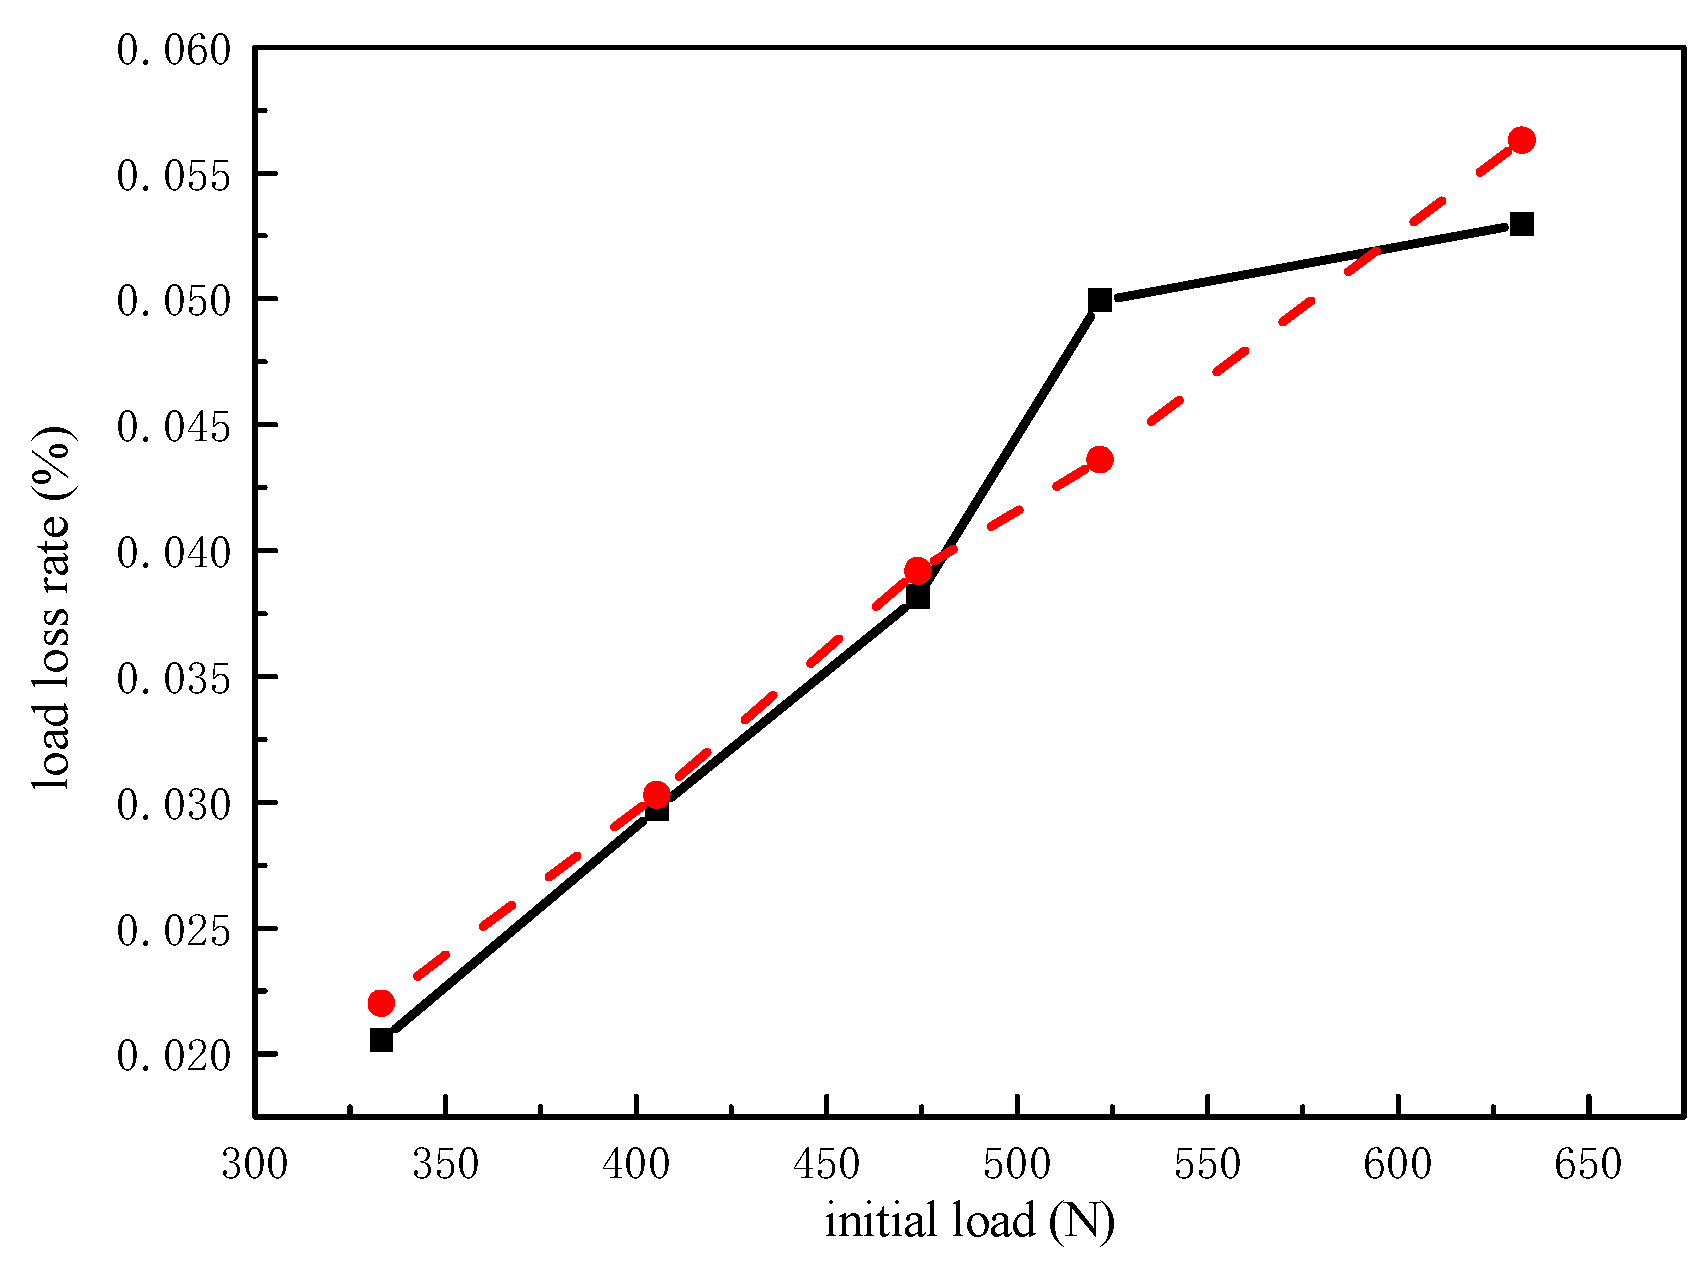
The load loss is the difference between the current value of the spring force and the initial spring force. From Table 1, it can be seen that as the initial compression displacement load of welded metal bellows increases, the load variation of welded metal bellows also increases. By comparing the load loss rate with the initial load, it can be seen that as the initial load increases, the load loss rate also increases. Figure 6 shows this relationship.
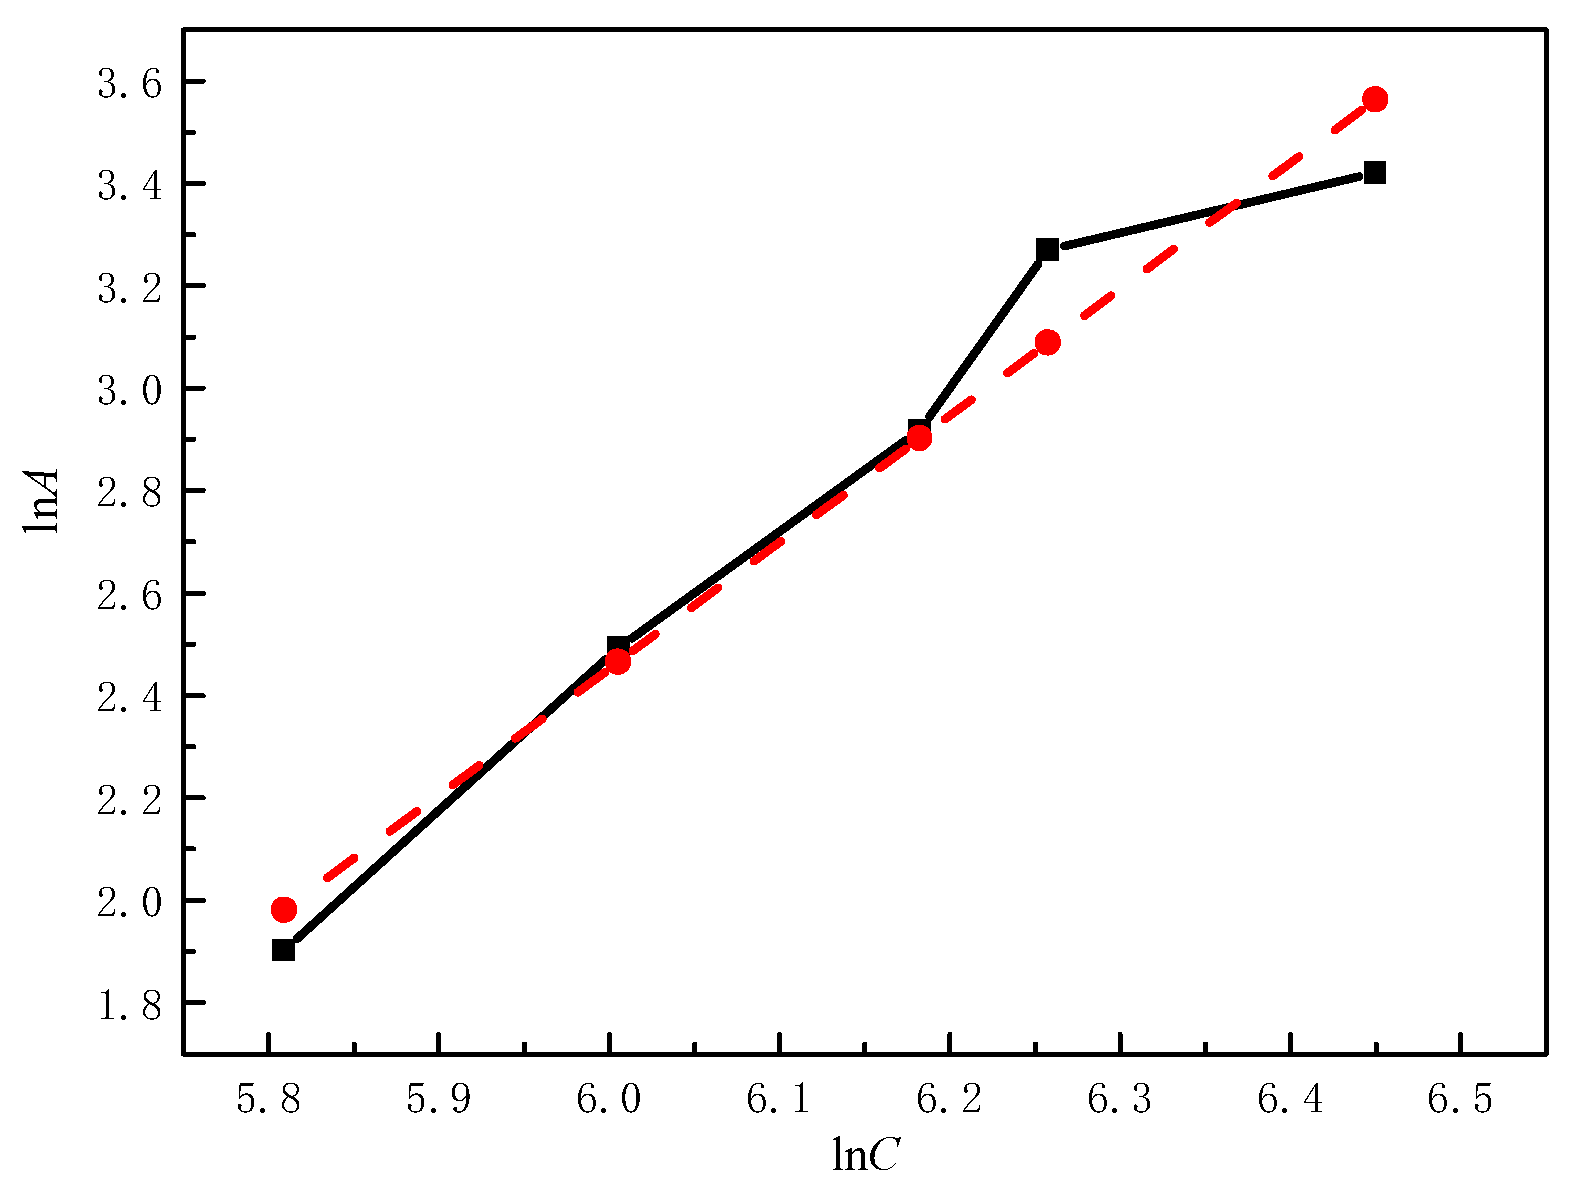
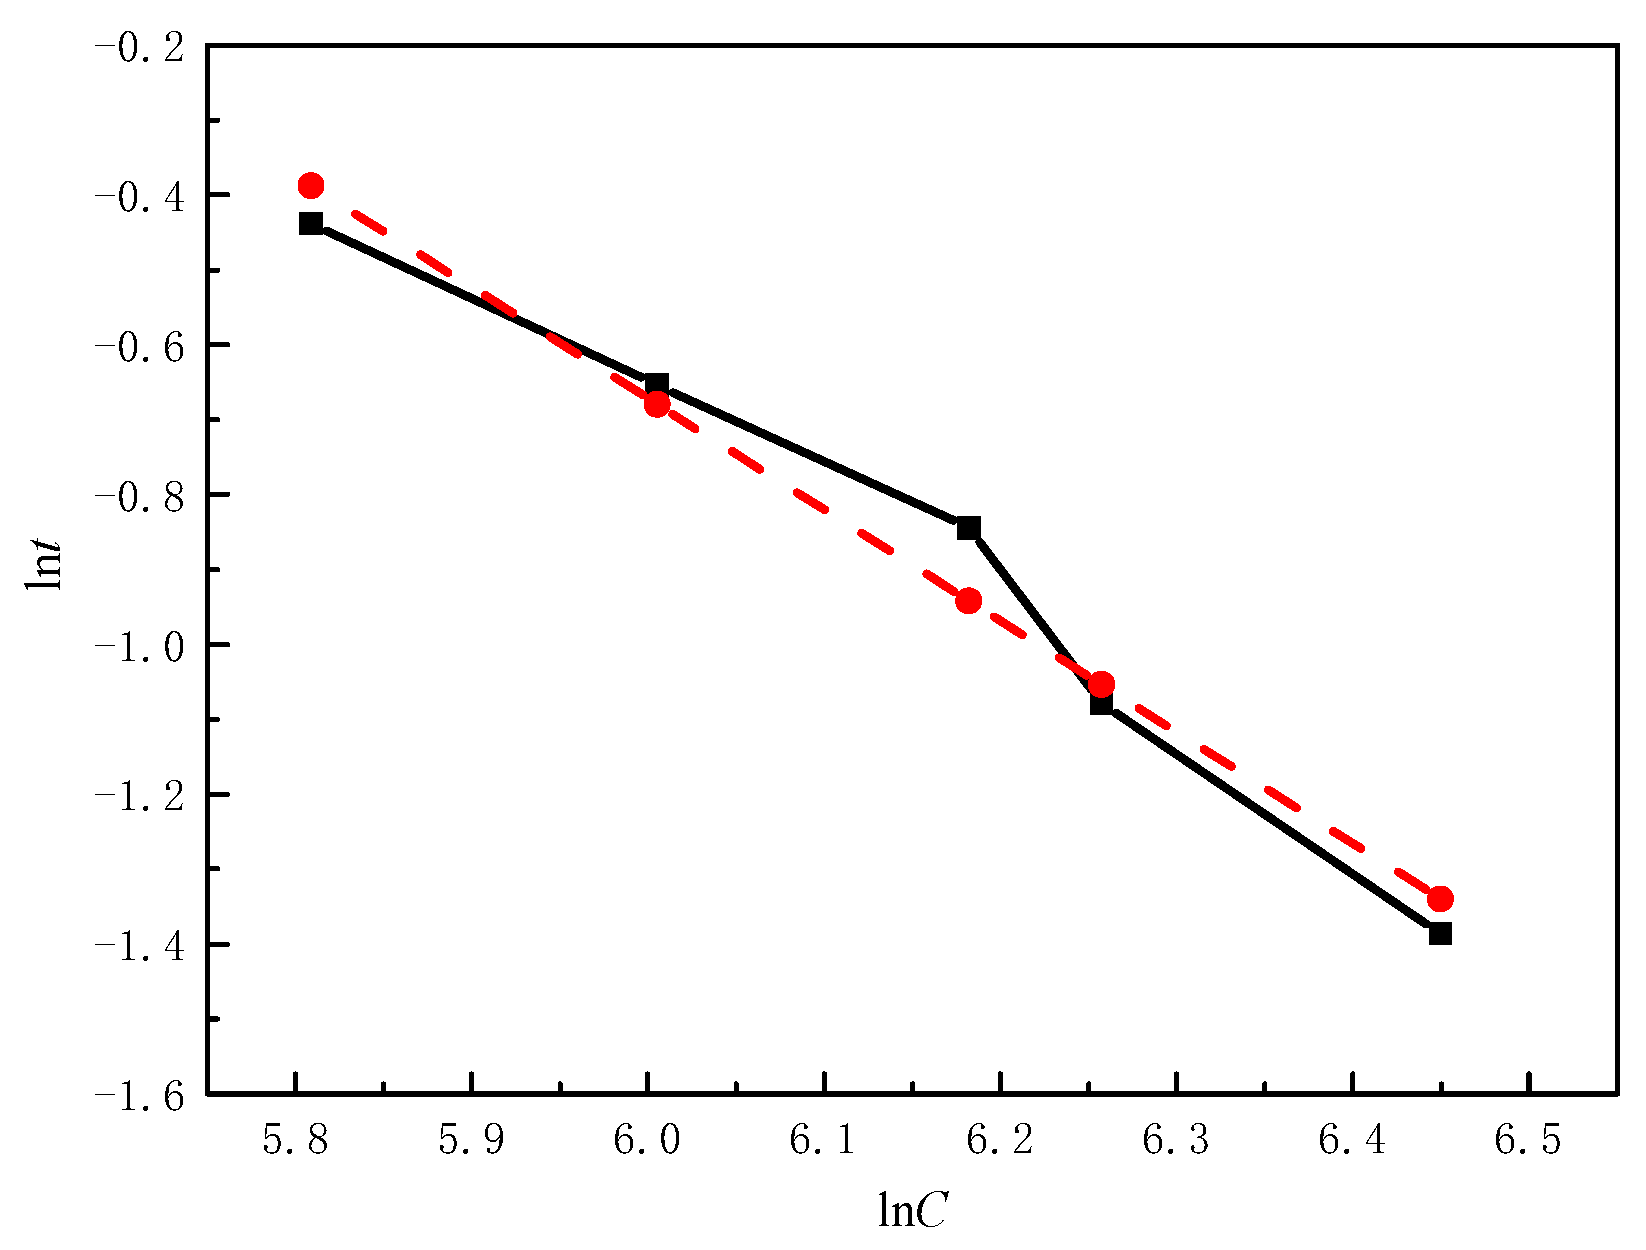
According to the earlier research studies, when the stress relaxation curve meets the generalized Eiling model, ln y 0 ,   ln k ,   ln t , and ln C exhibit linear relationships. Figure 7, Figure 8 and Figure 9 show these relationships.
The solid line in Figure 9 shows the actual value and the dotted line is a theoretical value line. From Figure 7, Figure 8 and Figure 9, it can be concluded that ln y 0 ,   ln k ,   ln t , and ln C exhibit linear relationships, which are verified by experience [16]. In this paper, the stress relaxation curves obtained from the stress relaxation test bench of the welded metal bellows are shown to be correct, and the data are available.
According to the study of creep or stress relaxation, the relation between creep strain, stress, time, and temperature can be well expressed by the creep constitutive equation composed of creep constants. The creep constants of the welded metal bellows are shown in Table 2. These are used for stress relaxation finite element analysis based on the test data and the derivation of the elastic-loss formulas of the two kinds of welded metal bellows.
As shown in Table 2, the values of creep constants A, m, and n are different under different compression loads. The above parameters A, m, and n satisfy the aging theory, and the general formula of the aging theory is:
ε c = A σ n t m
According to the creep constant and the general formula proposed by Chen, this paper adopts time hardening [17] in the creep analysis module to conduct the stress relaxation simulation analysis of welded metal bellows. The time hardening formula is ε c = Am σ n t m 1 . The finite element simulation steps for the stress relaxation of welded metal bellows are explained below.
(1)
Model development
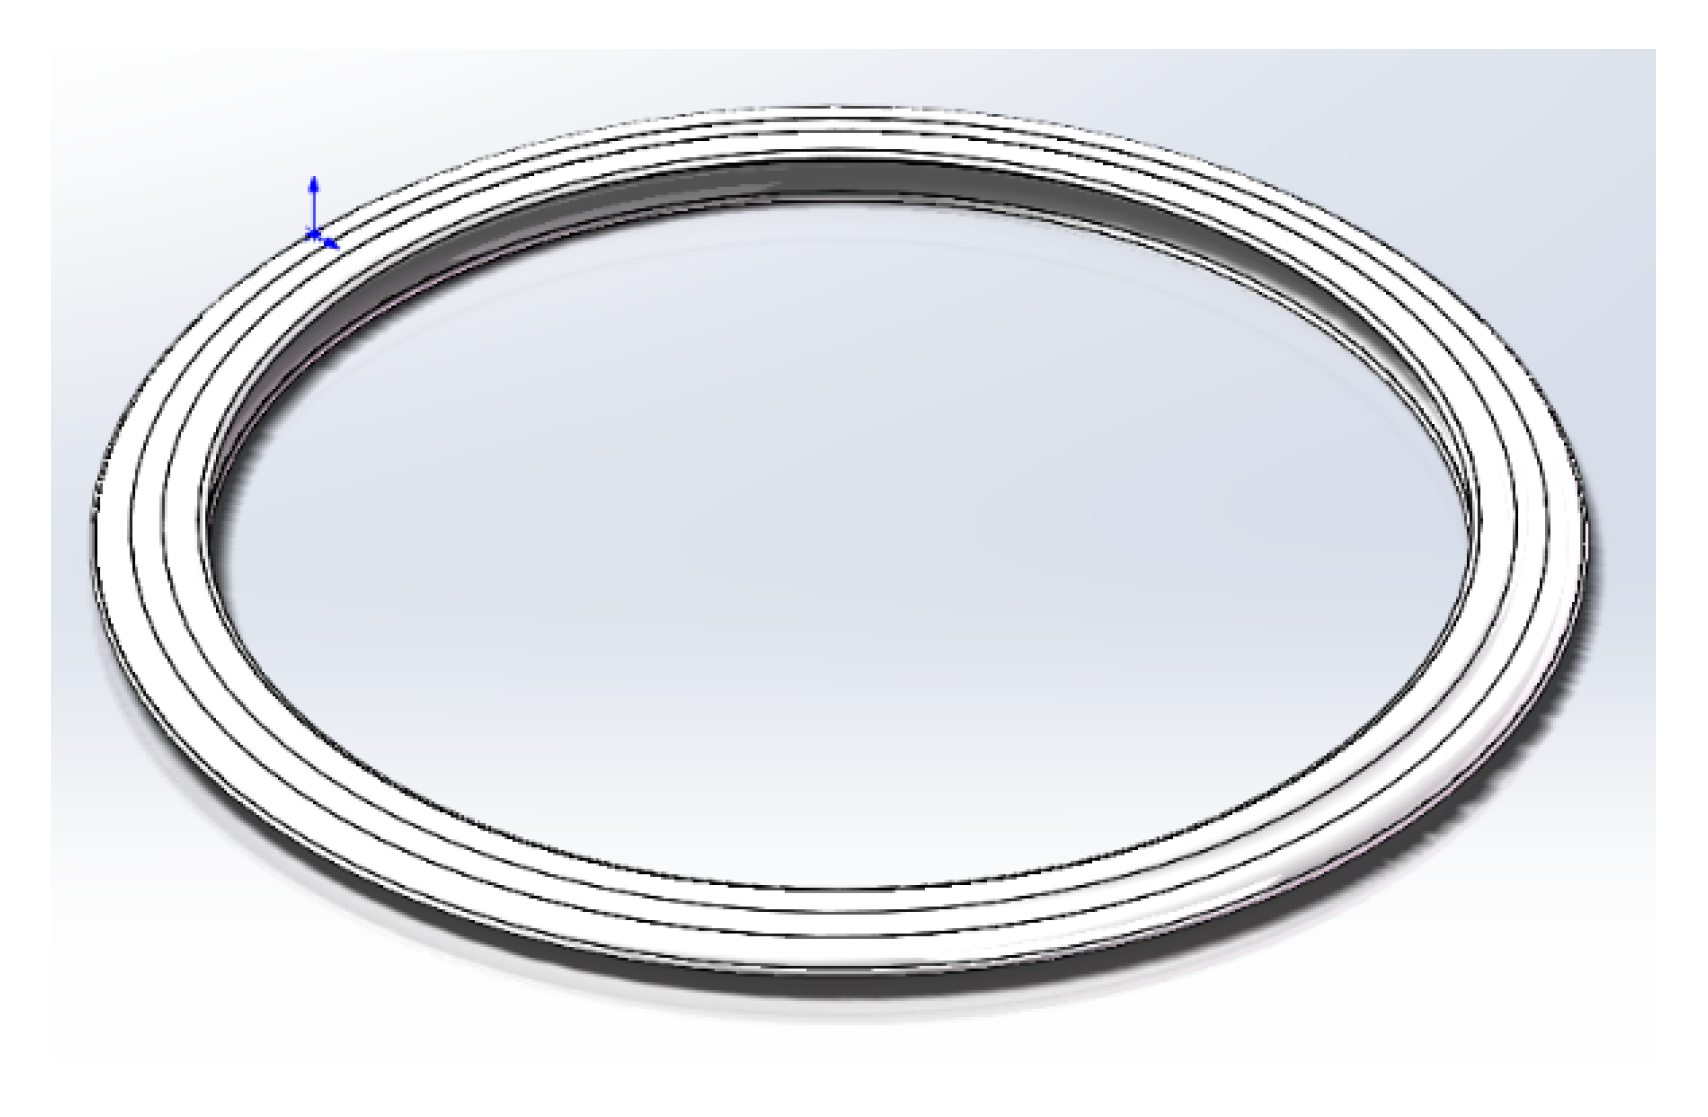
The 3D Solidworks model of the welded metal bellows [18] is shown in Figure 10.
(2)
Material and physical parameters
According to the creep model, the basic mechanical properties and physical parameters of 316 L steel at 250 °C are presented in Table 3.
(3)
Meshing and boundary condition setting
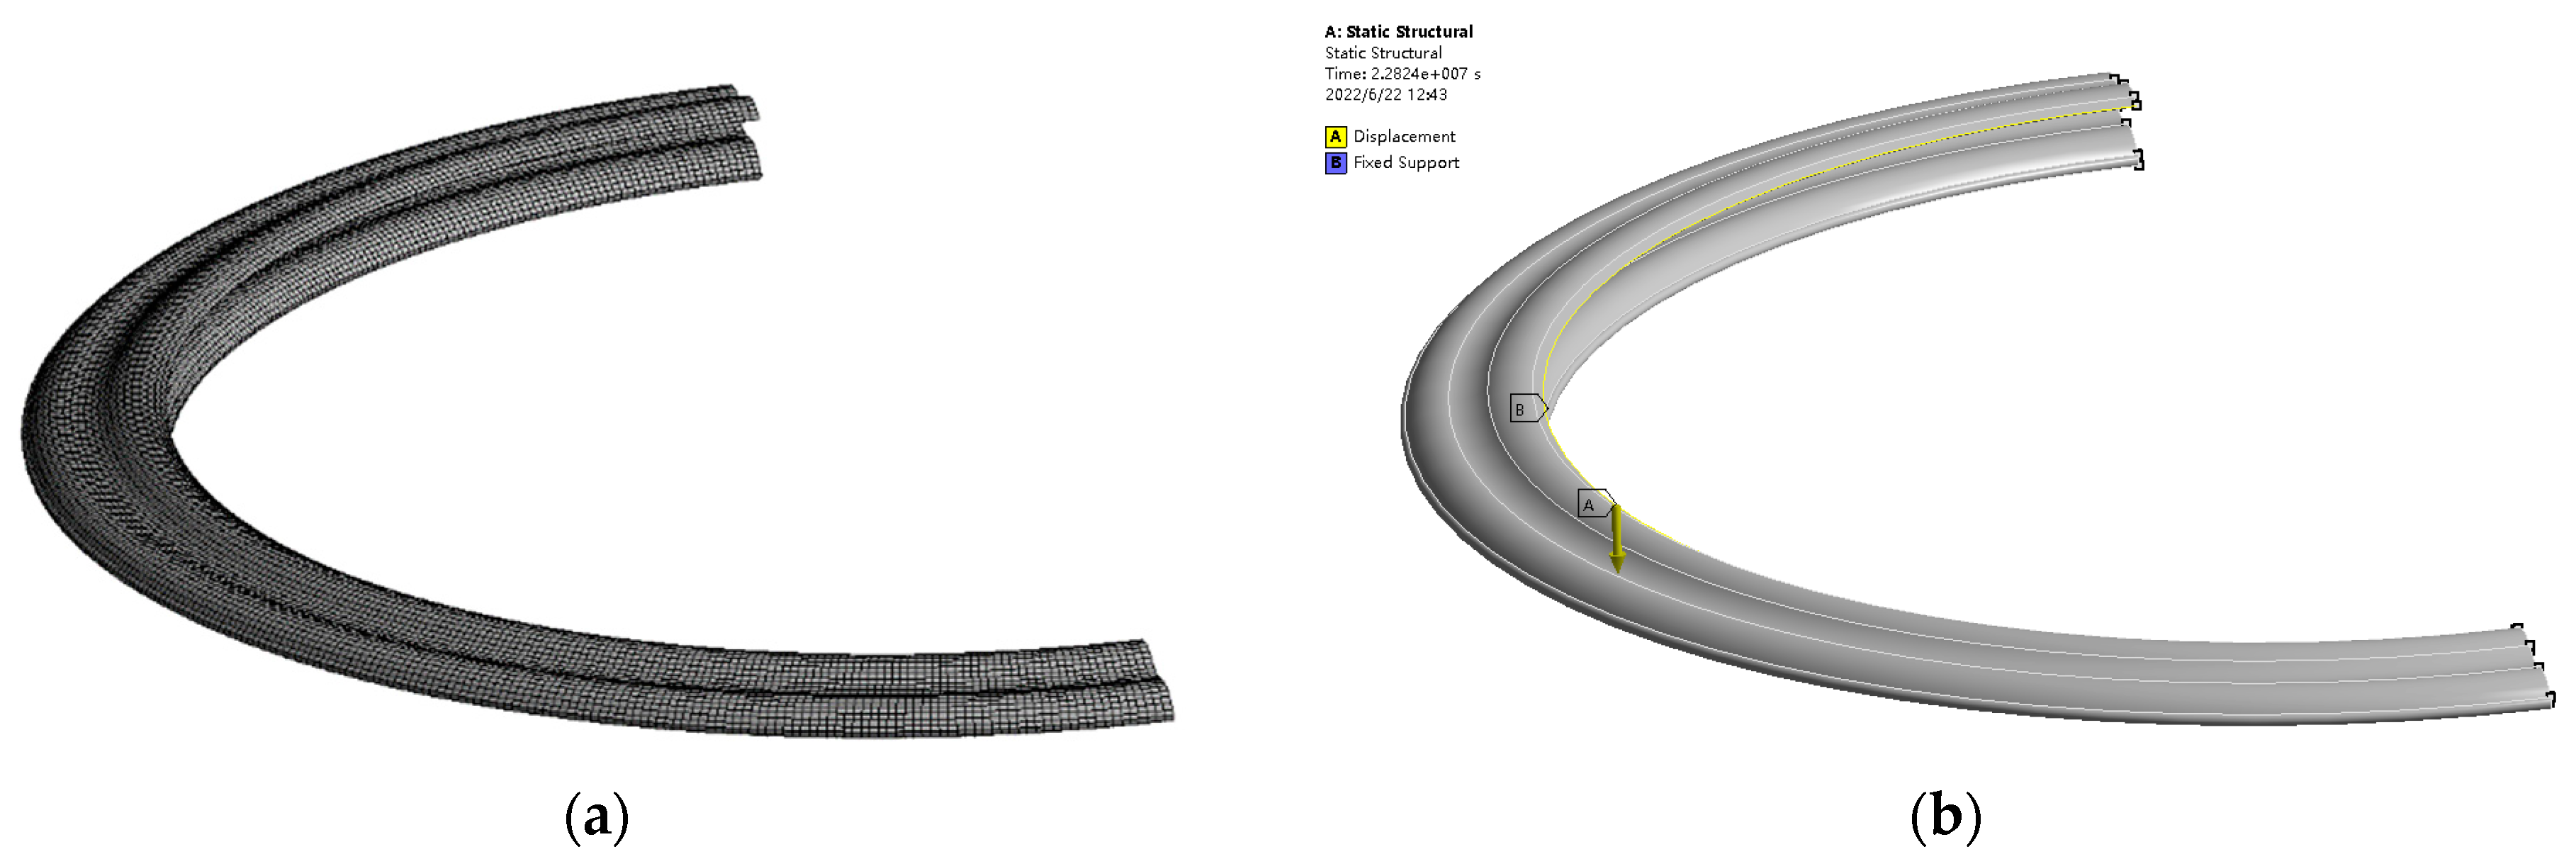
For the welded metal bellows, a sweep scanning grid division was adopted for discretization. The meshing results are shown in Figure 11a, with a total of 20,457 nodes and 31,968 elements.
(4)
Postprocessing
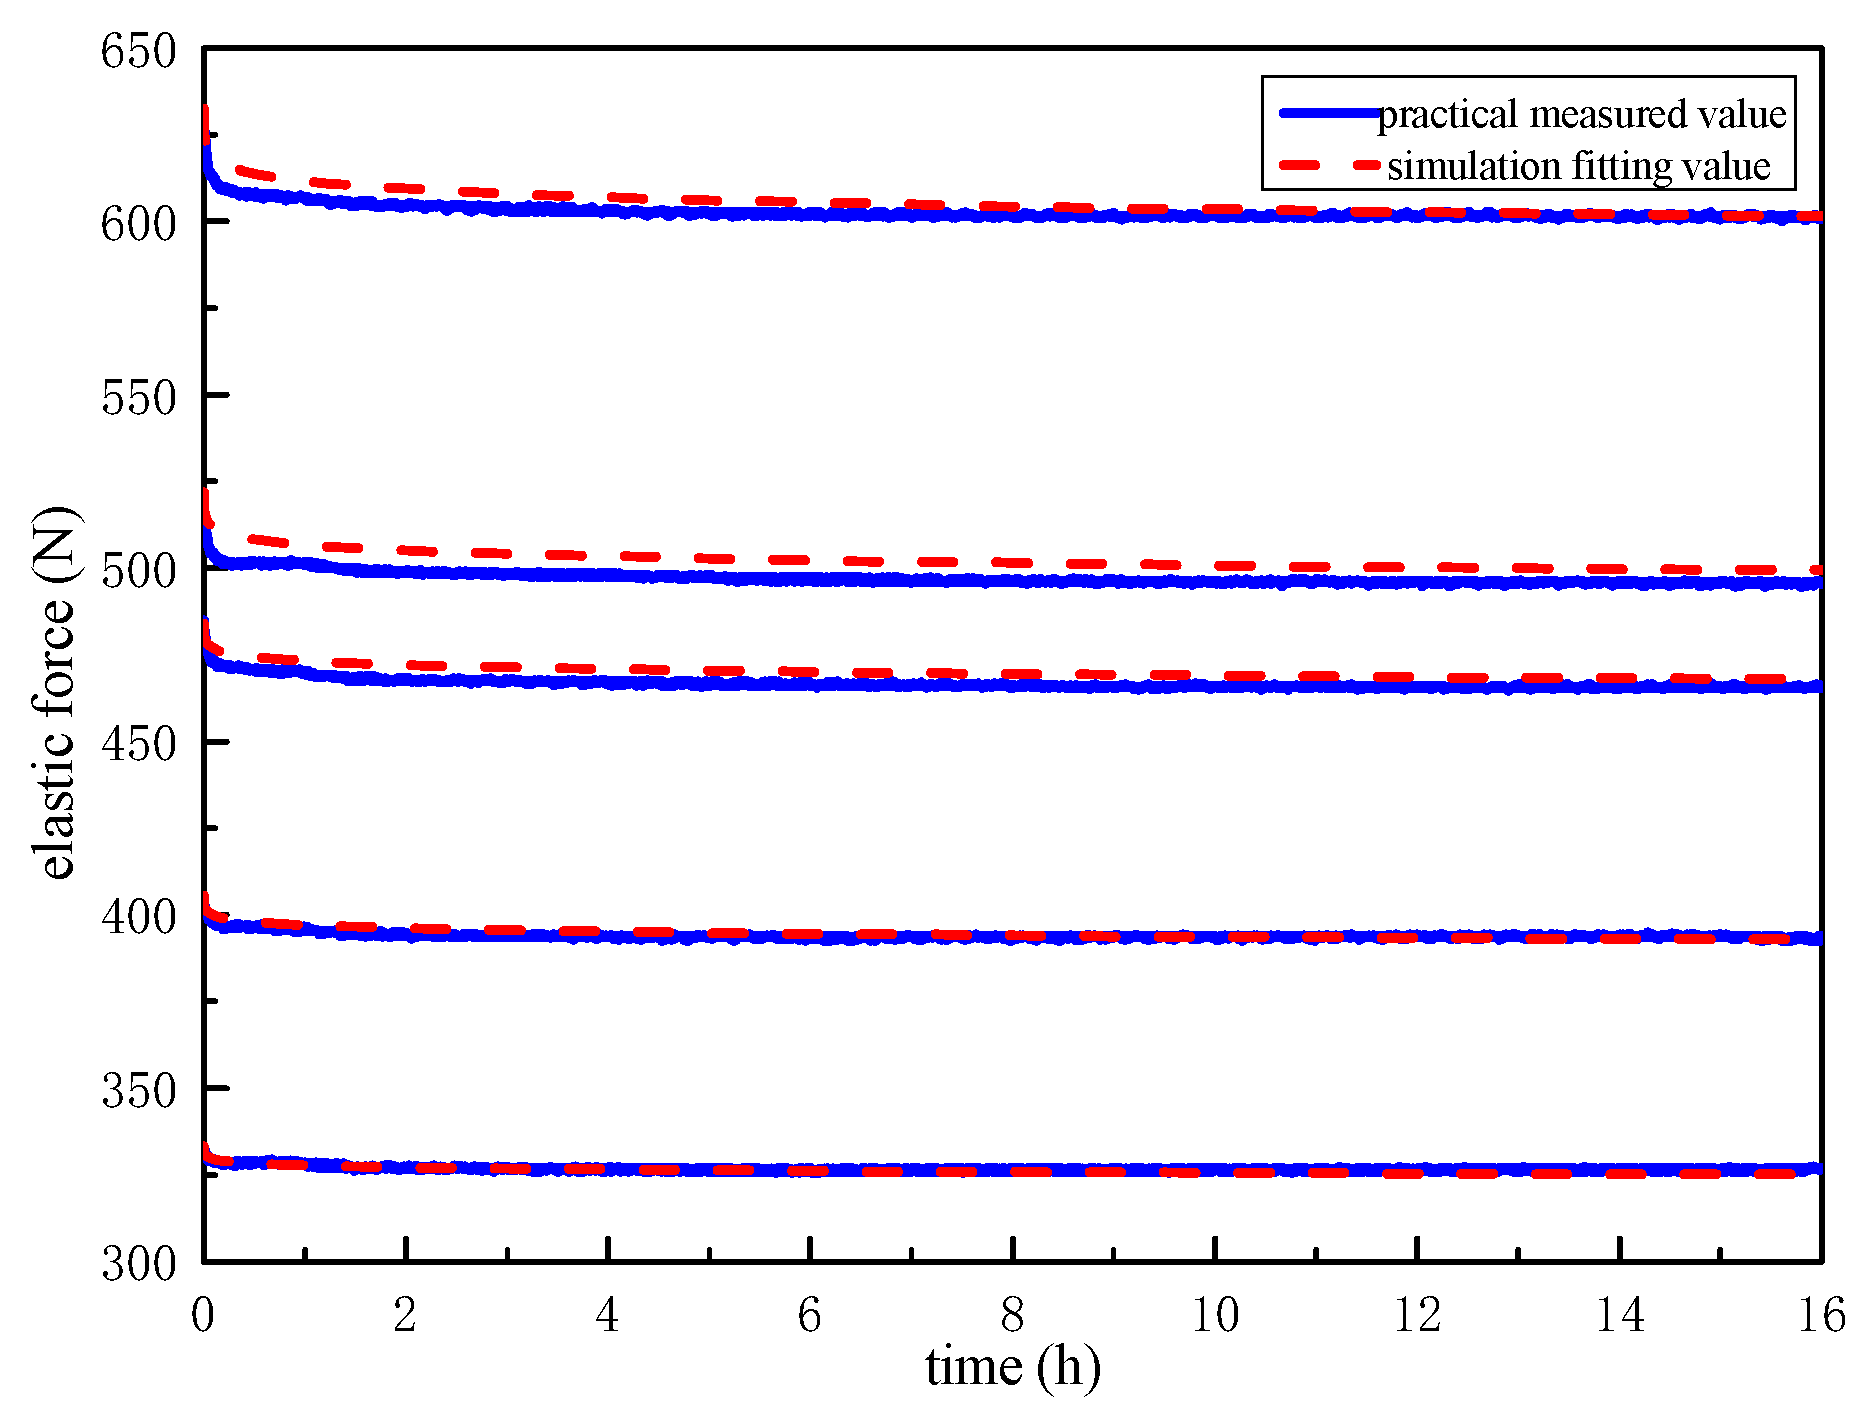
The loading conditions of bellows’ boundary conditions are shown in Figure 11b. The solution is divided into two steps. The first step is used to define the initial conditions of stress relaxation, i.e., the application of load on the part, short time setting, and running the model without the creep effect; the second step is the stress relaxation stage, in which the creep effect is turned on and all boundary conditions are kept stable. The relaxation time is set as 16 h. Table 4 shows the second step length settings.
According to the stress relaxation simulation process, projectile loss curves under the respective compression loads at 250 °C were obtained, which are shown in Figure 12. This figure also gives a comparison between the simulation curve and the test curve.
Through the comparison of the elastic loss curves, it can be observed that the test load relaxation curve has a high degree of coincidence with the welding machine metal bellows simulation curve, and the error between the two is insignificant, i.e., within the allowable error range. Therefore, the stress relaxation simulation of welded metal bellows can accurately simulate the relaxation characteristics of welded metal bellows.
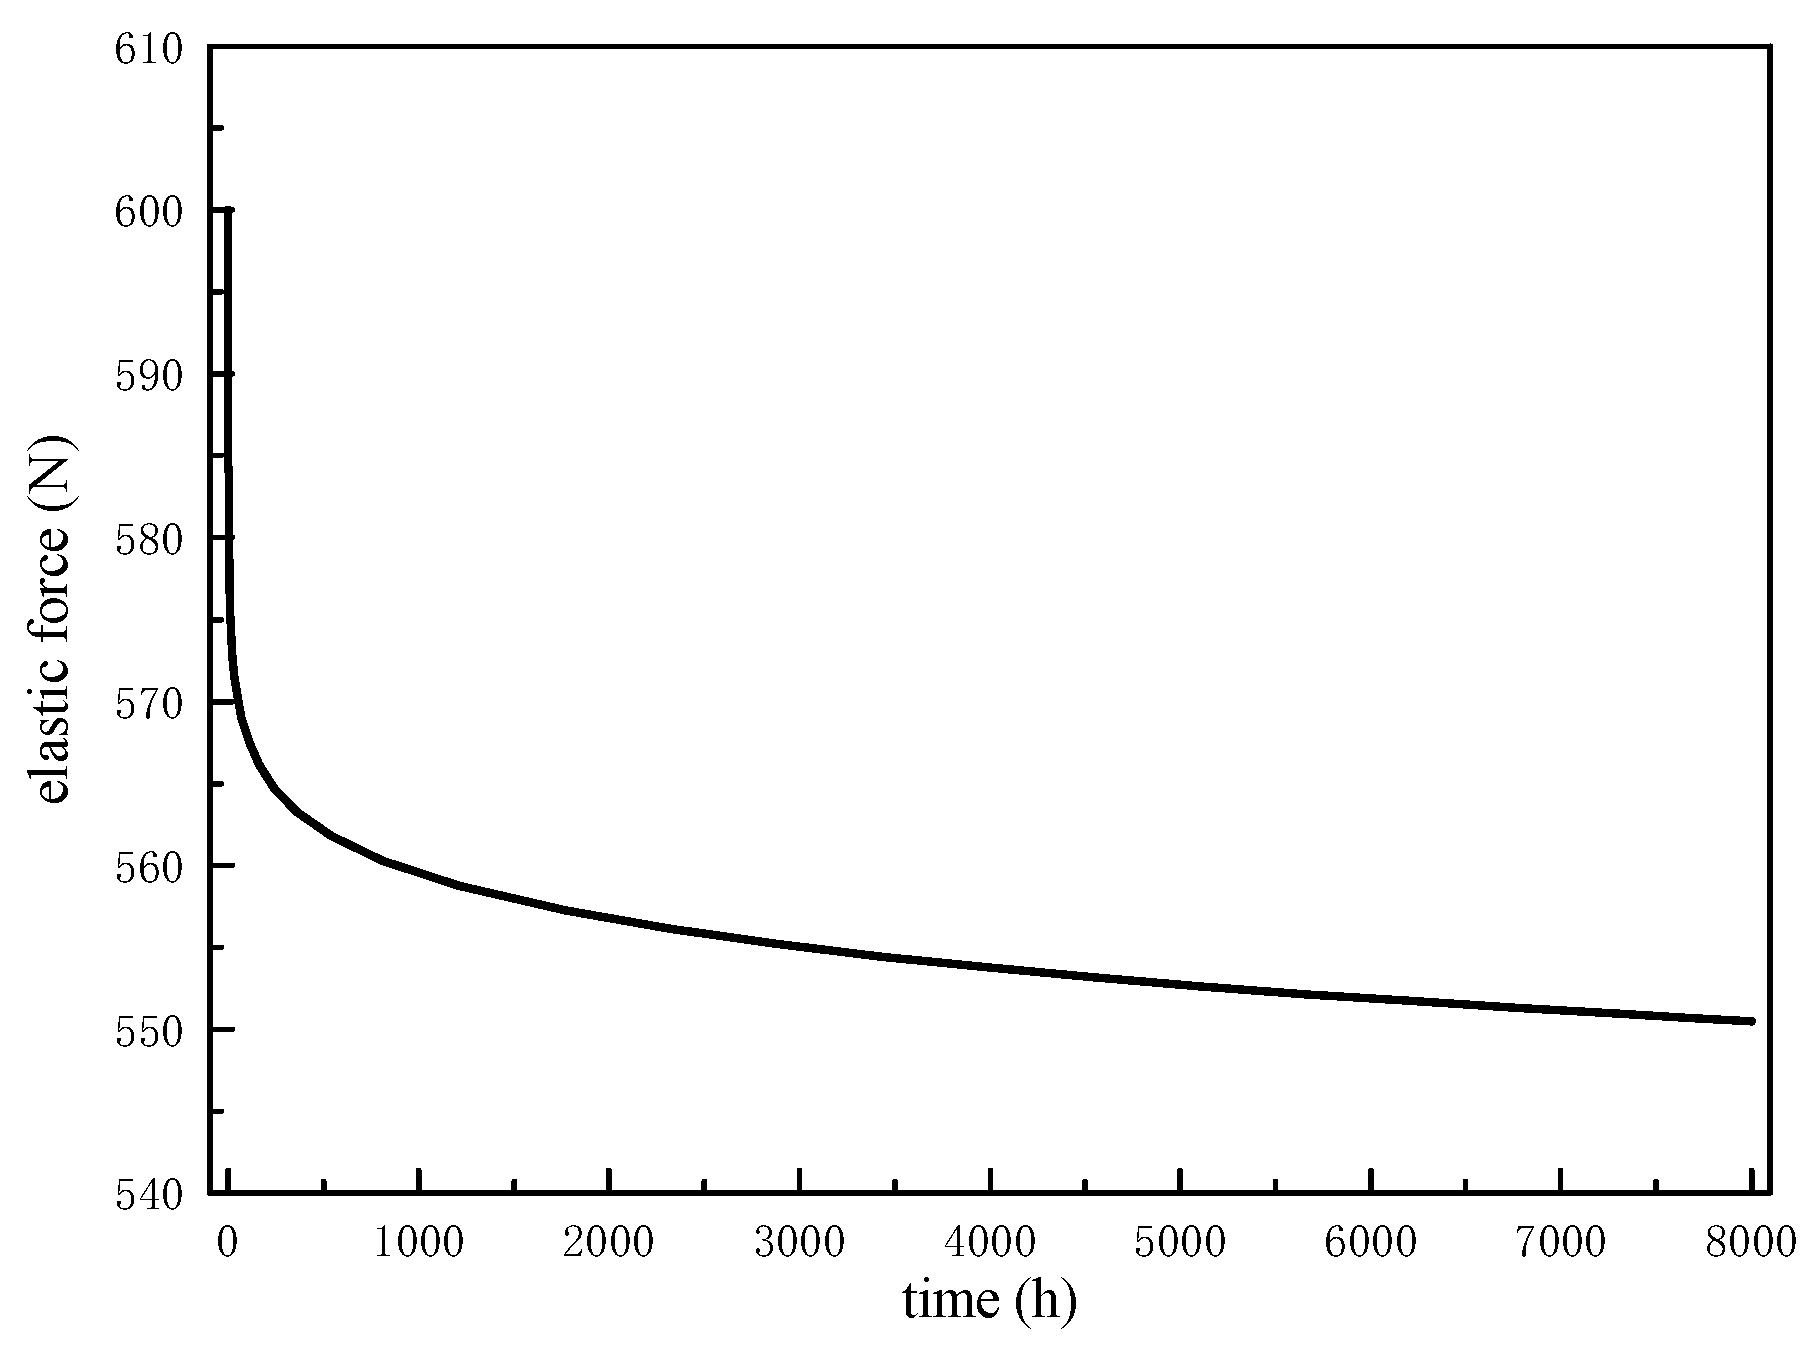
According to the published literature [19], it can be concluded that the minimum elastic force of welded metal bellows is 545 N, and finite element analysis of the stress relaxation is required before using the Six Sigma analysis module. The reliability of welded metal bellows studied in this paper is the reliability of A at a compression load of 600 N considering a running time of 8000 h. A set of creep parameters A, m, and n values are selected, and the elastic change diagram is shown in Figure 13.
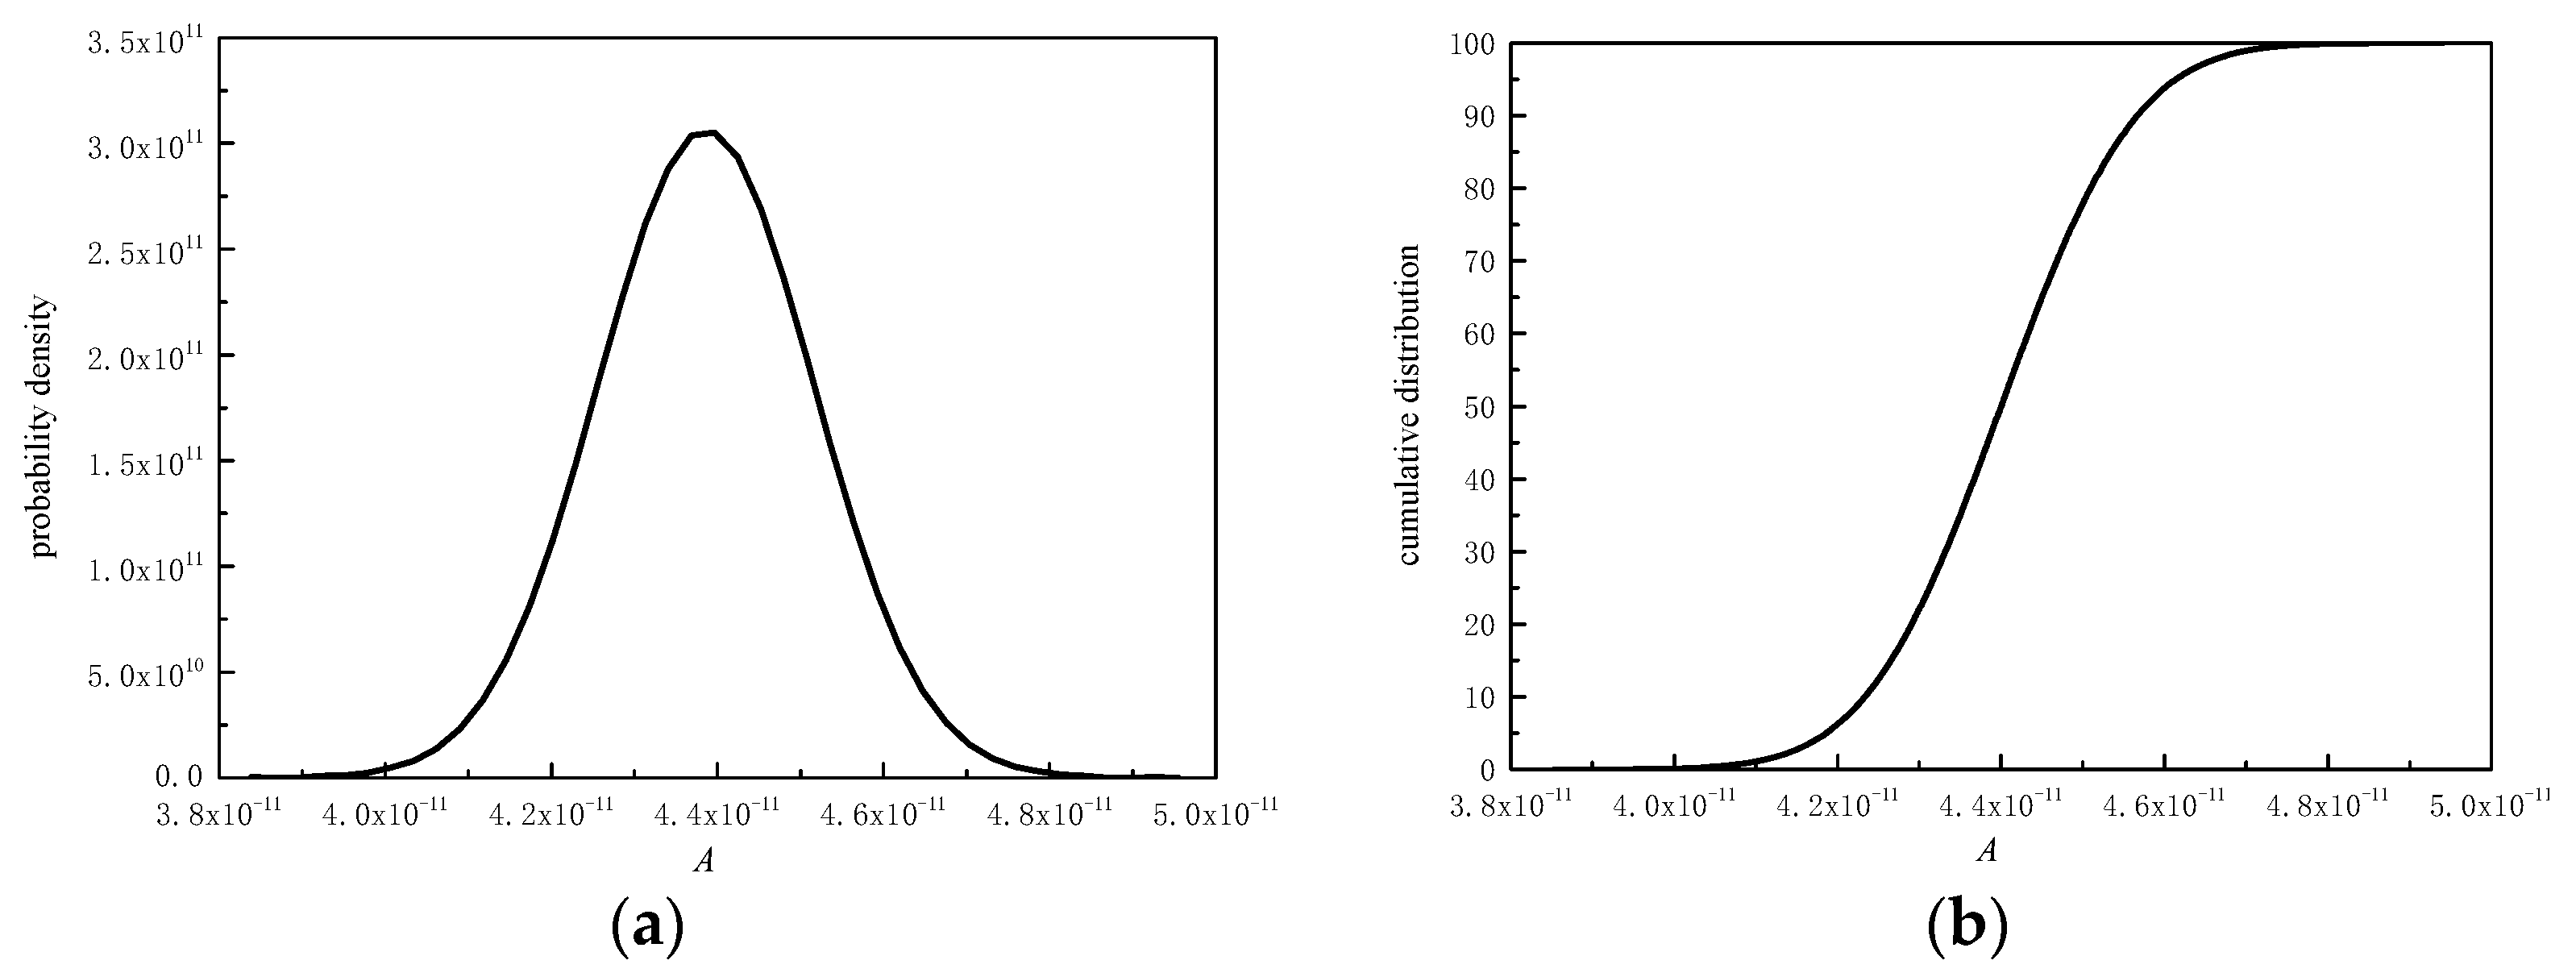
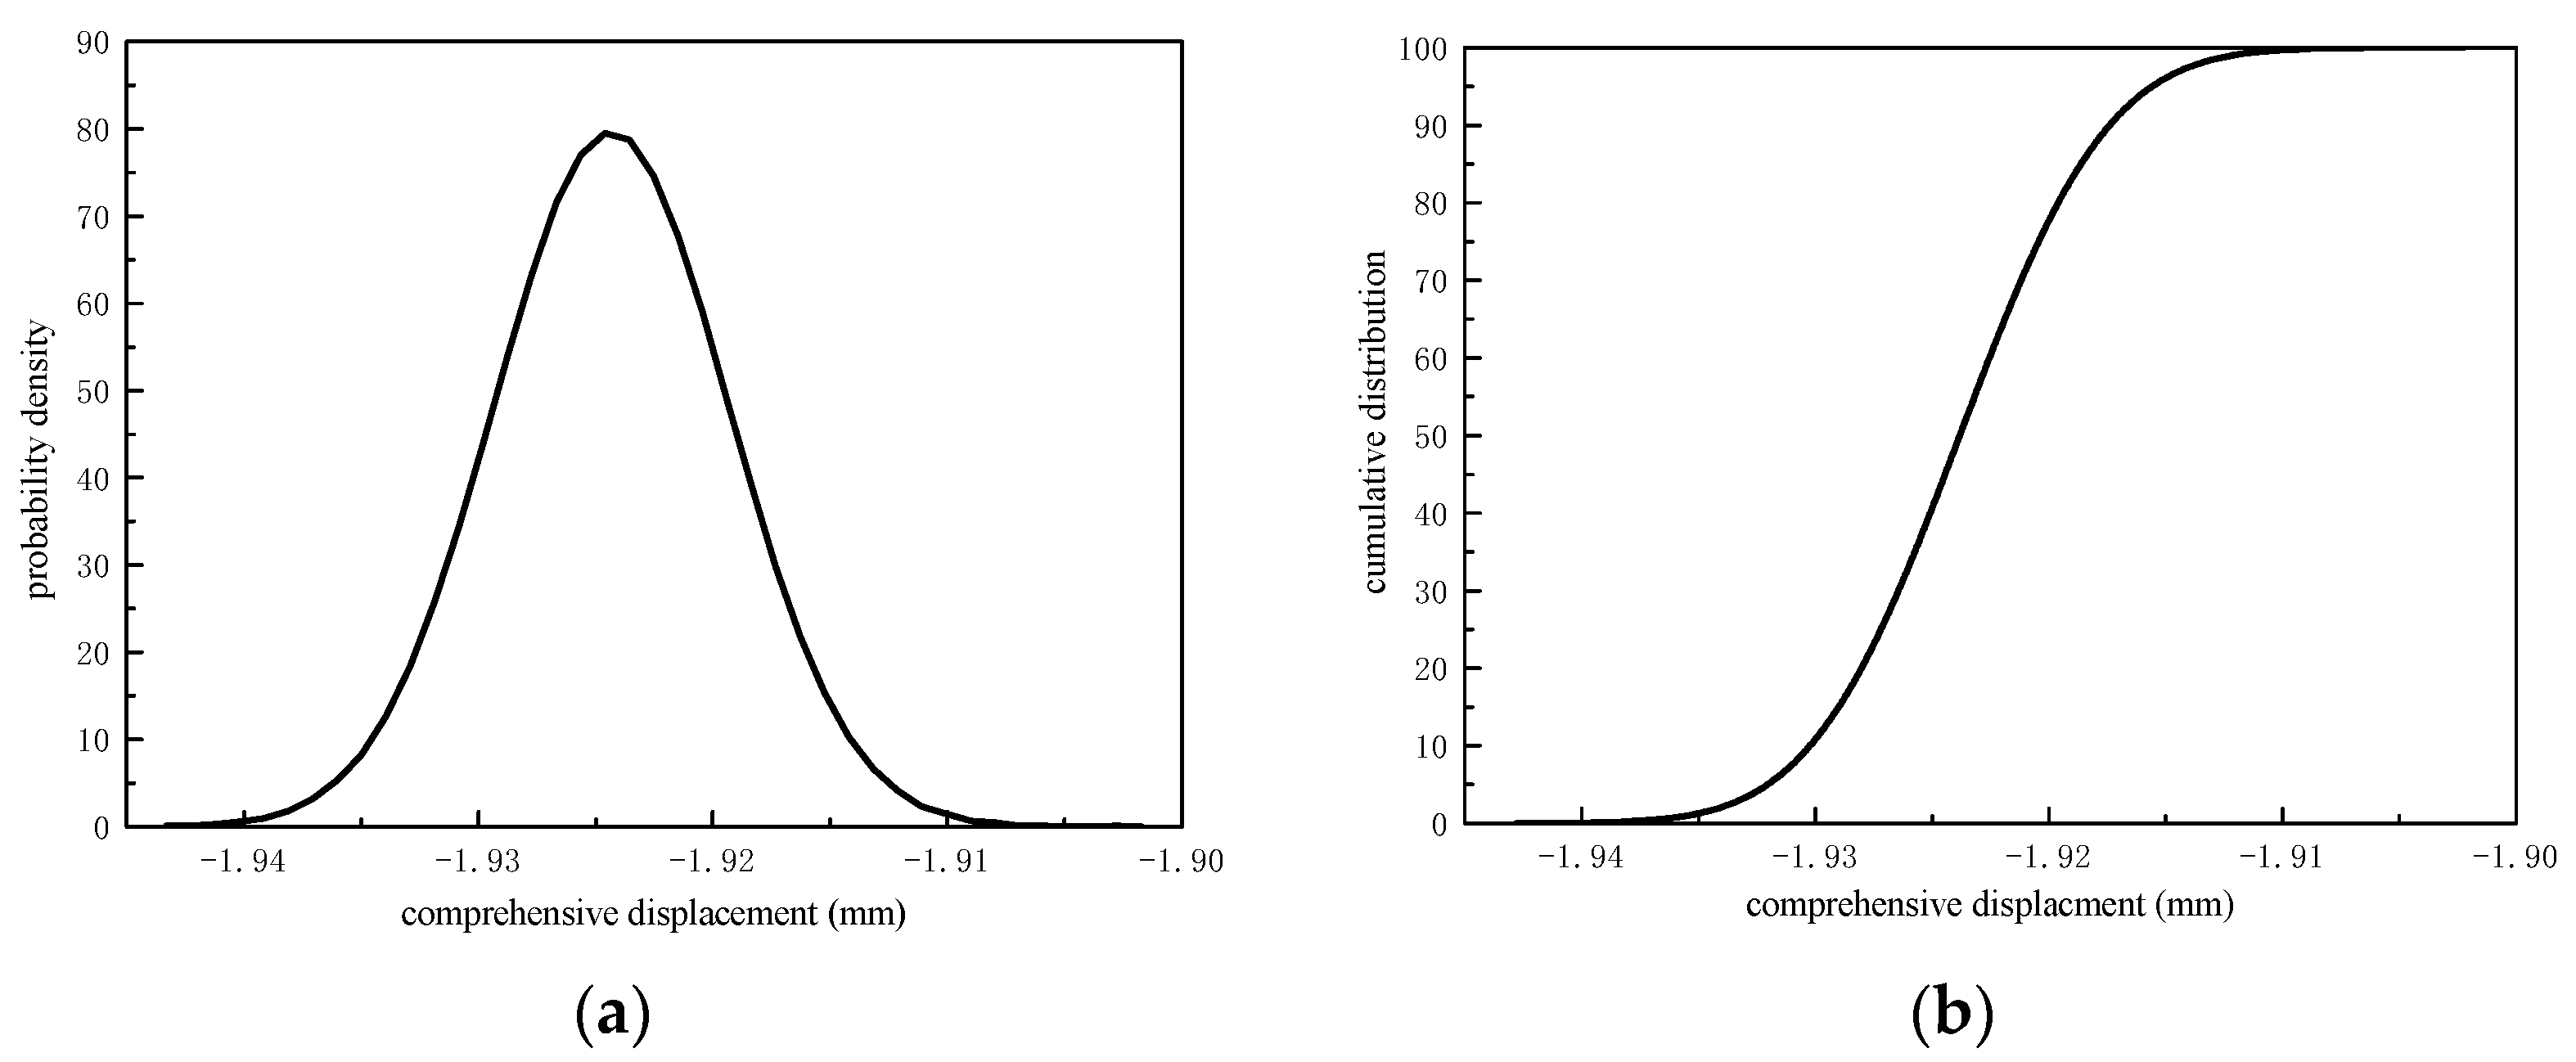
In the process of manufacturing welded metal bellows, creep constant changes occurred due to error in the manufacturing process or differences in the material attributes. According to the fitting of the creep constant, the creep constant changes that are greater than the value of A can be evaluated. Considering this, this article used the A × m displacement value matrix and the compression loading as the design parameters by taking into account the normal distribution law. The 8000 h of the residual elastic force bellows is taken as the objective function. The mean and standard deviation value of the A × m matrix, the compressive displacement load, and the upper and lower terms caused by them are presented in Table 5, and their distribution is shown in Figure 14 and Figure 15.
According to Table 4, the average value corresponding to the compression displacement load is converted to a pressure load of 600 N, and the upper and lower values are converted to a pressure load of 605 N and 595 N, respectively.
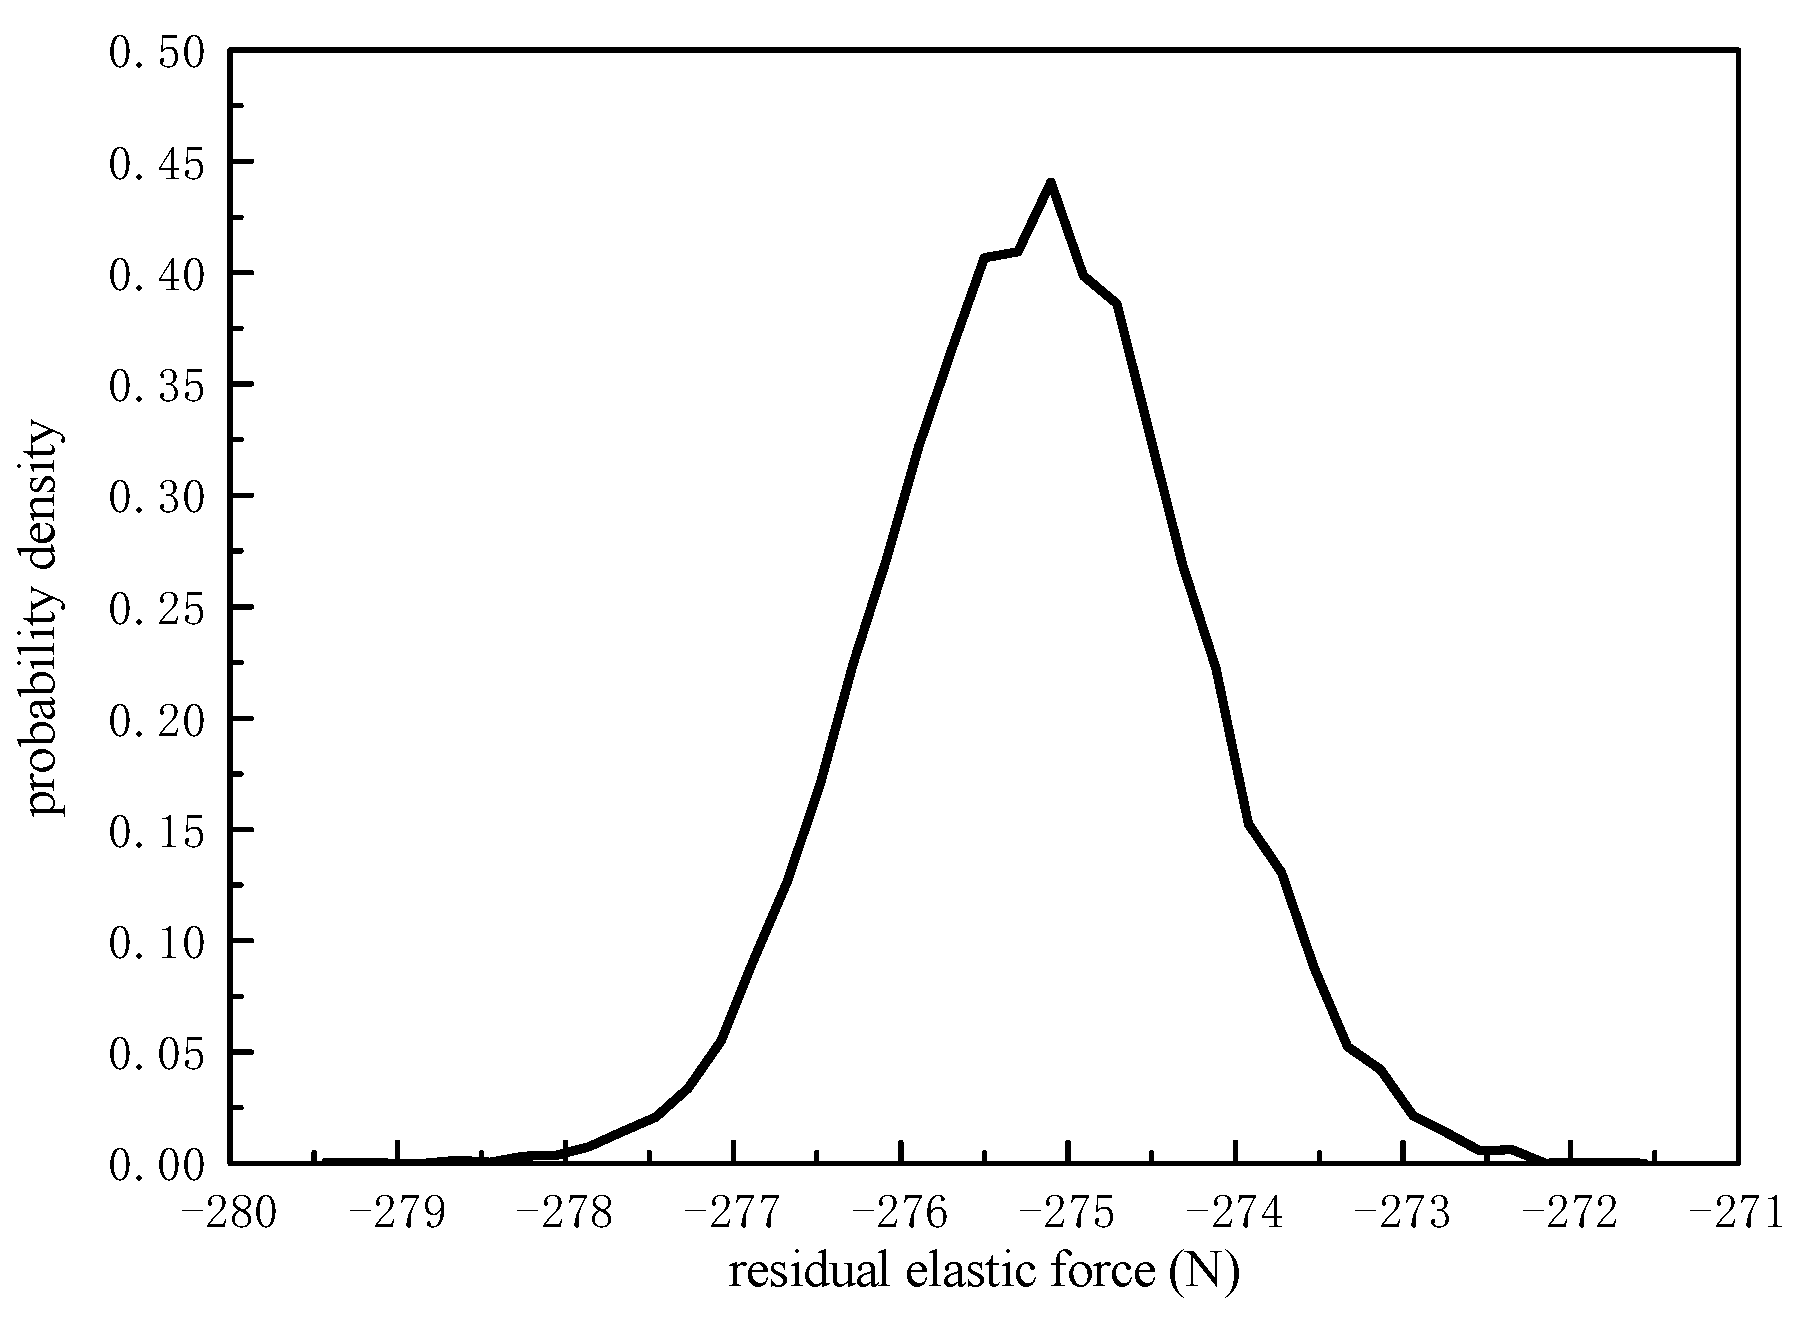
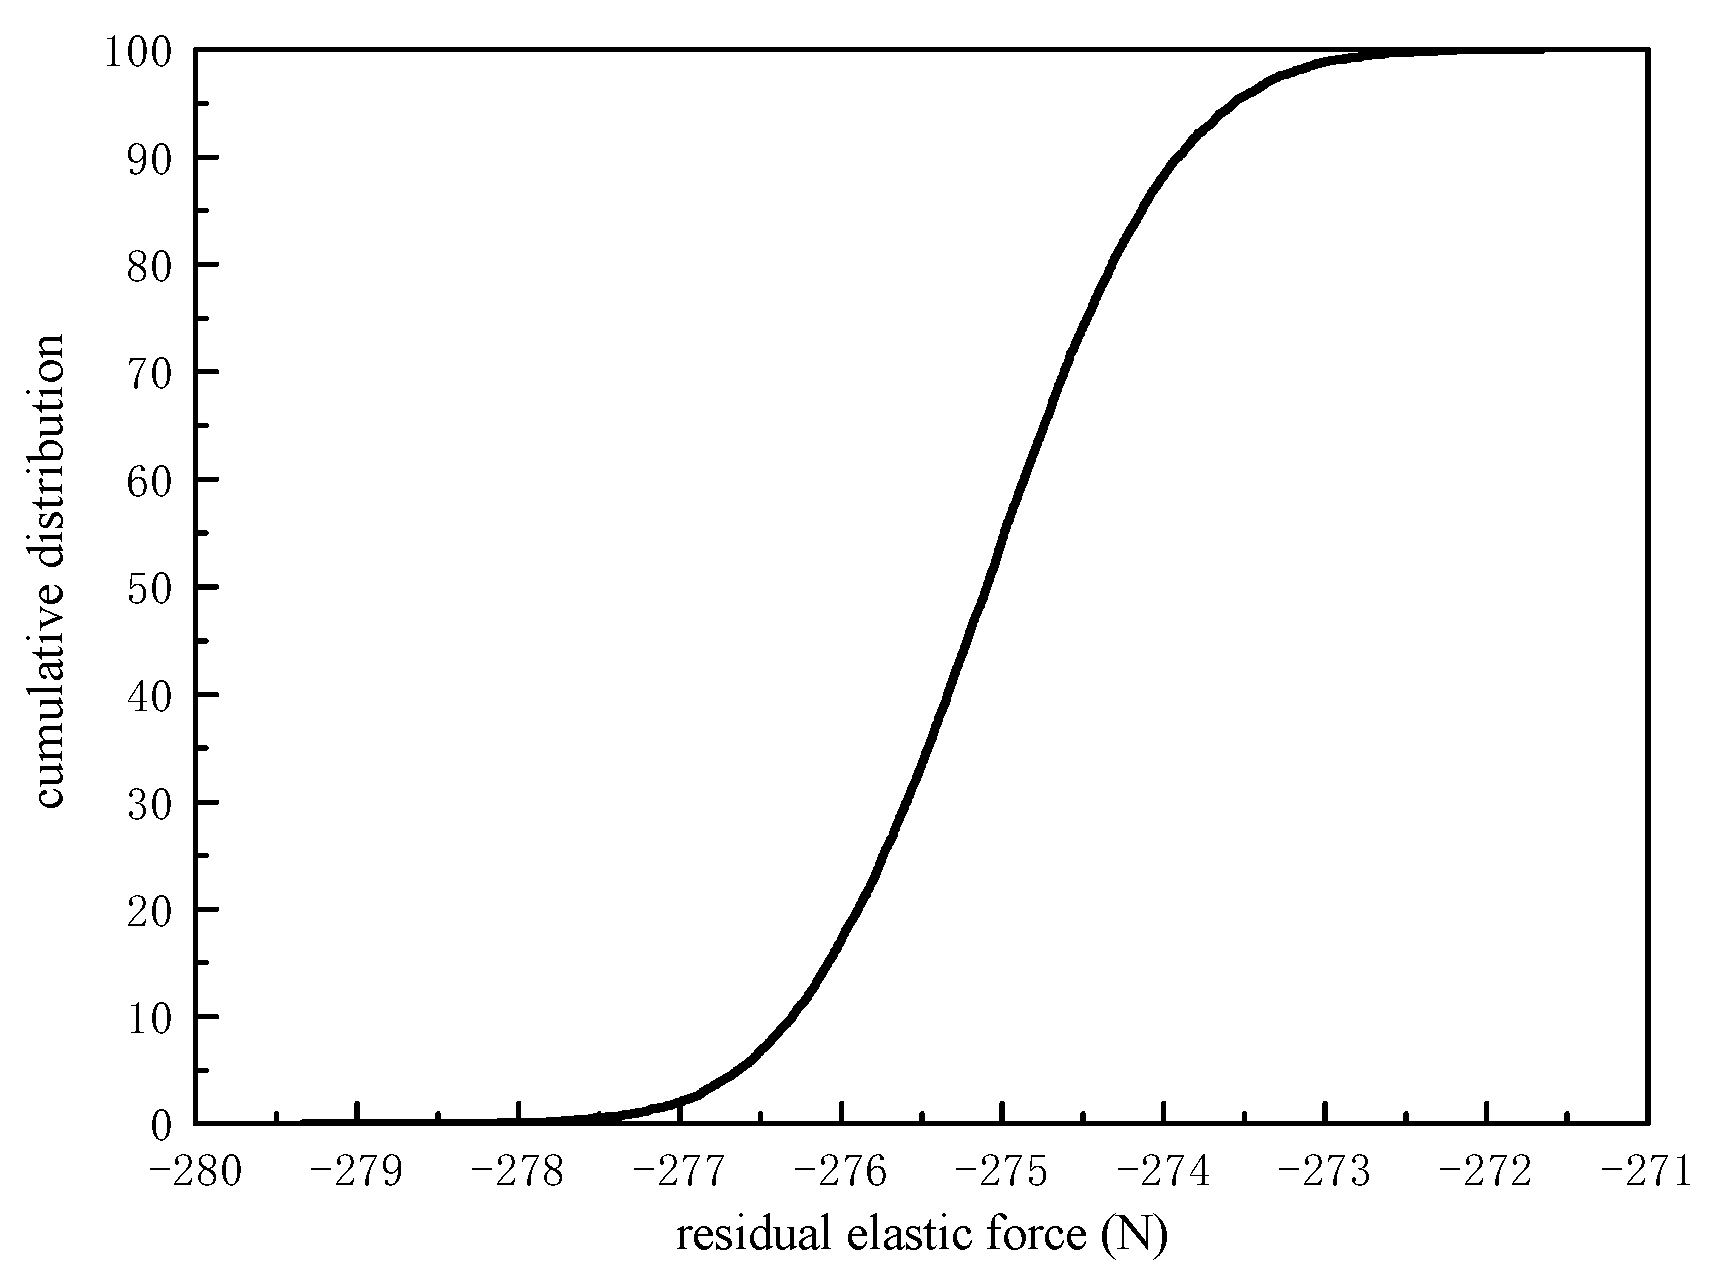
The probability density function and cumulative distribution of the 8000 h residual load are shown in Figure 16 and Figure 17.
The horizontal coordinates of the above probability density diagram and the cumulative distribution diagram are half of the total residual elasticity, and they show a negative trend due to the directivity of the software simulation. According to Figure 15 and Figure 16, after 8000 h of service time, the probability of residual elasticity was found to be 0.997 when the force was greater than 545 N. The obtained result is consistent with the published data of other researchers. For instance, Zhou [20] used the Monte Carlo method to solve the reliability of each part in the mechanical seal, and the reliability of elastic elements in the mechanical seal was found to be 0.99. Thus, the results presented in this paper demonstrate the accuracy of the data. They meet the requirements of a mechanical seal system, and the reliability obtained in this paper is acceptable for general mechanical sealing systems.
The conventional method of calculating reliability usually requires several test samples. Based on the short-time test data, the reliability calculation of welded metal bellows is evaluated using simulation software. Compared with other reliability methods, this method requires less test sample data, and the variables are not limited to the working conditions of welded metal bellows. Moreover, this method can analyze all kinds of material and structural parameters of welded metal bellows, and the obtained reliability is convincing.

4. Conclusions

Based on the test data, the reliability of welded metal bellows is solved using Workbench simulation analysis. The main findings are as follows:
1.
The stress relaxation degree of welded metal bellows becomes more significant with an increase in the initial displacement load.
2.
According to the creep parameters determined by the test data, the stress relaxation simulation of welded metal bellows was performed. The elastic relaxation data of bellows under different compression loads were obtained at 250 °C.
3.
The reliability of welded metal bellows under specific working conditions can be obtained using Six Sigma, and the results demonstrate acceptable reliability.

Author Contributions

Conceptualization, Z.Z. and C.M.; methodology, Y.Z. and J.S.; formal analysis, Z.Z. and X.N.; software, Z.Z. and C.M.; writing—original draft, Z.Z., C.M. and Y.Z.; writing—review and editing, Y.Z. and J.S. All authors have read and agreed to the published version of the manuscript.

Funding

This work was supported by the National Key R&D Program of China (2018YFB2000800) and The National Natural Science Foundation of China (52075268).

Institutional Review Board Statement

Not applicable.

Informed Consent Statement

Not applicable.

Data Availability Statement

Data sharing is not applicable to this article.

Conflicts of Interest

The authors declare no conflict of interest.

References

  1. Plumridge, J.M.; Ketch, D.P.; Straszewski, C.J. Mechanical seals: The current status of metal bellows sealing. Tribol. Int. 2003, 19, 193–197. [Google Scholar] [CrossRef]
  2. Yang, W.J.; Hao, M.M.; Ren, B.J.; Wang, X.Y. Analysis of the Elastic-Loss Feature of welded Metal Bellows for High Temperature Mechanical Seals. J. Lanzhou Univ. Technol. 2016, 4, 46–50. [Google Scholar]
  3. Gill, S.P.A.; McColvin, G.; Strang, A. Stress relaxation of nickel-based superalloy helical springs at high temperatures. Mater. Sci. Eng. A 2014, 613, 117–129. [Google Scholar] [CrossRef] [Green Version]
  4. Li, J.; Wang, Y.; Chen, X.; Yan, X.; Lu, X. Microstructure evolution in stress relaxation behavior of austenite AISI 304 stainless steel spring. Mater. Charact. 2018, 148, 266–271. [Google Scholar] [CrossRef]
  5. Del Llano-Vizcaya, L.; Rubio-González, C.; Mesmacque, G.; Cervantes-Hernández, T. Multiaxial fatigue and failure analysis of helical compression springs. Eng. Fail. Anal. 2006, 13, 1303–1313. [Google Scholar] [CrossRef]
  6. Nong, X.; Feng, W.; Gao, J.; Shi, C.; Zhao, N. Stress Relaxation Constitutive Relations and Finite Element Analysis of T9A Helical Compression Spring. Mater. Trans. 2021, 62, 962–967. [Google Scholar] [CrossRef]
  7. Schedin, E.; Thuvander, A.; Henderson, P.; Sandberg, P.; Kamf, A. Stress relaxation behaviour of connectors-development of simulation techniques. In Proceedings of the Forty-Second IEEE Holm Conference on Electrical Contacts, Joint with the 18th International Conference on Electrical Contacts, Chicago, IL, USA, 16–20 September 1996; pp. 142–150. [Google Scholar]
  8. Hao, Z.; Luo, J.; Chen, L.; Cai, Y.; Chen, Y.; Cheng, M. Failure mechanism of unequal parameters metal bellows under repeated bending process. Eng. Fail. Anal. 2021, 129, 105671. [Google Scholar] [CrossRef]
  9. Cao, W.H.; Yu, X.C. Fatigue Life Reliability Analysis of Bellows. Chem. Autom. Instrum. 2010, 37, 56–58. [Google Scholar]
  10. Xie, J.; Chen, Y.L.; Chen, H.J. Probabilistic Finite Element Analysis of Structural Reliability of metal Bellows. Chem. Eng. Equip. 2019, 271, 210–212. [Google Scholar]
  11. Ding, W.; Ma, Y.M.; Sun, S. Development of the test device for elasticity loss of the welded metal bellows in mechanical seal. Mach. Des. Manuf. Eng. 2016, 45, 63–66. [Google Scholar]
  12. An, Y.S.; Cai, R.l.; Liu, W.D. Study on the mechanism of elastic loss of welded metal bellows: Stress Force relaxation. Lubr. Seal. 2002, 1, 7–9. [Google Scholar]
  13. Ma, Y.M. Study on mechanism of projectile loss of welded Metal Bellows Based on Thin Shell Theory. Petrochem. Equip. 2020, 19, 17–22. [Google Scholar]
  14. Pang, T. Structural Parameter Optimization and Reliability Analysis of High-Speed Spring Collet. Ph.D. Thesis, Jiangsu University, Zhenjiang, China, 2019. [Google Scholar]
  15. Chen, M.R. Reliability and Durability of electronic energy-saving lamps based on Eiling model. China Lighting Electr. Appl. 1999, 4. [Google Scholar] [CrossRef]
  16. Kwan, W.; Li, W.K.; Ng, K.W. A Multivariate Threshold Varying Conditional Correlations Model. Econom. Rev. 2009, 29, 20–38. [Google Scholar] [CrossRef] [Green Version]
  17. Du, Y.; Liew, J.R.; Jiang, J.; Li, G.-Q. Improved time-hardening creep model for investigation on behaviour of pre-tensioned steel strands subject to localised fire. Fire Saf. J. 2020, 116, 103191. [Google Scholar] [CrossRef]
  18. Liu, J.; Fei, Q.; Wu, S.; Zhang, D.; Jiang, D. Dynamic response of curvilinearly stiffened plates under thermal environment. J. Mech. Sci. Technol. 2021, 35, 2359–2367. [Google Scholar] [CrossRef]
  19. Zhang, Z.; Ma, C.; Sun, J.; Zhang, Y.; Ni, X. A Method for Calculating the Reliability of Welded Metal Bellows for Mechanical Seals. Coatings 2022, 12, 175. [Google Scholar] [CrossRef]
  20. Zhou, J.F.; Gu, B.Q. Reliability Evaluation Method of Mechanical Seals Based on Monte Carlo Method. Lubr. Eng. 2006, 2, 102–104, 135. [Google Scholar]
Figure 1. Reliability solving process.
Metals 12 01073 g001
Figure 2. (a) Schematic diagram of stress relaxation test rig. (b) Physical stress relaxation test rig.
Metals 12 01073 g002
Figure 3. Flowchart of solving reliability of Six Sigma.
Metals 12 01073 g003
Figure 4. Distribution of compression vs. elastic force.
Metals 12 01073 g004
Figure 5. Elastic force relaxation curves under different compressions.
Metals 12 01073 g005
Figure 6. Load loss rate vs. initial load.
Metals 12 01073 g006
Figure 7. y0 prediction curve.
Metals 12 01073 g007
Figure 8. A prediction curve.
Metals 12 01073 g008
Figure 9. t prediction curve.
Metals 12 01073 g009
Figure 10. Welded metal bellows three-dimensional diagram.
Metals 12 01073 g010
Figure 11. (a) Meshing. (b) Boundary Condition Settings.
Metals 12 01073 g011
Figure 12. Comparison of simulation curve and test curve.
Metals 12 01073 g012
Figure 13. Elastic change diagram.
Metals 12 01073 g013
Figure 14. Probability distribution plot and cumulative distribution plot of A × m values. (a) Probability distribution of A × m values. (b) Cumulative distribution of A × m values.
Metals 12 01073 g014
Figure 15. Probability distribution plot and cumulative distribution plot of compressive displacement load. (a) Probability distribution of compression displacement. (b) Cumulative distribution diagram of compression displacement.
Metals 12 01073 g015
Figure 16. Residual load accumulation distribution.
Metals 12 01073 g016
Figure 17. Cumulative distribution of residual loads.
Metals 12 01073 g017
Table 1. Regression equation of stress relaxation curve.
Amount of Compressiony0kt
10326.26.70.65
12393.612.10.52
14465.518.50.43
16496.526.30.34
18602.230.60.25
Table 2. Different compressions and their corresponding A, m, and n values.
Compression (mm)1012141618
A7.0 × 10−97.3 × 10−106.6 × 10−98.0 × 10−107.6 × 10⁻⁹
m2.0022.00222.0012
n0.060.060.060.060.06
Table 3. Settings of stress relaxation parameters for welded metal bellows.
PropertyValueUnit
Density7750Kg m−3
coefficient of thermal expansion1.2 × 10−5C−1
Young’s Modulus1.93 × 1011Pa
Poisson’s Ratio0.3
Creep Constant 14.2 × 10⁻¹¹
Creep Constant 22.002
Creep Constant 3−0.94
Creep Constant 40
Tensile Yield Strength2.07 × 108Pa
Compressive Yield Strength2.07 × 108Pa
Table 4. The second step is set.
Total Number2
Current step2
stop time57,600 s
Automatic time steppingopen
definitiontime
Initial time step1 s
Minimum time step0.1 s
Maximum time step5000 s
Note: s stands for seconds.
Table 5. A × m values and compression displacement load settings.
A × mCompressive Displacement Load
mean4.4 × 10−111.9238
standard deviation1.3 × 10−120.005
upper limit value4.0 × 10−111.9393
lower limiting value4.8 × 10−111.9084
Publisher’s Note: MDPI stays neutral with regard to jurisdictional claims in published maps and institutional affiliations.