Abstract
The glass phase is one of the binding phases in high-basicity sinter, which is mainly formed during a high-temperature cooling process while cannot crystallize in time. The phase still involves the “structure” information of the binding phase’s liquid phase in the sinter. In addition, the generation of glassy phases can seriously deteriorate the metallurgical properties of sintered ore. However, the formation mechanism and crystallization process of glass phases are still unclear. In this work, the glass phase and the crystallized samples of the CaO-SiO2-Al2O3 system were characterized using X-ray diffraction, optical microscopy, scanning electron microscopy, energy-dispersive spectroscopy and Raman spectroscopy. The effect of alkalinity (R) and Al2O3 on crystallization and the relationship between crystallization and structure are discussed. The results showed that the chemical composition significantly influences the crystallization of the CaO-SiO2-Al2O3 glass. Decreasing basicity (R = 0.8–1.2, the mass ratio of CaO and SiO2) favors the crystallization of the glass phase, while increasing the content of Al2O3 (9–12%) can inhibit the crystallization of the glass phase. In addition, the crystallization order of the 45mass%CaO-45mass%SiO2-10mass%Al2O3 sample is CaSiO3 → CaAl2O4. Raman spectroscopic analysis showed that increase of slag basicity promoted the aggregation degree (Q3/Q2), resulting in deterioration of the glass phase crystallization. and that the glass phase crystallization deteriorated as the aggregation degree increased. However, increasing the Al2O3 content has little effect on the agglomeration degree but does promote the formation of SiO4 tetrahedra (Q0), which results in the deterioration of glass-phase crystallization.
1. Introduction
The main phases of sinter include magnetite, hematite, calcium ferrite, calcium silicate, and a small amount of glass phase [1]. The glass phase is the product created when the liquid phase solidifies during the sintering process but is too late to crystallize—also called the supercooled liquid phase. The mineral composition and structure formed during the crystallization of the sinter-binding glass phase are important factors affecting sinter quality [2], including its strength and reducibility. Previous studies [3,4,5,6,7] revealed that magnetite, hematite, and calcium ferrite followed by glass phase in the strength order from big to small. As the bonding phase of sinter, the compressive strength of the calcium ferrite is far greater than that of the glass phase. Therefore, the strength of the sinter is reduced with the increase of glass phase. Ojovan [8,9] pointed out that the crystallized glass phase is a glass crystalline material (abbreviation GCM) that is, thermodynamically speaking, a more stable material compared to the original glass before crystallization. Therefore, crystallization of the glass phase under the solid phase at elevated temperatures can effectively improve the stability and strength of the glass phase. Thus, it is of great significance to reduce the amount of the glass phase to obtain high-quality sinter.
The glass phase and calcium ferrite belong to the bonding phase of the sinter; these are products of the liquid phase during the cooling process in the sinter. Thus, the formation of calcium ferrite could significantly influence the structure and amount of the glass phase. In terms of calcium ferrite, our predecessors have conducted much research into calcium ferrite. Many studies [10,11,12,13] have revealed that there are mainly two kinds of complex calcium ferrite in an elemental sintered ore: SFCA (low Fe, high Si, and high Al) and SFCA-I (high Fe, low Si, and low Al). The morphology of SFCA-I is usually acicular, while SFCA is usually columnar or lath-like. Compared with SFCA, SFCA-I has better properties [14]. Webster et al. [15] discussed the effect of different alumina sources on the thermal stability and formation mechanisms of SFCA and SFCA-I. However, in terms of the glass phase, there is hardly any research focusing on avoiding or eliminating its formation.
Moreover, Al2O3 is a network intermediate oxide present between the network former and the network exosome in the glass network structure. Regarding slag systems containing Al2O3, many researchers pay attention to the effect of Al2O3 on the network structure. Kim [16] pointed out that increasing the content of Al2O3 will lead to an increase in the polymerization degree and viscosity of continuous casting mold powder, which will lead to the weakening of the mold powder’s crystallization ability. Cho [17] found that a mold powder with high Al2O3 content is easy to crystallize and is not conducive to lubrication. Lu [18] studied the transformation of CaO-SiO2-based mold slag into CaO-SiO2-Al2O3-based mold slag and pointed out that the crystalline mineral phase of the slag sample is quite different from that of the CaO-SiO2 during the cooling process. Kim [19] studied the rheological properties of mold slag with a high Al2O3 content and found that the melt structure is closely related. In a glass with an Al2O3 content of less than 2 mass pct, Al2O3 almost exists in the form of tetracoordinate. In medium/high-alumina silicate glass, aluminum contains two kinds of coordination: one is tetracoordinate and in this case, Al3+ is located in a tetrahedron to form an aluminum–oxygen tetrahedron [AlO4]; the other shows hexagonal coordination—that is, Al3+ is located in the octahedron to form an aluminum–oxygen octahedron [AlO6] [20]. As the main component of the gauge phase in the sinter, Al2O3 significantly influences the formation of the binding phase. However, there is no systematic study regarding the effect of Al2O3 on the structural changes of binding phases, especially the glass phase.
In this work, first, the CaO-SiO2-Al2O3 glass phase, with different R and Al2O3, was synthesized according to the glass phase composition of high-basicity sintered ore. Then, the glass phase was crystallized at a constant temperature to explore the influence of the composition on glass-phase crystallization. Finally, the CaO-SiO2-Al2O3 glass phase prepared in the laboratory was tested by Raman spectroscopy, and the relationship between the crystalline properties and the structure of the glass phase was discussed. This research has important guiding significance for improving the quality of sinter.
2. Experimental Procedures
2.1. Preparation of Samples
Analytical grade (AR) CaCO3, SiO2, and Al2O3 reagents were used. Because CaO has strong water absorption, it is easy for weighing errors to occur, so equimolar CaCO3 was used instead of CaO. The actual glass phase of sintered ore is mainly composed of a CaO-SiO2-Al2O3 slag system, while the binary basicity (R) range is close to 0.8–1.2; the Al2O3 content was fixed at around 9–12 mass pct, according to the study by Long [21]. Figure 1 shows the chemical composition point of the glass phase, which has been marked in the phase diagram, and the corresponding primary crystal region is CaSiO3. Table 1 and Table 2 present the composition ratio of the CaO-SiO2-Al2O3 system, with different R and Al2O3 contents. The liquidus temperature (LT*) is calculated using FactSage software (Version 8.1, Thermfact/CRCT (Montreal, QC, Canada) and GTT-Technology (Aachen, Germany)) to ensure that the slag is in a pure liquid phase at 1600 °C. The samples from each group (50 g) are ground and mixed in a mortar grinder (Fritsch, Idar-Oberstein, Germany) for 1 h, then pressed into a cylinder with a diameter of 30 mm × 20 mm using a DY electro-hydraulic sample press, under a pressure of 10 MPa for 3 min.
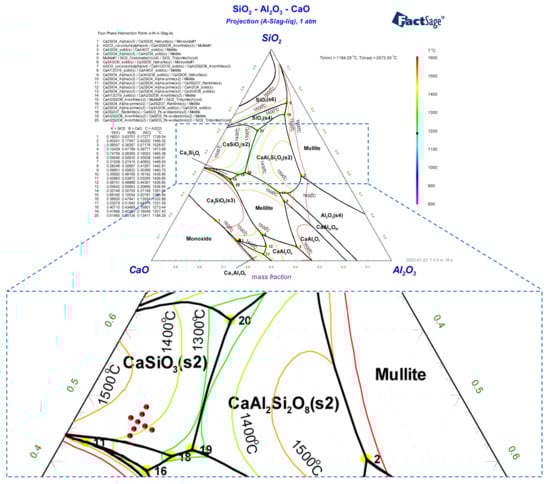
Figure 1.
Phase diagram of the CaO-SiO2-Al2O3 system.

Table 1.
Composition ratios of the CaO-SiO2-Al2O3 system with different R (mass %).
Table 2.
Composition ratios of the CaO-SiO2-Al2O3 system with different Al2O3 contents (mass %).
2.2. Sinter Preparation
As shown in Figure 2, the sample precursor (green body) was put into a graphite crucible, which was heated to 1600 °C in a high-temperature tubular resistance furnace (Prekanda, Luoyang, China) in an Ar (≥99.999%) atmosphere with a gas flow rate of 1 L/min, at a heating rate of 5 °C/min. After 2 h of holding time, the sample was poured into a stainless-steel plate and cooled with liquid nitrogen for quenching. Three pieces were randomly selected for inlaying with epoxy resin ethylenediamine, and phase detection was carried out after grinding the samples. The remaining sample was crushed to 100 μm for measurement with X-ray diffraction and Raman spectroscopy.
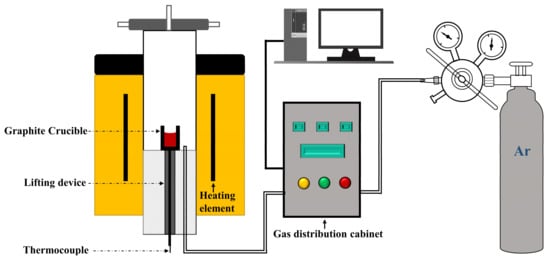
Figure 2.
Schematic diagram of the experimental device.
2.3. Phase Determination
A Bruker D8 X-ray diffractometer (XRD, λ = 1.54 Å) (Rigaku Corporation, Tokyo, Japan) with Cu Kα radiation (40 kV, 40 mA, 10° min−1 from 10 to 90°) was used to probe the crystallographic structure of the above-prepared materials. The XRD data were analyzed using the Crystallographica Search-Match software (CSM3.0, Oxford Cryosystems Ltd., Oxford, UK). Samples for scanning electron microscopy (SEM) imaging were deposited on conducting resin in an FEI Quanta 250 of SEM (Field Electron and Ion corporation, Hillsboro, OR, USA) at 30 kV, equipped with a dispersive energy X-ray (EDS) spectroscope (Bruker Nano GmbH, Berlin, Germany). The chemical composition of different phases was qualitatively studied using this method.
The samples were analyzed using a LabRAM HR Evolution Raman microscope (Horiba Corporation, Kyoto, Japan) with a 532 nm solid-state laser used as the light source, with a power of 100 mW. The measurement threshold of the instrument was as low as 10 cm−1. The test parameters were: laser power 10%, exposure time 10 s, scanning times 6, continuous scanning mode, scanning range 200–1600 cm−1. Since the sample was in the form of glass with liquid nitrogen quenching after high-temperature pre-melting, the composition was uniform and, thus, the influence of the spot size on the results can be ignored. The crystalline Si standard sample was used to calibrate the laser Raman spectrum of the selected wavelength. The percentage of the total peak area occupied by each peak reflects the relative content of the chemical bonds represented by the peak, to a certain extent; to facilitate the comparison of the changes in the relative content of various chemical bonds, the percentage occupied by each peak area is calculated.
3. Results and Discussion
3.1. Synthesis of Glass Phase
Figure 3 and Figure 4 show the XRD patterns of the synthesized CaO-SiO2-Al2O3 glassy phases with different alkalinities and Al2O3 contents. Although the chemical composition has changed, their scattering peaks are almost the same, and “the hump” only appears between 2θ = 15~37.5°, indicating that several of the glass phases synthesized are pure vitreous phases. The SEM-EDS and surface scan photo results of the glass phase samples with different alkalinities, as shown in Figure 5 and Table 3, also confirmed the purity of these synthesized glassy phases.
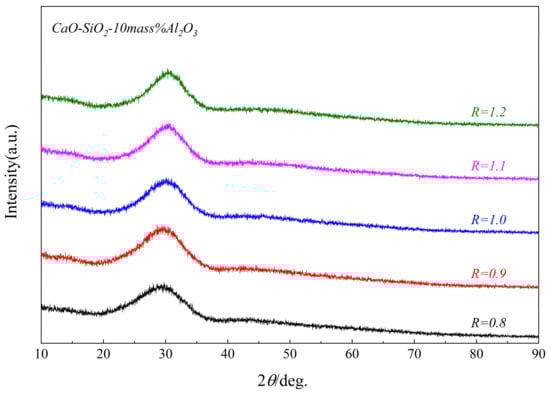
Figure 3.
XRD patterns of samples with different R glass phases.
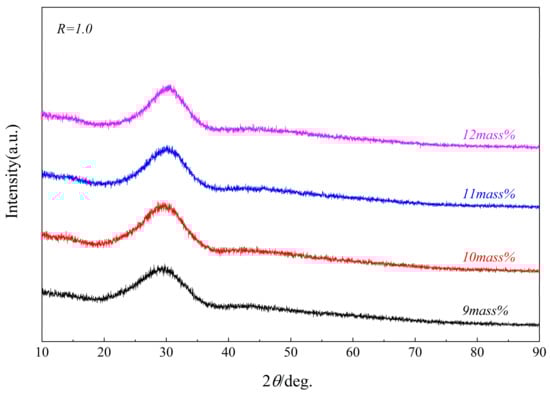
Figure 4.
XRD patterns of samples with different Al2O3 glass phases.
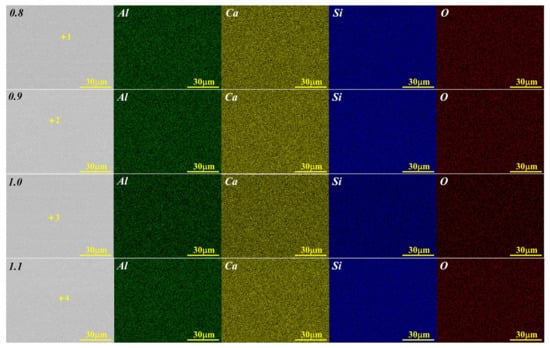
Figure 5.
SEM and surface-scan photos of glass phases with a different R.
Table 3.
The EDS results of the corresponding marked points in Figure 5.
3.2. Study of the Crystallization Mechanism of the CaO-SiO2-Al2O3 Glass Phase
The next stage of the study was to investigate the crystallization sequence of the glass phase (Sample No. 3). Figure 6 shows the XRD patterns of the glass phase, quenched in liquid nitrogen and then kept at 950 °C for crystallization at different time periods. The study found that no crystals were formed after holding for 5 min. When holding for 30 min, the CaSiO3 crystallized, which was consistent with the thermodynamic calculation result, as shown in Figure 1. When the holding time increased to 1 h, the second phase, CaAl2O4, crystallized, wherein the intensity of the diffraction peak continuously increased as the holding time was prolonged. The final precipitation phase is of CaSiO3 and CaAl2O4.
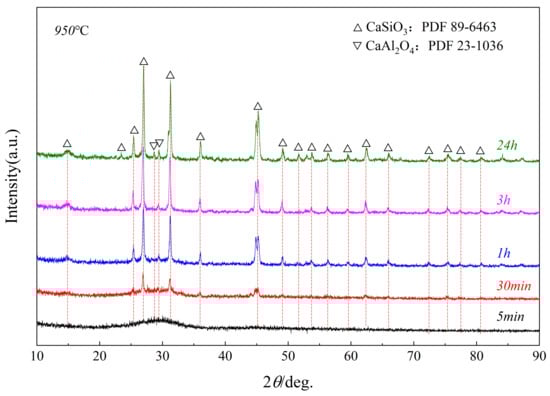
Figure 6.
XRD pattern of Sample No. 3 at a constant temperature and at different times.
3.3. Effect of Basicity on the Crystallization of the CaO-SiO2-Al2O3 Glass Phase
Figure 7 shows the XRD patterns of the synthesized CaO-SiO2-Al2O3 glass phase with different basicity, held at 950 °C for 1 h. It was found that the crystallinity of the glassy phase decreased with the increase in basicity, which indicated that increasing the basicity is not conducive to the formation of CaAl2O4 and CaSiO3. To explain the relationship between crystalline properties and the structure of the glassy phase, Raman scattering was used to study the glassy phase in the following parts.
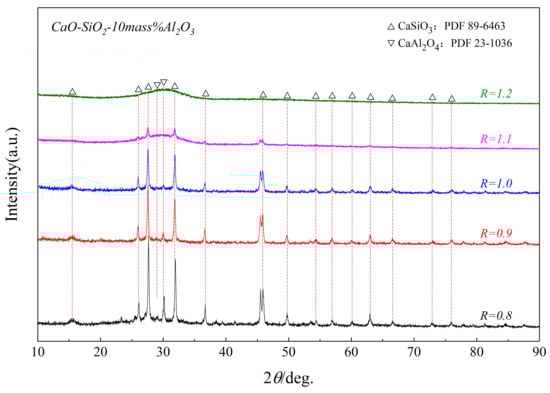
Figure 7.
XRD patterns of samples with different R glass phases after being held at a constant temperature of 950 °C for 1 h.
Raman spectroscopy could provide quantitative structural information on the CaO-SiO2-Al2O3 glass phase; for example, its degree of polymerization. An insight into mold flux structure plays a vital role in understanding transport properties, such as the viscosity of mold flux during casting [22]. For the present study, the Q3/Q2 ratio is regarded as the degree of polymerization, identified by following the equilibrium reaction among silicate units:
where K is the equilibrium constant of Equation (2); hence, the Q3/Q2 ratio is directly proportional to Q4, the concentration of a highly polymerized unit [23]. As it is difficult to detect Q4 units with Raman spectra due to their low intensity in a mixed silicate system, there is no choice but to use just such an indirect method to quantify the degree of polymerization.
Si2O5 = SiO3 + SiO2
According to the basic theory of Raman spectroscopy, molecular numbers are quantified using the peak area rather than peak height. In this study, the peak area was considered an indicator of concentration. Figure 8 shows the Raman spectroscopic data of the CaO-SiO2-Al2O3 glassy phase, with an increasing R-value. The positions of each peak after de-specification and the total peak area occupied by each peak are shown in Table 4. The percentage of the area is shown in Table 5. For a multi-component silicate slag system, the Raman shift in the range of 400–1200 cm−1 belongs to the stretching vibration of a silicon-oxygen tetrahedron (SiO4)i−, corresponding to the different silicon-oxygen tetrahedral structural units (Qn: n is the number of bridging oxygens in the tetrahedron). Since the glass phase in the sinter is mainly composed of CaO, SiO2, and Al2O3, the cations in the slag will change when the R is changed, resulting in a shift in the position of the characteristic peak.
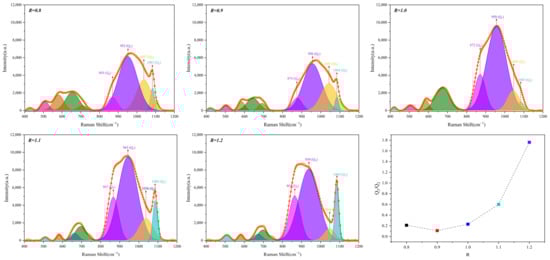
Figure 8.
Raman spectra of glassy phase samples with different basicity.
Table 4.
Glassy phase characteristic peak positions and reference data for different R values.
Table 5.
Relative contents of the characteristic peaks of the glass phase with different R values.
The primary reference data for the determination of each characteristic peak in this paper is shown in Table 4. It can be seen from Figure 8 and Table 4 that with the change in the content of the main components, CaO and SiO2, in the slag, the spectrum of the slag sample changes significantly. As the content of SiO2 decreases, the relative content of Q0 increases continuously; Q1 increases first and then decreases, while Q3/Q2 first decreases and then increases, indicating that the degree of polymerization of the glass phase samples increases obviously, resulting in the deterioration of the crystallization of the glass phase. It was observed that the peak area of 867 cm−1 increased with the rise in alkalinity, indicating that the Si-O− symmetric stretching vibration in [SiO4]4− increased. The non-bridging oxygen vibration frequency of Si-Onb in the network is produced by the symmetric stretching vibration of Si-Onb. The content of SiO2 in the glass phase is relatively lower than that of the basic oxides; part of the Al acts as an acid oxide to supplement the network. Thus, the characteristic peaks related to the [AlO4] tetrahedron appear on the spectrum. In addition, the formation of the [AlO4] tetrahedron requires that alkaline oxides are consumed to provide a charge compensation effect so that the content of alkaline oxides used for disconnection is reduced; although the relative content of SiO2 decreases, the relative content of Q3 gradually increases with the increase in R. Due to the poor stability of the isolated [AlO4] tetrahedron, the surrounding SiO4 tetrahedron should be connected. The presence of the characteristic peak of Si-O-Al is found near 680 cm−1.
For the CaO-SiO2-Al2O3 slag system under experimental conditions, glass phases with different degrees of polymerization can be obtained by adjusting the CaO/SiO2 content, which is beneficial for controlling the formation of glass phases. In addition, the generation of CaSiO3 and CaAl2O4 in the CaO-SiO2-Al2O3 slag system can be controlled by adjusting the CaO/SiO2 content in the slag sample. Therefore, for CaO-SiO2-Al2O3, changing the CaO/SiO2 content can obtain different Qn distributions and result in a sinter with varying properties.
3.4. Effect of Al2O3 on the Crystallization of the CaO-SiO2-Al2O3 Glass Phase
Figure 9 and Figure 10 show the XRD patterns of samples with different Al2O3 glass phases after being kept at 950 °C and 1000 °C for 1 h. The study found that the crystallization ability of the glass phase weakened with the increase in Al2O3. When the Al2O3 content was 9 mass pct to 10 mass pct, the glass phase crystallized into two phases, CaAl2O4 and CaSiO3. When the Al2O3 content reached 12 mass pct, no crystalline phase was formed.
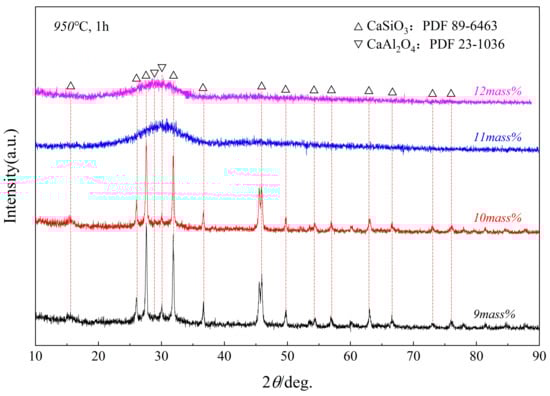
Figure 9.
XRD patterns of samples of glass phases with different Al2O3 contents after being held at a constant temperature of 950 °C for 1 h.
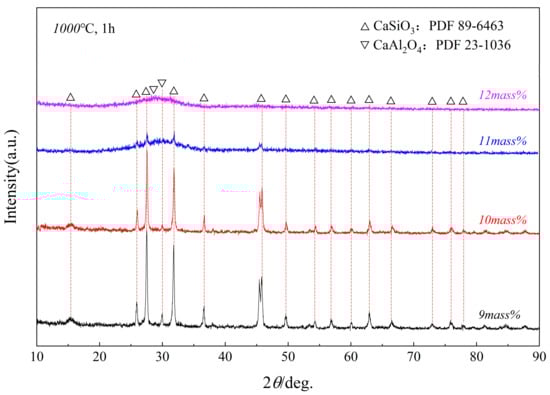
Figure 10.
XRD patterns of samples of glass phases with different Al2O3 contents after being held at a constant temperature of 1000 °C for 1 h.
The Raman spectra of glassy phase samples with different Al2O3 contents are shown in Figure 11, and the position of each peak and the area percentage of this peak in the entire mountain range are shown in Table 6 and Table 7. As the content of Al2O3 in the glass phase increases, the Q0 gradually increases, while Q1 does not begin to change significantly. When Al2O3 reaches 12 mass pct, Q1 rises sharply, while Q2 and Q3 decrease progressively. When the acidic oxides, such as Al2O3, in the glass phase are high, a gradual decrease appears in Q2 and Q3. Figure 12 shows that the slag polymerization degree (Q3/Q2) value is small and relatively close. Therefore, the main reason for the deterioration of glass phase crystallization is the increase in Q0.
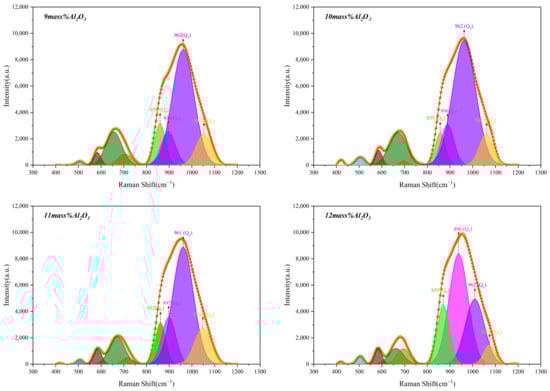
Figure 11.
Raman spectra of glassy phase samples with different Al2O3 contents.
Table 6.
Glassy phase characteristic peak positions and reference data for different Al2O3 contents.
Table 7.
Relative contents of the characteristic peaks of glass phases, with different Al2O3 contents.
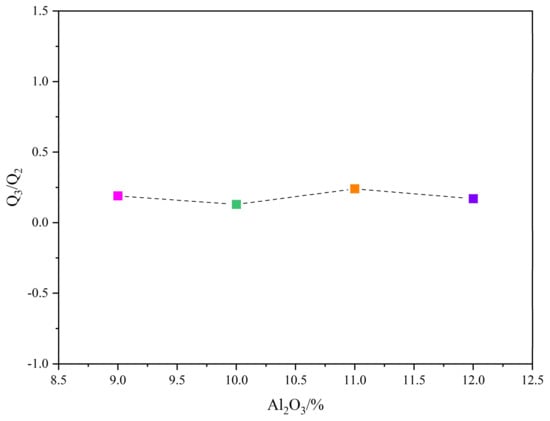
Figure 12.
Degree of polymerization of the glassy phase samples with different Al2O3 contents.
As the content of SiO2 in the slag is high and that of Al2O3 is relatively low, the network modifier (CaO) is mainly used to destroy the silicate network structure and does not participate in the Al3+ charge compensation effect to form the [AlO4] tetrahedral structure. Therefore, with the increase in Al2O3 content, the characteristic peaks around 506, 675, and 712 cm−1 exist stably. According to the Raman spectroscopy of CaO-CaAl2O4 series glasses, as investigated by McMillan [24], the characteristic peaks near 506 and 712 cm−1 are the distinct peaks of Al-O-Al bonds, formed by connecting [AlO4] tetrahedra with other tetrahedra. The expected rise near 712 cm−1 is related to the non-bridging oxygen bond of AlO existing in the tetrahedron. Kim et al. [19] pointed out that the typical height near 712 cm−1 is associated with Si-O-Al. Therefore, the distinct peaks around 506, 675, and 712 cm−1 can be seen to develop Al-formation [AlO4] tetrahedra as hallmarks of network formers.
4. Conclusions
In this paper, the effect of basicity and Al2O3 content on the formation of the glass phase in the CaO-SiO2-Al2O3 ternary system are analyzed through crystallization, combined with XRD and optical microscopy. At the same time, the relationship between glass phase structure and crystallization was analyzed by Raman spectroscopy. The main conclusions are as follows:
- (1)
- The glass phase of sintered ore is mainly composed of CaO-SiO2-Al2O3, while the structure of slag is primarily composed of Q0, Q1, Q2, and Q3 structural units, which can be controlled by adjusting the distribution of Qn in the slag sample.
- (2)
- The R and Al2O3 values significantly affect the crystallization of the CaO-SiO2-Al2O3 glass phase. At the range of 0.8~1.2, the increasing R is not beneficial for the crystallization of the glass phase. Increasing the content of Al2O3 (9~12%) inhibits the crystallization of the glass phase.
- (3)
- When the chemical composition of the glass phase sample is 45mass%CaO-45mass%SiO2-10mass%Al2O3, the crystallization order is CaSiO3 → CaAl2O4, by recrystallization at 950 °C.
- (4)
- Raman spectroscopic analysis showed that the polymerization (Q3/Q2) degree was enhanced with the increase in R, resulting in the deterioration of the crystallinity of the glass phase. Although increasing the content of Al2O3 has little effect on the polymerization degree, the formation of [SiO4] tetrahedra (Q0) was promoted, which is the main reason for the deterioration of glass phase crystallization.
Author Contributions
Conceptualization, R.-F.X. and X.-M.G.; methodology, R.-F.X.; software, R.-F.X.; investigation, R.-F.X.; writing—original draft preparation, R.-F.X.; writing—review and editing, R.-F.X. and X.-M.G.; supervision, X.-M.G. All authors have read and agreed to the published version of the manuscript.
Funding
This research is supported by the National Natural Science Foundation of China (No.51774029 and U1460201) for the financial support of this research.
Data Availability Statement
Data are contained within the article.
Conflicts of Interest
The corresponding author states that there is no conflict of interest on behalf of all authors.
References
- Cores, A.; Babich, A.; Muñiz, M.; Ferreira, S.; Mochon, J. The Influence of Different Iron Ores Mixtures Composition on the Quality of Sinter. ISIJ Int. 2010, 50, 1089–1098. [Google Scholar] [CrossRef]
- Nicol, S.; Chen, J.; Pownceby, M.I.; Webster, N.A.S. A Review of the Chemistry, Structure and Formation Conditions of Silico-Ferrite of Calcium and Aluminum (‘SFCA’) Phases. ISIJ Int. 2018, 58, 2157–2172. [Google Scholar] [CrossRef]
- Pimenta, H.P.; Seshadri, V. Influence of Al2O3 and TiO2 degradation behavior of sinter and hematite at low temperatures on reduction. Ironmak. Steelmak. 2013, 29, 175–179. [Google Scholar] [CrossRef]
- Goldring, D.C.; Fray, T.A.T. Characterization of iron ores for production of high-quality sinter. Ironmak. Steelmak. 1989, 16, 83–89. [Google Scholar]
- Loo, C.E.; Wan, K.T.; Howes, V.R. Mechanical properties of natural and synthetic mineral phases in sinters having varying reduction degradation indices. Ironmak. Steelmak. 1988, 15, 279–285. [Google Scholar]
- Guo, H.; Guo, X.M. Effect of Aluminum Dissolved in Hematite on Formation of Calcium Ferrites at 1473 K. Metall. Mater. Trans. B 2018, 49, 1974–1984. [Google Scholar] [CrossRef]
- Ding, C.Y.; Lv, X.W.; Chen, Y.; Bai, C.G. Crystallization Kinetics of 2CaO·Fe2O3 and CaO·Fe2O3 in the CaO–Fe2O3 System. ISIJ Int. 2016, 56, 1157–1163. [Google Scholar] [CrossRef]
- Ojovan, M.I. The Modified Random Network (MRN) Model within the Configuron Percolation Theory (CPT) of Glass Transition. Ceramics 2021, 4, 121–134. [Google Scholar] [CrossRef]
- Ojovan, M.I.; Petrov, V.I.; Yudintsev, S.V. Glass Crystalline Materials as Advanced Nuclear Wasteforms. Sustainability 2021, 13, 4117. [Google Scholar] [CrossRef]
- Patrick, T.R.C.; Pownceby, M.I. Stability of silico-ferrite of calcium and aluminum (SFCA) in air-solid solution limits between 1240 °C and 1390 °C and phase relationships within the Fe2O3-CaO-Al2O3-SiO2 (FCAS) system. Metall. Mater. Trans. B 2002, 33, 79–89. [Google Scholar] [CrossRef]
- Webster, N.A.S.; Pownceby, M.I.; Madsen, I.C.; Kimpton, J.A. Silico-ferrite of Calcium and Aluminum (SFCA) Iron Ore Sinter Bonding Phases: New Insights into Their Formation During Heating and Cooling. Metall. Mater. Trans. B 2012, 43, 1344–1357. [Google Scholar] [CrossRef]
- Webster, N.A.S.; Churchill, J.G.; Tufaile, F.; Pownceby, M.I.; Manuel, J.R.; Kimpton, J.A. Fundamentals of Silico-Ferrite of Calcium and Aluminium (SFCA) and SFCA-I Iron Ore Sinter Bonding Phase Formation: Effects of Titanomagnetite-based Ironsand and Titanium Addition. ISIJ Int. 2016, 56, 1715–1722. [Google Scholar] [CrossRef]
- Yajima, K.; Jung, S.M. Data Arrangement and Consideration of Evaluation Standard for Silico-Ferrite of Calcium and Aluminum (SFCA) Phase in Sintering Process. ISIJ Int. 2012, 52, 535–537. [Google Scholar] [CrossRef][Green Version]
- Hsieh, L.H.; Whiteman, J.A. Effect of Raw Material Composition on the Mineral Phases in Lime-fluxed Iron Ore Sinter. ISIJ Int. 1993, 33, 462–473. [Google Scholar] [CrossRef]
- Webster, N.A.S.; O’Dea, D.P.; Ellis, B.G.; Pownceby, M.I. Effects of Gibbsite, Kaolinite and Al-rich Goethite as Alumina Sources on Silico-Ferrite of Calcium and Aluminium (SFCA) and SFCA-I Iron Ore Sinter Bonding Phase Formation. ISIJ Int. 2017, 57, 41–47. [Google Scholar] [CrossRef]
- Kim, G.H.; Sohn, I. Effect of Al2O3 on the viscosity and structure of calcium silicate-based melts containing Na2O and CaF2. J. Non-Cryst. Solids 2012, 358, 1530–1537. [Google Scholar] [CrossRef]
- Cho, J.W.; Blazek, K.; Frazee, M.; Yin, H.B.; Park, J.H.; Moon, S.W. Assessment of CaO–Al2O3 Based Mold Flux System for High Aluminum TRIP Casting. ISIJ Int. 2013, 53, 62–70. [Google Scholar] [CrossRef]
- Lu, B.; Chen, K.; Wang, W.L.; Jiang, B. Effects of Li2O and Na2O on the Crystallization Behavior of Lime-Alumina-Based Mold Flux for Casting High-Al Steels. Metall. Mater. Trans. B 2014, 45, 1496–1509. [Google Scholar] [CrossRef]
- Kim, G.H.; Kim, C.S.; Sohn, I. Viscous Behavior of Alumina Rich Calcium-Silicate Based Mold Fluxes and Its Correlation to the Melt Structure. ISIJ Int. 2013, 53, 170–176. [Google Scholar] [CrossRef]
- Tian, Y.L.; Sun, S.B. New Glass Technology; China Light Industry Press: Beijing, China, 2011; pp. 1–17. [Google Scholar]
- Long, H.M. Iron Ore Powder Sintering Principle and Technology; Metallurgical Industry Press: Beijing, China, 2010; pp. 32–50. [Google Scholar]
- Mysen, B.O.; Virgo, D.; Neumann, E.R.; Seifert, F.A. Redox equilibria and the structural states of ferric and ferrous iron in melts in the system CaO-MgO-Al2O3-SiO2-Fe-O; relationships between redox equilibria, melt structure and liquidus phase equilibria. Am. Mineral. 1985, 70, 317–331. [Google Scholar]
- Shin, S.H.; Cho, J.W.; Kim, S.H. Shear Thinning Behavior of Calcium Silicate-Based Mold Fluxes at 1623 K. Am. Ceram. Soc. 2014, 10, 3263–3269. [Google Scholar] [CrossRef]
- McMillan, P.; Piriou, B. Raman spectroscopy of calcium aluminate glasses and crystals. J. Non-Cryst. Solids 1983, 55, 221–242. [Google Scholar] [CrossRef]
Publisher’s Note: MDPI stays neutral with regard to jurisdictional claims in published maps and institutional affiliations. |
© 2022 by the authors. Licensee MDPI, Basel, Switzerland. This article is an open access article distributed under the terms and conditions of the Creative Commons Attribution (CC BY) license (https://creativecommons.org/licenses/by/4.0/).