
Improvements in the Microstructure and Mechanical Properties of Aluminium Alloys Using Ultrasonic-Assisted Laser Welding

 ,
,  and
and
Abstract
:1. Introduction
2. Experimental Procedure
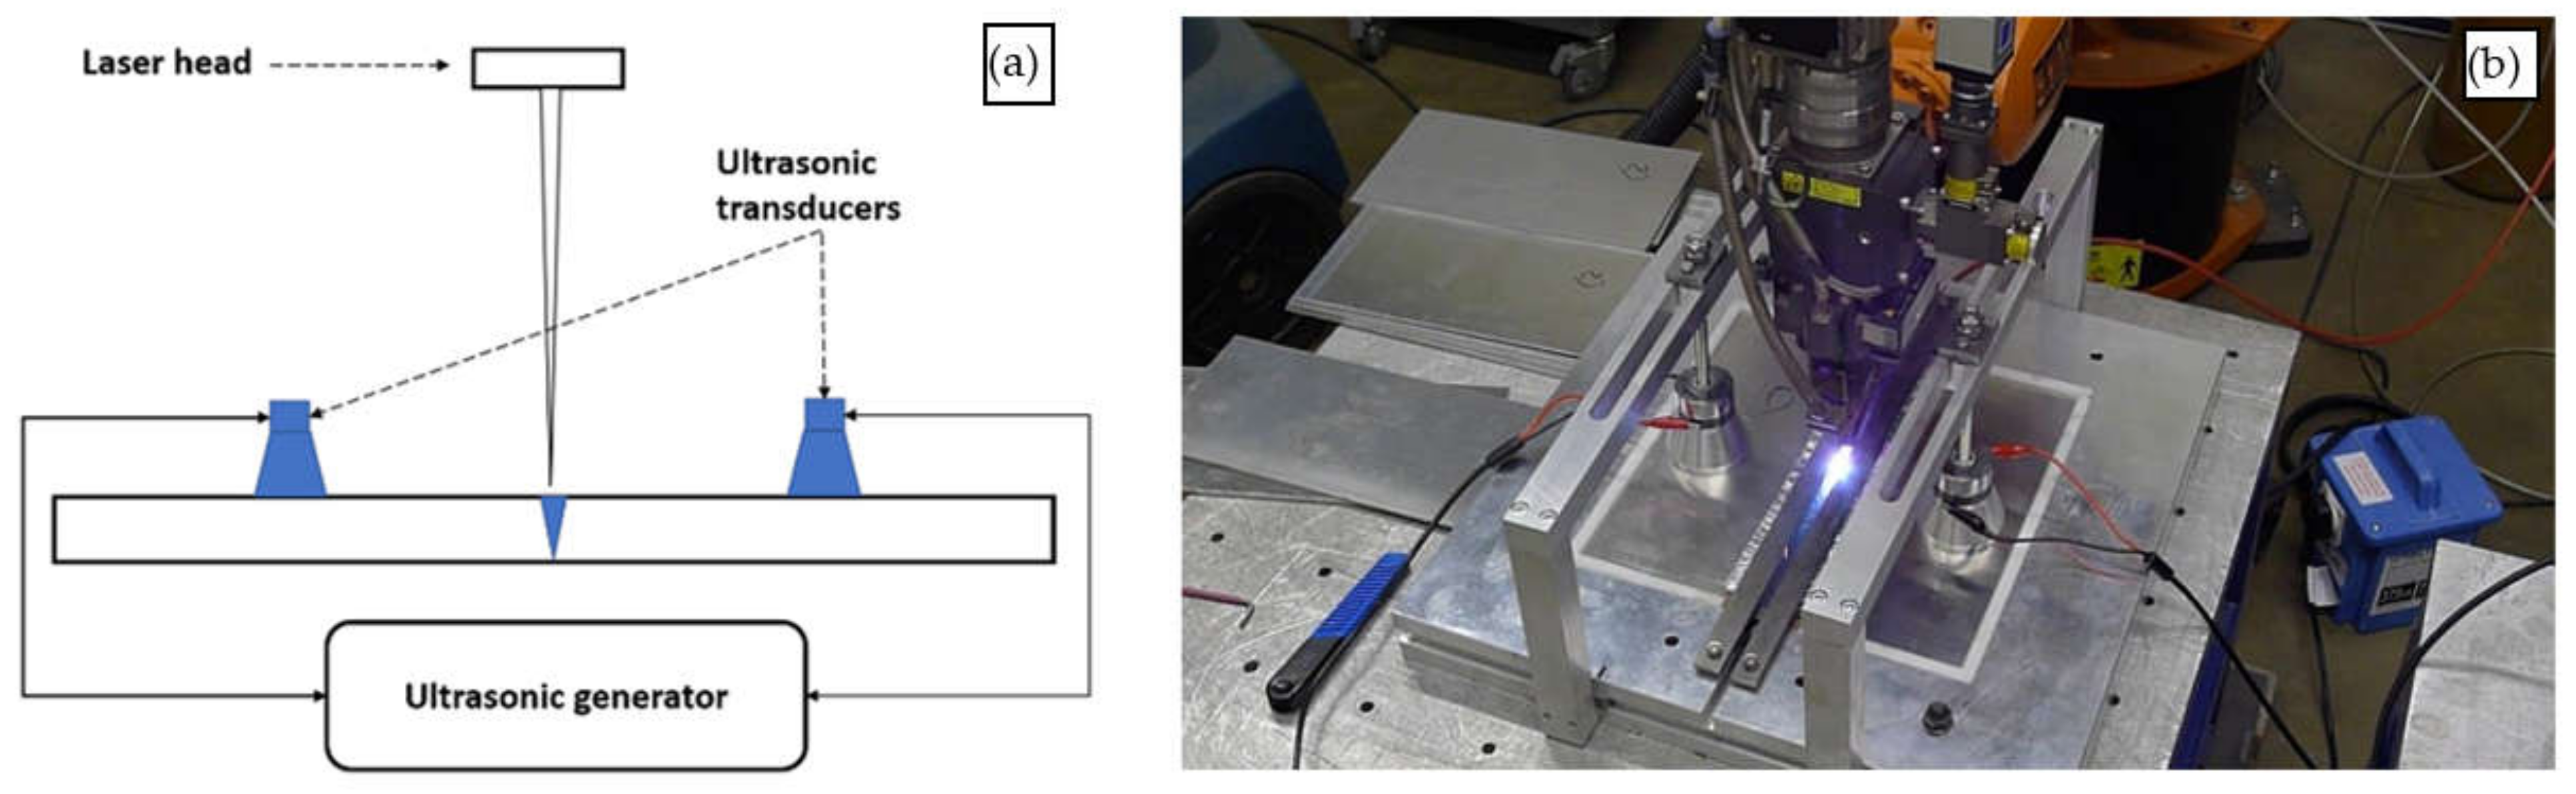
2.1. Laser Welding Set-Up
2.2. Sample Preparation
3. Results and Discussion
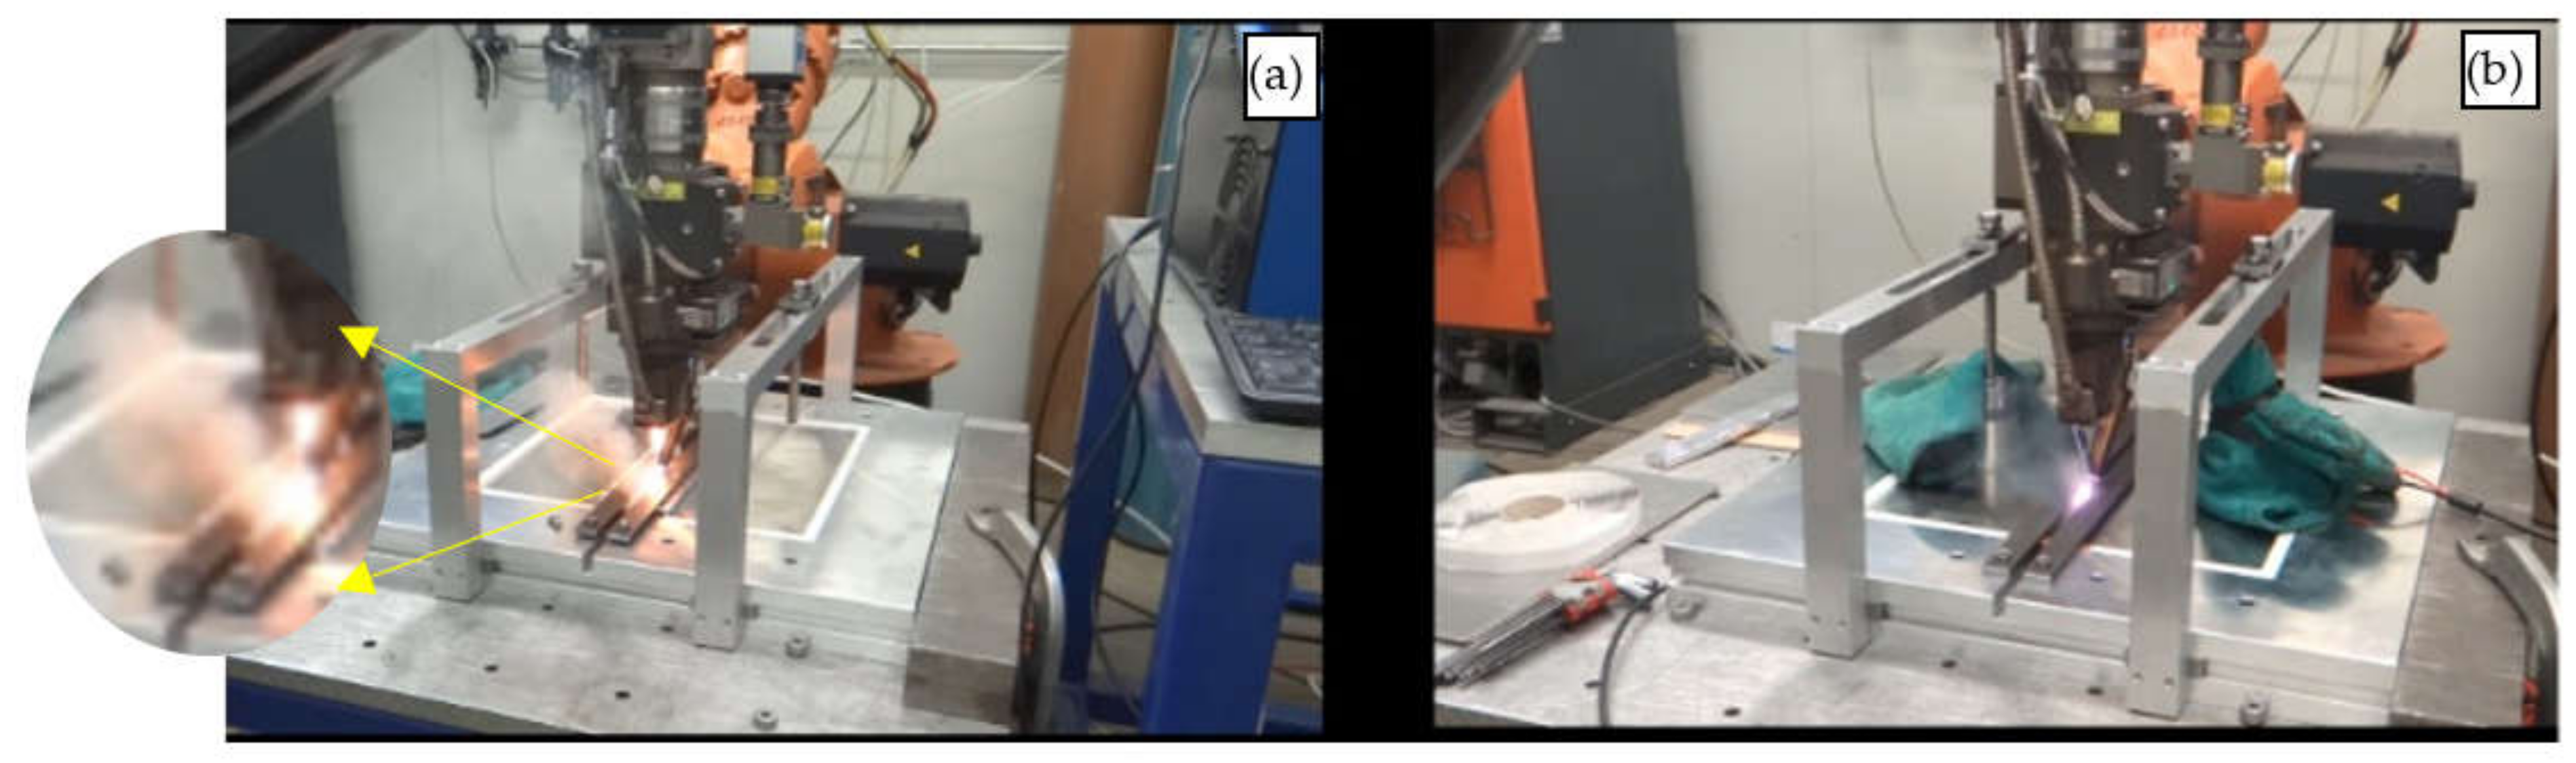
3.1. Plasma Cloud
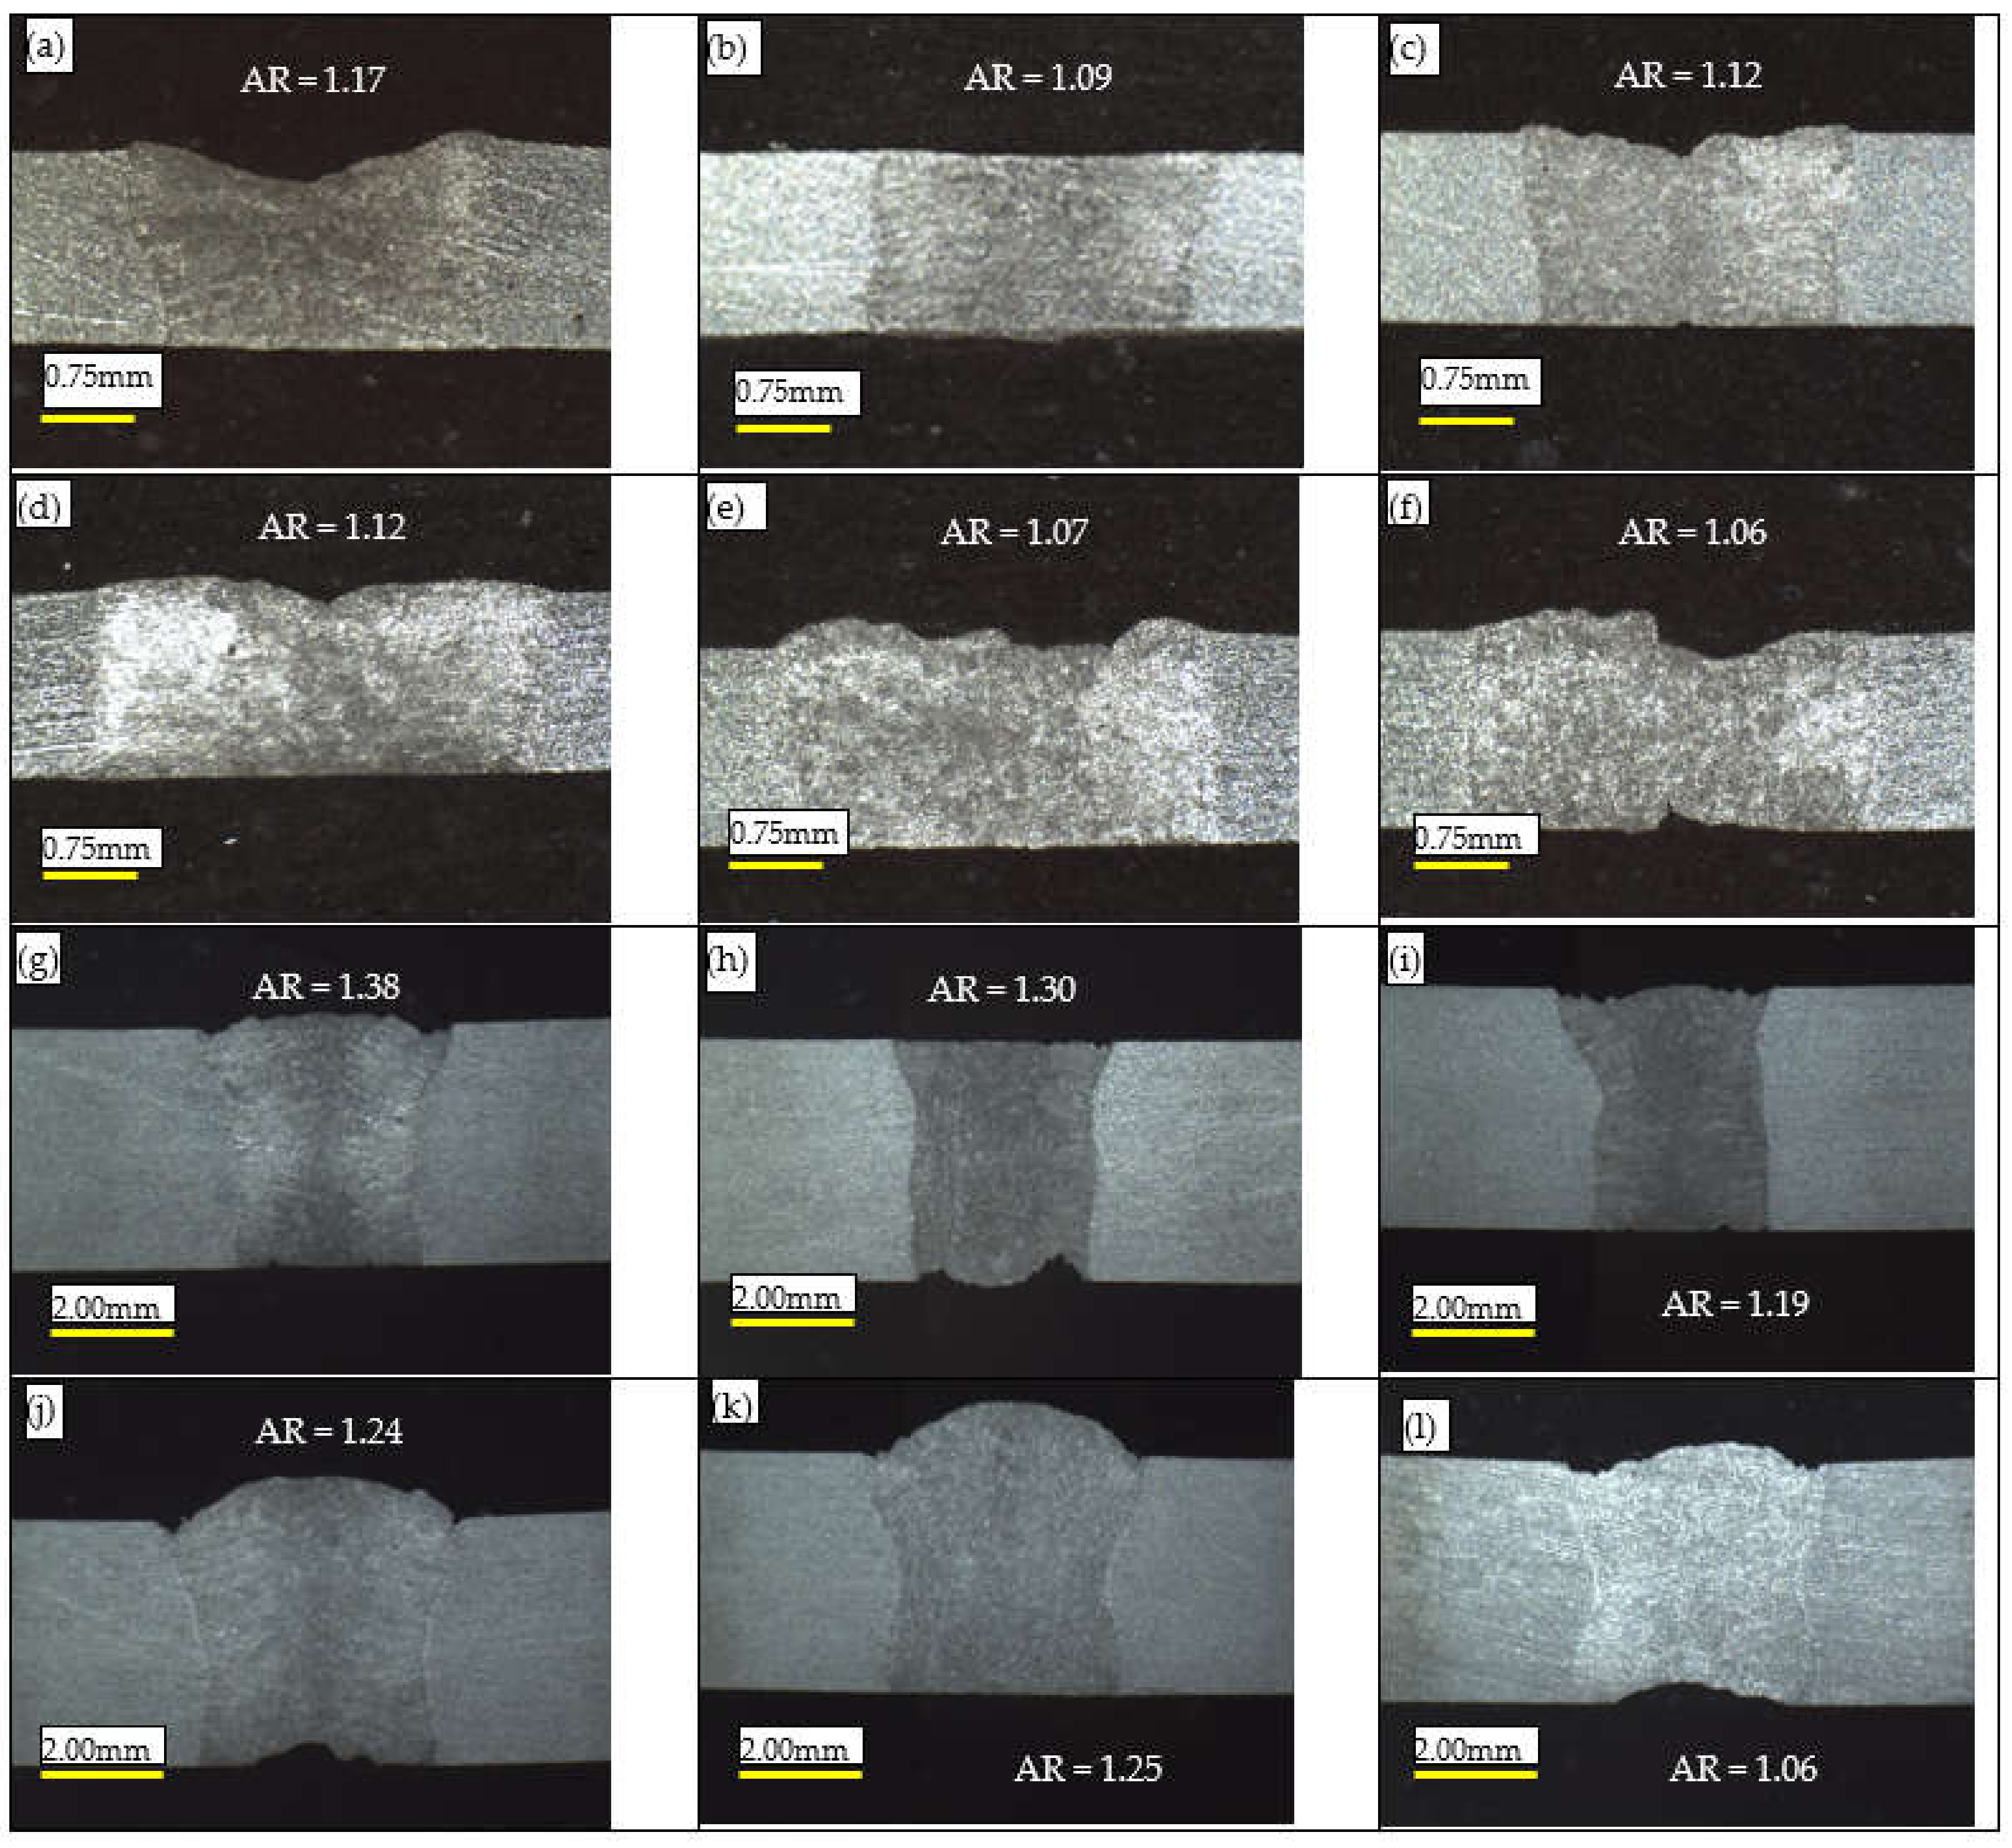
3.2. Aspect Ratio
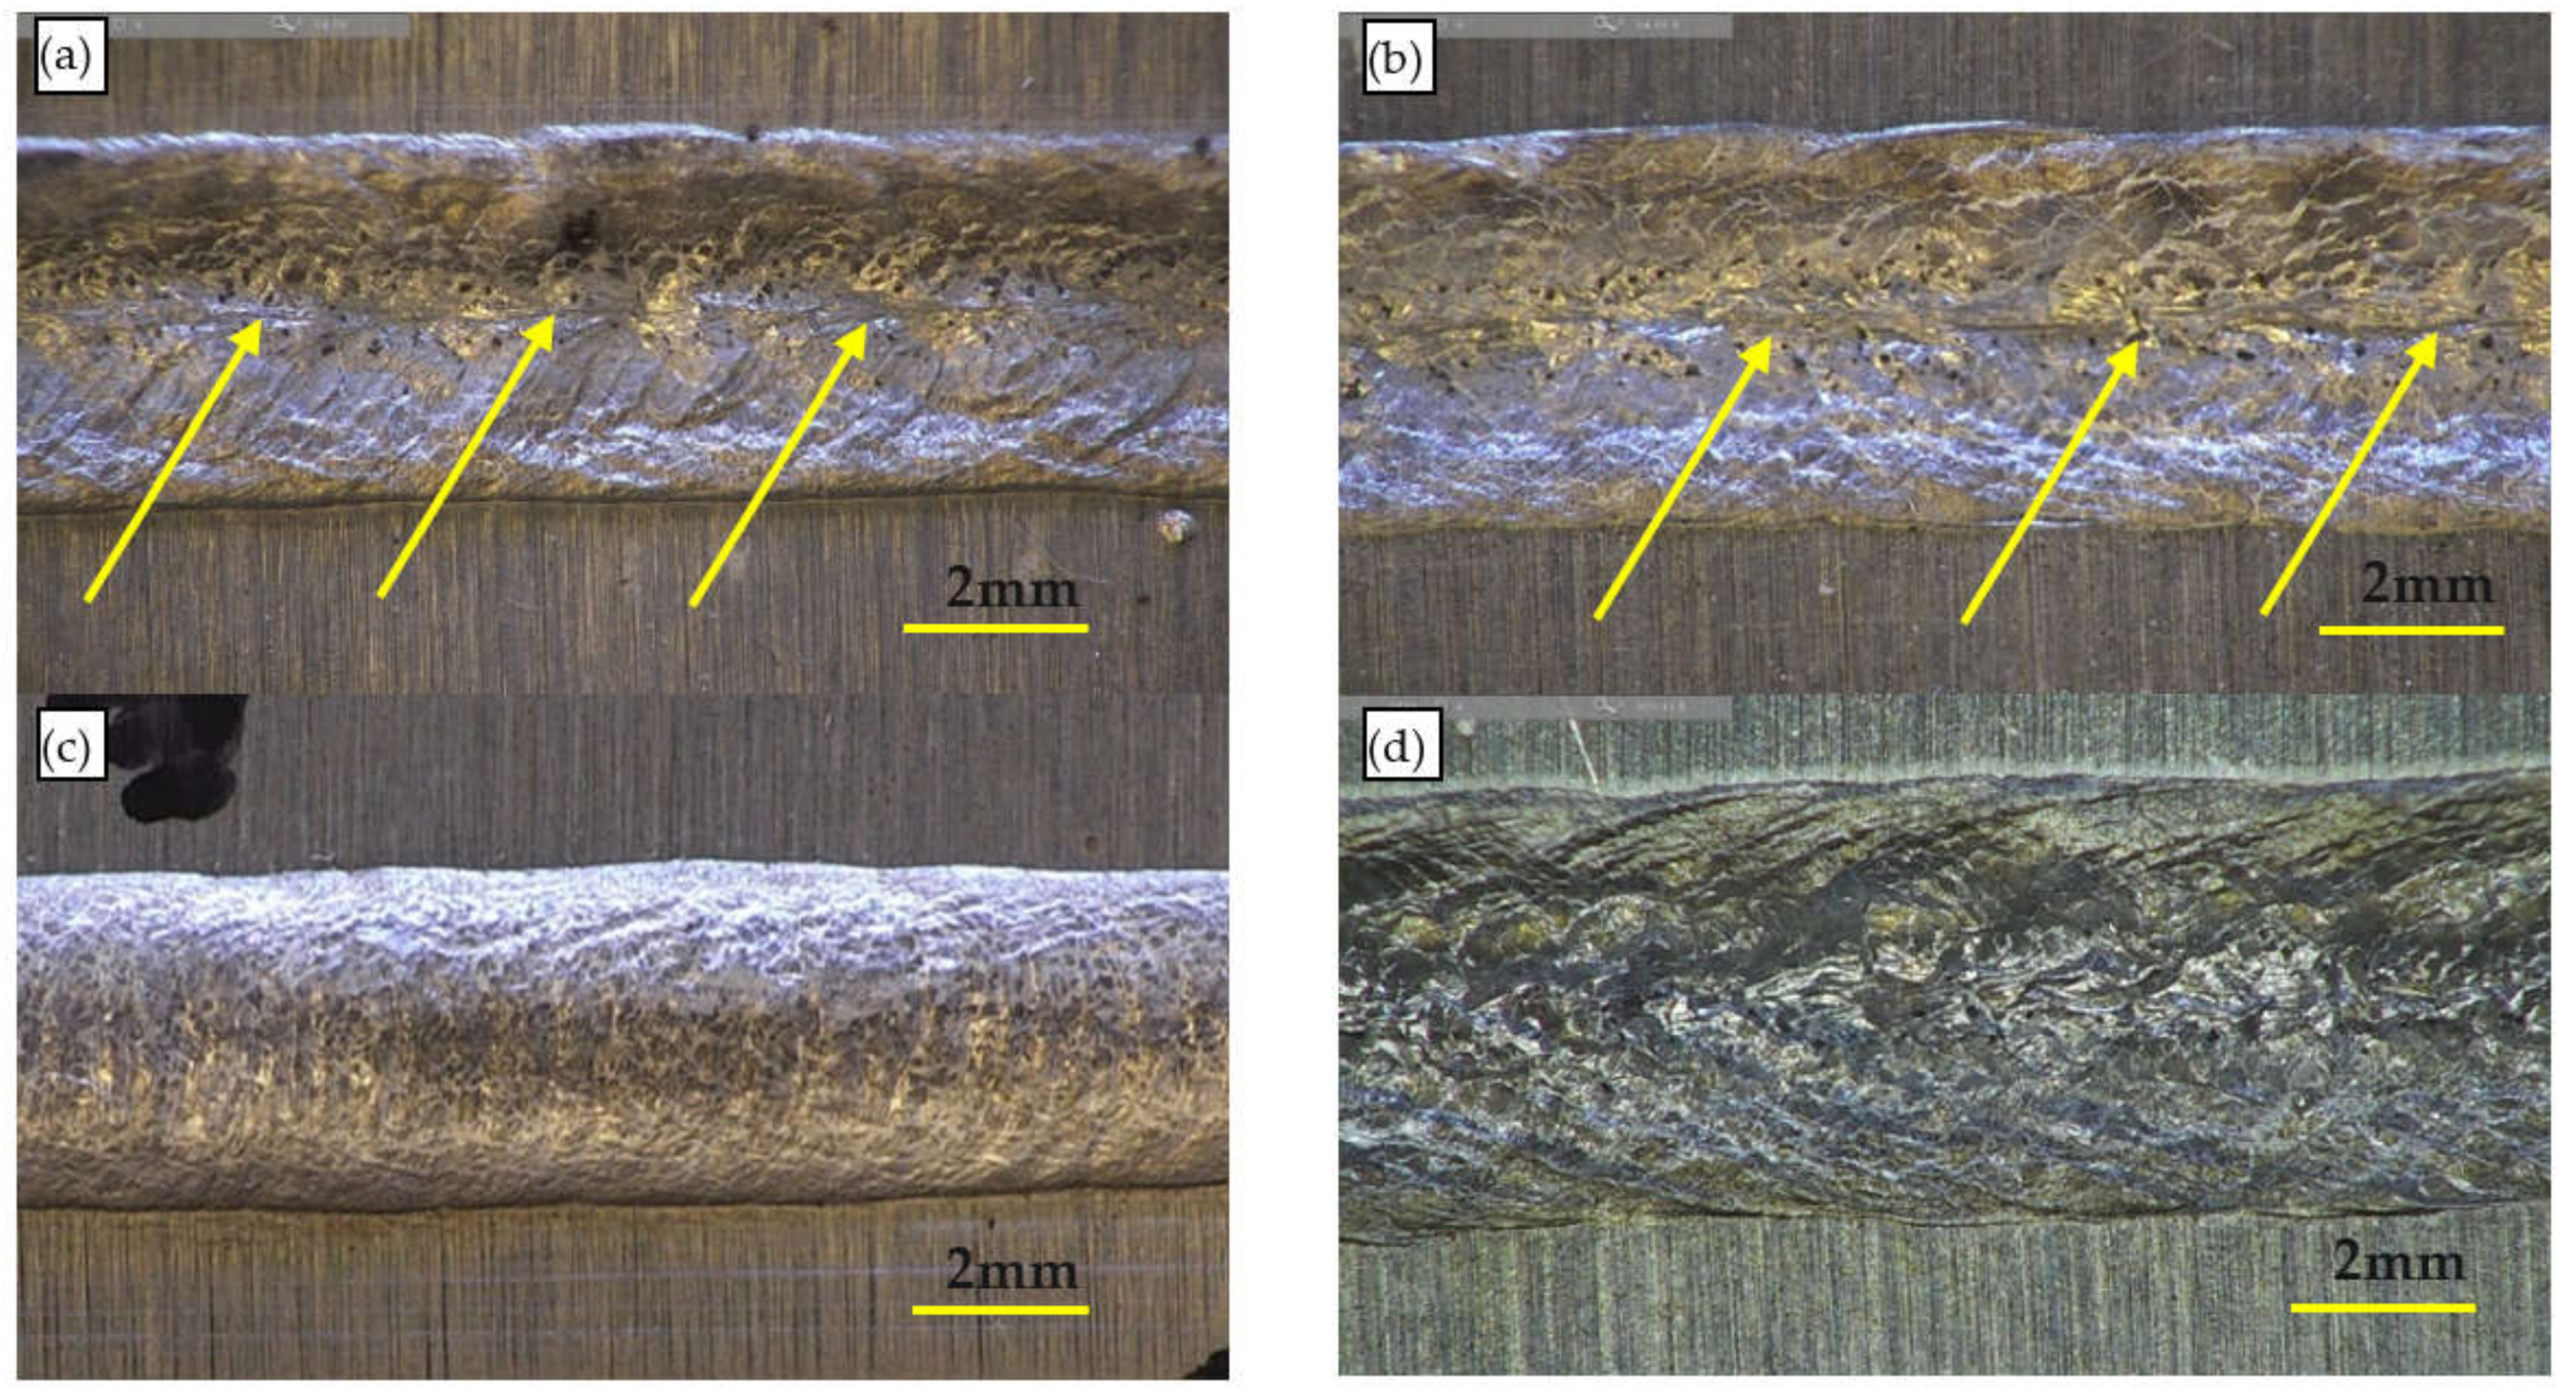
3.3. Surface Quality
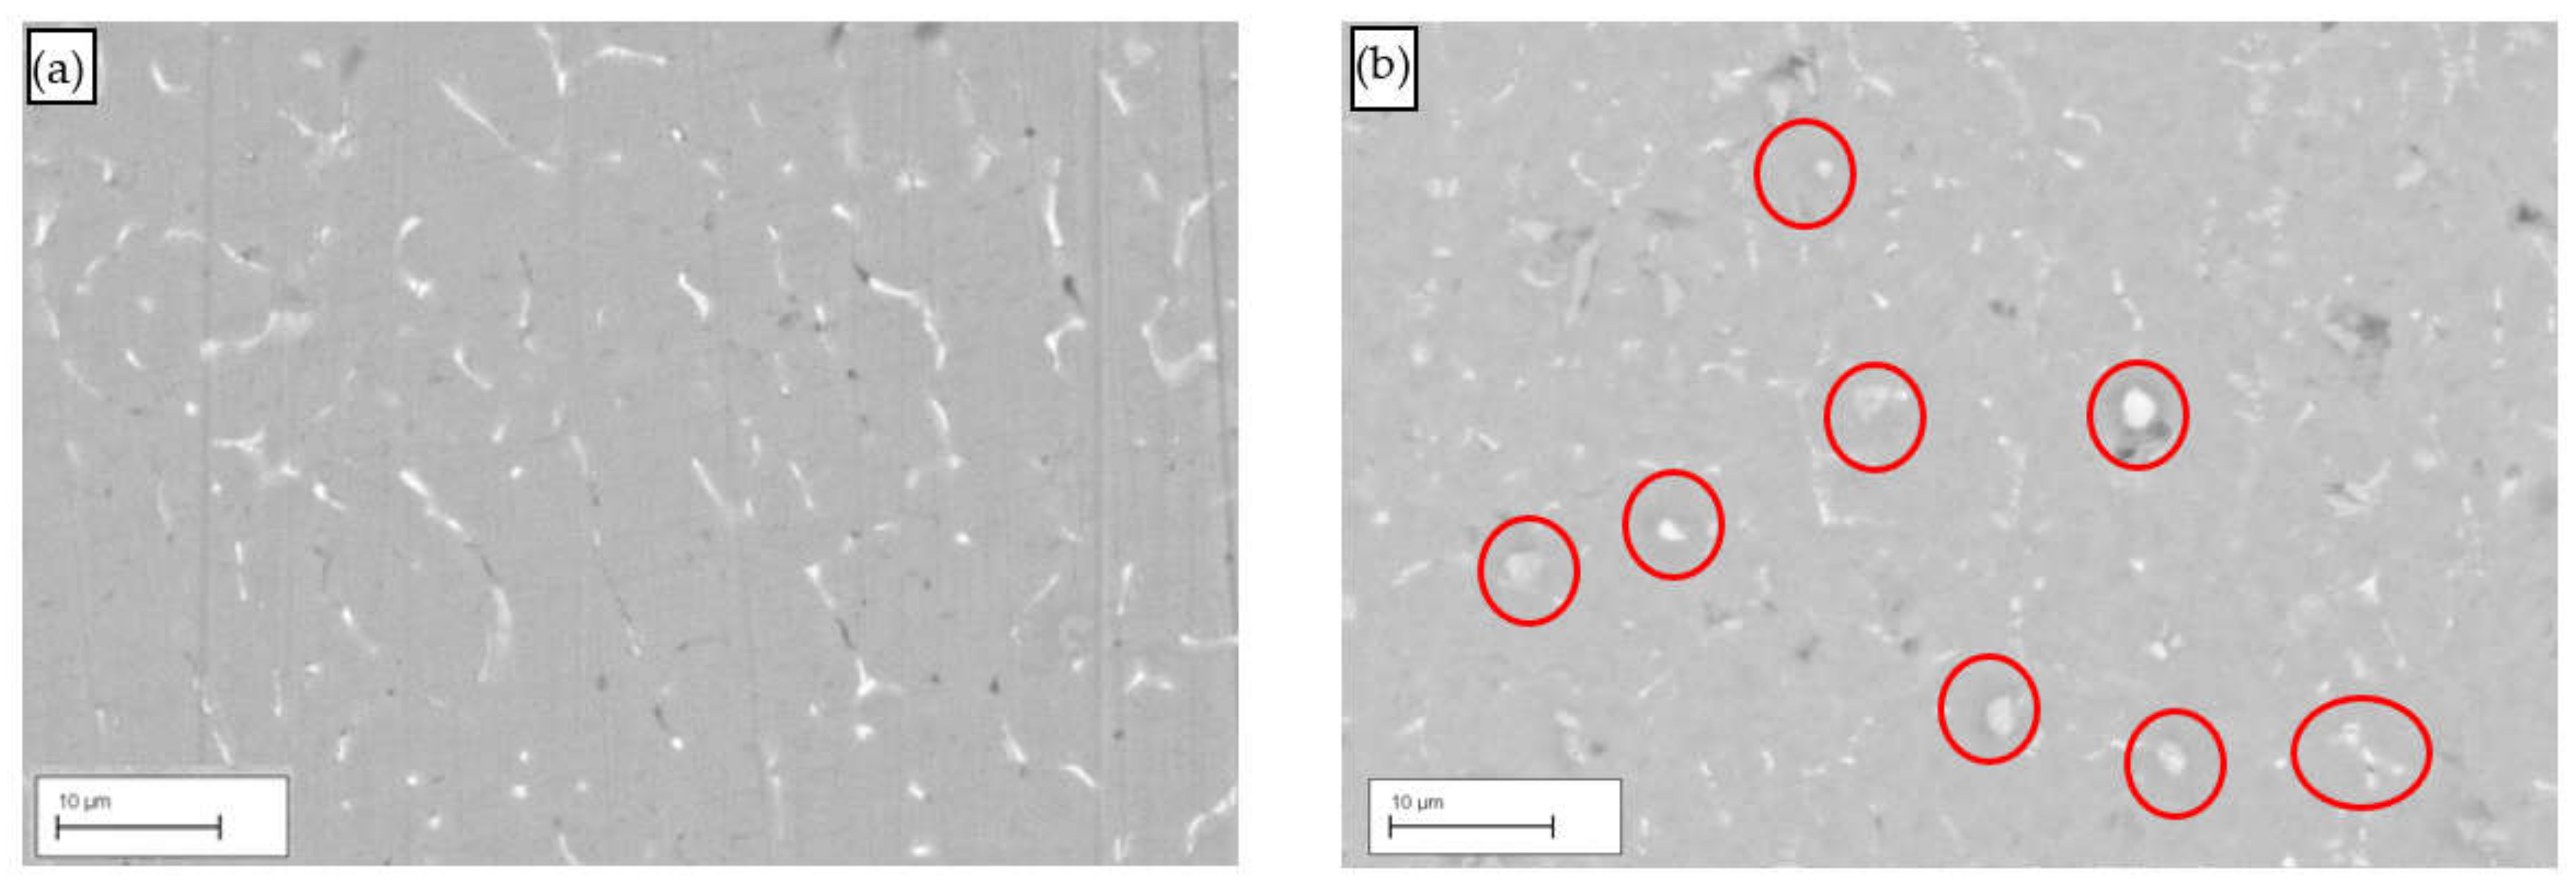
3.4. Micro-Structure Analysis
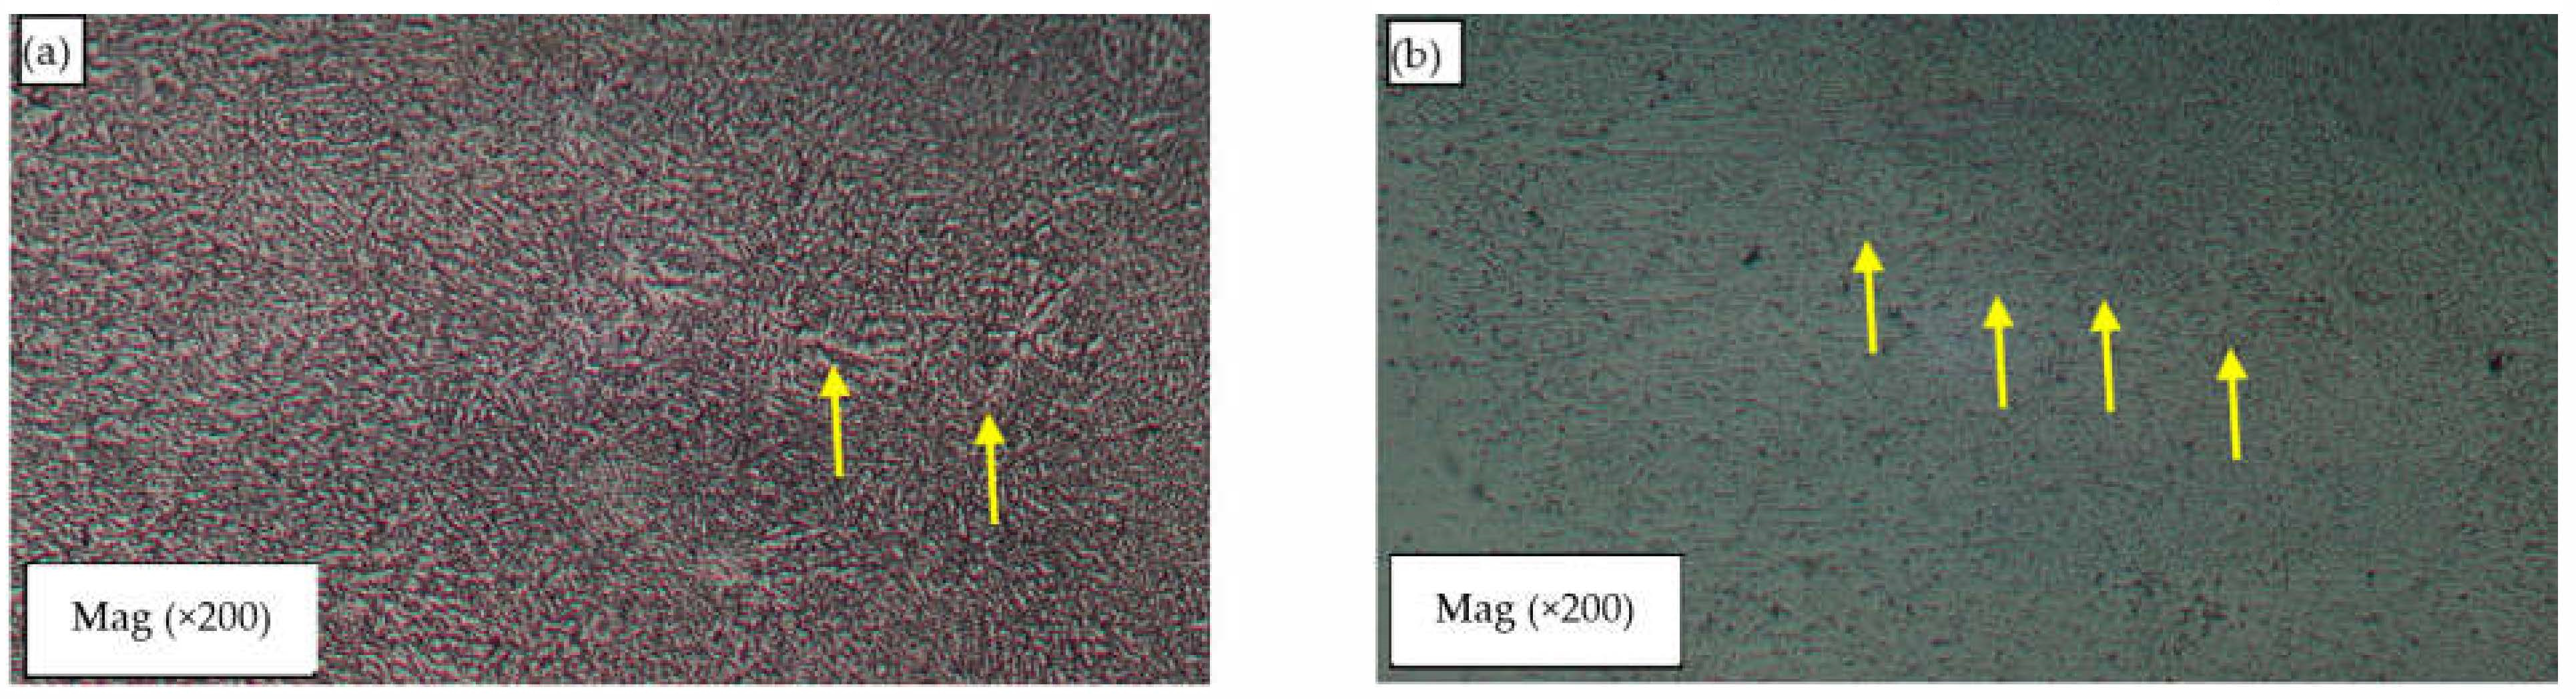
3.5. Grain Structure Analysis
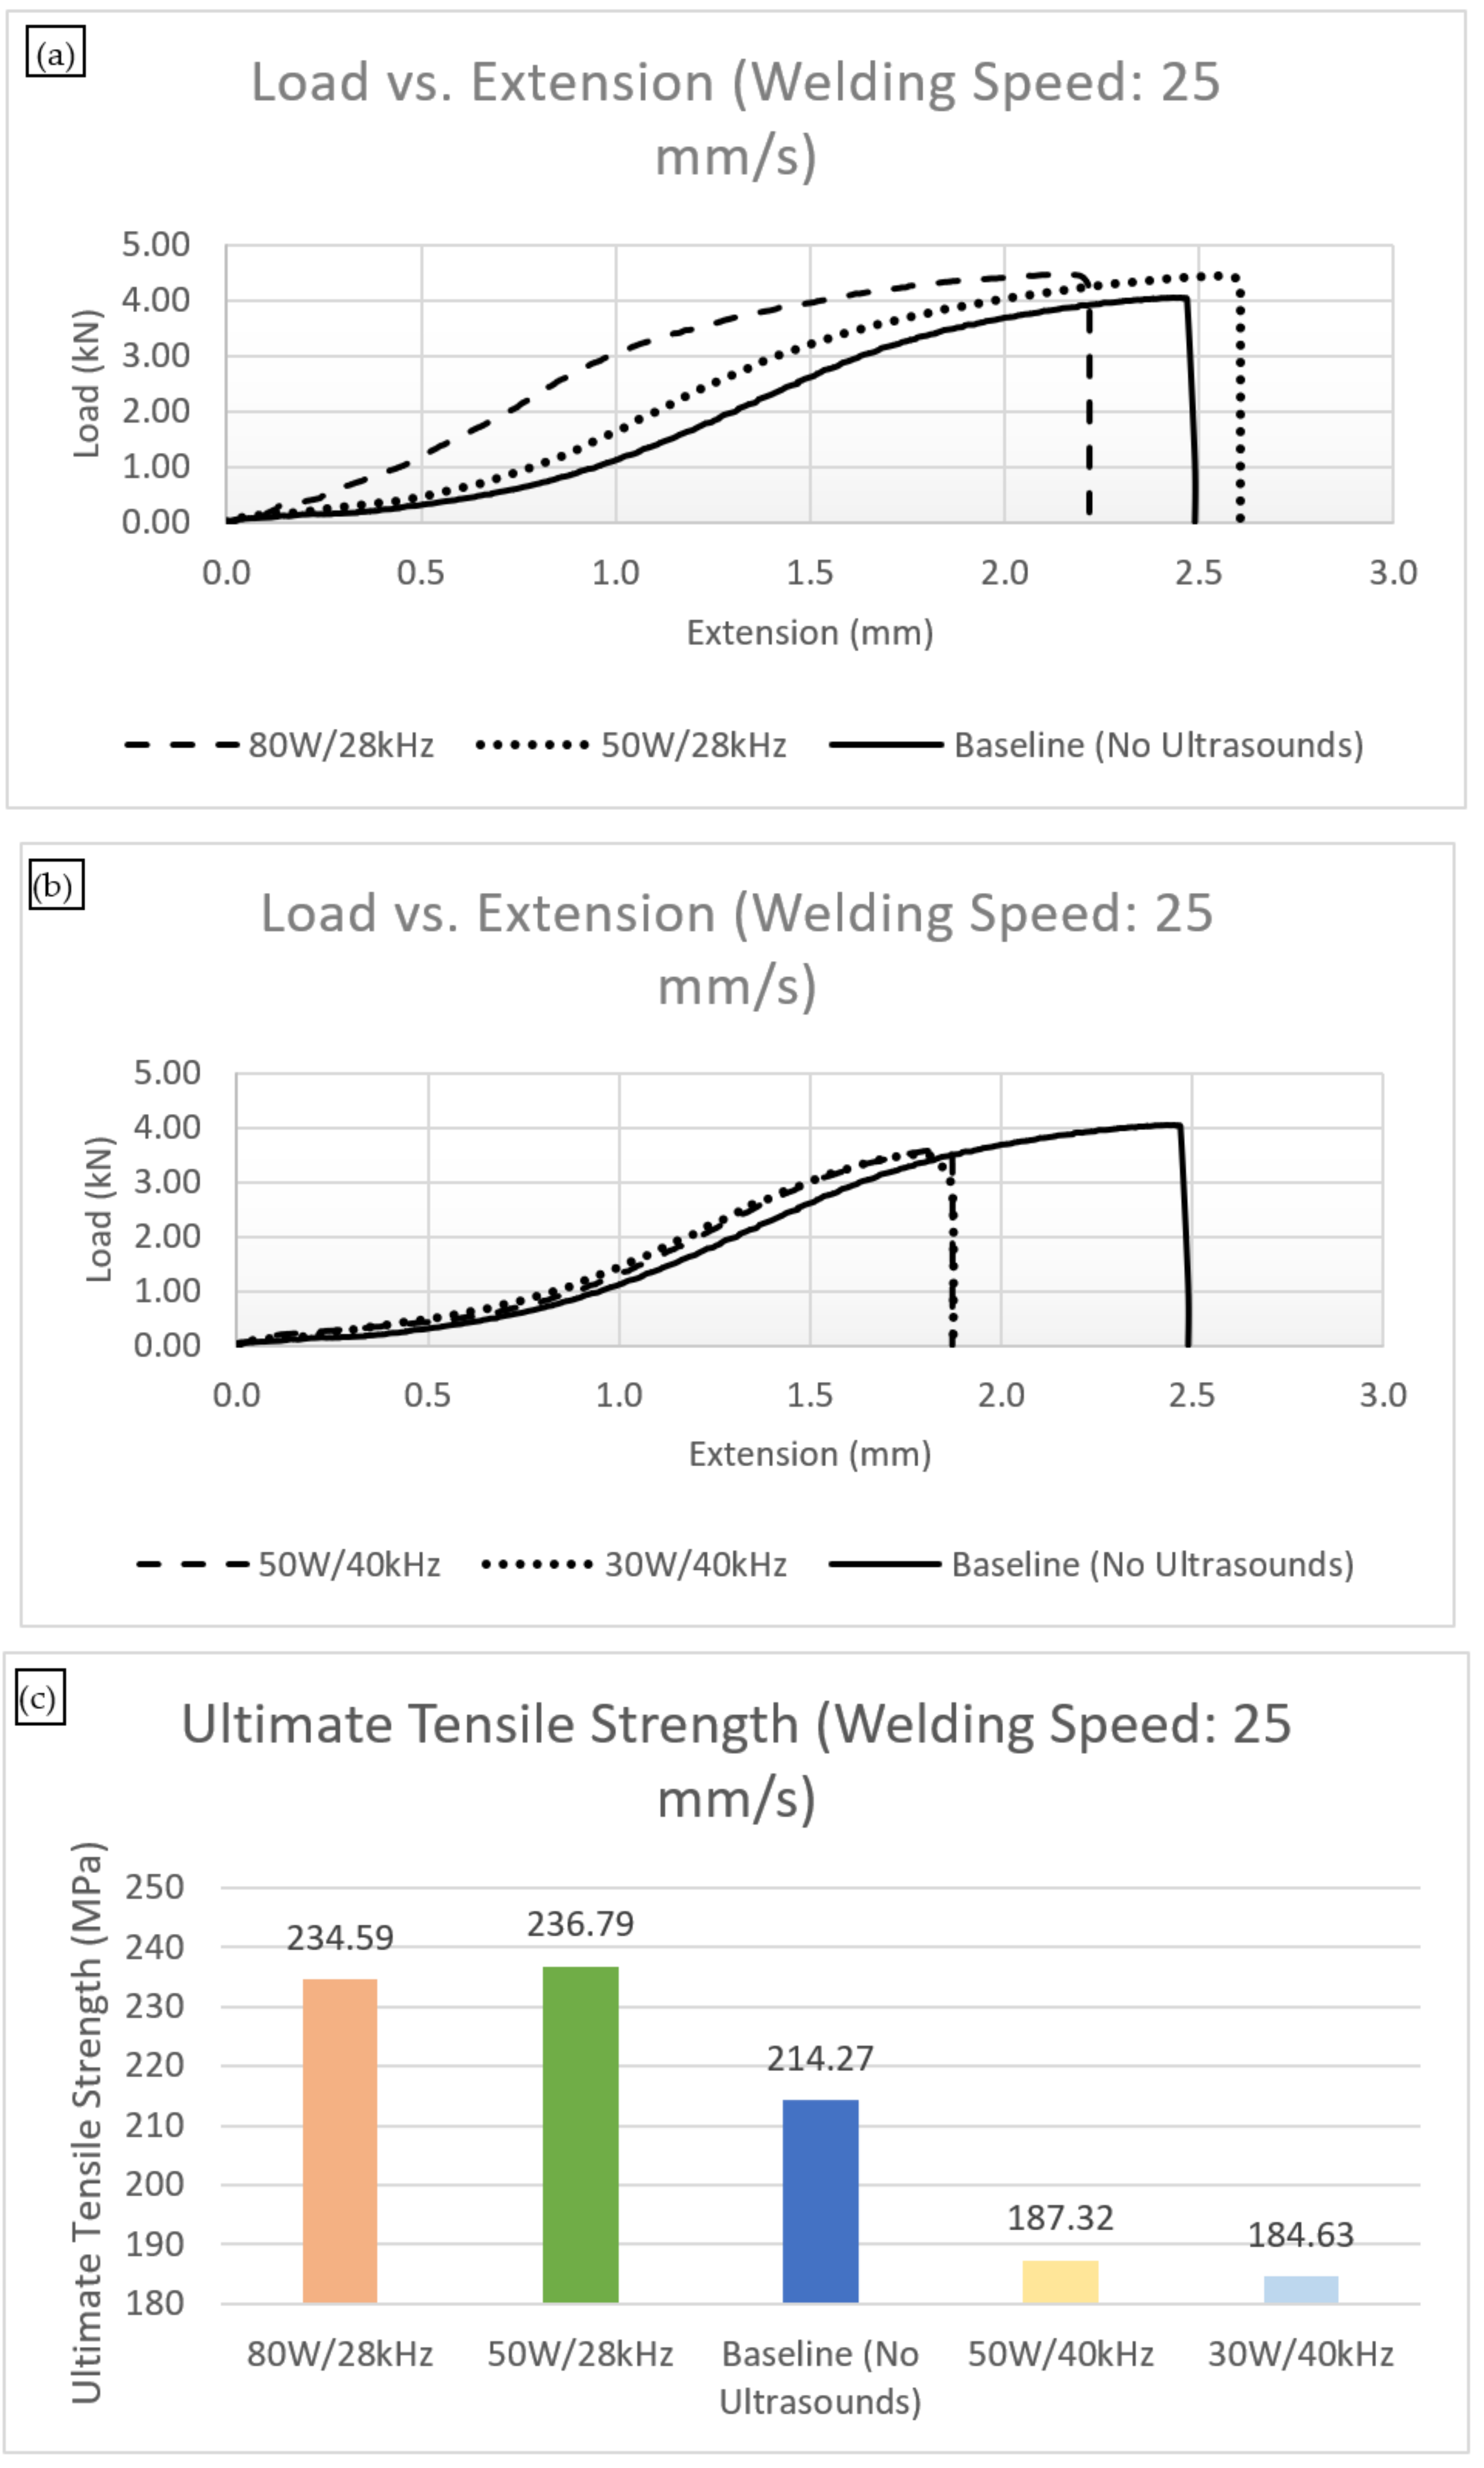
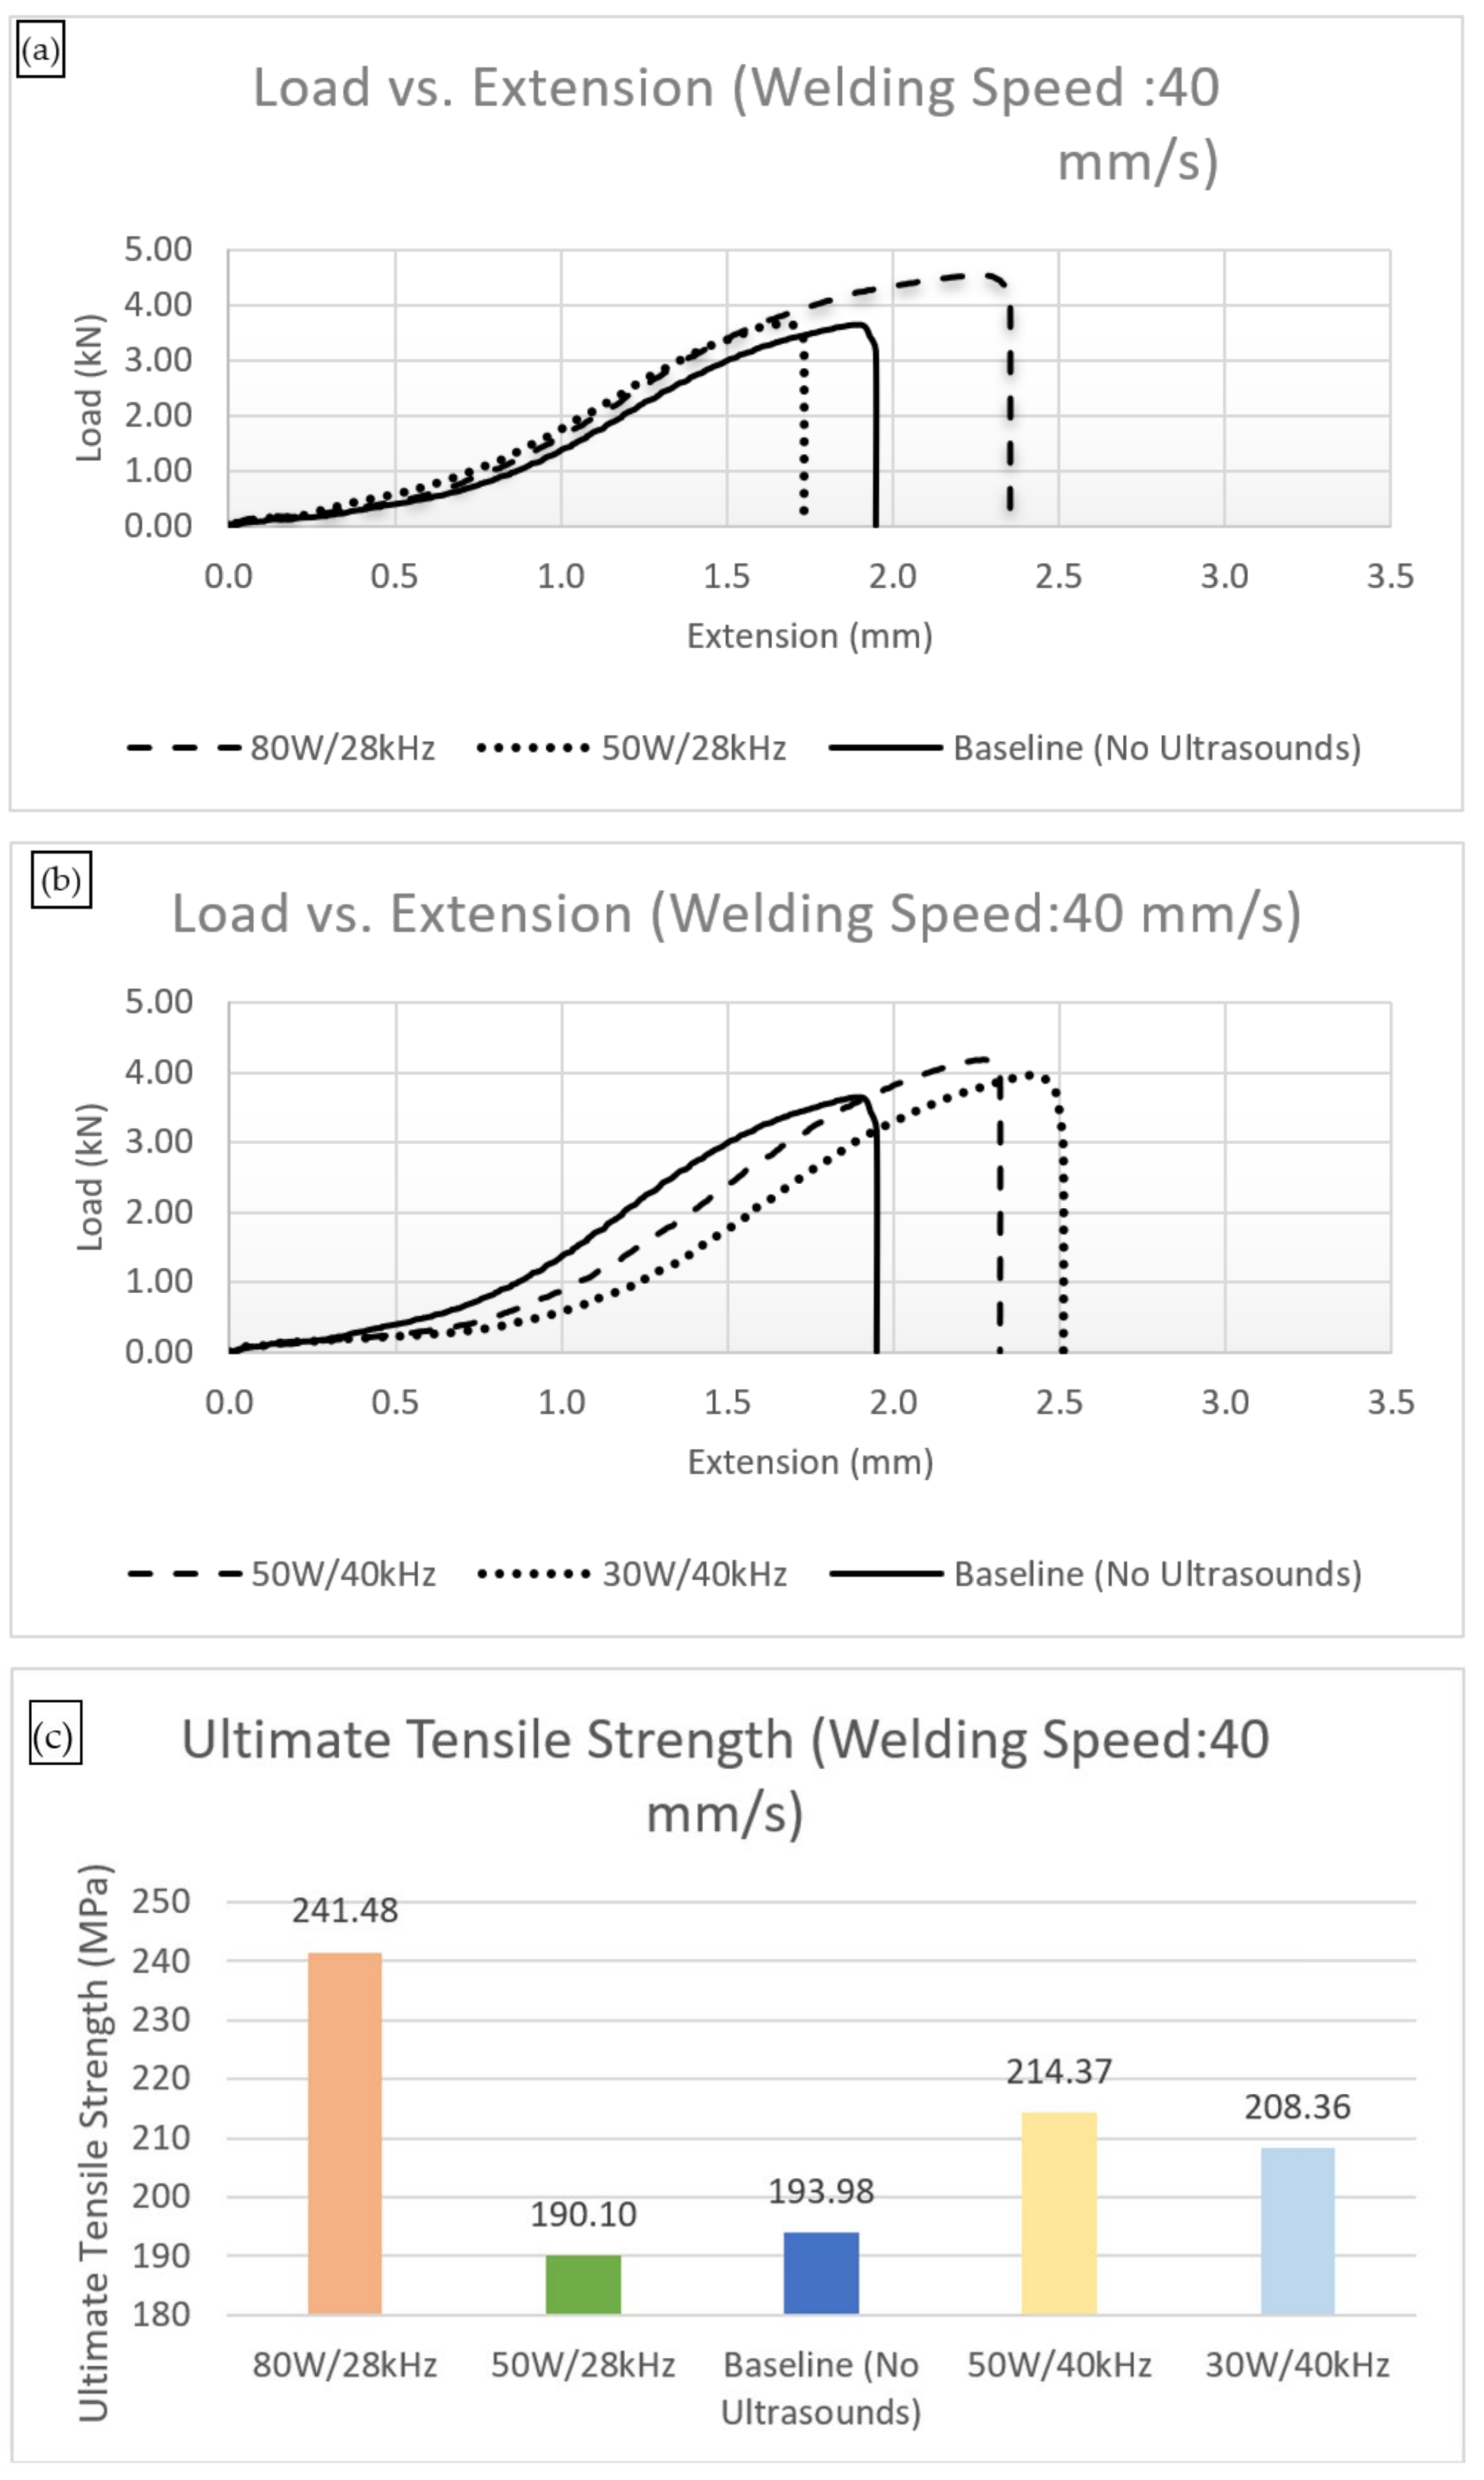
3.6. Tensile Tests
3.7. Discussion of the Mechanisms Involved in the Weldment Changes Induced by Ultrasound
3.8. Other Possible Effects of Ultrasound on Weld Melts
4. Conclusions
Author Contributions
Funding
Institutional Review Board Statement
Informed Consent Statement
Data Availability Statement
Conflicts of Interest
References
- Fathi, H.; Närhi, M.; Gumenyuk, R. Towards Ultimate High-Power Scaling: Coherent Beam Combining of Fiber Lasers. Photonics 2021, 8, 566. [Google Scholar] [CrossRef]
- Katayama, S. Handbook of Laser Welding Technologies; Woodhead Publishing: Sawston, UK, 2013. [Google Scholar]
- Teyeb, A.; Lowe, P.S.; Kanfoud, J.; Gan, T.H. Investigation of the use of power ultrasonic to improve the laser welding of Aluminium alloys. Int. J. Mech. Prod. Eng. 2018, 6, 51–54. [Google Scholar]
- Oladimeji, O.; Taban, E. Trend and innovations in laser beam welding of wrought aluminium alloys. Weld World 2016, 60, 415–457. [Google Scholar] [CrossRef]
- Gallego-Juárez, J.A.; Rodriguez, G.; Acosta, V.; Riera, E. Power ultrasonic transducers with extensive radiators for industrial processing. Ultrason. Sonochem. 2009, 17, 953–964. [Google Scholar] [CrossRef] [PubMed]
- Hagenlocher, C.; Fetzer, F.; Weller, D.; Weber, R.; Graf, T. Explicit analytical expressions for the influence of welding parameters on the grain structure of laser beam welds in aluminium alloys. Mater. Des. 2019, 174, 107791. [Google Scholar] [CrossRef]
- Eskin, D.G. Ultrasonic processing of molten and solidifying aluminium alloys: Overview and outlook. Mater. Sci. Technol. 2016, 33, 636–645. [Google Scholar] [CrossRef] [Green Version]
- Dubey, A.K.; Yadava, V. Laser beam machining—A review. Int. J. Mach. Tools Manuf. 2008, 48, 609–628. [Google Scholar] [CrossRef]
- Silva, J. Laser Welding of Aluminium Rings. Mastery Thesis, Instituto Superior Técnico, Universidade Técnica de Lisboa, Lisboa, Portugal, 2011. [Google Scholar]
- Todaro, C.J.; Easton, M.A.; Qiu, D.; Zhang, D.; Bermingham, M.J.; Lui, E.W.; Brandt, M.; StJohn, D.H.; Qian, M. Grain structure control during metal 3D printing by high intensity ultrasound. Nat. Commun. 2020, 11, 142. [Google Scholar] [CrossRef] [PubMed]
- Cochrane, R.F.; Dalgarno, K.W. Review on selective laser sintering/melting (SLS/SLM) of aluminium alloy powders: Processing, microstructure, and properties. Prog. Mater. Sci. 2015, 74, 401–477. [Google Scholar]
- Krajewski, W.; Wlosinski, T.; Chmielewski, I.; Kolodziejczak, P. Ultrasonic-vibration assisted arc-welding of aluminum alloys. Bull. Pol. Acad. Sci. Tech. Sci. 2012, 60, 841–852. [Google Scholar] [CrossRef]
- Kumar, S.; Wu, C.S.; Padhy, G.K.; Ding, W. Application of ultrasonic vibrations in welding and metal processing: A status review. J. Manuf. Process. 2017, 26, 295–322. [Google Scholar] [CrossRef]
- Puga, H.; Costa, S.; Barbosa, J.; Ribeiro, S.; Prokic, M. Influence of ultrasonic melt treatment on microstructure and mechanical properties of AlSi9Cu3 alloy. J. Mater. Process. Technol. 2011, 211, 1729–1735. [Google Scholar] [CrossRef] [Green Version]
- Leong, T.S.; Martin, G.J.; Ashokkumar, M. Ultrasonic encapsulation—A review. Ultrason. Sonochem. 2016, 35, 605–614. [Google Scholar] [CrossRef]
- Bakhtiyari, A.N.; Wang, Z.; Wang, L.; Zheng, H. A review on applications of artificial intelligence in modeling and optimization of laser beam machining. Opt. Laser Technol. 2021, 135, 106721. [Google Scholar]
- Yuan, D.; Shao, S.; Guo, C.; Jiang, F.; Wang, J. Refining of Ti-6Al-4V alloy fabricated by laser and wire additive manufacturing assisted with ultrasonic vibration. Ultrason. Sonochem. 2021, 73, 105472. [Google Scholar] [CrossRef]
- Franco, E.E.; Meza, J.M.; Buiochi, F. Measurement of elastic properties of materials by the ultrasonic through-transmission technique. Dyna 2011, 78, 58–64. [Google Scholar]
- Available online: Http://www.sonicsystems.co.uk/userfiles/downloads/9/P100-20%20Equipment%20Specification.pdf (accessed on 10 January 2022).
- Leitner, M.; Leitner, T.; Schmon, A.; Aziz, K.; Pottlacher, G. Thermophysical Properties of Liquid Aluminum. Metall. Mater. Trans. A 2017, 48, 3036–3045. [Google Scholar] [CrossRef] [Green Version]
- Jeong, I.L.; Jung, K.J.; Lee, K.; Kim, J.; Hoon, C.H.O. Experiment and Modeling to Assess Ultrasonic Attenuation Factor in Molten Aluminum Alloy. In Proceedings of the Symposium on Ultrasonic Electronics, Pukyong National University, Busan, South Korea, 16–18 November 2016; Volume 37. [Google Scholar]


| Thickness | Baseline | 28 kHz | 40 kHz |
|---|---|---|---|
| 1.5 mm | 0.375 | 0.340 | 0.215 |
| 4 mm | 0.965 | 0.365 | 0.830 |
Publisher’s Note: MDPI stays neutral with regard to jurisdictional claims in published maps and institutional affiliations. |
© 2022 by the authors. Licensee MDPI, Basel, Switzerland. This article is an open access article distributed under the terms and conditions of the Creative Commons Attribution (CC BY) license (https://creativecommons.org/licenses/by/4.0/).
Share and Cite
Teyeb, A.; Silva, J.; Kanfoud, J.; Carr, P.; Gan, T.-H.; Balachandran, W. Improvements in the Microstructure and Mechanical Properties of Aluminium Alloys Using Ultrasonic-Assisted Laser Welding. Metals 2022, 12, 1041. https://doi.org/10.3390/met12061041
Teyeb A, Silva J, Kanfoud J, Carr P, Gan T-H, Balachandran W. Improvements in the Microstructure and Mechanical Properties of Aluminium Alloys Using Ultrasonic-Assisted Laser Welding. Metals. 2022; 12(6):1041. https://doi.org/10.3390/met12061041
Chicago/Turabian StyleTeyeb, Ahmed, João Silva, Jamil Kanfoud, Phil Carr, Tat-Hean Gan, and Wamadeva Balachandran. 2022. "Improvements in the Microstructure and Mechanical Properties of Aluminium Alloys Using Ultrasonic-Assisted Laser Welding" Metals 12, no. 6: 1041. https://doi.org/10.3390/met12061041
APA StyleTeyeb, A., Silva, J., Kanfoud, J., Carr, P., Gan, T.-H., & Balachandran, W. (2022). Improvements in the Microstructure and Mechanical Properties of Aluminium Alloys Using Ultrasonic-Assisted Laser Welding. Metals, 12(6), 1041. https://doi.org/10.3390/met12061041