Article

Thermodynamic and Experimental Study on Migration Characteristics of Heavy Metals during the Melting Process of Incineration Fly Ash

1
School of Minerals Processing and Bioengineering, Central South University, Changsha 410083, China
2
Everbright Envirotech (China) Ltd., Nanjing 211102, China
*
Author to whom correspondence should be addressed.
Metals 2022, 12(6), 1036; https://doi.org/10.3390/met12061036
Submission received: 30 April 2022 / Revised: 3 June 2022 / Accepted: 13 June 2022 / Published: 17 June 2022
(This article belongs to the Special Issue Clean Ironmaking and Steelmaking Processes)

Abstract

:
The migration characteristics of heavy metals during the melting process were one of the key factors for safe treatment and resource utilization of incineration fly ash (IFA). In this paper, the material variation of heavy metal elements of Pb, Zn, Cu, and Fe during the IFA melting process was simulated by HSC 6.0 chemistry software. The effects of melting temperature, alkalinity, atmosphere, chlorine content of raw materials, and an iron bath added to the migration characteristics, and phase transformation of selected heavy metal elements was investigated. The simulation results were also verified by experimental results. The results showed that, with the increase in temperature, the gas phase proportion of Pb, Zn, Cu, and Fe gradually increased. The alkalinity had little effect on the proportion of elements Fe and Cu in the liquid slag (LS) phase and the element Pb in the gas phase, but the increase in alkalinity could inhibit the proportion of element Zn in the gas phase. Zn mainly existed in the gas phase, and the atmosphere had little influence on the distribution of Zn. In reducing atmosphere (RA), elements Fe and Cu, which entered the liquid metal (LM) phase, were promoted, while the volatilization of Pb was restrained, which was conducive to the recovery of heavy metals. The melting process of IFA with water-washing and dechlorination had an inhibitory effect on the volatilization of Zn and Pb, but had little effect on Fe and Cu. The proportion of element Zn in the gas phase reduced from 85.84% to 9.89%. With the iron bath added in the IFA melting process, 98.42% of Cu and 82.28% of Pb entered the LM phase as metal simple substances, and 76.3% of Zn entered the gas phase as Zn (g) and ZnCl2 (g). In the experimental verification, the distribution proportions of the four heavy metals in the gas phase, LS phase, and LM phase were consistent with the simulation results.

1. Introduction

The method of semidry or dry deacidification-activated carbon adsorption-bag filter dust removal is widely adopted in the present flue gas treatment process. The heavy metal dioxin, as well as some toxic substances in flue gas, are adsorbed by activated carbon [1,2,3,4]. Furthermore, the particles generated in the process of deacidification and adsorption are captured by a bag filter. Therefore, the incineration fly ash (IFA) is formed. The IFA, containing massive harmful heavy metals and dioxins, is clearly classified as hazardous waste [5,6,7,8,9]. The high-temperature melting process by the electric arc furnace of IFA is helpful for eliminating dioxins and solidifying heavy metal elements. This has several advantages, including volume reduction, weight decline, and completely safe treatment. Furthermore, the molten products can be used to gain high-value-added products for resource utilization, such as cement additives, thermal insulation cotton, glass ceramics, and so on. Therefore, the high-temperature melting process is considered as one of the most effective means for treating IFA [10,11,12,13,14,15,16].
The IFA contains the major Inorganic components of CaO, SiO2, Al2O3, and MgO, plentiful chloride salts of NaCl, CaCl2, and KCl, as well as small amounts of organic components of C, H, N, S, and Cl. In addition, there are also metal components such as Fe, Cu, Pb, Zn, Cr, and Cd. The complex reaction system is constituted by the various components mentioned above and melting additives in the coupled treatment process of IFA. To effectively solidify and utilize heavy metal elements, it is necessary to study the thermodynamic behavior of heavy metal elements in the above reaction system of IFA. Many researchers have conducted studies on the distribution of metal elements in the melting process of IFA [17,18]. M.Takaoka [19] and X.T Wang [20] studied the effect of atmosphere on the behavior of heavy metals in the melting process of IFA and found that the volatilization rate of low-boiling heavy metals in a reduction atmosphere was higher than that in an oxidation condition. Under the reducing atmosphere, the compounds of heavy metals were reduced to metal elements, which had a higher vapor pressure than oxides. A Jakob [21] investigated the influence on chemical reactions of various heavy metals under temperatures ranging from 670 °C to 1300 °C. B. Nowak [22] researched the existence of the formation law of heavy metal chlorides at high temperature in an IFA. X.L Lu [23] and J.Y Liu [24] explored the volatilization and chlorination transformation characteristics of heavy metals in the high-temperature melting process of IFA. Chloride helped to convert heavy metals in fly ash into heavy metal chloride with a low boiling point and promoted the volatilization of heavy metals. H.K Li [25] and J. Wen [26] conducted a study on the migration and distribution laws of heavy metals in IFA using the iron bath method. The iron bath melting system created a reduction environment for fly ash melting and promoted the reduction of heavy metal compounds to metal elements. The metals with a high boiling point were enriched in the iron phase, while the metals with a low boiling point were volatilized. The above research mainly focused on the solidification and volatilization distribution laws of toxic heavy metals in the melting process, and there is still a lack of systematic expositions on the quantification and mechanism analysis of the influence degree of various factors.
In this study, the household IFA was selected as the research object. The effects of melting temperature, alkalinity, atmosphere, chloride content of raw materials, and an iron bath added to the thermodynamic behavior of four heavy metal elements (Fe, Pb, Zn, and Cu) with high content (except alkali metal compounds) in the IFA during the melting process were systematically investigated by HSC 6.0 chemistry software (developed by Outokumpu Research Center, Finland). The reference and guidance of the solidification and resource utilization of metal elements in the melting process of IFA were provided.

2. Raw Material Properties and Research Methods

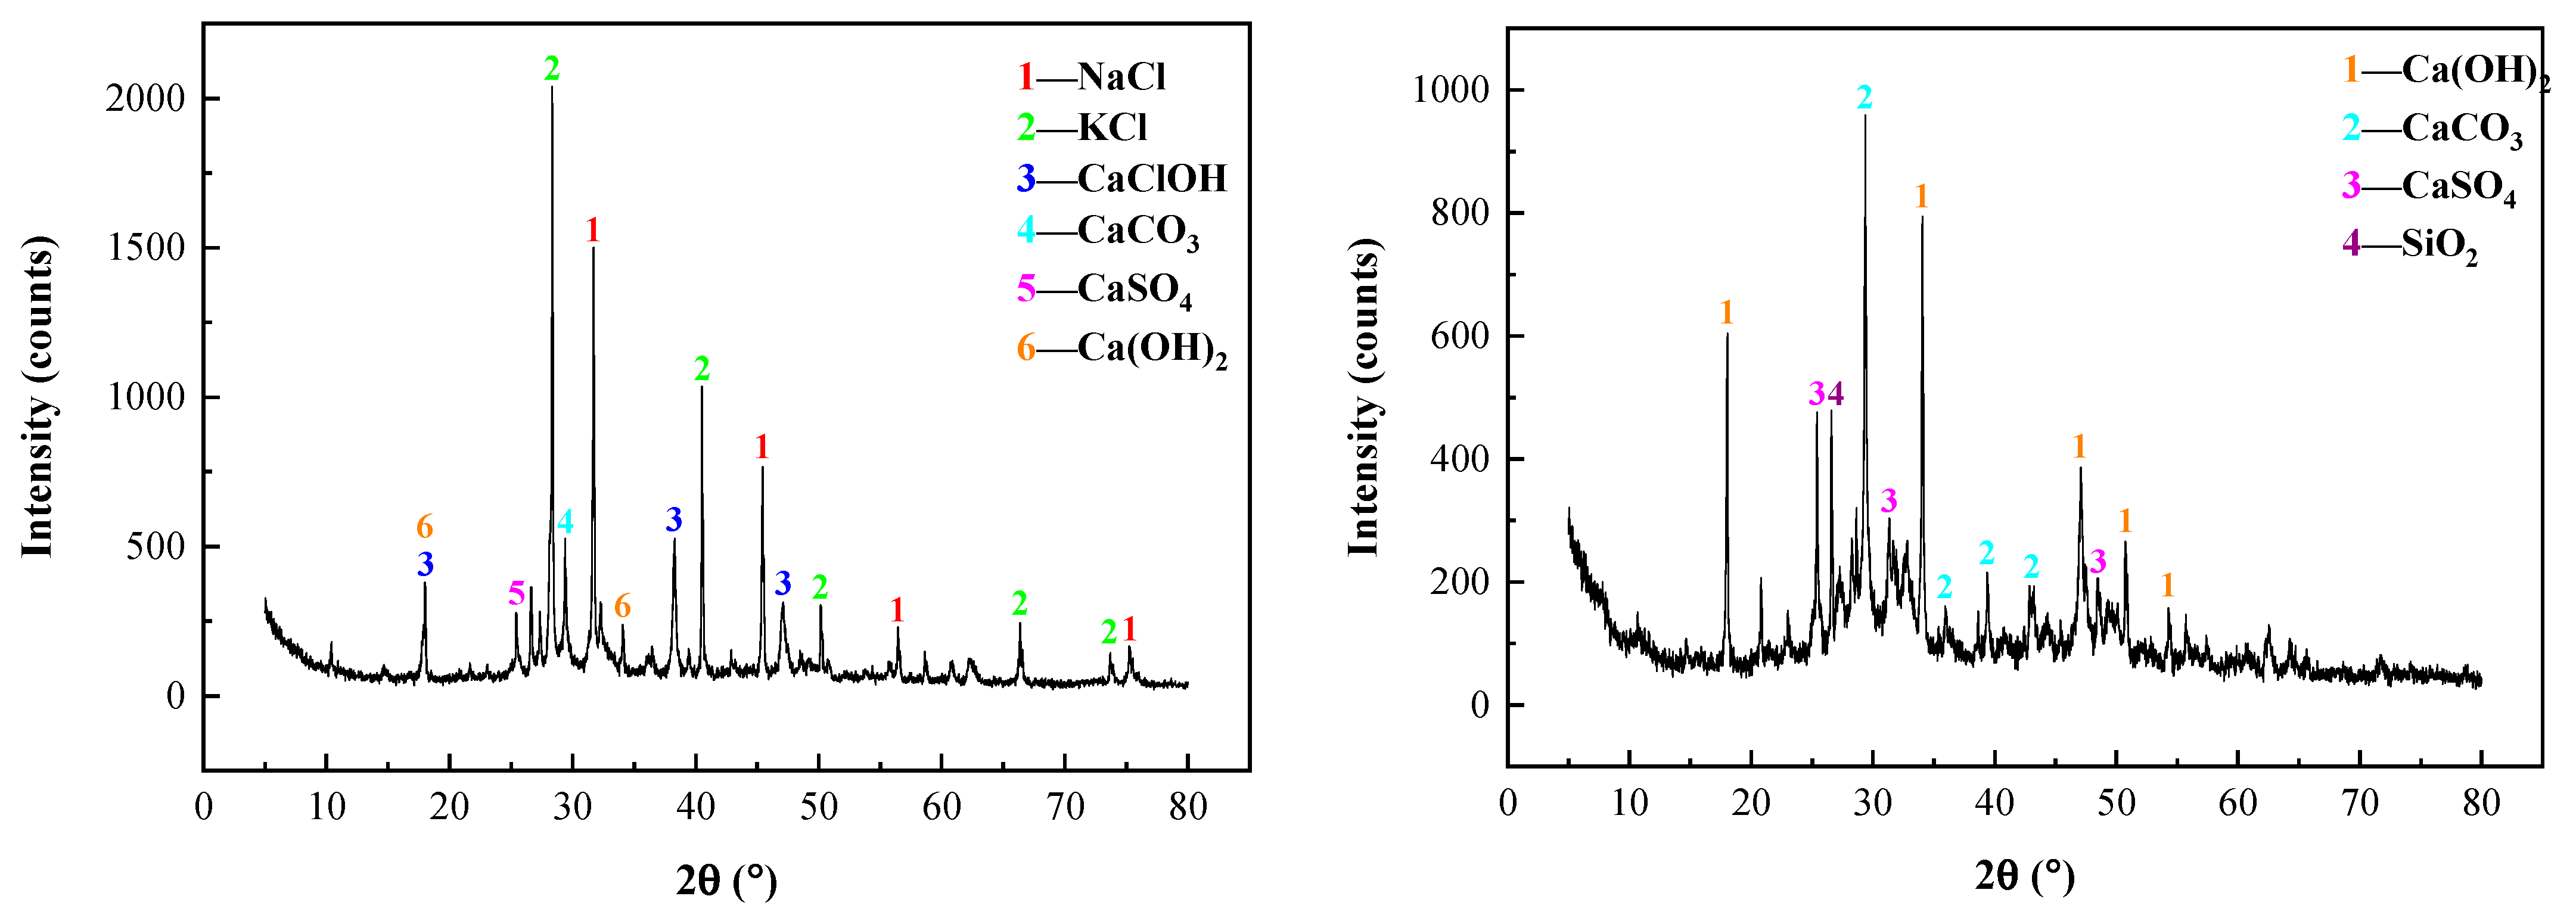
2.1. Raw Material Properties

In this study, the two types of raw materials were selected, which were produced by the grate incineration line of a waste incineration power plant in the Jiangsu Province. The raw IFA (R—IFA) samples were taken from the bag dust collector of the incineration line. Considering the composition fluctuation of the R—IFA, 10 samples were taken every 3 days in 1 month. Then, the samples were mixed evenly. To research the influence of chloride content of raw materials, the water-washing IFA (WW—IFA) samples were chosen. Half of the R—IFA samples were washed by three levels of counter-current water. The mass ratio of the R—IFA and water was 1:3 in each level of the water-washing process. After that, the mixture was filtered and separated by a vacuum filter extractor. The products were then dried in a drying oven. The moisture content of the final products was controlled by 5%. The final products were also called WW—IFA samples. The main chemical constituents of XRF and XRD patterns of R—IFA and WW—IFA are shown in Table 1 and Figure 1, respectively. From Table 1, the main components of R—IFA and WW—IFA were CaO, SiO2, Al2O3, Na2O, K2O, SO3, and Cl. Additionally, a small amount of heavy metals, such as ZnO, PbO, CuO, and Fe2O3 also existed. From Figure 1, the major phases of the R—IFA were NaCl, KCl, CaClOH, CaCO3, CaSO4, and Ca(OH)2, while the major phases of the WW—IFA were CaCO3, CaSO4, and Ca(OH)2. Compared with the R—IFA, more than 95% of the chlorine salt in the WW—IFA, such as NaCl, KCl, and CaClOH, was effectively removed. So the chloride content of the WW—IFA was quite lower than that in the R—IFA.

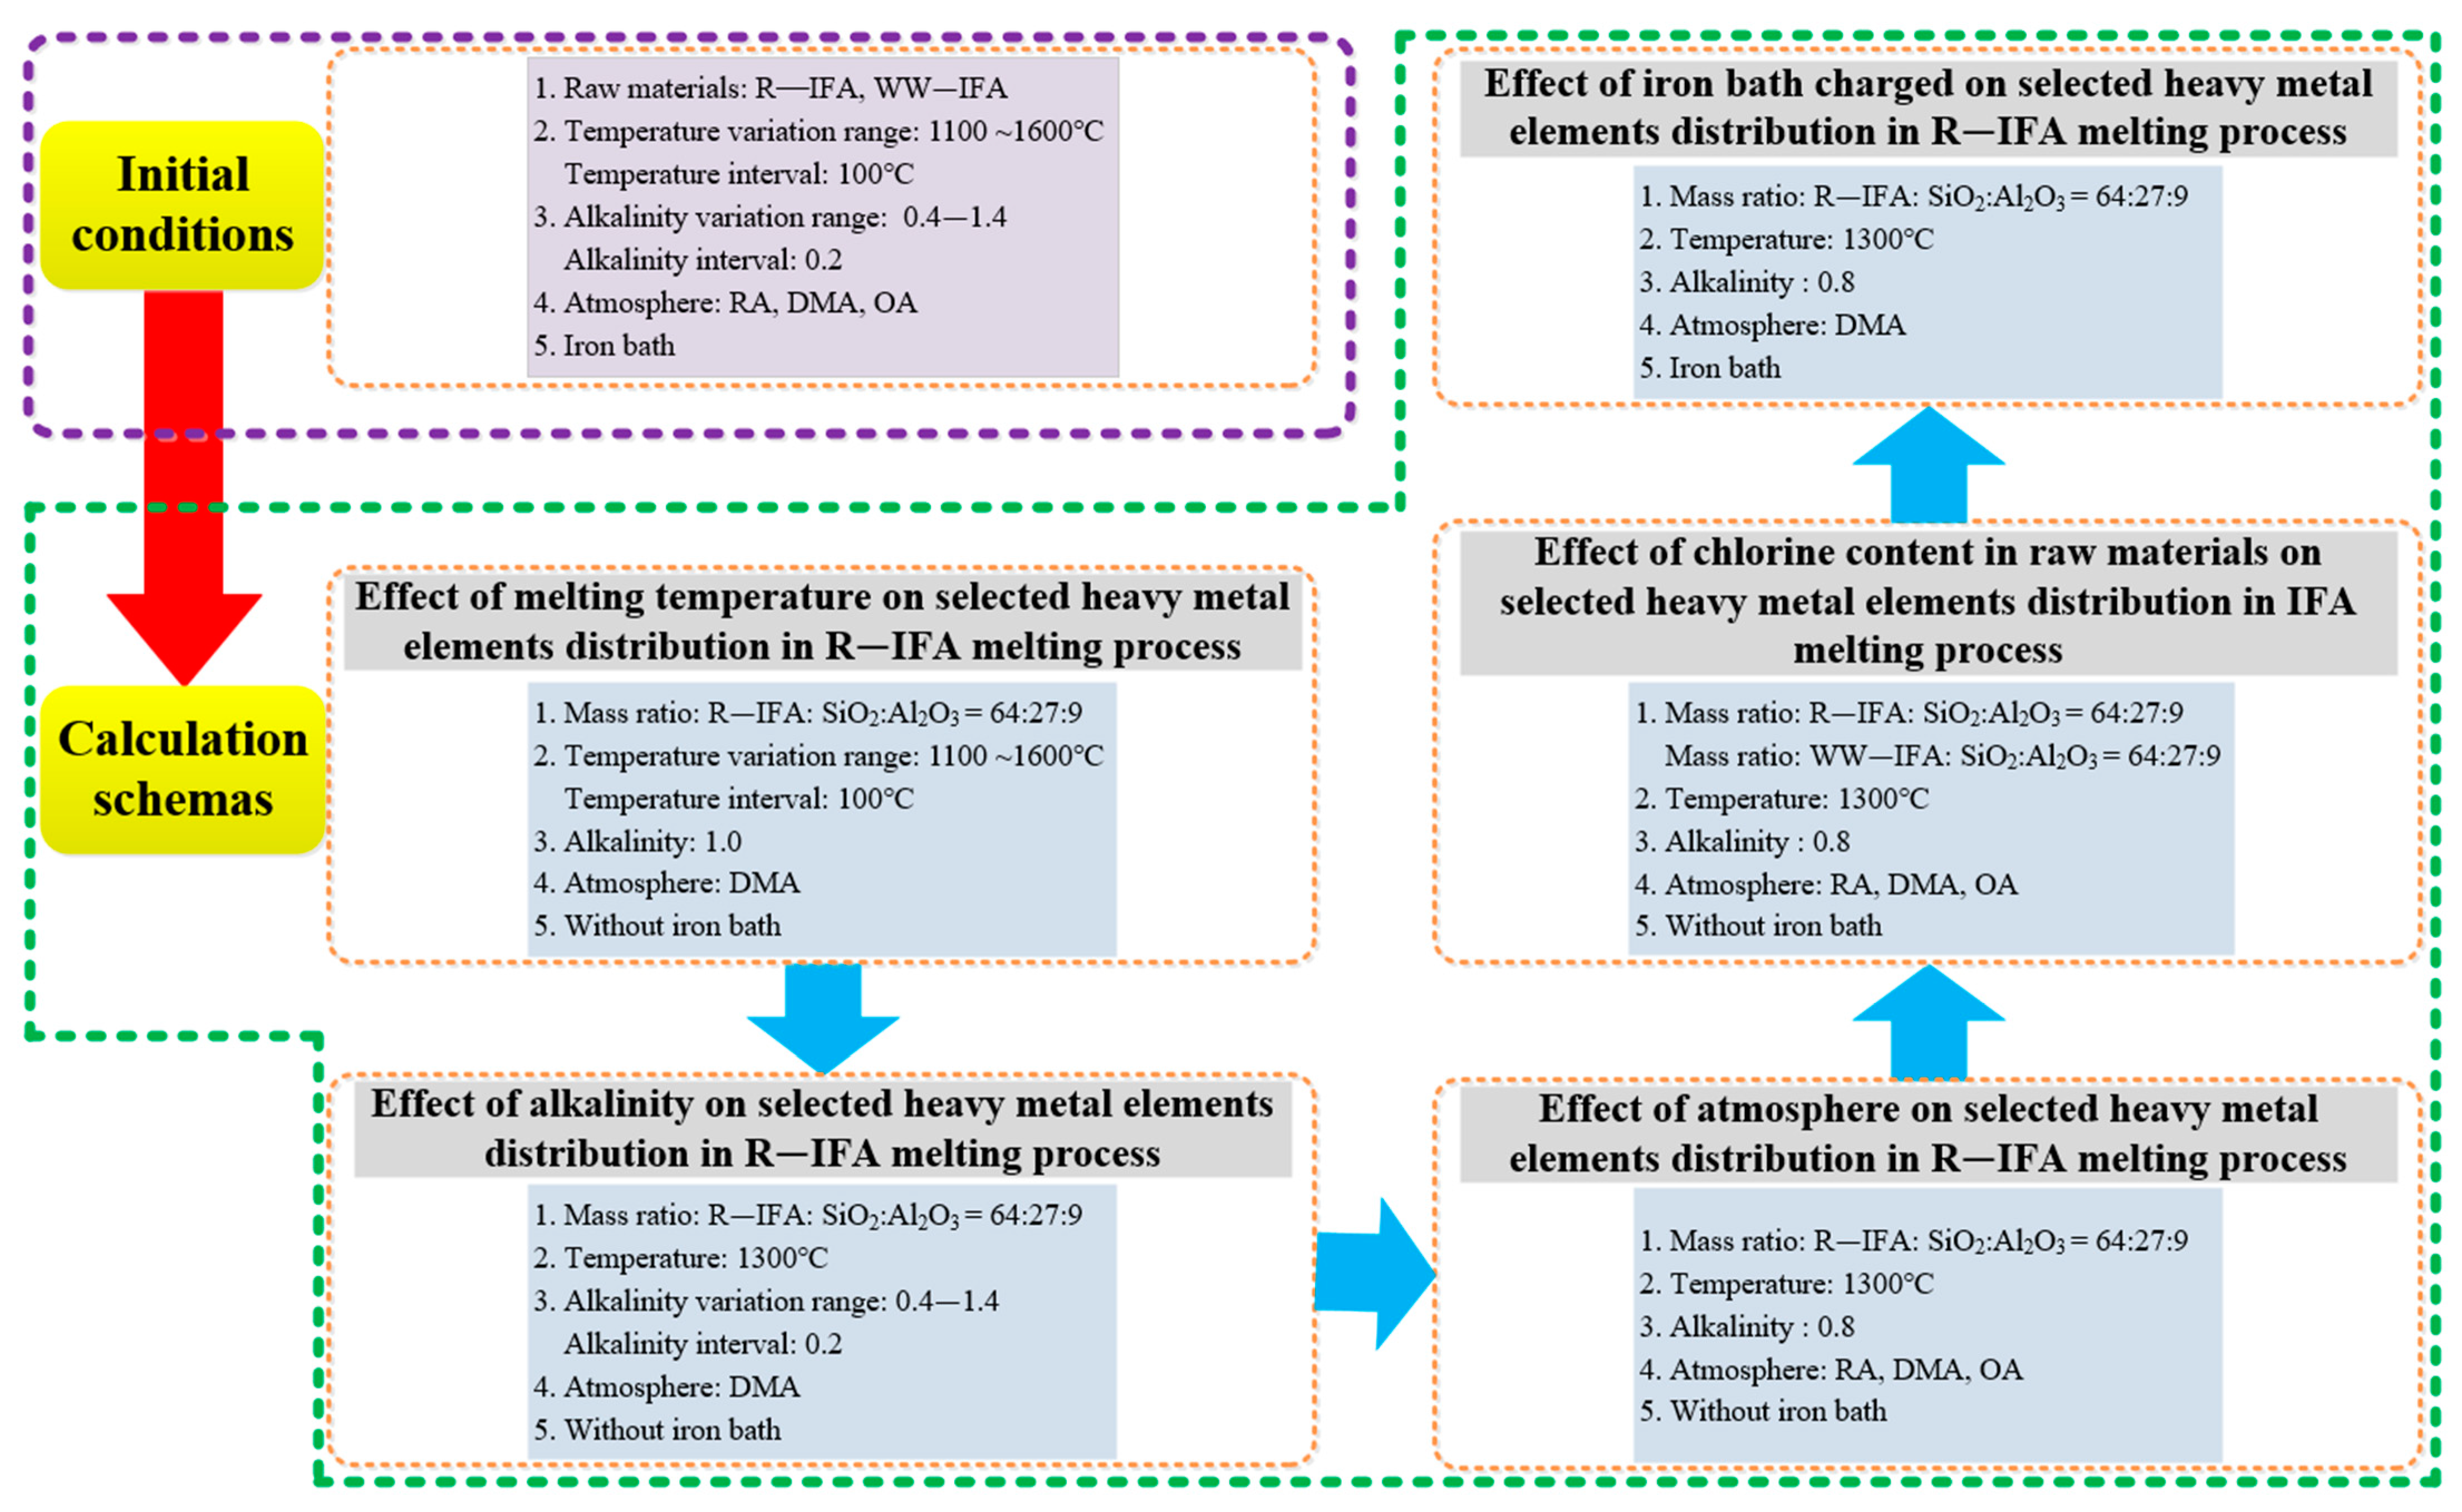
2.2. Research Method

The thermodynamic calculation software HSC 6.0 chemistry includes an abundant and comprehensive thermodynamic database, which can determine 22 calculation modules for different applications [27]. The equilibrium composition module in the HSC 6.0 chemistry thermodynamic software was applied. The equilibrium phase composition of the reaction system was obtained based on the condition of mass balance and the lowest Gibbs free energy of constant pressure and temperature [28]. The heavy metal elements in the R—IFA and WW—IFA were considered in the form of oxides for process analysis. By adjusting the melting temperature, total pressure, chemical composition and proportion of raw materials, and the state of the input reaction system, as well as the stable phase that appeared in the subsequent process, the distribution coefficients of four heavy metal elements in the liquid metal (LM)phase, liquid slag (LS) phase, and gas phase were simulated and calculated.
The R—IFA was characterized by a high content of Ca and low content of Si and Al. The ternary phase diagram of CaO-SiO2-Al2O3 was drawn by the FactSage 8.0 software (developed by Thermfact/CRCT, Montreal, Canada, and GTT-Technologies, Aachen, German), shown in Figure 2. Based on the chemical composition, the R—IFA was located in point 2, where the melting temperature was higher than 1700 °C. The high melting temperature was quite disadvantageous for the actual IFA melting process. To reduce the melting temperature, the proportions of CaO, SiO2, and Al2O3 in the R—IFA were adjusted by charging SiO2, Al2O3, and other flux, which aimed to decrease the melting temperature from point 2 to the lower temperature region of area 2. Under the base condition of a binary alkalinity of 1 (mass ratio of CaO to SiO2) and Al2O3 content of 15%, the mass ratio of the R—IFA and additives was selected as fly ash:SiO2:Al2O3 = 65:26:9. Then, the influence of other variables was further studied. Additionally, the melting atmosphere was also considered based on the actual IFA melting process. The excess air coefficient (EAC) was introduced according to the reference [28]. Some organic components in IFA would combine with oxygen to form gaseous oxides and left the system. The amount of oxygen consumed was fixed according to the steady composition of IFA. The EAC was defined as the ratio of actual oxygen consumption to the above oxygen consumption. While the amount of oxygen was more than the consumed value, the oxidizing atmosphere (OA) formed. The atmosphere included reducing atmosphere (RA), direct melting atmosphere (DMA), and OA, where DMA referred to the atmosphere under the condition that EAC was chosen as 0. This meant that, in the R—IFA melting process, the inner region of the furnace was sealed in good condition, and there was no air infiltration. Likewise, the OA represented that the EAC was 1.2. Furthermore, RA was obtained by adding 5% of C of the total mass of IFA. The calculation schemas are shown in Figure 3.

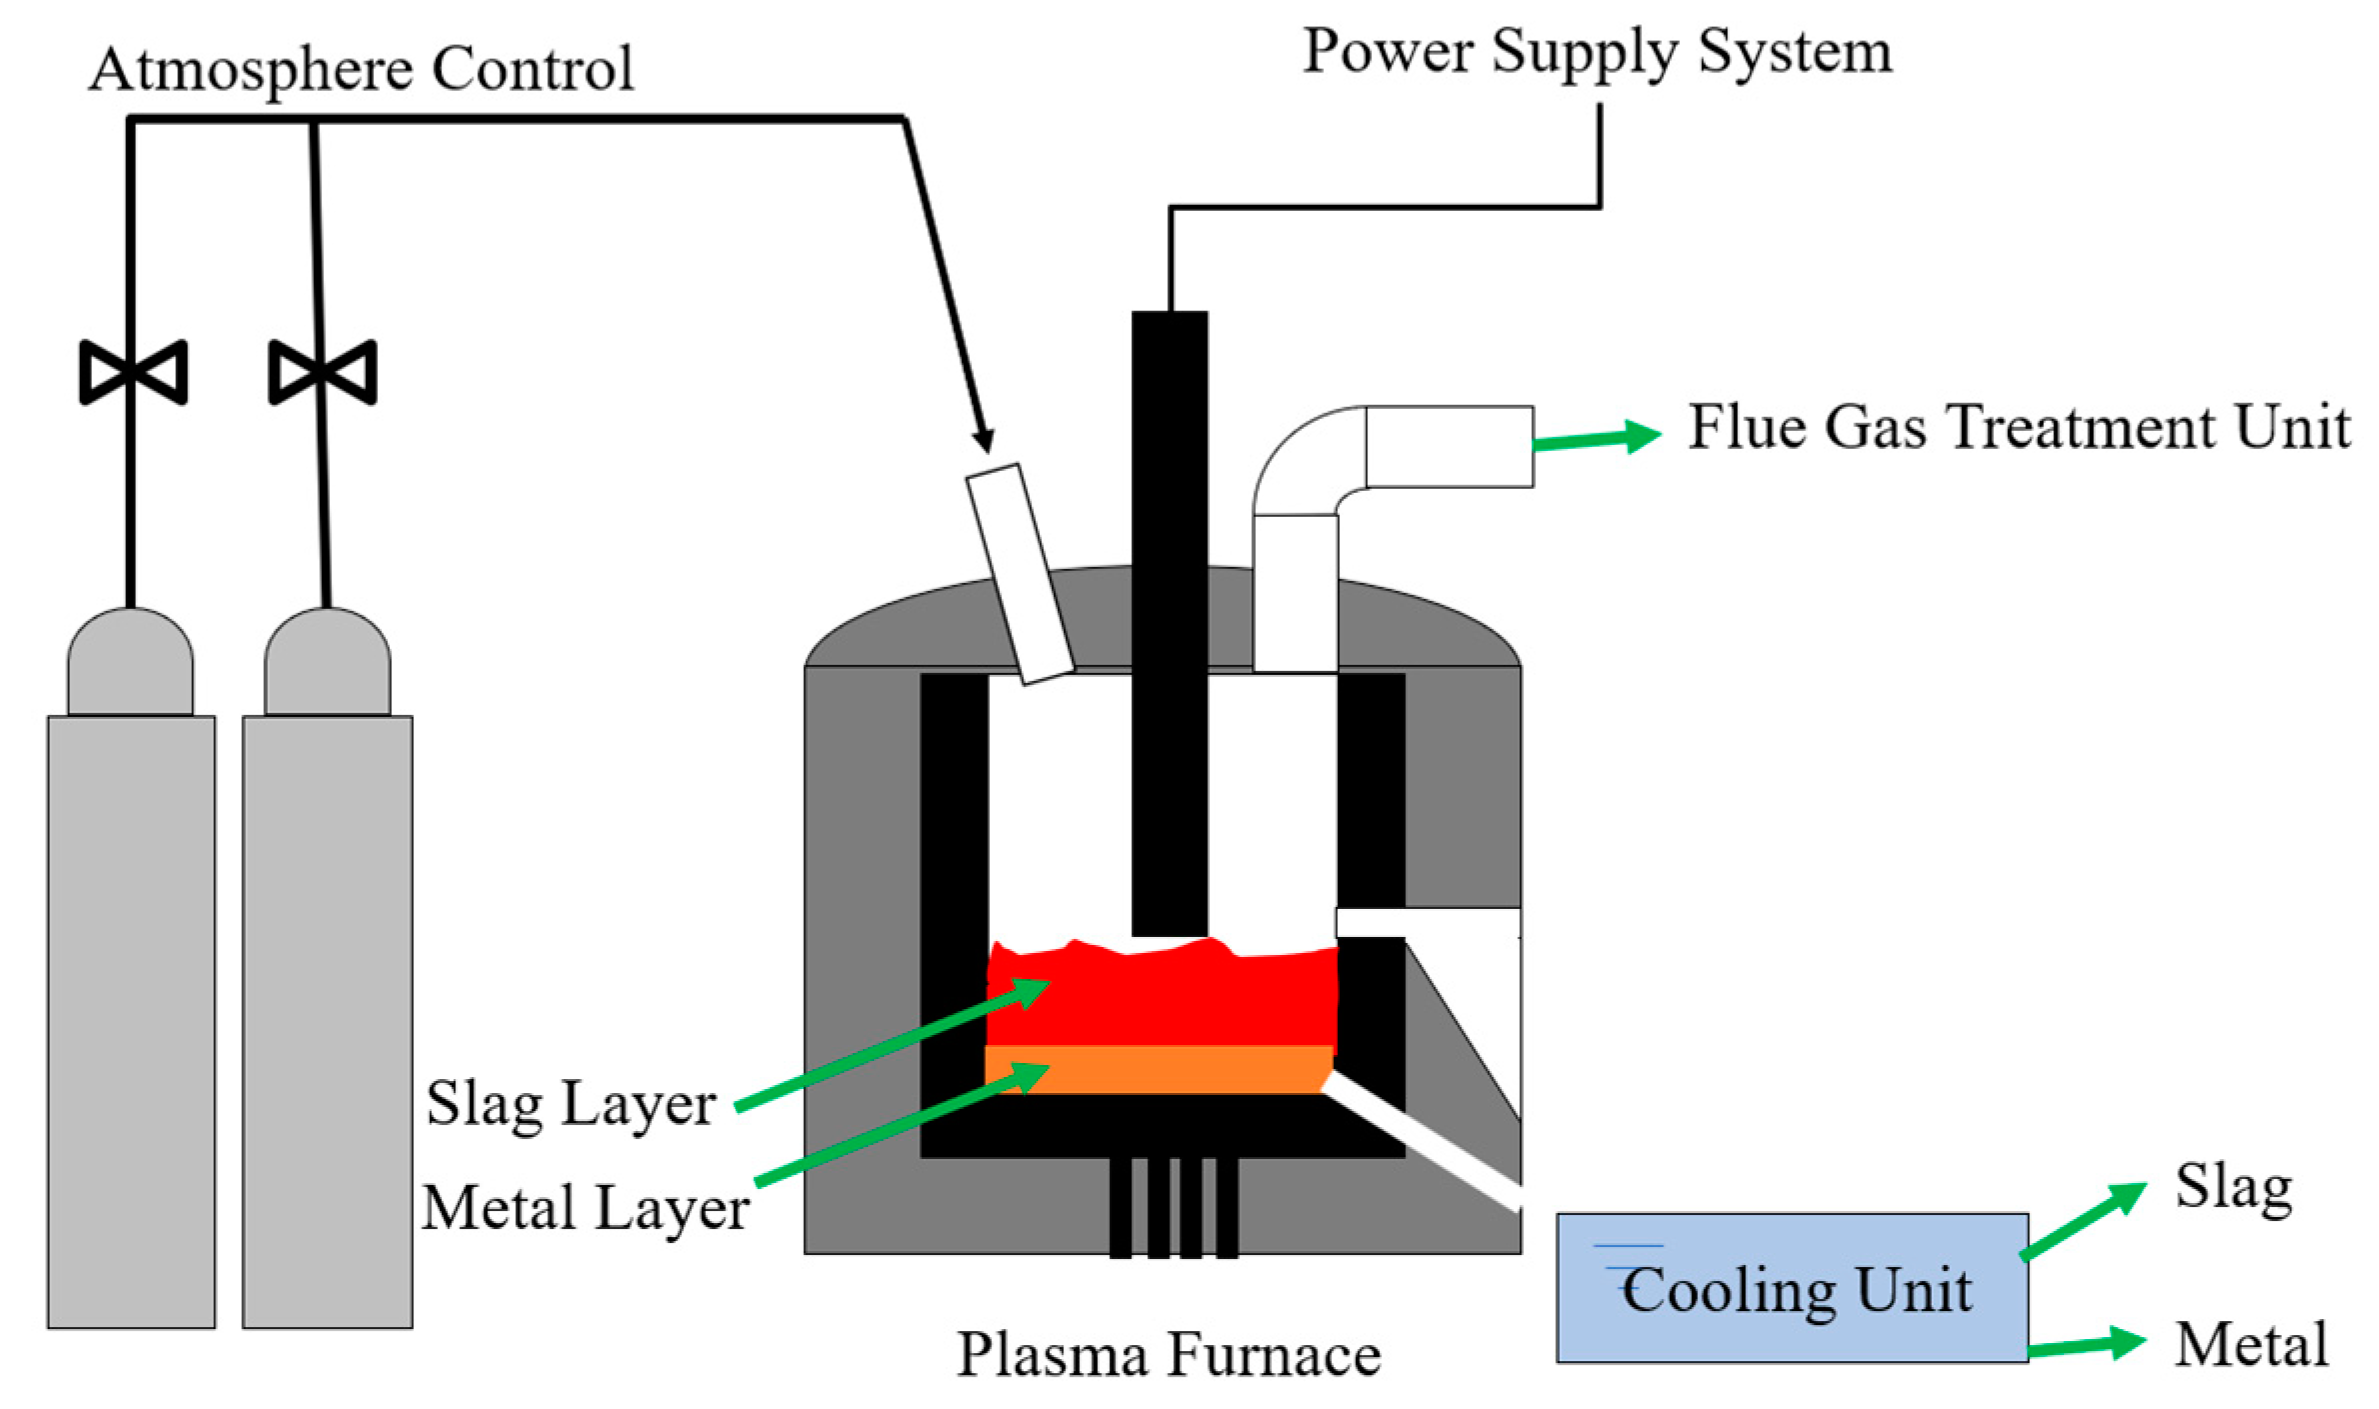
2.3. Experimental Procedure and Detection Methods

To verify the theoretical calculation results of the HSC 6.0 software, physical experiments were conducted. The experimental facilities are shown in Figure 4. These included a power supply system, a plasma melting furnace, a gas supply unit, a tail gas purification unit, and a slag cooling device. The plasma melting furnace was heated by a DC plasma arc with 50 KW of power [29,30]. The results of the R—IFA melting experiment under the conditions of different temperatures, atmospheres, and iron baths were collected. The experimental procedure was as follows:
(1)
The melting experiments were carried out by adjusting the melting electrical power of the plasma furnace. The melting temperature was changed and maintained in the range of 1100–1600 °C, while other conditions remained unchanged.
(2)
Under the conditions of a temperature of 1300 °C and alkalinity of 0.8, the melting state in the furnace variated by iron bath added. The atmosphere in the furnace was changed by connecting the external gas supply unit and carbon charged. The sampling analysis was conducted after the melting experiments. The detailed conditions are shown in Table 2.
An X-ray fluorescence spectrometer and a direct-reading inductively coupled plasma spectrometer were adopted in the performance detection. The total content and distribution of Fe, Pb, Zn, and Cu in the glass slag and alloy were estimated, and the test results were compared with the calculation results.

3. Results Analysis

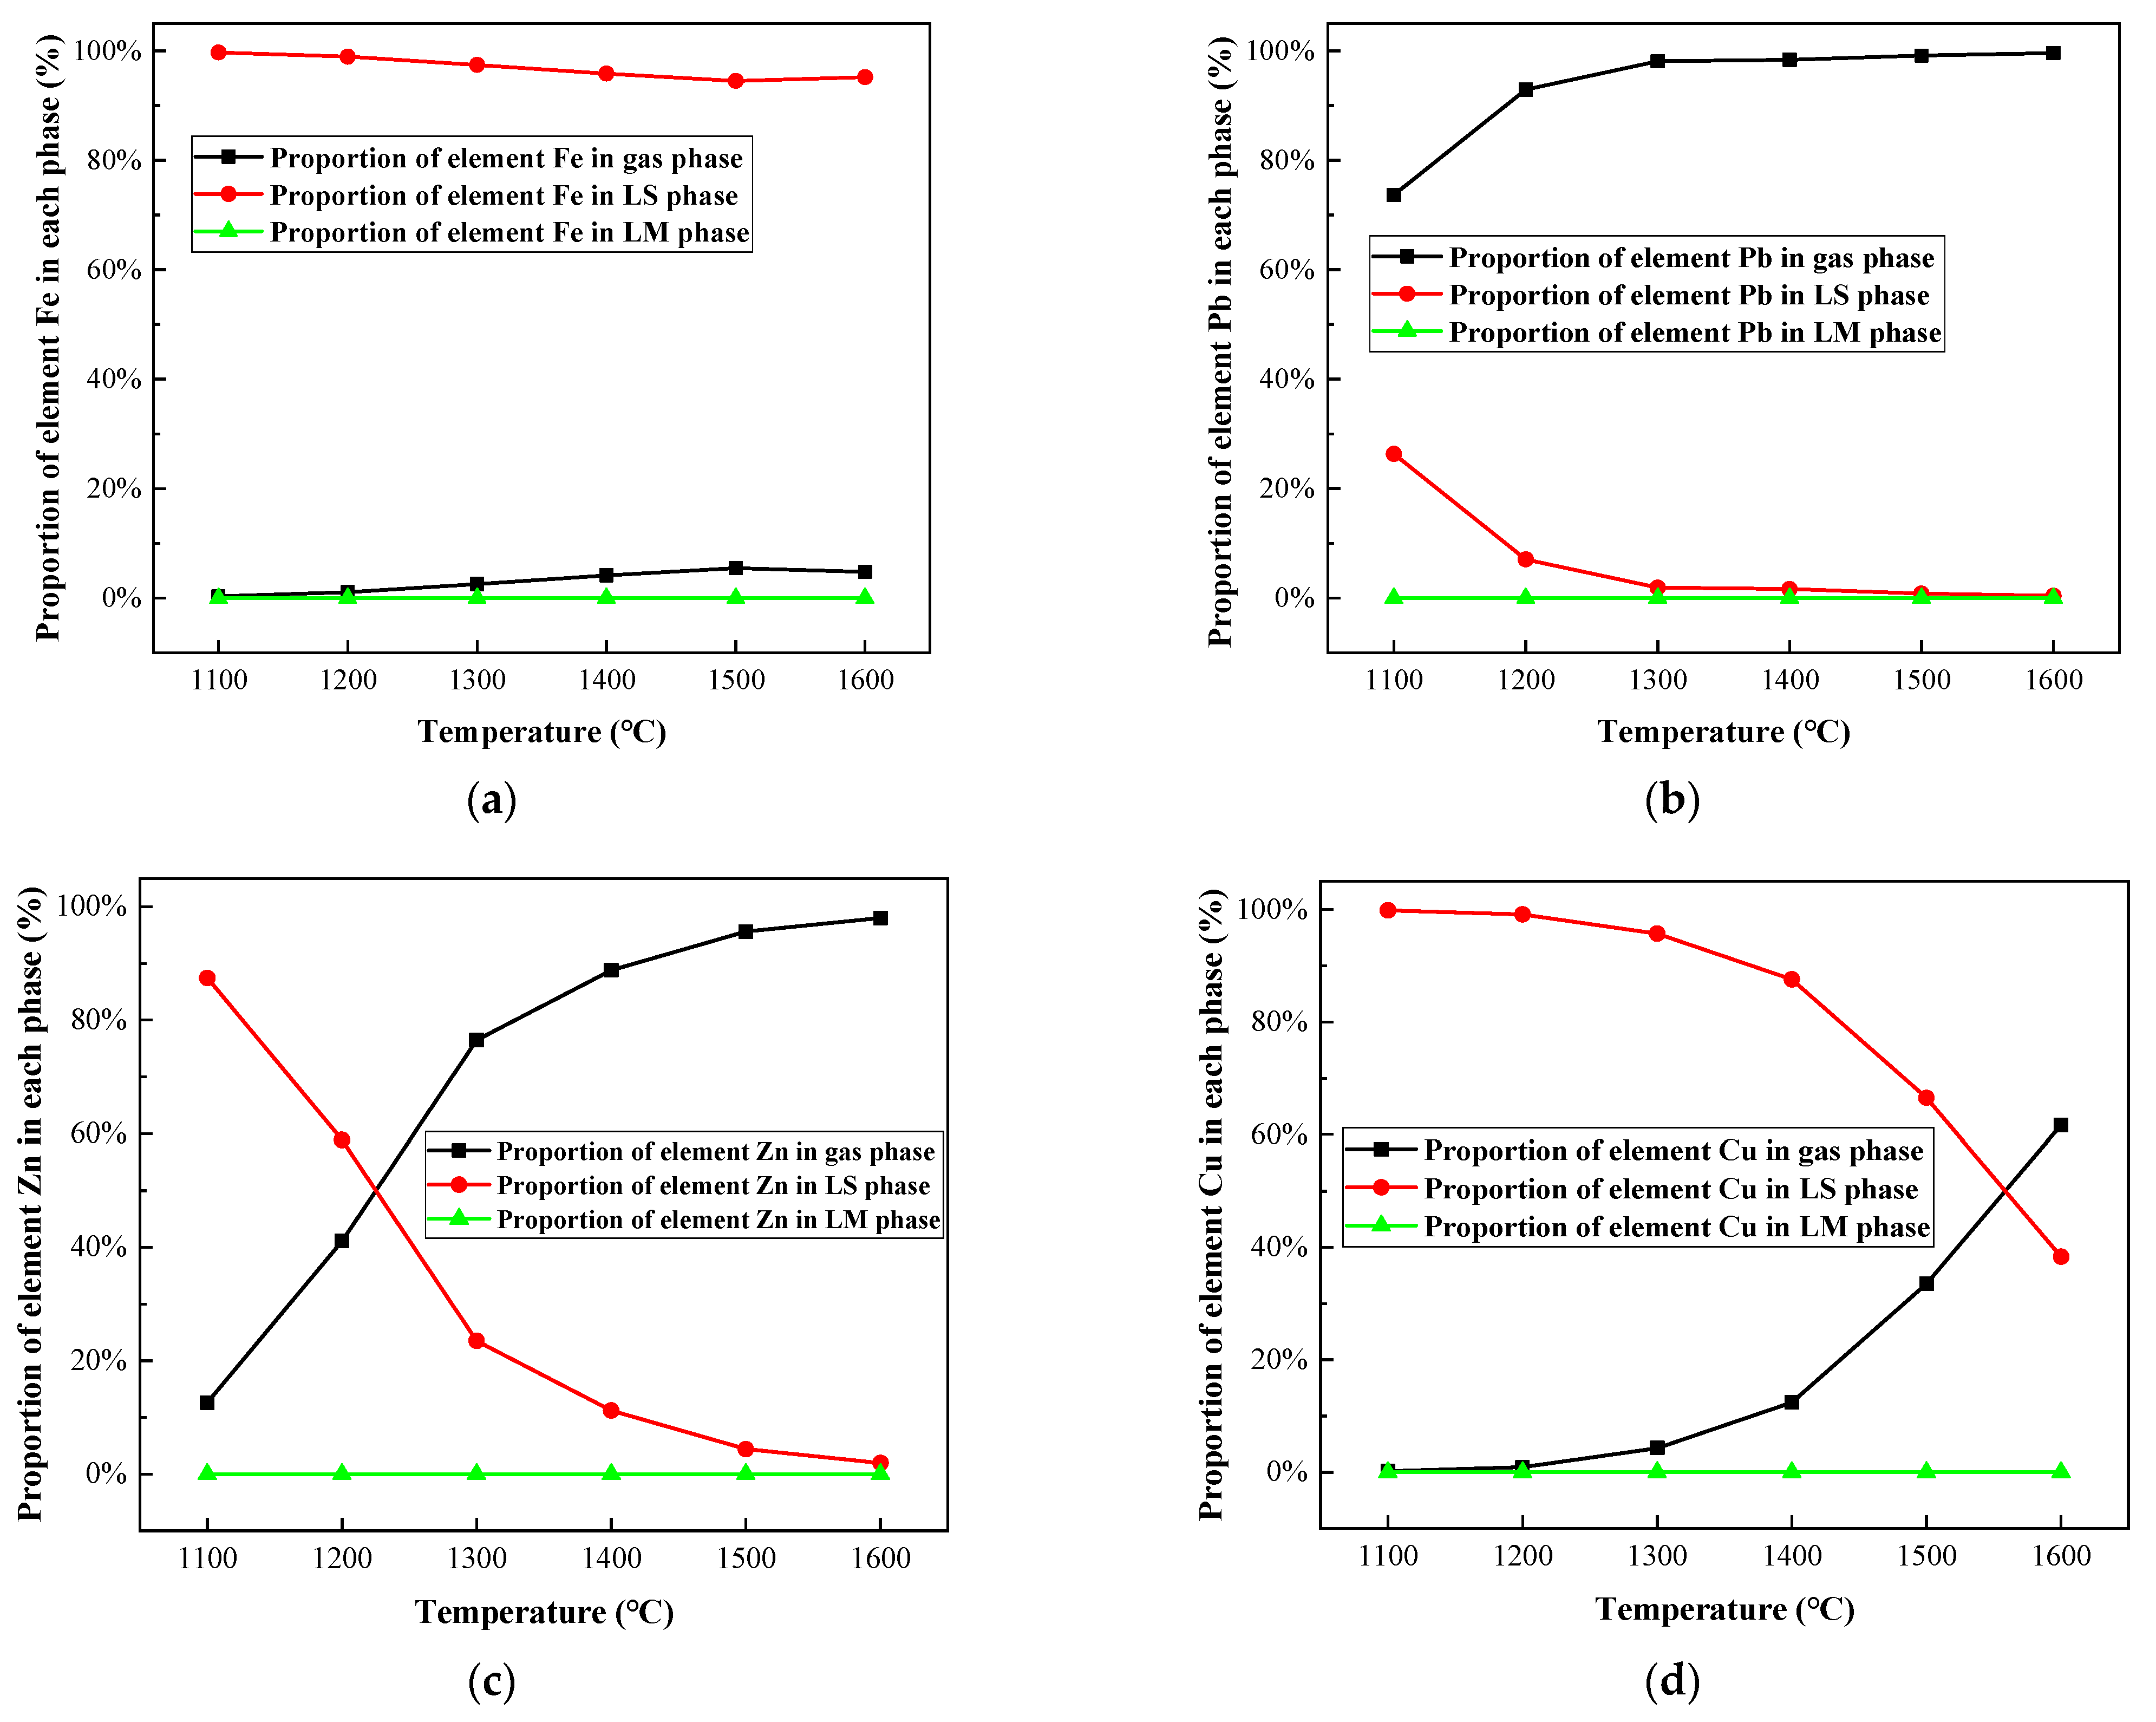
3.1. Effect of Melting Temperature on Selected Heavy Metal Elements Distribution in R—IFA Melting Process

Figure 5 and Figure 6, and Table A1, Table A2, Table A3 and Table A4 show the calculation results of the distribution forms of Fe, Pb, Zn, and Cu in the temperature range of 1100–1600 °C. It could be concluded in Figure 5a and Figure 6a that Fe mainly existed in the slag phase in the form of oxide and silicate, while a small amount of Fe volatilized into the gas phase in the form of FeCl2 (g). With the temperature increased from 1100 to 1600 °C, the proportion of FeCl2 (g) increased from 0.29% to 5.43%.
The variation of the process products of Pb with temperature is shown in Figure 5b and Figure 6b. Within the melting temperature range of 1100–1600 °C, Pb volatilized into a gas phase, mainly in the form of gaseous products, such as PbS (g), PbCl2 (g), PbCl (g), and PbCl4 (g). As the temperature increased, the proportion of Pb into the gas phase increased from 73.65% to 99.6%, and the proportion of PbS (g) decreased, while the proportion of PbCl2 (g) and PbCl (g) increased.
The variation of the process products of Zn with temperature is shown in Figure 5c and Figure 6c. The proportion of ZnS and ZnO in solid products gradually decreased, and the proportion of ZnCl2 (g) in gaseous products significantly increased. Furthermore, the proportion of gaseous products increased from 12.57% to 98%.
The variation of process products of Cu with temperature is shown in Figure 5d and Figure 6d. When the melting temperature was below 1300 °C, Cu mainly existed in nonvolatile sulfide, aluminate, and CuCl. When the temperature was above 1300 °C, the proportion of gaseous product of CuCl (g) increased significantly, reaching 58.96% at 1600 °C.
In conclusion, a large amount of chloride salts, such as NaCl, KCl, and CaCl2, accounted for about 30% of the total amount of IFA, which promoted the conversion of heavy metals into metal chlorides with a low boiling point, especially for Pb, Zn, and Cu, in IFA melting. The phenomenon was consistent with the experimental research results of reference [23]. When the temperature was above 1300 °C, Pb and Zn mainly volatilized into a gas phase, while Fe and Cu solidified mainly in a slag phase in a nonvolatile state. From the perspective of enrichment of metals and energy consumption reduction of the IFA melting process, 1300 °C was selected as the suitable melting temperature.

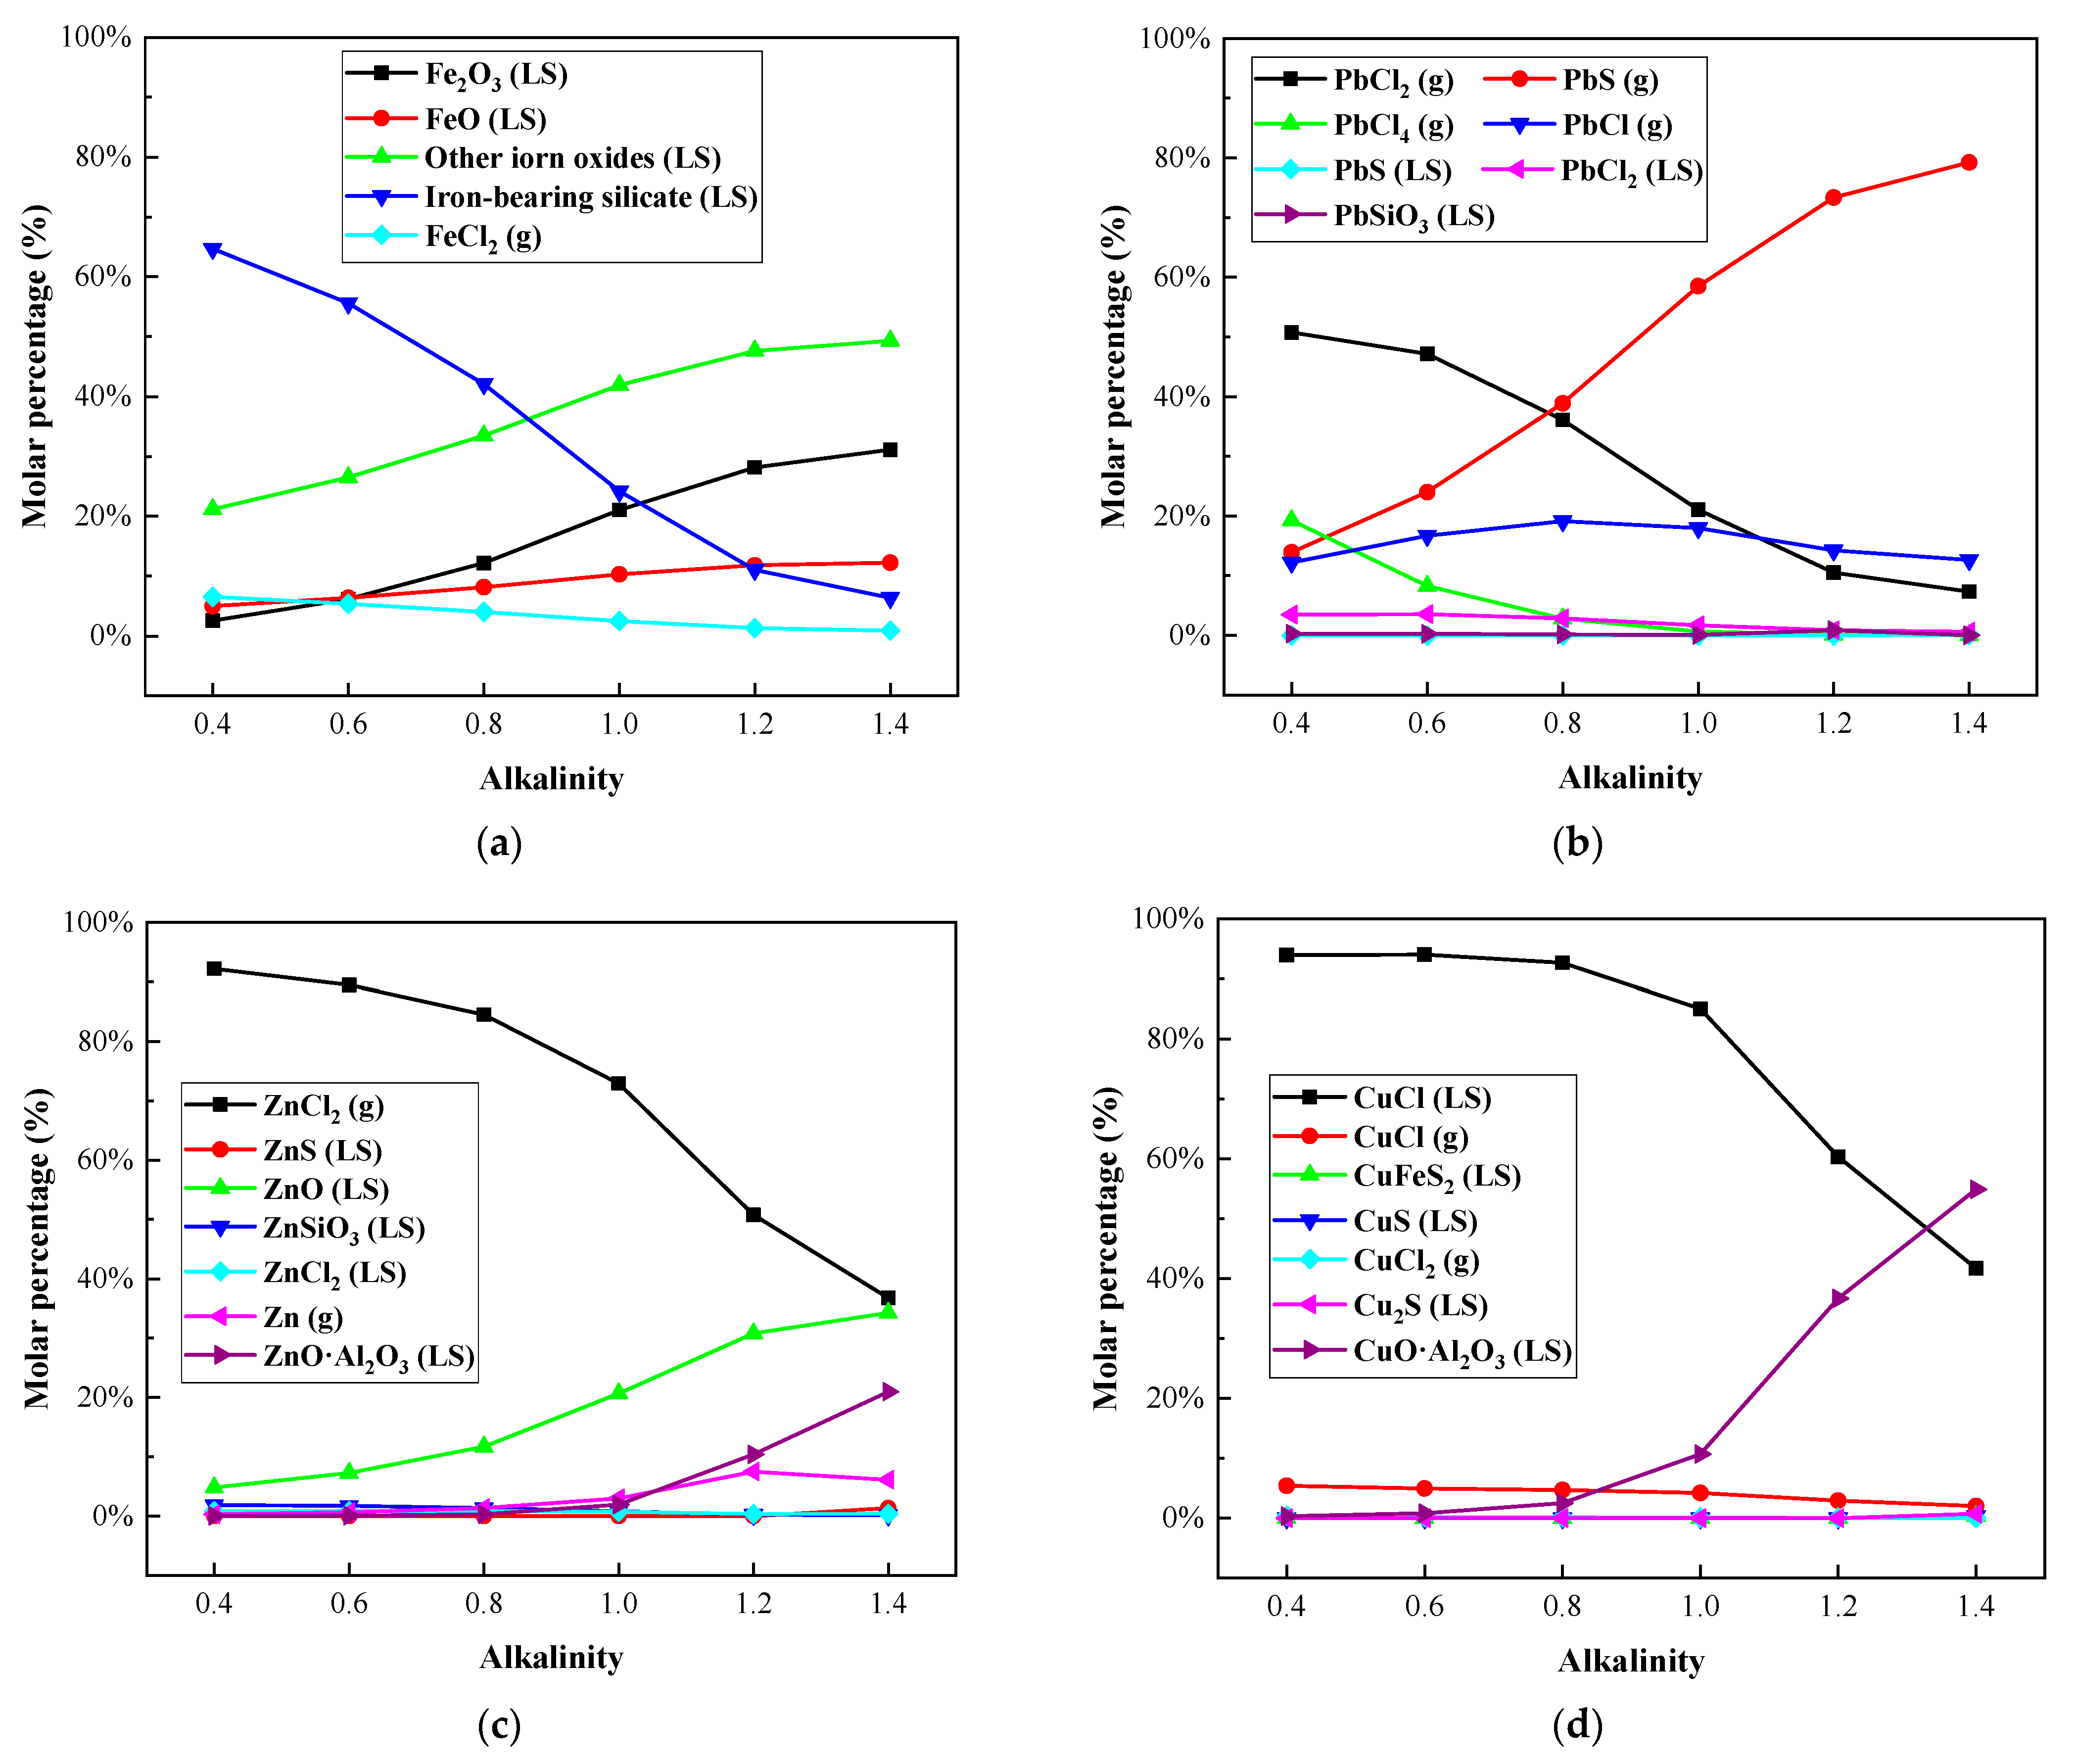
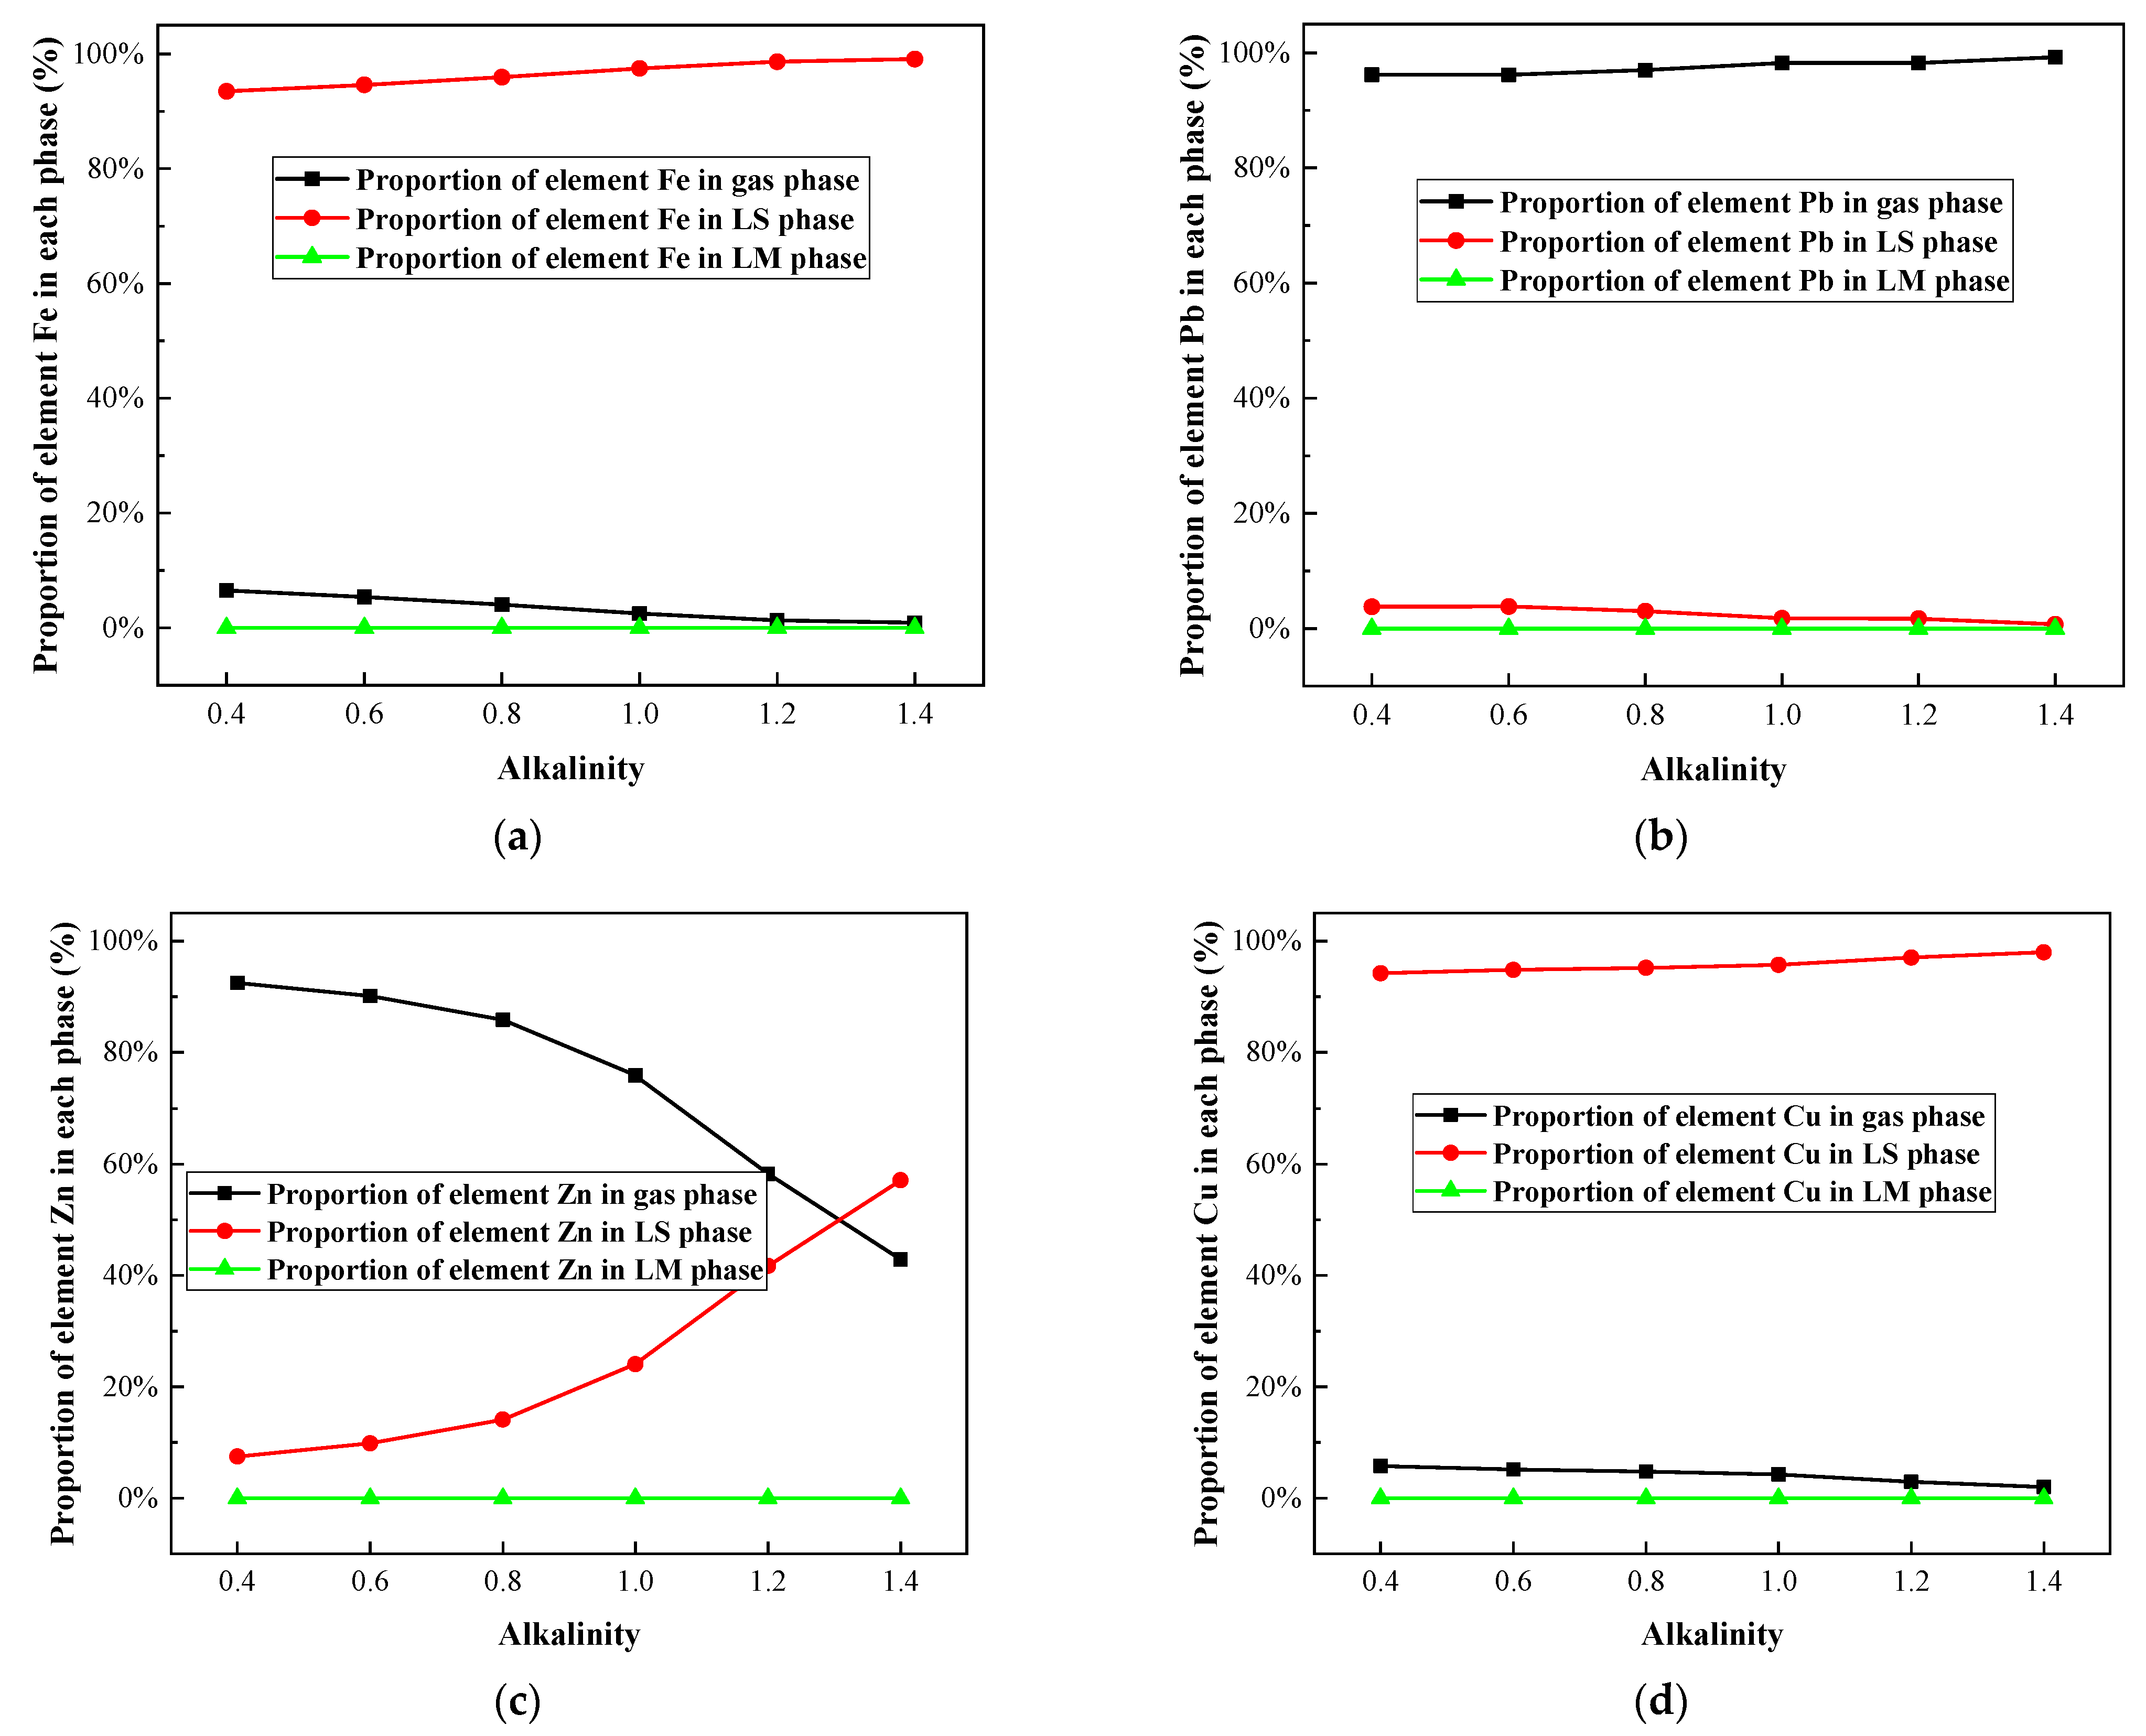
3.2. Effect of Alkalinity on Selected Heavy Metal Elements Distribution in R—IFA Melting Process

Under the melting temperature of 1300 °C, the influence of alkalinity on the heavy metal morphology distribution in the IFA melting process was investigated. The results are shown in Figure 7 and Figure 8, and Table A5, Table A6, Table A7 and Table A8.
It could be seen from Figure 7a and Figure 8a that Fe mainly existed in the form of silicate and oxide. A small amount of Fe volatilized into the gas phase in the form of FeCl2 (g), and the increase in alkalinity significantly inhibited the process of Fe volatilization. When the alkalinity increased from 0.4 to 1.4, the component of FeCl2 (g) decreased from 6.4% to 1%, the proportion of iron containing silicate decreased significantly, and the proportion of iron oxide increased gradually. The phenomenon was mainly related to the decrease in silicon content in complex compounds formed by combining with iron in the melting process.
The Pb mainly formed the gaseous products of PbCl (g), PbCl2 (g), PbCl4 (g), and PbS (g), shown in Figure 7b and Figure 8b. With the increase in alkalinity, the proportion of chloride in Pb decreased, while the proportion of sulfide increased. The proportion of the gas-phase product of Pb was more than 96%, reaching up to 99.26%. Therefore, there was little effect of alkalinity on the volatilization rate of Pb.
As shown in Figure 7c and Figure 8c, with the increase in alkalinity, the proportion of the gaseous product of ZnCl2 (g) decreased, especially when the basicity was greater than 0.8. The proportion of non-volatile ZnO and ZnO·Al2O3 increased significantly. It could be concluded that the increase in alkalinity inhibited the volatilization of Zn.
Cu was mainly distributed in the slag phase as nonvolatile CuCl and CuO·Al2O3, and the gaseous product CuCl (g) accounted for about 5%. The content of CuCl in the slag phase decreased from more than 90% to 41.73%, and the proportion of the CuO·Al2O3 phase increased to about 54%. The increase in alkalinity had little effect on the volatilization of Cu.
In conclusion, when the alkalinity changed in the range of 0.4–1.4, Pb mainly existed in a gaseous phase, and Fe and Cu mainly solidified in a slag phase as a nonvolatile phase. The proportion of Zn volatilized into the gas phase decreased significantly when the alkalinity was higher than 0.8. This could explain why the lower alkalinity led to the high slag viscosity. To ensure the smooth smelting process of IFA and enrichment of metals, the alkalinity of 0.8 was recommended, and increased the melting temperature [31].

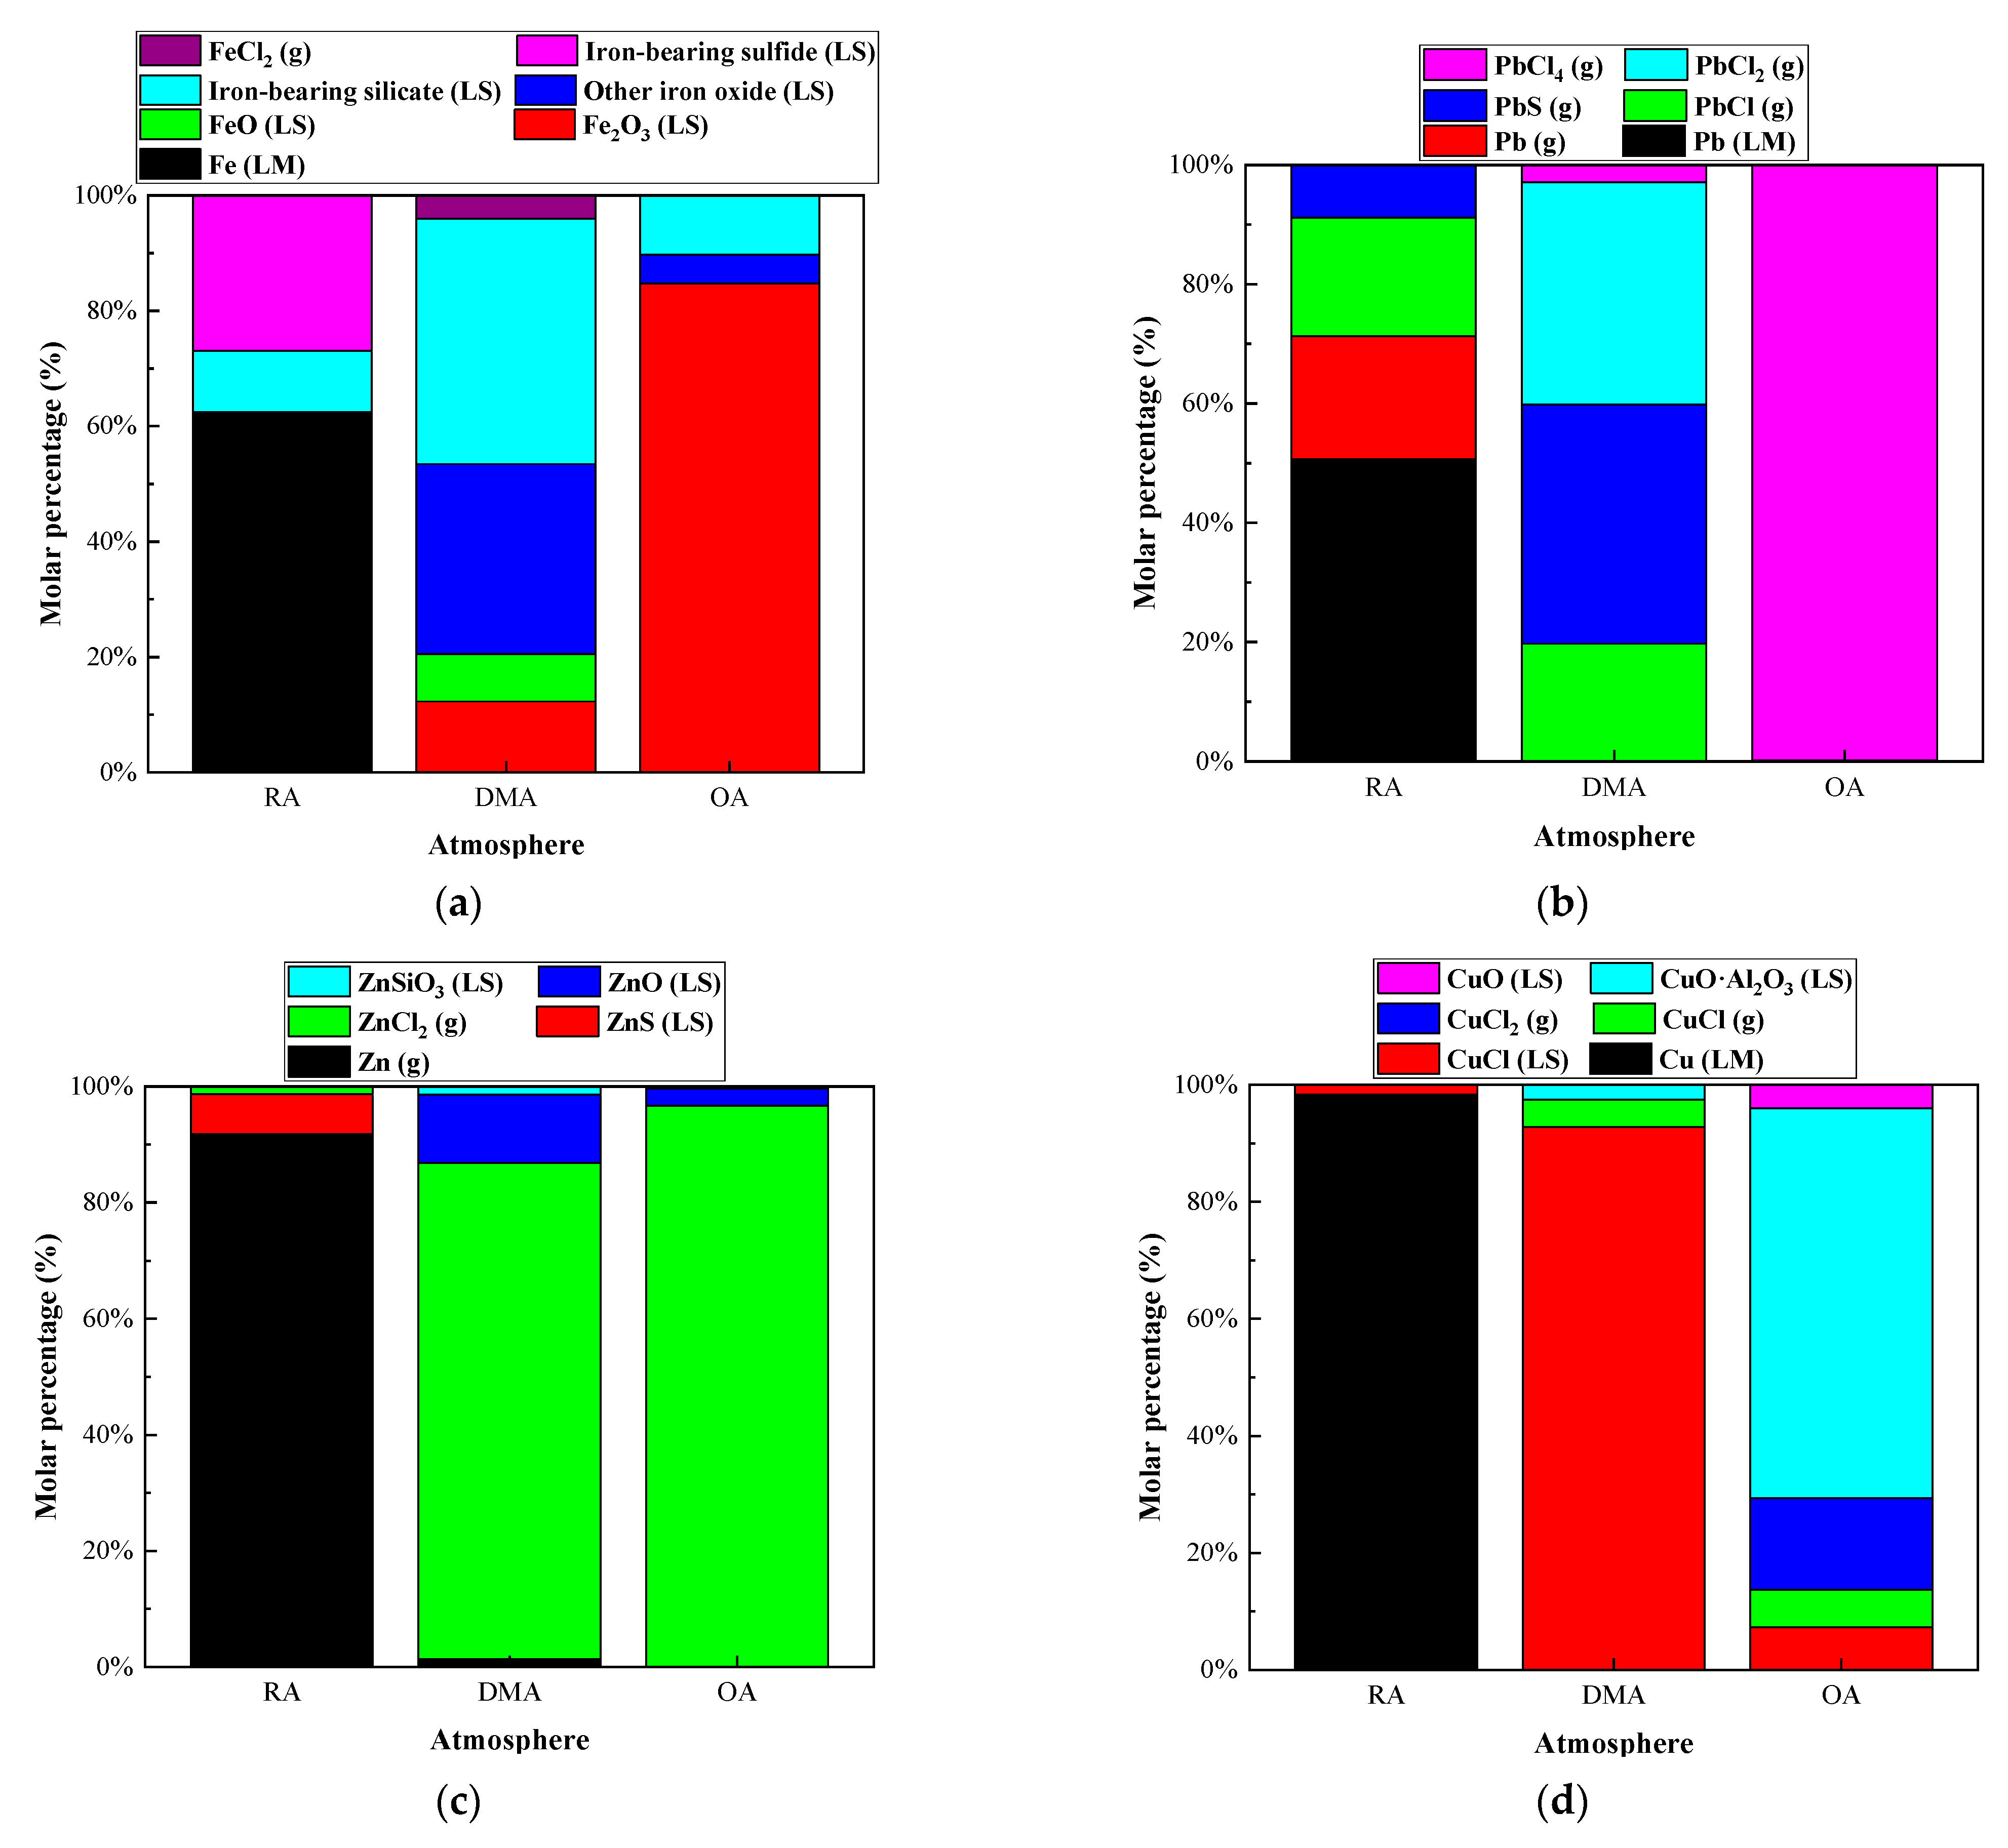
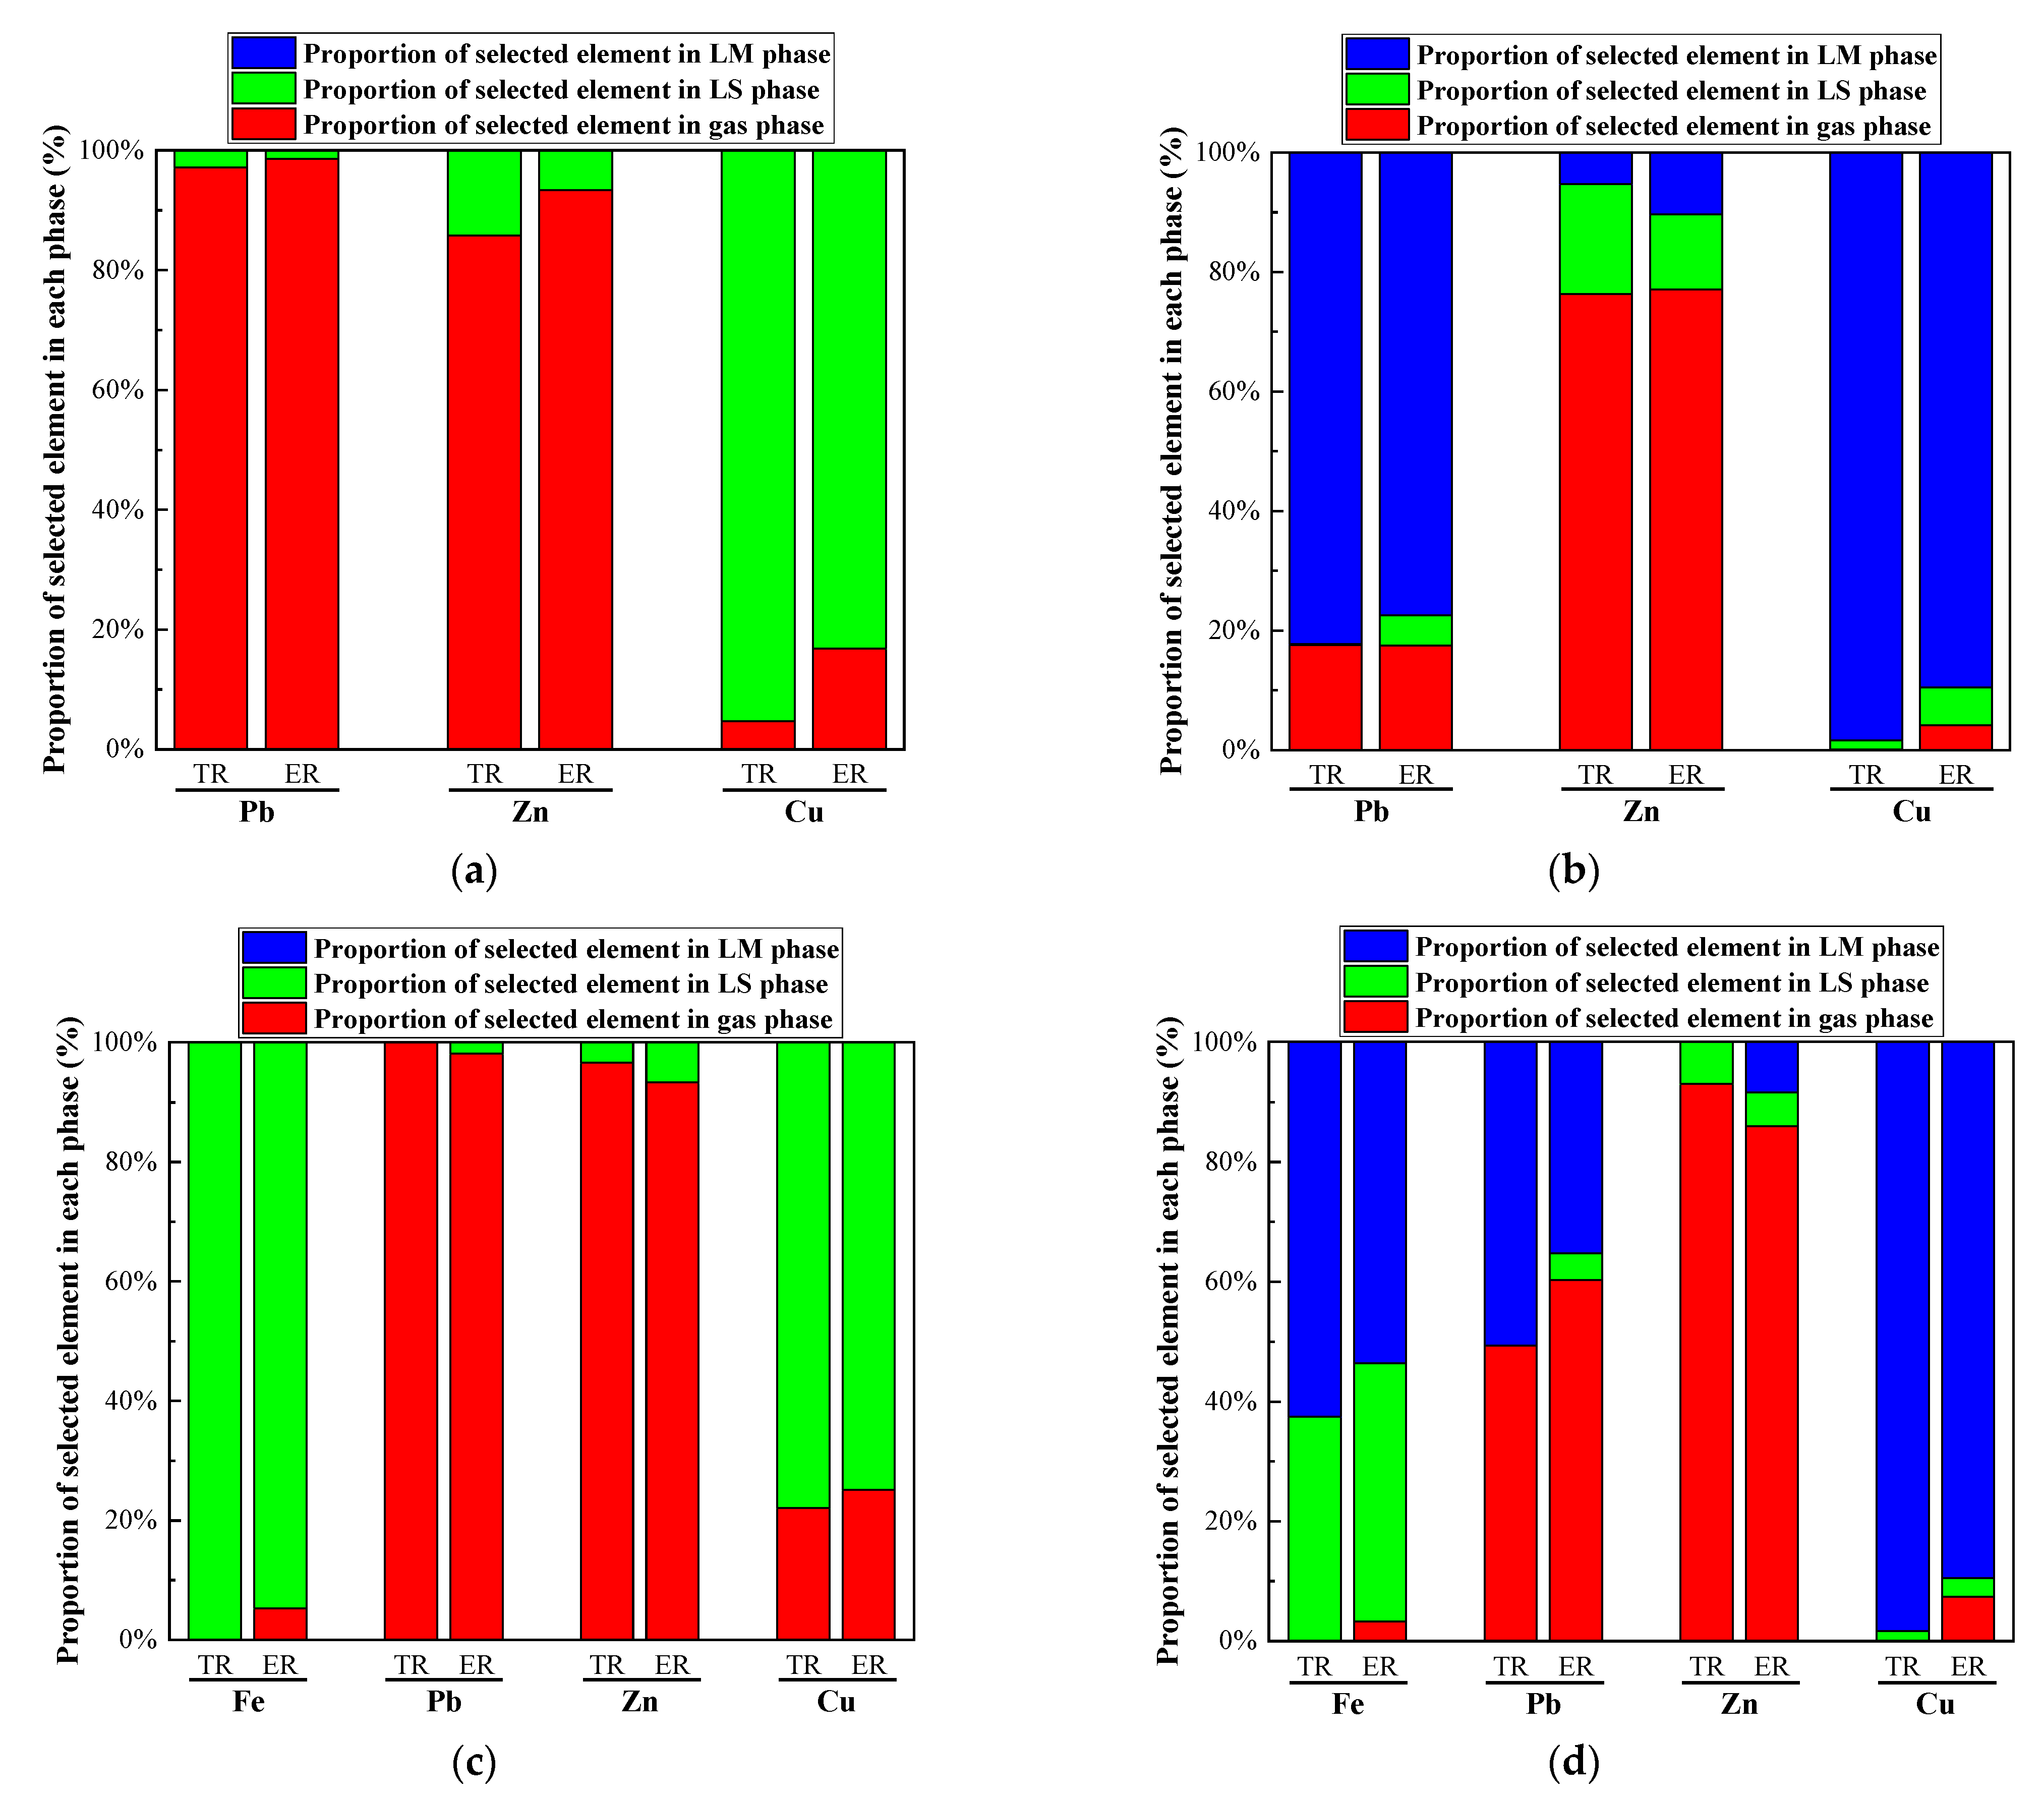
3.3. Effect of Atmosphere on Selected Heavy Metal Elements Distribution in R—IFA Melting Process

The effect of redox atmosphere on the heavy metal distribution in the IFA melting process was investigated under the conditions of a melting temperature of 1300 °C and alkalinity of 0.8. The research results are shown in Figure 9 and Figure 10, and Table A9, Table A10, Table A11 and Table A12. In the reducing conditions, the products of Fe, Pb, Zn, and Cu mainly existed in the form of metal elements, and the mass proportions of the four elements were 62.51%, 71.28%, 91.76%, and 98.39%, respectively. Due to the low boiling point, about 90% of Zn entered the gas phase. About 50% of Pb entered the gas phase as Pb (g), PbCl (g), and PbS (g), while the rest existed in the form of a metal element. Fe and Cu existed in the forms of metal elementals or metal sulfide. Due to the high boiling point, the proportion of them entering the gas phase was small, and most of them formed alloys.
Under the oxidizing atmosphere, the products of Fe mainly existed in the slag phase in the forms of oxide and composite silicate. About 20% of the products of Cu volatilized into the gas phase in the forms of CuCl2 (g) and CuCl (g), and the remaining existed in the slag phase in the forms of CuO and CuO·Al2O3. Almost all Pb and Zn entered the gas phase in the forms of chloride with a low boiling point.
In summary, Zn would enter the gas phase as a volatile product with a low boiling point under oxidation or reduction atmosphere. The volatilization of Pb was inhibited in the reducing atmosphere, which was in line with the research results of the literature [32]. Fe and Cu existed in the slag phase in the forms of oxide, silicate, and aluminate in the oxidizing atmosphere, while in the reducing conditions, they were reduced to metal elements to form an alloy phase.

3.4. Effect of Chlorine Content in Raw Materials on Selected Heavy Metal Elements Distribution in IFA Melting Process

The effect of chlorine on the heavy metal distribution in raw IFA and water-washing IFA melting processes was investigated under the conditions of a melting temperature of 1300 °C and alkalinity of 0.8. The water-washing process was helpful for removing soluble chlorine salt. The research results are shown in Figure 11 and Figure 12, and Table A13, Table A14, Table A15 and Table A16. In the raw IFA melting process, the products of Pb, Zn, and Cu mainly existed in the form of chloride, while only 4% of the products of Fe existed in the form of chloride, and the rest were oxides and silicates. The proportion of Pb, Zn, Cu, and Fe entering the gas phase was 97.15%, 85.84%, 4.68%, and 4.00%, respectively. In the water-washing IFA melting processes, the products of each metal element were mainly metal sulfide, and the proportion of Pb, Zn, Cu, and Fe entering the gas phase was 75.42%, 9.89%, 0.66%, and 0.61%, respectively. It could be concluded that the pretreatment of IFA with water washing had a significant inhibition effect on the volatilization of Zn and Pb, but the effect was limited, while the effect on Fe and Cu was not significant.

3.5. Effect of Iron Bath Charged on Selected Heavy Metal Elements Distribution in R—IFA Melting Process

In the actual plasma melting process of IFA, the iron bath was usually arranged at the bottom of the furnace to promote the heat transfer and the chemical reaction [33,34]. The effect of the iron bath on the heavy metal distribution in raw IFA and water-washing IFA melting processes was investigated under the conditions of a melting temperature of 1300 °C and alkalinity of 0.8. The research results are shown in Figure 13 and Figure 14, and Table A17, Table A18 and Table A19.
In the IFA melting process without pig iron added, the main products of Pb were PbCl (g), PbCl2 (g), PbCl4 (g), and PbS (g), and the gas products accounted for 97.15%. The main products of Zn were ZnCl2 (g) and ZnO, and the gas products accounted for 76.35%. The main products of Cu were CuCl (g) and CuO·Al2O3, and the gas products accounted for 4.68%, while the rest entered the slag phase. When the pig iron was added in the IFA melting process, 98.42% of Cu, 82.28% of Pb, and 5% of Zn entered the iron phase as metallic elements. A total of 76.3% of Zn entered the gas phase as Zn (g) and ZnCl2 (g). In the IFA melting process, the heavy metal compounds were reduced to elemental compounds by the reducing agent of carbon in pig iron. The Zn with a low boiling point volatilized in the forms of elemental and chloride. The heavy metals of Cu and Pb with a high boiling point were captured by the iron bath, which could realize the classification and enrichment of heavy metals.

4. Comparison of Experimental and Theoretical Results in R—IFA Melting Process

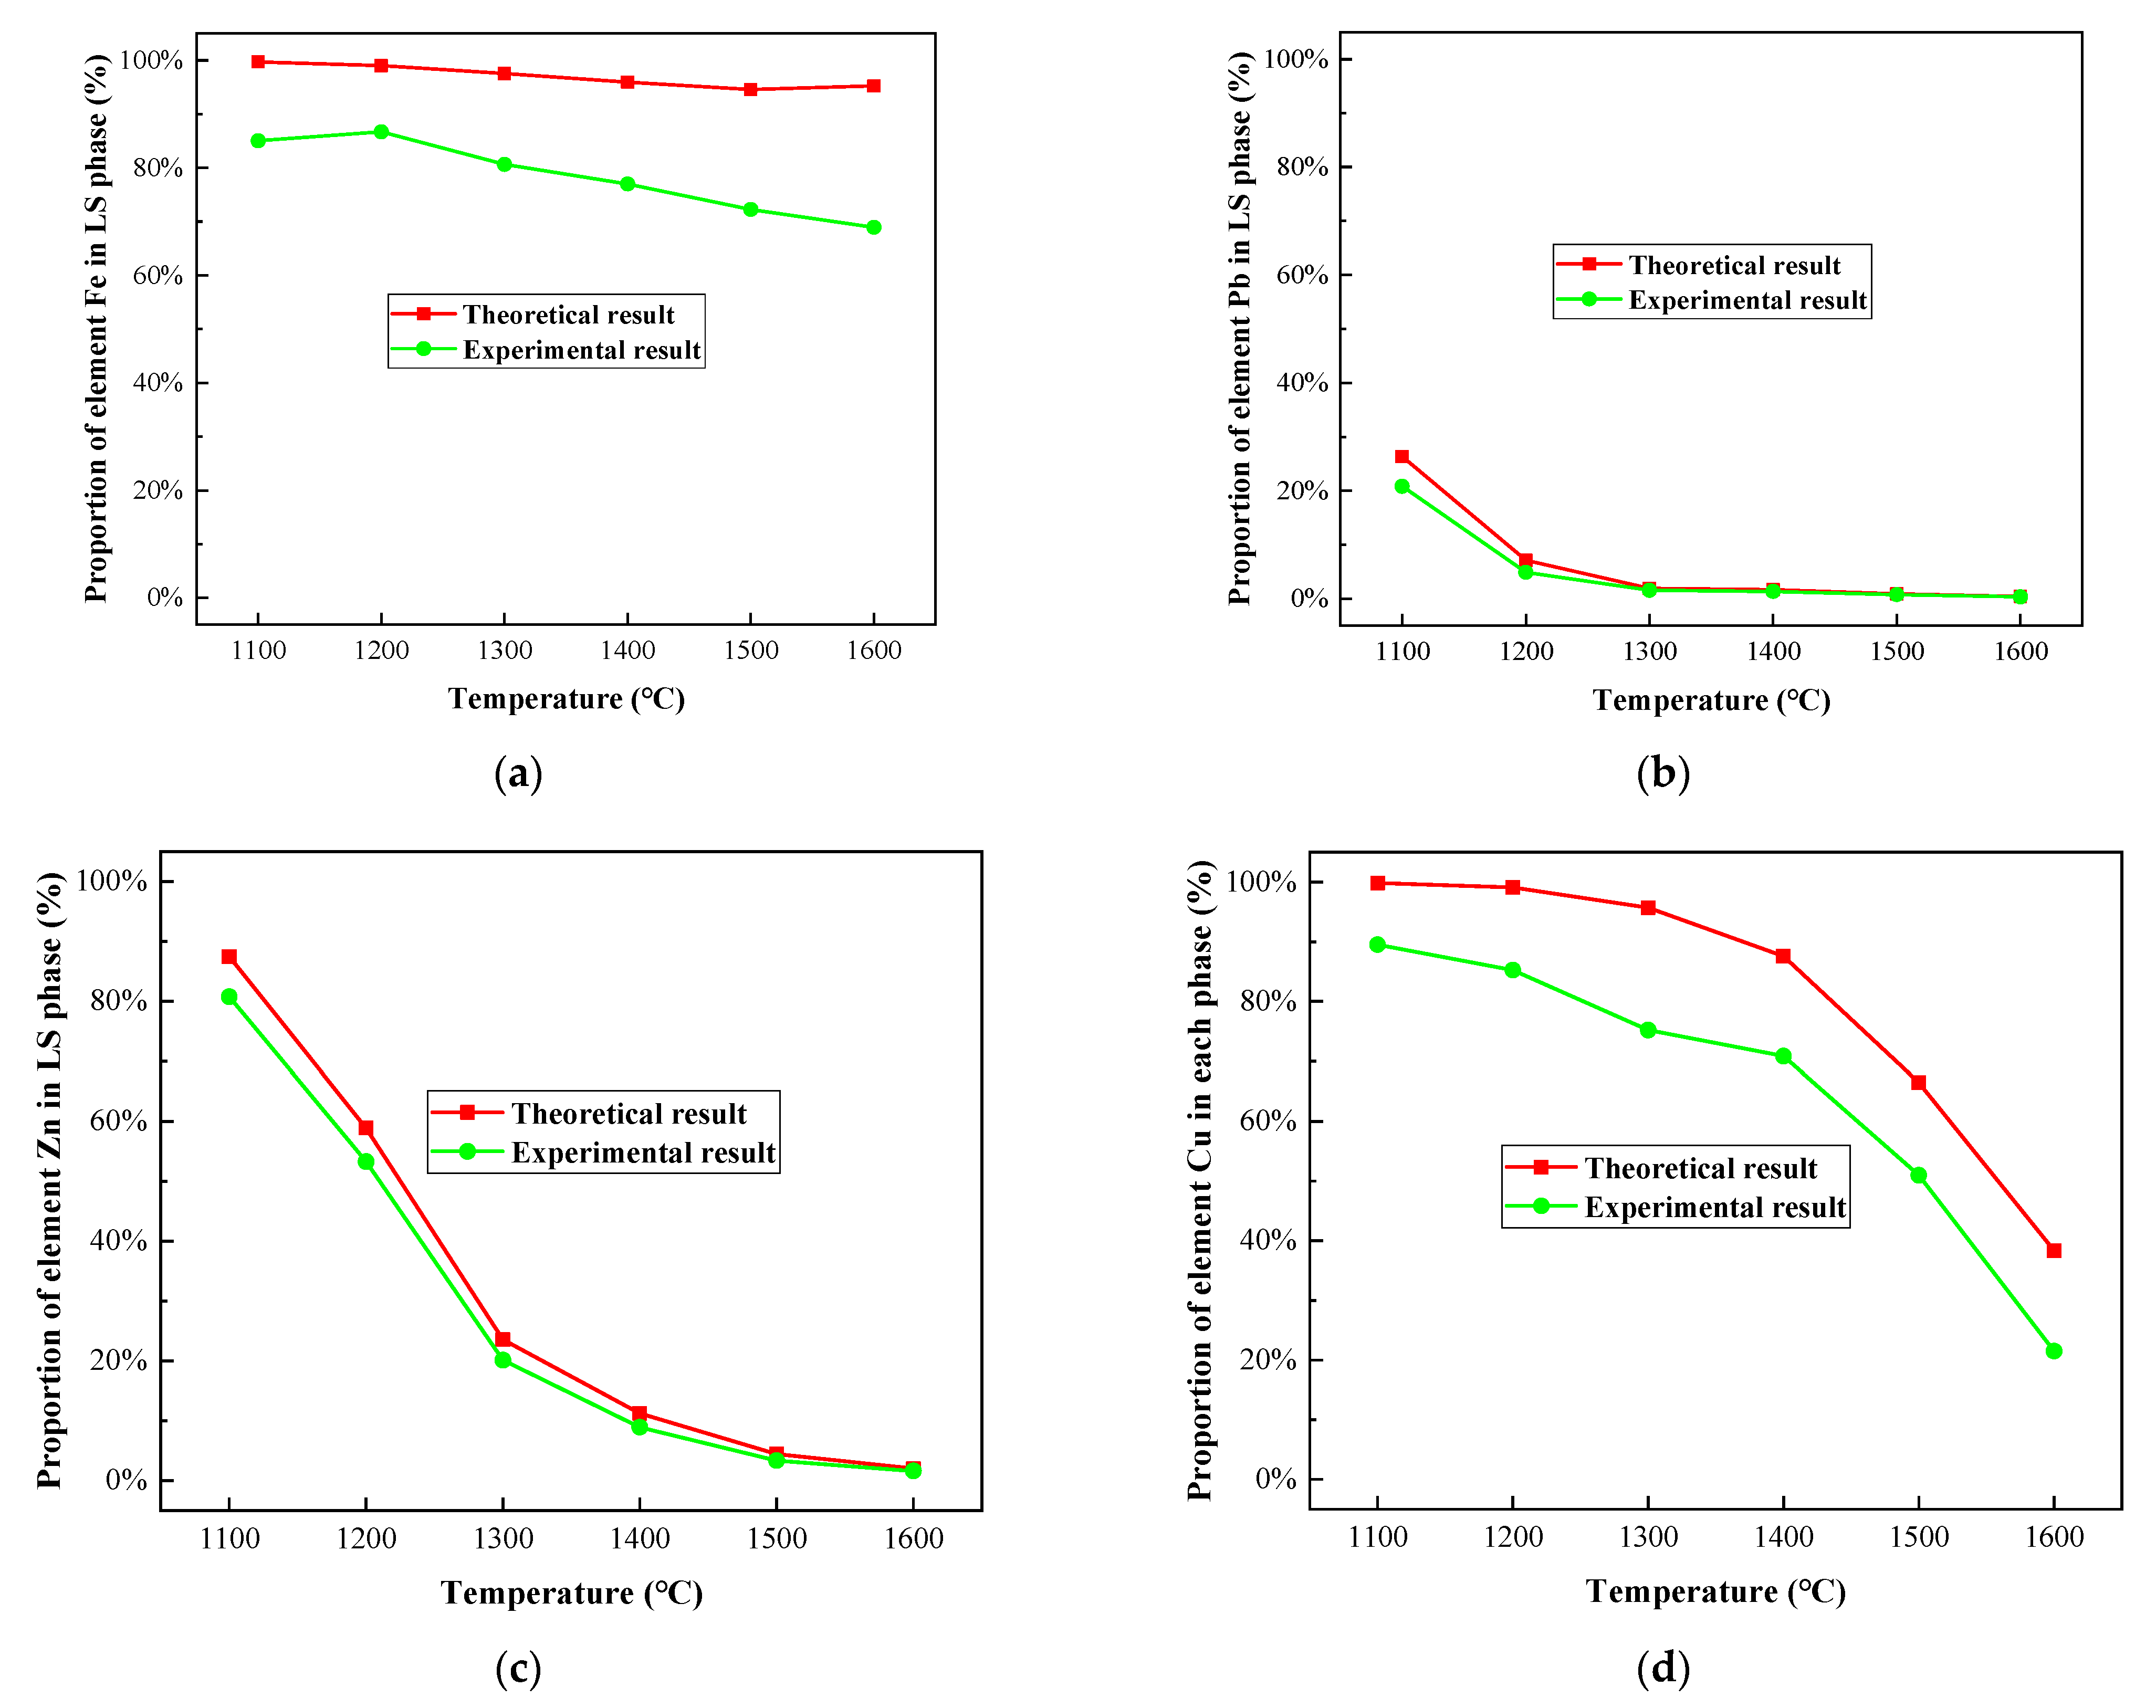
4.1. Comparison of Experimental and Theoretical Results on Melting Temperature in R—IFA Melting Process

The elements in the slag phase and alloy phase obtained at different melting temperatures were detected. The proportion of Fe, Pb, Cu, and Zn was compared with the above simulation results, as shown in Figure 15 and Table A20.
In the experimental results, the proportion of Fe, Pb, Zn, and Cu elements in the slag phase decreased gradually with the increase in temperature. The trend of proportions of the four heavy metals in the slag phase in experimental results was close to the calculated results, but the values of experimental results were slightly lower than the calculated results. Despite the uncontrollable factors in the experiment, the simulated data was calculated under the reaction equilibrium state in the HSC 6.0 software (developed by Outokumpu Research Center, Finland), which was different from the situation of the actual smelting process. Lowering the concentration of the product allowed the reaction to proceed in the direction of the product.

4.2. Comparison of Experimental and Theoretical Results on Atmosphere and Iron Bath Charged in R—IFA Melting Process

The experimental results of the distribution of Fe, Pb, Zn, and Cu elements in each phase under four conditions in Table 2 were compared with the simulation results, shown in Figure 16 and Table A21, Table A22, Table A23 and Table A24.
In Figure 16, the trend of the distribution of four heavy metals in three phases in experimental results was basically consistent with the simulated values. Under the conditions of A and C in Table 2, the products of IFA melting were the gas phase and the slag phase, without an alloy phase. Most of Pb and Zn entered the gas phase, while most of Fe and Cu entered the slag phase. Under the conditions of B and D, the products of IFA melting were the gas phase, slag phase, and alloy phase, with the heavy metals mainly distributed in the gas phase, slag phase, and alloy phase. Cu and Pb were mostly enriched in the alloy phase, while most of Zn entered the gas phase. Under the reductive atmosphere, most of Cu and Zn entered the alloy phase. The proportion of Fe in the slag phase and alloy phase was about half, and the proportion of Pb in the alloy phase and gas phase was about 50%, respectively. The experimental results were slightly different from the simulation results, but the trend was consistent with Section 4.1. This was mainly because the kinetic factors such as melting time and temperature rise rate were not considered in the thermodynamic equilibrium calculation and analysis in the HSC 6.0 software.

5. Conclusions

In this research, the physicochemical properties of household IFA in the Jiangsu Provence were studied by thermodynamic analysis in the HSC 6.0 software. The effects of melting temperature, alkalinity, atmosphere, chlorine content of raw materials, and an iron bath added to the migration characteristics of four heavy metal elements in three phases in the IFA melting process were systematically investigated. The main conclusions are as follows:
(1)
Within the temperature range of 1100–1600 °C, Fe mainly entered the slag phase as oxides and silicates, Pb mainly entered the gas phase as gaseous products of PbS (g), PbCl2 (g), PbCl (g), and PbCl4 (g). When the temperature was higher than 1300 °C, most of Zn entered the gas phase in the form of ZnCl2 (g). CuCl (g) appeared in the Cu products, and the proportion of CuCl (g) increased significantly with the increase in temperature.
(2)
With the increase in alkalinity from 0.4 to 1.4, the proportion of oxide in Fe products increased, and the proportion of silicate decreased, but the proportion of the slag phase was almost unchanged. As for Pb products, the proportion of PbCl2 (g) and PbCl4 (g) decreased, the proportion of PbS (g) increased, and the proportion of the gas phase increased slightly. The proportion of Zn volatilization into the gas phase could be inhibited with the increase in alkalinity, while the proportion of Cu into the slag phase remained unchanged.
(3)
In the oxidation or reduction atmosphere, Zn would enter the gas phase with low boiling point volatile products. The reducing atmosphere had an inhibitory effect on the volatilization of Pb. In the oxidation atmosphere, Fe and Cu existed in the forms of oxide, silicate, and aluminate in the slag phase, while in reduction conditions, Fe and Cu were reduced to metal elementals in the alloy phase.
(4)
Compared with the raw IFA, the volatilization of Zn in the water-washing IFA was inhibited effectively. The proportion of Zn entering the gas phase decreased from 85.84% to 9.89%. The volatilization of Pb was inhibited slightly, and there was little effect on the volatilization of Fe and Cu.
(5)
In the IFA melting process with an iron bath, 98.42% of Cu and 82.28% of Pb entered the iron phase in the form of metallic elements, respectively. A total of 76.3% of Zn entered the gas phase as gaseous products of Zn (g) and ZnCl2 (g), and only 5% of Zn entered the iron phase. The classification and enrichment of heavy metals was realized by carbon in pig iron of the reducing agent and Fe of heavy metals collector.
(6)
Under the same technological conditions, the calculated results of Fe, Pb, Zn, and Cu were consistent with the experimental results in the proportion of the gas phase, slag phase, and alloy phase.
(7)
From the perspective of metal recovery, the reduction condition or addition of an iron bath were recommended for the IFA melting process. Fe, Cu, Pb, and Zn in IFA could be enriched in the gas phase and alloy phase to achieve the classification and enrichment of metal resources.

Author Contributions

Conceptualization, Y.G., C.G. and L.Y.; experimental work, Y.G., C.G. and M.H.; formal analysis, Y.G., C.G., L.Y. and X.H.; data analysis, C.G., M.H., and X.H.; writing–original draft preparation, C.G. and L.Y.; writing–review and editing, Y.G., C.G. and L.Y. All authors have read and agreed to the published version of the manuscript.

Funding

This research was funded by the National Natural Science Foundation of China (No. 52174328).

Institutional Review Board Statement

Not applicable.

Informed Consent Statement

Not applicable.

Data Availability Statement

Restrictions apply to the availability of these data. Data were obtained from Central South University and are available from Chen Gong with the permission of Central South University.

Conflicts of Interest

The authors declare no conflict of interest.

Appendix A

Table A1. Calculation results of distribution forms and proportion of three phases of element Fe in R—IFA melting process under different melting temperature (Molar percentage, %).
Gas PhaseLS Phase
TemperatureFeCl2Fe2O3FeOOther Iron OxidesIron-Bearing SilicateIron-Bearing Sulfide
1100 °C0.31.810.5542.9121.522.93
1200 °C1.056.7311.9947.4723.479.29
1300 °C2.5621.510.5441.723.70
1400 °C4.1645.46.0324.4519.950
1500 °C5.4966.542.7211.1214.130
1600 °C4.7881.720.984.118.410
Table A2. Calculation results of distribution forms and proportion of three phases of element Pb in R—IFA melting process under different melting temperature (Molar percentage, %).
Gas PhaseLS Phase
TemperaturePbSPbCl2PbClPbCl4PbPbSPbCl2PbO
1100 °C48.3816.117.271.80.0920.025.930.4
1200 °C64.6416.3410.910.820.214.042.780.26
1300 °C58.1920.9417.880.630.4501.690.22
1400 °C24.1738.8833.271.160.8701.410.24
1500 °C6.350.4539.631.780.9900.70.15
1600 °C1.7154.540.232.190.9700.30.1
Table A3. Calculation results of distribution forms and proportion of three phases of element Zn in R—IFA melting process under different melting temperature (Molar percentage, %).
Gas PhaseLS Phase
TemperatureZnCl2ZnZnSZnOZnO·Al2O3ZnSiO3
1100 °C12.470.166.5519.011.30.57
1200 °C40.270.8530.0325.892.090.87
1300 °C73.482.99020.811.930.79
1400°C84.764.0209.80.990.43
1500 °C91.434.1503.820.410.19
1600 °C93.84.2101.70.20.09
Table A4. Calculation results of distribution forms and proportion of three phases of element Cu in R—IFA melting process under different melting temperature (Molar percentage, %).
Gas PhaseLS Phase
TemperatureCuClCuCl2CuClCuFeS2CuSCu2SCuO·Al2O3
1100 °C0.14031.2734.3316.2313.94.13
1200 °C0.860.0155.516.548.4111.976.71
1300 °C4.190.0885.0600010.67
1400 °C12.120.2975.8700011.72
1500 °C32.41.115500011.49
1600 °C58.962.7228.880009.44
Table A5. Calculation results of distribution forms and proportion of three phases of element Fe in R—IFA melting process under different alkalinity (Molar percentage, %).
Gas PhaseLS Phase
AlkalinityFeCl2Fe2O3FeOOther Iron OxidesIron-Bearing Silicate
0.46.532.594.9921.1964.69
0.65.396.186.3626.5155.58
0.84.0512.188.1533.4942.12
12.5121.0710.3341.9224.17
1.21.3428.1711.8247.6411.04
1.40.931.1312.2449.336.4
Table A6. Calculation results of distribution forms and proportion of three phases of element Pb in R—IFA melting process under different alkalinity (Molar percentage, %).
Gas PhaseLS Phase
AlkalinityPbCl2PbSPbCl4PbClPbSPbCl2PbSiO3
0.450.7613.9419.2912.2103.490.31
0.647.1824.018.2616.7203.560.27
0.836.1138.912.8319.1302.840.17
121.0758.530.6417.9901.70.07
1.210.5473.370.1314.2400.860.86
1.47.3379.230.0512.640.130.610.01
Table A7. Calculation results of distribution forms and proportion of three phases of element Zn in R—IFA melting process under different alkalinity (Molar percentage, %).
Gas PhaseLS Phase
AlkalinityZnCl2ZnZnSZnOZnSiO3ZnCl2ZnO·Al2O3
0.492.180.304.831.860.810.02
0.689.490.6307.261.690.870.06
0.884.511.33011.681.340.850.29
172.932.97020.650.790.751.91
1.250.787.48030.790.220.3510.38
1.436.766.121.3434.260.160.3920.97
Table A8. Calculation results of distribution forms and proportion of three phases of element Cu in R—IFA melting process under different alkalinity (Molar percentage, %).
Gas PhaseLS Phase
AlkalinityCuClCuCl2CuClCuFeS2CuSCu2SCuO·Al2O3
0.45.420.3593.920000.31
0.64.950.2294.020000.81
0.84.680.1492.70002.48
14.190.0885.0600010.67
1.22.930.0360.3600036.68
1.420.0241.730.290.340.7354.89
Table A9. Calculation results of distribution forms and proportion of three phases of element Fe in R—IFA melting process under different atmosphere (Molar percentage, %).
Gas PhaseLS PhaseLM Phase
AtmosphereFeCl2Fe2O3FeOOther Iron OxidesIron-Bearing SilicateIron-Bearing SulfideFe
RA000010.5426.9662.5
DMA4.0912.298.2232.9342.4700
OA084.705.0310.2700
Table A10. Calculation results of distribution forms and proportion of three phases of element Pb in R—IFA melting process under different atmosphere (Molar percentage, %).
Gas PhaseLM Phase
AtmospherePbPbClPbSPbCl2PbCl4Pb
RA20.6519.838.890050.63
DMA019.7240.1237.242.920
OA0000.1999.810
Table A11. Calculation results of distribution forms and proportion of three phases of element Zn in R—IFA melting process under different atmosphere (Molar percentage, %).
Gas PhaseLS Phase
AtmosphereZnZnCl2ZnSZnOZnSiO3
RA91.761.336.9100
DMA1.3485.49011.821.35
OA096.6703.020.31
Table A12. Calculation results of distribution forms and proportion of three phases of element Cu in R—IFA melting process under different atmosphere (Molar percentage, %).
Gas PhaseLS PhaseLM Phase
AtmosphereCuClCuCl2CuClCuO·Al2O3CuOCu
RA001.610098.39
DMA4.68092.832.4900
OA6.4615.647.2366.723.950
Table A13. Calculation results of distribution forms and proportion of three phases of element Fe in R—IFA melting process under different raw materials (Molar percentage, %).
Gas PhaseLS Phase
Raw MaterialsFeCl2Fe2O3FeOOther Iron OxidesIron-Bearing SilicateIron-Bearing Sulfide
R—IFA4.0912.288.2232.9442.470
WW—IFA0.610.062.037.517.7772.03
Table A14. Calculation results of distribution forms and proportion of three phases of element Pb in R—IFA melting process under different raw materials (Molar percentage, %).
Gas PhaseLS Phase
Raw MaterialsPbCl2PbSPbCl4PbClPbPbCl2PbS
R—IFA36.1838.972.8419.1602.850
WW—IFA4.6460.090.0210.030.640.0124.57
Table A15. Calculation results of distribution forms and proportion of three phases of element Zn in R—IFA melting process under different raw materials (Molar percentage, %).
Gas PhaseLS Phase
Raw MaterialsZnCl2ZnZnSZnOZnSiO3ZnCl2ZnO·Al2O3
R—IFA84.521.33011.671.340.850.29
WW—IFA7.852.0588.151.780.1700
Table A16. Calculation results of distribution forms and proportion of three phases of element Cu in R—IFA melting process under different raw materials (Molar percentage, %).
Gas PhaseLS Phase
Raw MaterialsCuClCuO·Al2O3CuSCuFeS2Cu2SCuCl
R—IFA4.682.4900092.83
WW—IFA0.660.1727.8843.9427.130.22
Table A17. Calculation results of distribution forms and proportion of three phases of element Pb in R—IFA melting process under different melting mode (Molar percentage, %).
Gas PhaseLS PhaseLM Phase
Melting ModePbCl2PbSPbCl4PbClPbPbCl2Pb
DM36.1738.982.8419.1602.850
IBM1.831.92011.652.20.1282.28
Table A18. Calculation results of distribution forms and proportion of three phases of element Zn in R—IFA melting process under different melting mode (Molar percentage, %).
Gas PhaseLS PhaseLM Phase
Melting ModeZnCl2ZnZnSZnOZnSiO3ZnCl2ZnO·Al2O3Zn
DM84.521.33011.671.340.850.290
IBM23.2953.0613.983.80.330.190.115.24
Table A19. Calculation results of distribution forms and proportion of three phases of element Cu in R—IFA melting process under different melting mode (Molar percentage, %).
Gas PhaseLS PhaseLM Phase
Melting ModeCuClCuO·Al2O3CuFeS2CuClCu
DM4.682.49092.830
IBM0.0600.481.0598.41
Table A20. Theoretical and experimental results of distribution forms and proportion of three phases of selected four heavy metal elements in R—IFA melting process under different melting temperatures (Molar percentage, %).
FePbZnCu
TemperatureTRERTRERTRERTRER
1100 °C99.7185.0126.3520.887.4380.7199.8689.52
1200 °C9986.77.084.8858.8853.2899.1385.26
1300 °C97.5480.641.911.5523.5320.1395.7375.2
1400 °C95.9476.981.651.3111.228.9287.5970.84
1500 °C94.5772.270.860.734.423.3566.4850.95
1600 °C95.2468.940.40.321.991.6138.3221.48
Table A21. Theoretical and experimental results of proportion of three phases of selected elements Pb, Zn, and Cu in R—IFA melting process without iron bath added (Molar percentage, %).
Gas PhaseLS PhaseLM Phase
TRERTRERTRER
Pb97.1598.612.851.3900
Zn85.8493.4114.166.5900
Cu4.6816.8595.3283.1500
Table A22. Theoretical and experimental results of proportion of three phases of selected elements Pb, Zn, and Cu in R—IFA melting process with iron bath added (Molar percentage, %).
Gas PhaseLS PhaseLM Phase
TRERTRERTRER
Pb17.617.480.125.182.2877.42
Zn76.3577.1218.4112.535.2410.35
Cu0.064.151.526.3198.4289.54
Table A23. Theoretical and experimental results of proportion of three phases of selected four heavy metal elements in R—IFA melting process under OA (Molar percentage, %).
Gas PhaseLS PhaseLM Phase
TRERTRERTRER
Fe05.2710094.7300
Pb10098.1701.8300
Zn96.6793.353.336.6500
Cu22.125.1577.974.8500
Table A24. Theoretical and experimental results of proportion of three phases of selected four heavy metal elements in R—IFA melting process under RA (Molar percentage, %).
Gas PhaseLS PhaseLM Phase
TRERTRERTRER
Fe03.2637.4943.1562.5153.59
Pb49.3760.3204.4850.6335.2
Zn93.0985.996.915.6908.32
Cu07.391.613.0798.3989.54

References

  1. Juan María, T.S.; Jorge, S.M.; Evaristo Rafael, M.L.; Francisco Antonio, C.I. Leaching of Zinc for Subsequent Recovery by Hydrometallurgical Techniques from Electric Arc Furnace Dusts and Utilisation of the Leaching Process Residues for Ceramic Materials for Construction Purposes. Metals 2021, 11, 1603. [Google Scholar]
  2. Wang, C.; Chen, L.Z.; Liu, Z.J.; Li, Y.; Wang, Y.Z.; Jiao, K.X. A new technology for treating waste incineration fly ash by shaft furnace. J. Iron Steel Res. Int. 2021, 28, 773–784. [Google Scholar] [CrossRef]
  3. Zheng, C.H.; He, C.L.; Yang, Y.J.; Toyohisa, F.; Wang, G.F.; Yang, W.C. Characterization of waste amidoxime chelating resin and its reutilization performance in adsorption of Pb(II), Cu(II), Cd(II) and Zn(II) Ions. Metals 2022, 12, 149. [Google Scholar] [CrossRef]
  4. Long, H.M.; Shi, Q.; Zhang, H.L.; Wei, R.F.; Chun, T.J.; Li, J.X. Application status and comparison of dioxin removal technologies for iron ore sintering process. J. Iron Steel Res. Int. 2018, 25, 357–365. [Google Scholar] [CrossRef]
  5. Liang, M.; Li, X.B.; Liu, H.W.; Liu, C. Research progress of flue gas treatment technology for domestic waste incineration. Environ. Sanit. Eng. 2013, 21, 49–52. [Google Scholar]
  6. Mckay, G. Dioxin characterisation, formation and minimisation during municipal solid waste (MSW) incineration: Review. Chem. Eng. J. 2002, 86, 343–368. [Google Scholar] [CrossRef]
  7. Zhang, H.Y.; Zhao, Y.C.; Qi, J.Y. Physicochemical property of MSWI fly ash. Environ. Sci. Technol. 2008, 11, 96–99. [Google Scholar]
  8. Li, M.; Xiang, J.; Hu, S. Characterization of solid residues from municipal solid waste incinerator. Fuel 2004, 83, 1397–1405. [Google Scholar] [CrossRef]
  9. Zacco, A.; Borgese, L.; Gianoncelli, A. Review of fly ash incineration treatments and recycling. Environ. Chem. Lett. 2014, 12, 153–175. [Google Scholar] [CrossRef]
  10. Yang, L.Z.; Hu, H.; Yang, Z.S.; Xue, B.T.; Guo, Y.F.; Wang, S. A review on bath fluid flow stirring technologies in EAF steelmaking. J. Iron Steel Res. Int. 2021, 28, 1341–1351. [Google Scholar] [CrossRef]
  11. Lv, M.; Li, H.; Xing, X.D.; Lin, T.C.; Hu, S.Y.; Xie, K. Variation in Multiphase Flow Characteristics by Nozzle-Twisted Lance Blowing in Converter Steelmaking Process. Steel Res. Int. 2021, 93, 2100409. [Google Scholar] [CrossRef]
  12. Park, Y.J.; Heo, J. Vitrification of fly ash from municipal solid waste incinerator. J. Hazard. Mater. 2002, 91, 83–93. [Google Scholar] [CrossRef]
  13. Cheng, T.W.; Chu, J.P.; Zeng, C.C. Treatment and recycling of incinerated ash using thermal plasma technology. Waste Manag. 2002, 22, 485–490. [Google Scholar] [CrossRef]
  14. Sakai, S.I.; Hiraoka, M. Municipal solid waste incinerator residue recycling by thermal processes. Waste Manag. 2000, 20, 249–258. [Google Scholar] [CrossRef]
  15. Das, B.; Prakash, S.; Reddy, P. An overview of utilization of slag and sludge from steel industries. Resour. Conserv. Recycl. 2007, 50, 40–57. [Google Scholar] [CrossRef]
  16. Ma, W.; Shi, W.; Shi, Y. Plasma vitrification and heavy metals solidification of MSW and sewage sludge incineration fly ash. J. Hazard. Mater. 2020, 408, 124809. [Google Scholar] [CrossRef]
  17. Jiao, F.C.; Ma, X.L.; Liu, T. Effect of atmospheres on transformation of heavy metals during thermal treatment of MSWI fly ash: By thermodynamic equilibrium calculation. Molecules 2021, 27, 131. [Google Scholar] [CrossRef]
  18. Jung, C.H.; Matsuto, T.; Tanaka, N. Behavior of metals in ash melting and gasification-melting of municipal solid waste (MSW). Waste Manag. 2005, 25, 301–310. [Google Scholar] [CrossRef] [Green Version]
  19. Takaoka, M.; Takeda, N.; Miura, S. The behaviour of heavy metals and phosphorus in an ash melting process. Wastewater Sludge-Waste Resour. 1997, 36, 275–282. [Google Scholar] [CrossRef]
  20. Wang, X.T.; Jin, B.S.; Xu, B. Effect of different oxide additives on migration behavior of heavy metals of MSWI fly ash in swirling melting furnace. Proc. CSEE 2014, 34, 2754–2760. [Google Scholar]
  21. Jakob, A.; Stucki, S.; Kuhn, P. Evaporation of heavy metals during the heat treatment of municipal solid waste incinerator fly ash. Environ. Sci. Technol. 1995, 29, 2429–2436. [Google Scholar] [CrossRef] [PubMed]
  22. Nowak, B.; Rocha, S.F.; Aschenbrenner, P. Heavy metal removal from MSW fly ash by means of chlorination and thermal treatment: Influence of the chloride type. Chem. Eng. J. 2012, 179, 178–185. [Google Scholar] [CrossRef]
  23. Lu, X.L.; Wei, L.; Liu, Y.S. Effect of chlorine-containing compounds on evaporation of heavy metals in secondary gasification of fly ash from municipal solid waste incinerator. Acta Sci. Nat. Univ. Pekin. 2012, 48, 133–138. [Google Scholar]
  24. Liu, J.Y.; Sun, S.Y. Chlorination transformation and volatilization of heavy metals in fly ash from the incineration during the disposal process with higher temperature. Environ. Sci. 2012, 33, 3279–3287. [Google Scholar]
  25. Li, H.K. Experimental Study on the Melting of Municipal Solid Waste Incineration Fly Ash; Chongqing University: Chongqing, China, 2008. [Google Scholar]
  26. Wen, J. Study on Migration of Heavy Metals of Municipal Waste Incineration Fly Ash in Melting Process; Chongqing University: Chongqing, China, 2008. [Google Scholar]
  27. Wang, Y.K. Application of HSC chemistry software in university chemical scientific research. J. Henan Inst. Educ. 2013, 22, 28–30. [Google Scholar]
  28. Hu, M.; Hu, X.; Shao, Z. Thermodynamic equilibrium calculation of heavy metals during melting process of waste incineration ash. Chin. J. Environ. Eng. 2018, 12, 2672–2679. [Google Scholar]
  29. Xue, B.T.; Yang, L.Z.; Guo, Y.F.; Chen, F.; Wang, S.; Zheng, F.Q.; Yang, Z.S. Design and Construction of a Laboratory-Scale Direct-Current Electric Arc Furnace for Metallurgical and High-Titanium Slag Smelting Studies. Metals 2021, 11, 732. [Google Scholar] [CrossRef]
  30. Hu, H.; Yang, L.Z.; Guo, Y.F.; Chen, F.; Wang, S.; Zheng, F.Q.; Li, B. Numerical Simulation of Bottom-Blowing Stirring in Different Smelting Stages of Electric Arc Furnace Steelmaking. Metals 2021, 11, 799. [Google Scholar] [CrossRef]
  31. Huang, X.G. Molten Metal. In Ferrous Metallurgy Theory, 4th ed.; Beijing Metallurgical Industry Press: Beijing, China, 2014. [Google Scholar]
  32. Wang, X.T.; Jin, B.S.; Zhong, Z.P. Influence of atmospheres on behavior of heavy metals during melting process of fly ashes from municipal solid waste incinerator. Proc. CSEE 2006, 26, 47–52. [Google Scholar]
  33. Zhou, Y.; Wei, G.S. Theoretical analysis and experimental study of the application of CO2 in the smelting of 410S stainless steel. J. CO2 Util. 2022, 60, 102016. [Google Scholar] [CrossRef]
  34. Zhang, R.C.; Wei, X.F.; Hao, Q.; Si, R.F. Bioleaching of heavy metals from municipal solid waste incineration fly ash: Availability of recoverable sulfur prills and form transformation of heavy metals. Metals 2020, 10, 815. [Google Scholar] [CrossRef]
Figure 1. XRD patterns of R—IFA (left) and WW—IFA (right).
Metals 12 01036 g001
Figure 2. Ternary phase diagram of CaO-SiO2-Al2O3.
Metals 12 01036 g002
Figure 3. Framework of the research schemes.
Metals 12 01036 g003
Figure 4. Diagram of experimental facilities in IFA melting process.
Metals 12 01036 g004
Figure 5. Effect of melting temperature on distribution forms of selected heavy metal elements in R—IFA melting process. (a) element Fe; (b) element Pb; (c) element Zn; (d) element Cu.
Metals 12 01036 g005
Figure 6. Effect of melting temperature on proportion of selected heavy metal elements in gas, LS, and LM phase in R—IFA melting process. (a) element Fe; (b) element Pb; (c) element Zn; (d) element Cu.
Metals 12 01036 g006
Figure 7. Effect of alkalinity on distribution forms of selected heavy metal elements in R—IFA melting process. (a) element Fe; (b) element Pb; (c) element Zn; (d) element Cu.
Metals 12 01036 g007
Figure 8. Effect of alkalinity on proportion of selected heavy metal elements in gas, LS, and LM phase in R—IFA melting process. (a) element Fe; (b) element Pb; (c) element Zn; (d) element Cu.
Metals 12 01036 g008
Figure 9. Effect of atmosphere on distribution forms of selected heavy metal elements in R—IFA melting process. (a) element Fe; (b) element Pb; (c) element Zn; (d) element Cu.
Metals 12 01036 g009
Figure 10. Effect of atmosphere on proportion of selected heavy metal elements in gas, LS, and LM phase in R—IFA melting process. (a) element Fe; (b) element Pb; (c) element Zn; (d) element Cu.
Metals 12 01036 g010
Figure 11. Effect of chlorine content in raw materials on distribution forms of selected heavy metal elements in IFA melting process. (a) element Fe; (b) element Pb; (c) element Zn; (d) element Cu.
Metals 12 01036 g011
Figure 12. Effect of chlorine content in raw materials on proportion of selected heavy metal elements in gas, LS, and LM phase in IFA melting process. (a) element Fe; (b) element Pb; (c) element Zn; (d) element Cu.
Metals 12 01036 g012
Figure 13. Effect of iron bath charged on distribution forms of selected heavy metal elements in R—IFA melting process. (a) element Pb; (b) element Zn; (c) element Cu.
Metals 12 01036 g013
Figure 14. Effect of iron bath charged on proportion of selected heavy metal elements in gas, LS, and LM phase in R—IFA melting process. (a) element Pb; (b) element Zn; (c) element Cu.
Metals 12 01036 g014
Figure 15. Comparison between experimental and theoretical results of proportion of selected heavy metal elements in LS phase under different melting temperature in R—IFA melting process. (a) element Fe; (b) element Pb; (c) element Zn; (d) element Cu.
Metals 12 01036 g015
Figure 16. Comparison between experimental and theoretical results. (a) condition A; (b) condition B; (c) condition C; (d) condition D.
Metals 12 01036 g016
Table 1. Chemical constituents of R—IFA and WW—IFA. (Mass percent, %).
Chemical ConstituentsCaOSiO2Al2O3MgONa2OK2OFe2O3SO3
R—IFA44.253.741.481.177.365.811.256.48
WW—IFA64.875.482.171.720.540.431.839.50
ClCH2OZnOPbOCuOOthers
R—IFA20.812.512.710.5510.1550.0491.67
WW—IFA1.223.685.00.8080.2280.0722.45
Table 2. Conditions of melting experiments in R—IFA melting process under different atmosphere and iron bath charged.
ConditionsTemperatureAlkalinityAtmosphereRaw MaterialsIron Bath
A1300 °C0.8DMAR—IFANo
B1300 °C0.8DMAR—IFAYes
C1300 °C0.8OAR—IFANo
D1300 °C0.8RAR—IFANo
Publisher’s Note: MDPI stays neutral with regard to jurisdictional claims in published maps and institutional affiliations.

