Article

Liquid Formation in Sinters and Its Correlation with Softening Behaviour

1
Sustainable Minerals Institute, The University of Queensland, Brisbane 4072, Australia
2
Shougang Research Institute of Technology, Beijing 100041, China
3
Rio Tinto Iron Ore, Perth 6000, Australia
4
REEM International Institute for Innovation, Jiangxi University of Science and Technology, Ganzhou 341000, China
*
Authors to whom correspondence should be addressed.
Metals 2022, 12(5), 885; https://doi.org/10.3390/met12050885
Submission received: 14 April 2022 / Revised: 17 May 2022 / Accepted: 21 May 2022 / Published: 23 May 2022
(This article belongs to the Special Issue Fundamentals of Advanced Pyrometallurgy)

Abstract

:
Modern blast furnaces with extensive operational volume demand better-quality iron agglomerates as feed for stable operation. Sinter is the principal feed used in blast furnaces across Asia. Liquid generated during the sintering process plays an essential role in the coalescence of the sinter blend and in sinter quality. Therefore, an estimation of liquid properties at peak bed conditions during sintering helps manage sintering liquid behaviour, leading to better control of final sinter properties. In this study, three different iron sinters were reheated to sinter bed conditions, followed by quenching. Electron probe X-ray microanalysis (EPMA) was used to identify the resultant phases and quantify their chemical compositions. The impact of sinter bulk compositions was analysed, especially on sintering liquid properties. Furthermore, experiments were conducted to study the softening and melting behaviour of the sinters, and the cohesive range of the sinters was identified. Finally, the effect of the sinter bulk compositions on sintering liquid properties and softening behaviour is detailed.

1. Introduction

Steel is an important alloy used in our daily lives, spanning households to space technology. The predominant means of steel production are through basic oxygen furnaces (BOF). The blast furnace route produces the principal amount of the total hot metal used as raw material in BOF [1]. Efficient blast furnaces with extensive operational volume are competitive, mainly because of the economies of scale, operational continuity, and no colossal electricity consumption. Moreover, as the blast furnaces are becoming taller and broader with increased operating volume, the demand for good quality feed withstanding the harsh environment inside the blast furnace is rising, leading to increased adoption of agglomeration techniques for preparing blast furnace feed [2]. Agglomerates, such as sinters and pellets, have become significant, mainly due to their mechanical reliability and suitability for large-scale production [1,2].
Despite its competitive operation, the blast furnace unit is the foremost contributor of CO2 equivalent emissions in a steel plant. Therefore, in addition to pulverised coal injection and other techniques to increase the ore/coke ratio, there is also a significant effort to control the slag volume. As sinters are the predominant feed for blast furnaces across Asia, sinters generating low-FeO containing slags on reduction are increasingly preferred so as to have a higher softening start temperature and a narrow cohesive zone, and slags containing low-FeO and higher basicity have reduced adhesion to the iron surface, leading to the latter’s increased carburisation. In addition, the increased gangue content in sinters increases the melt-down temperature, expanding the cohesive zone [3].
To achieve lower slag content, when Al2O3 content and FeO content were reduced in sinters, an improvement in shaft efficiency of the blast furnace was observed using a blast furnace inner reaction simulator [4]. Here, the silica content was also reduced to compensate for the excess melt generated during sintering due to the reduced alumina content. The silica content is vital in melt/liquid formation during sintering. The increase in silica content helps reduce the liquid formation temperature and thereby increases the amount of liquid formed when the peak sinter bed temperature is reached [5,6]. However, higher silica content increases the FeO content in the final sinter as more of 2FeO.SiO2 is formed, blocking FeO reoxidation [7]. The challenge for sinter plants is to produce low-silica and low-FeO sinters without compromising final sinter properties. Reduction properties of the sinter can be improved by controlling the liquid formation during sintering as the sintering liquid not only agglomerates the blend but also plays an essential role in sinter mineralogy and pore structure [4]; better control of sintering liquid properties helps the sinter plants to produce high-quality sinters, even when using economic and low-grade ores.
Before preparing the above-mentioned new sinters, the behaviour of current sinters with respect to their bulk compositions needs to be assessed, especially, the amount of sintering liquid generated at peak bed conditions should be estimated. The research published so far primarily focused on the impact of sinter blend properties on final sinter properties using micro-sintering experiments. There are only a few publications on liquid formation during sintering [8,9,10,11,12], however, the details regarding the sintering liquid properties published so far were qualitative, focusing on changes in height or the cross-sectional area of the sintered sample upon temperature variance to calculate the liquid properties. The data regarding these phases and phase compositions present at peak bed conditions were simulated using FactSage [6,12,13].
The current study obtained three sinters with a stable blast furnace operation from a steel plant. These sinters were reheated to peak sinter bed conditions in a tube furnace, followed by quenching to analyse the phases and phase compositions present and calculate the sintering liquid properties. Apart from sintering liquid properties, assessing the softening and melting behaviour of the above sinters is also needed to ascertain or judge the new sinter behaviour in the blast furnace, as sinters with very high reducibility tend to coagulate, leading to increased melting temperatures [14]. Therefore, the softening and melting experiments of the three sinters were conducted, and the softening start and end temperatures and the melting temperature were calculated based on the displacement changes in the sandwich bed with the rise in temperature [15]. This study helps understand the effect of sinter bulk compositions on sintering liquid generated at peak bed conditions. Understanding and controlling sintering liquid properties help control the required final sinter compositions. In addition, analyses of softening and melting behaviour of the current sinters with stable blast furnace operation help determine or adjust the feed-ratio and operational conditions of the blast furnace to prevent coagulation and have a permeable cohesive layer while using new sinters generating low-slag volume.

2. Materials and Methods

2.1. Reheating of Sinters

The sinters were reheated to peak sinter bed conditions in a vertical tube furnace heated by LaCrO3 elements. The temperature in the pre-determined hot zone of the furnace was relatively stable, with a variation of less than 2 K (2 °C). The details of the tube furnace, including a schematic diagram, are shown elsewhere [16]. Based on industry data, the peak sintering temperature was set to 1300 °C, and the oxygen partial pressure was maintained at approximately 0.01 atm by passing pure argon mixed with 1% O2 gas for the reheating experiments. Sinters used in these experiments were sourced from different sinter plants. The sinter samples were named S1, S2, and S3. In sinters, ferrous iron content was determined by titration, and the rest of the compositions were determined by X-ray fluorescence. Fe2O3 was calculated by removing ferrous iron from total iron. The significant compositions were normalised and detailed in Table 1.
The sinter samples were powdered and mixed using mortar and pestle for uniformity, and then the powder was pressed into pellets around 5 × 5 × 5 mm3 by applying pressure. Next, the sample was placed in a basket made of Kanthal wire and raised to the hot zone of the furnace. The sinters were held in the hot zone at a temperature of 1300 °C for 10 min and then quenched directly into the water container by displacing the removable glass end at the bottom of the tube furnace. After drying, the quenched sample was mounted with epoxy resin and then polished and carbon-coated for electron probe X-ray microanalysis (EPMA). To further understand the sintering liquid behaviour, the peak temperature was varied from 1250 °C to 1350 °C, and the holding time was varied from 10 min to 60 min for sinter S2.

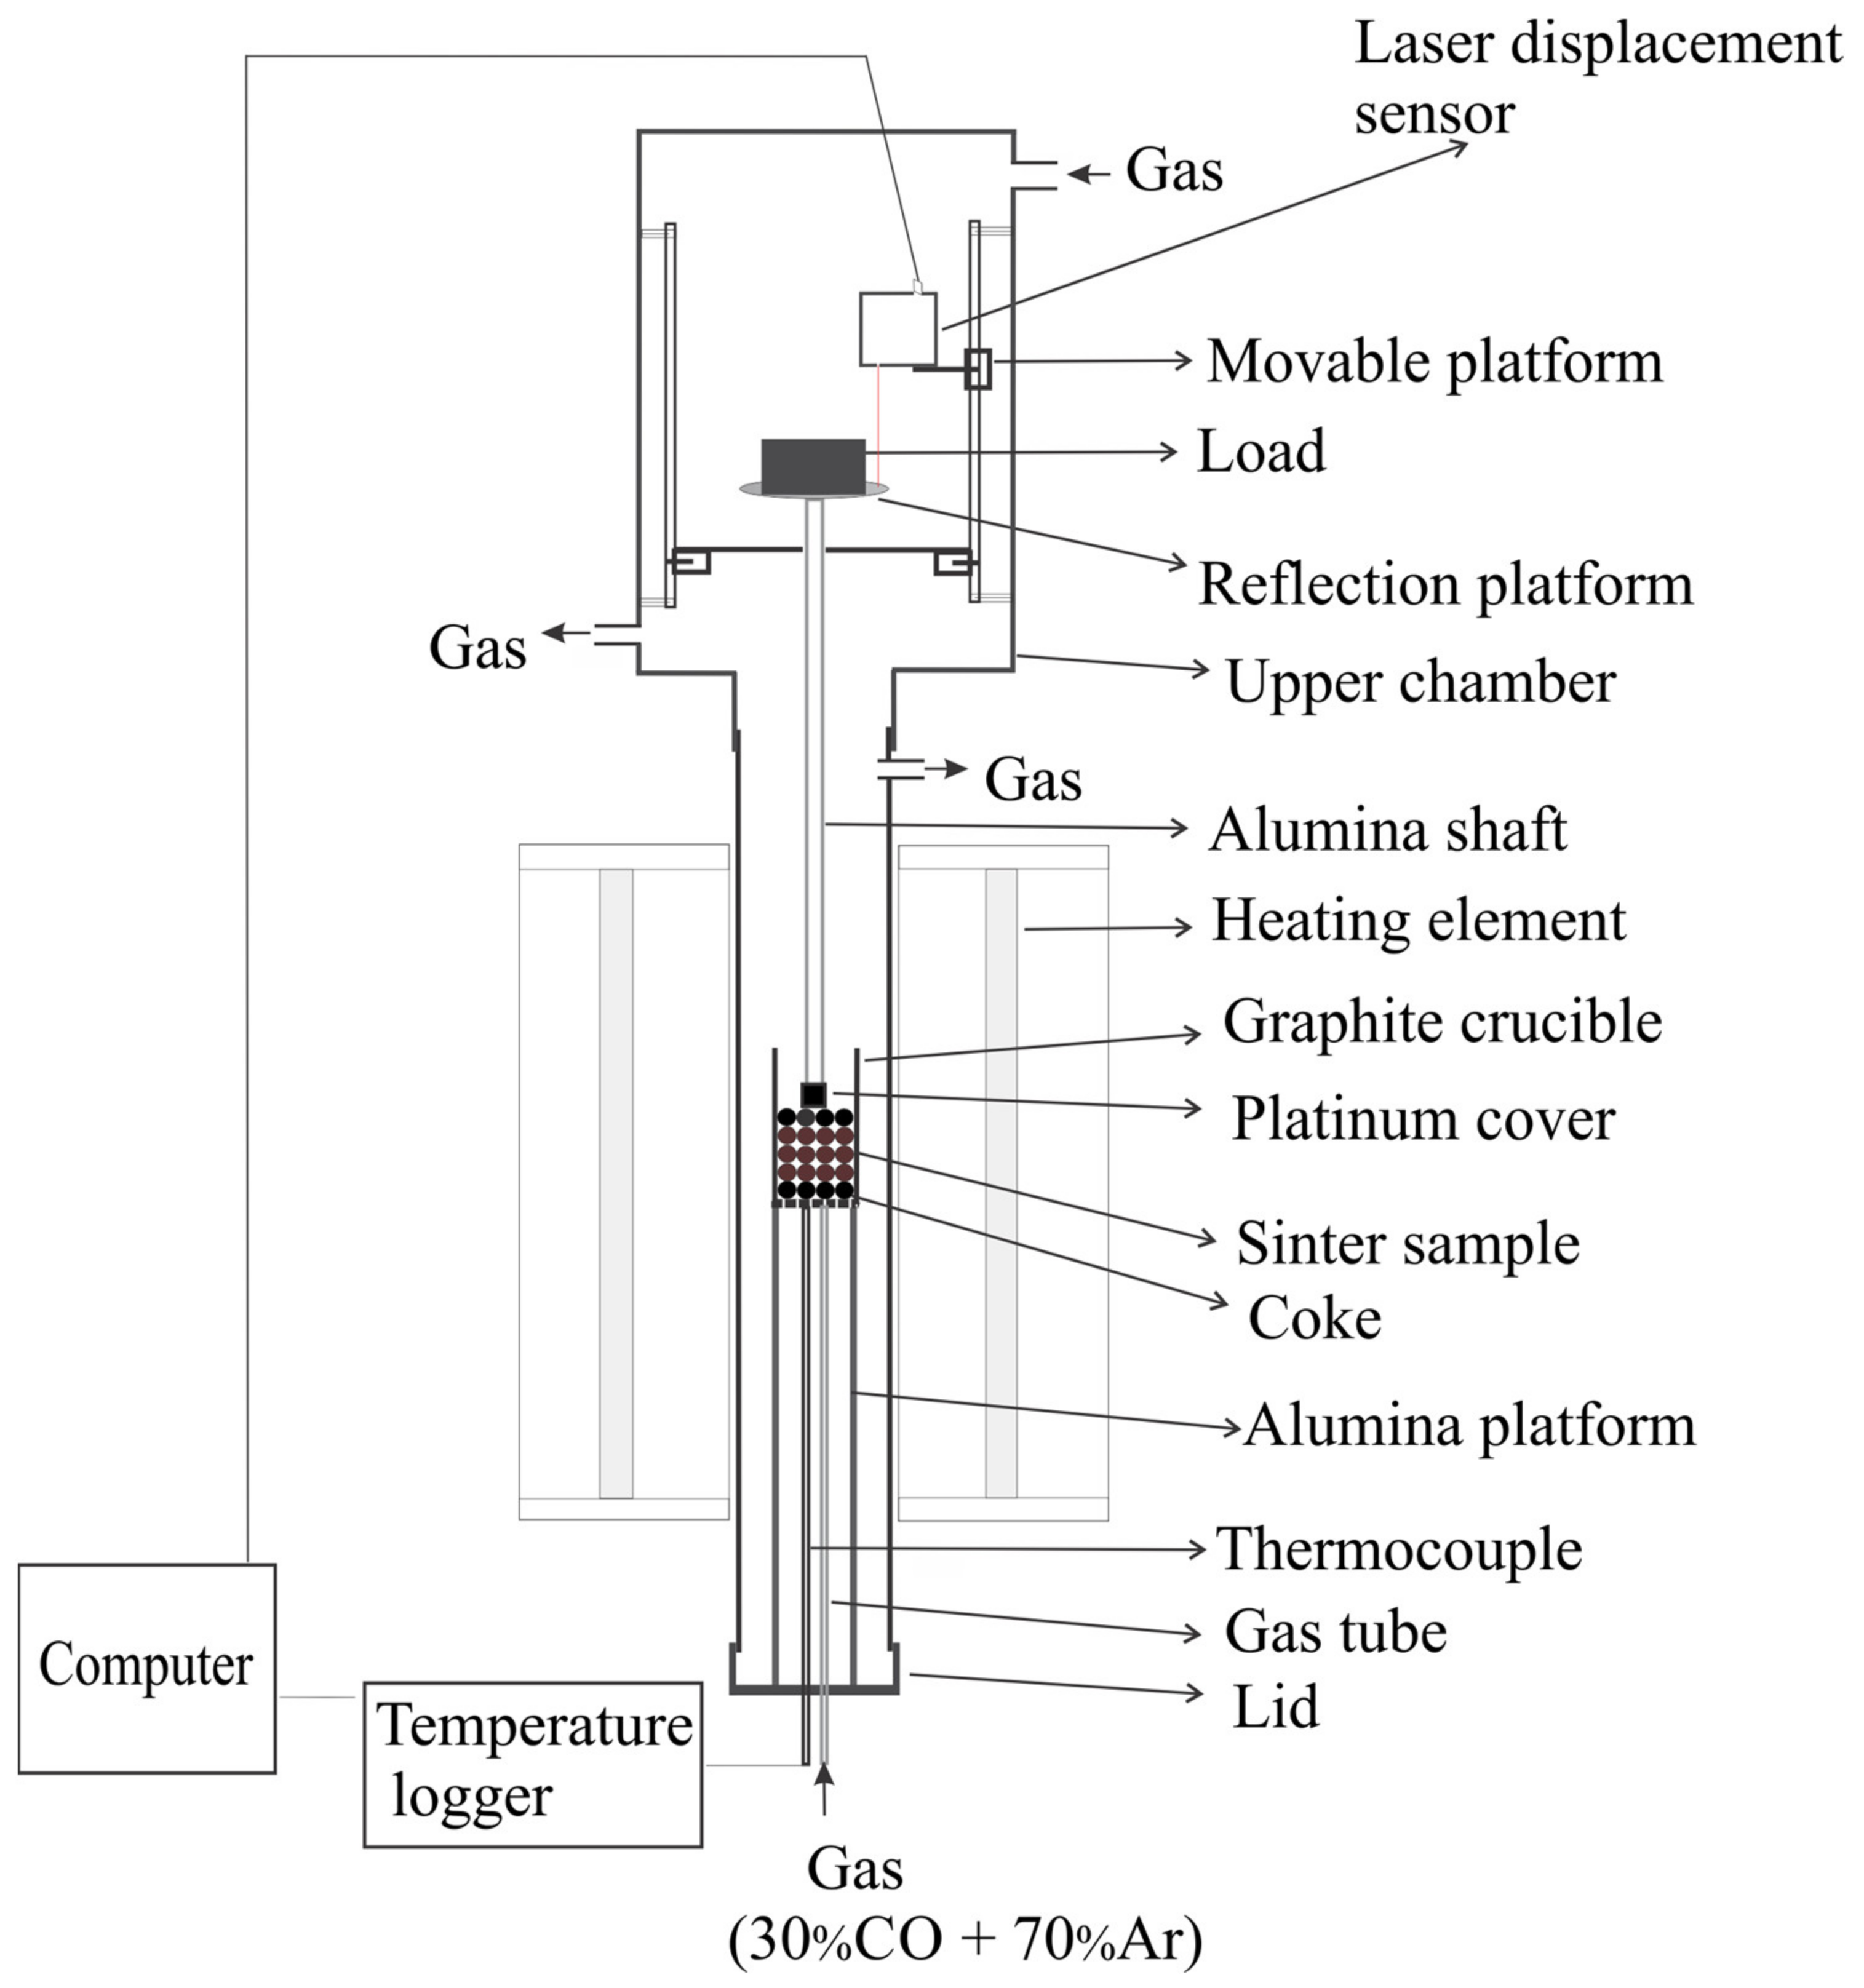
2.2. Sinter Softening Experiments

The softening experiments were carried out by applying a specific load on the bed under controlled atmospheres in a Pyrox furnace with LaCrO3 heating elements, which is shown in Figure 1. The quantifying of the softening behaviours were determined by the bed contraction rate, which is the ratio of the sample bed thickness on heating to its original thickness [15]. The load was selected to be 1 kg/cm2, and a gas mixture of Ar and CO (30% CO + 70% Ar) was used. The samples were heated at a constant ramping rate of 300 °C per hour, with isothermal holding at 950 °C for 10 min to simulate the blast furnace thermal reserve zone.
The furnace tube and the upper chamber were sealed in a gas-tight condition. Two independent gas flow circuits were used to suppress heat transfer and protect the laser displacement sensor in the upper chamber from high temperatures. A graphite crucible with holes drilled in the bottom was placed on a supporting alumina platform. An alumina tube was used to support the crucible to be located within the hot zone of the furnace, and a B-type thermocouple was inserted into the tube to monitor the temperature continuously.
Within the graphite crucible, the sandwich bed structure comprised two layers of 2 cm coke at the bottom and top, with 4 cm iron ore samples in the middle. The displacement changes to the sandwich bed (sample bed) were recorded with the help of the laser. The laser displacement sensor was fixed on a movable platform in the upper chamber. The change in sample bed height containing only coke that was 4 cm thick coke layer without any iron feeds was considered as the baseline curve for the softening experiments.

2.3. Characterization

The sinter phase and composition were characterised using a JXA 8200 electron probe X-ray microanalyser (EPMA) (from Japan Electron Optics Ltd., Tokyo, Japan) with wavelength dispersive detectors (WDD). An accelerating voltage of 15 kV and probe current of 15 nA was used. The standards used are hematite (Fe2O3), wollastonite (CaSiO3), and spinel (MgAl2O4). The measurement time for Fe was 60 s on peak and 15 s on background, and other elements (Ca, Si, Mg, Al) were measured for 40 s on peak and 10 s on background. Metal cation measurements were adjusted to selected oxidation states. Under experimental conditions in this study, there may be both Fe2+ and Fe3+ present in the samples, but all iron concentrations are univocally presented as Fe3+ for a clear-cut explanation.

3. Results & Discussion

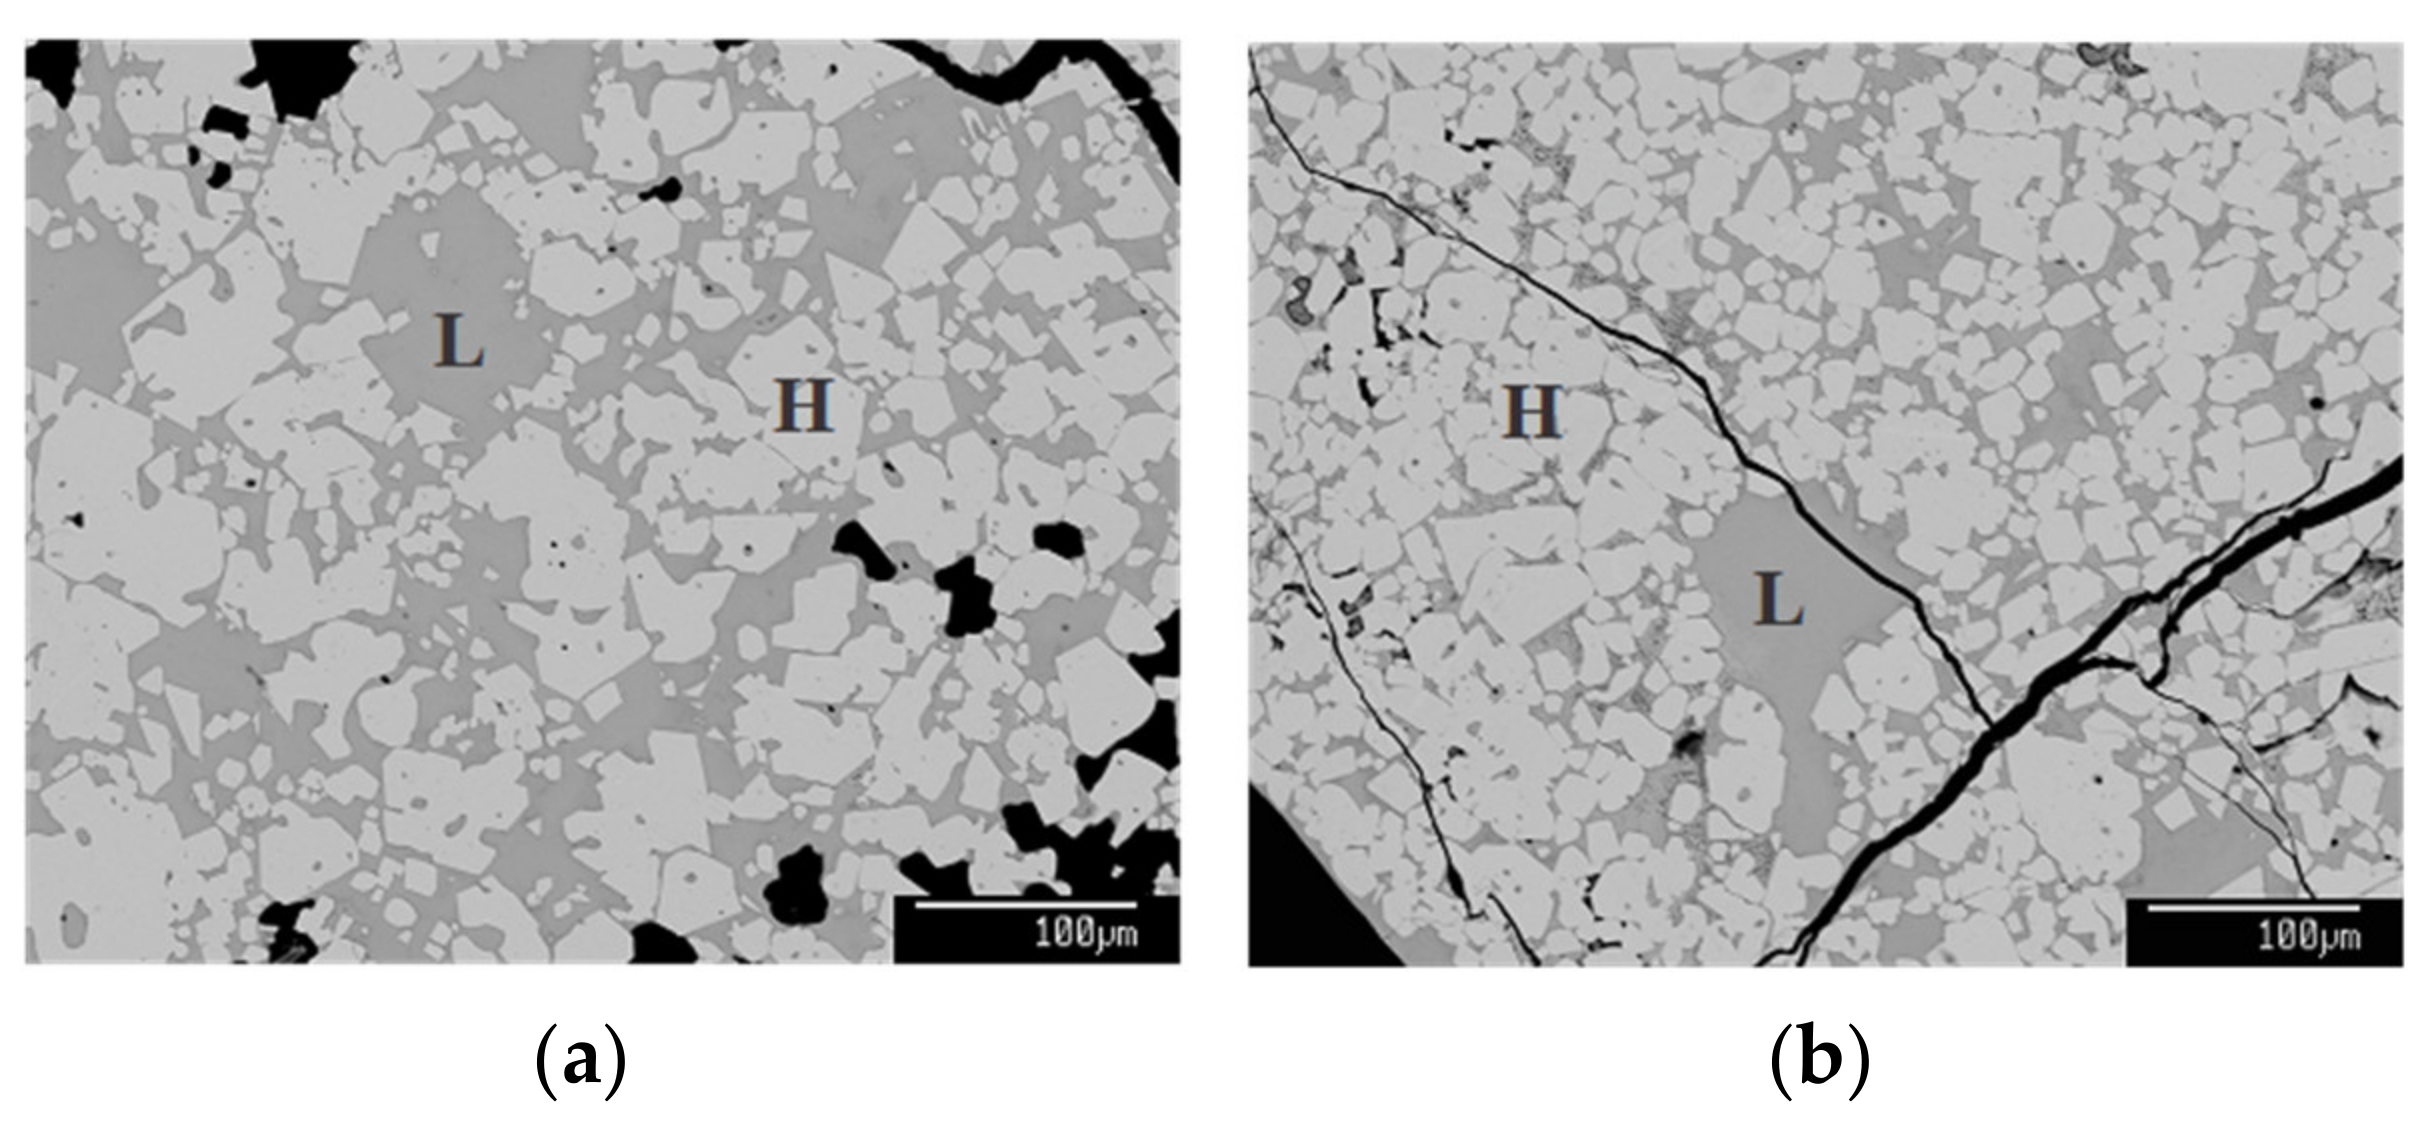
3.1. Reheated and Quenched Sinter Analysis

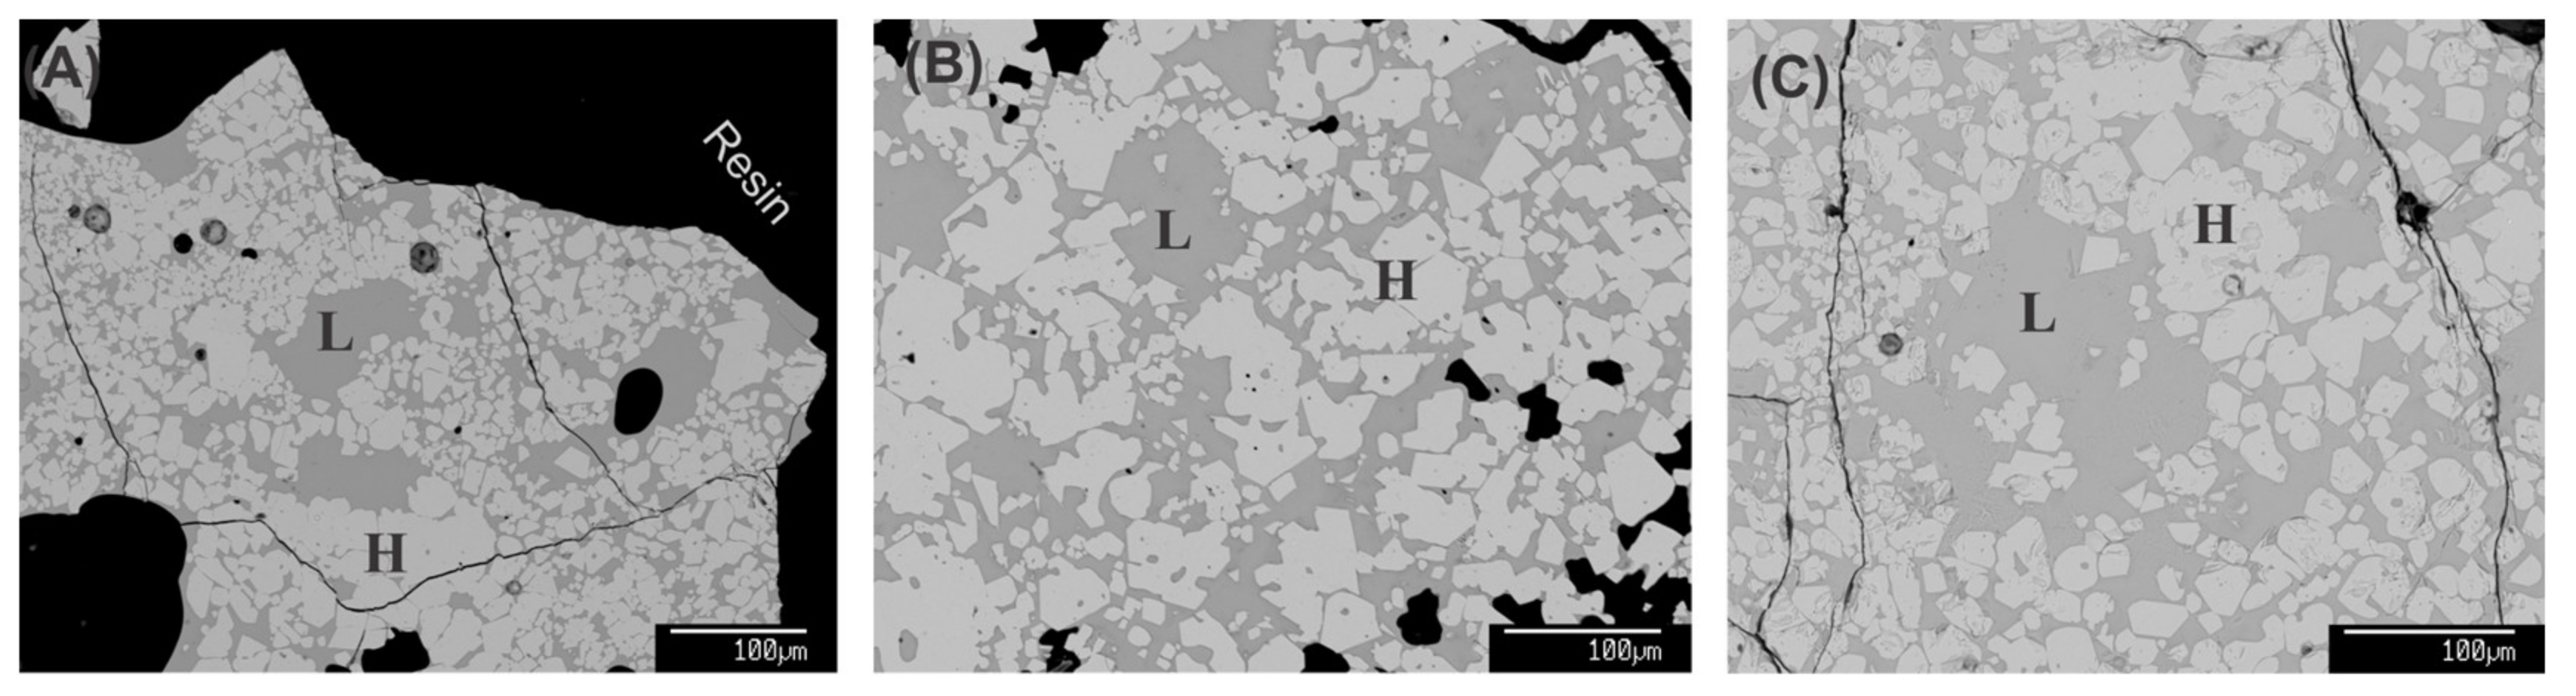
3.1.1. Analysis of Phases and Phase Composition of the Three Sinters

Phase compositions were assessed at 80 points for each phase in the reheated and quenched sample. The average composition of each phase is presented in Table 2. Typical microstructures of the reheated sinter samples quenched from 1300 °C are shown in Figure 2. The two phases present at the peak temperature are indicated, where ‘L’ is the liquid phase, and ‘H’ is hematite. We could see that a more liquid phase appears from S1 to S3 because of more SiO2 and CaO content in the sinter composition. The compositions of the liquid phase and hematite are presented in Table 2. There is no silica content present in the hematite. The phase proportions are calculated as per Equation (1); the liquid basicity is the ratio of CaO/SiO2, and the viscosity of the liquid at 1300 °C is estimated by FactSage 7.3, based on liquid compositions from EPMA, and is included in Table 2.
Liquid phase proportion = Silica content in sinter bulk Silica content in sinter liquid   ×   100 %
The sintering liquid basicity and liquid proportion increased, and the liquid viscosity decreased from S1 to S3, as shown in Figure 3. In comparison to the bulk properties of the three sinters, the sinter basicity increased from S1 to S2 and then decreased, whereas the silica content and ferrous iron content increased from sinters S1 to S3. The rise in silica, FeO, and the lowering of alumina in sinter bulk (compositions detailed in Table 1) contributed to a more than doubling of liquid proportion from S1 to S2. Despite the rise in alumina content from S2 to S3, the significant increase in silica content contributed to the rise in liquid proportion from S2 to S3.

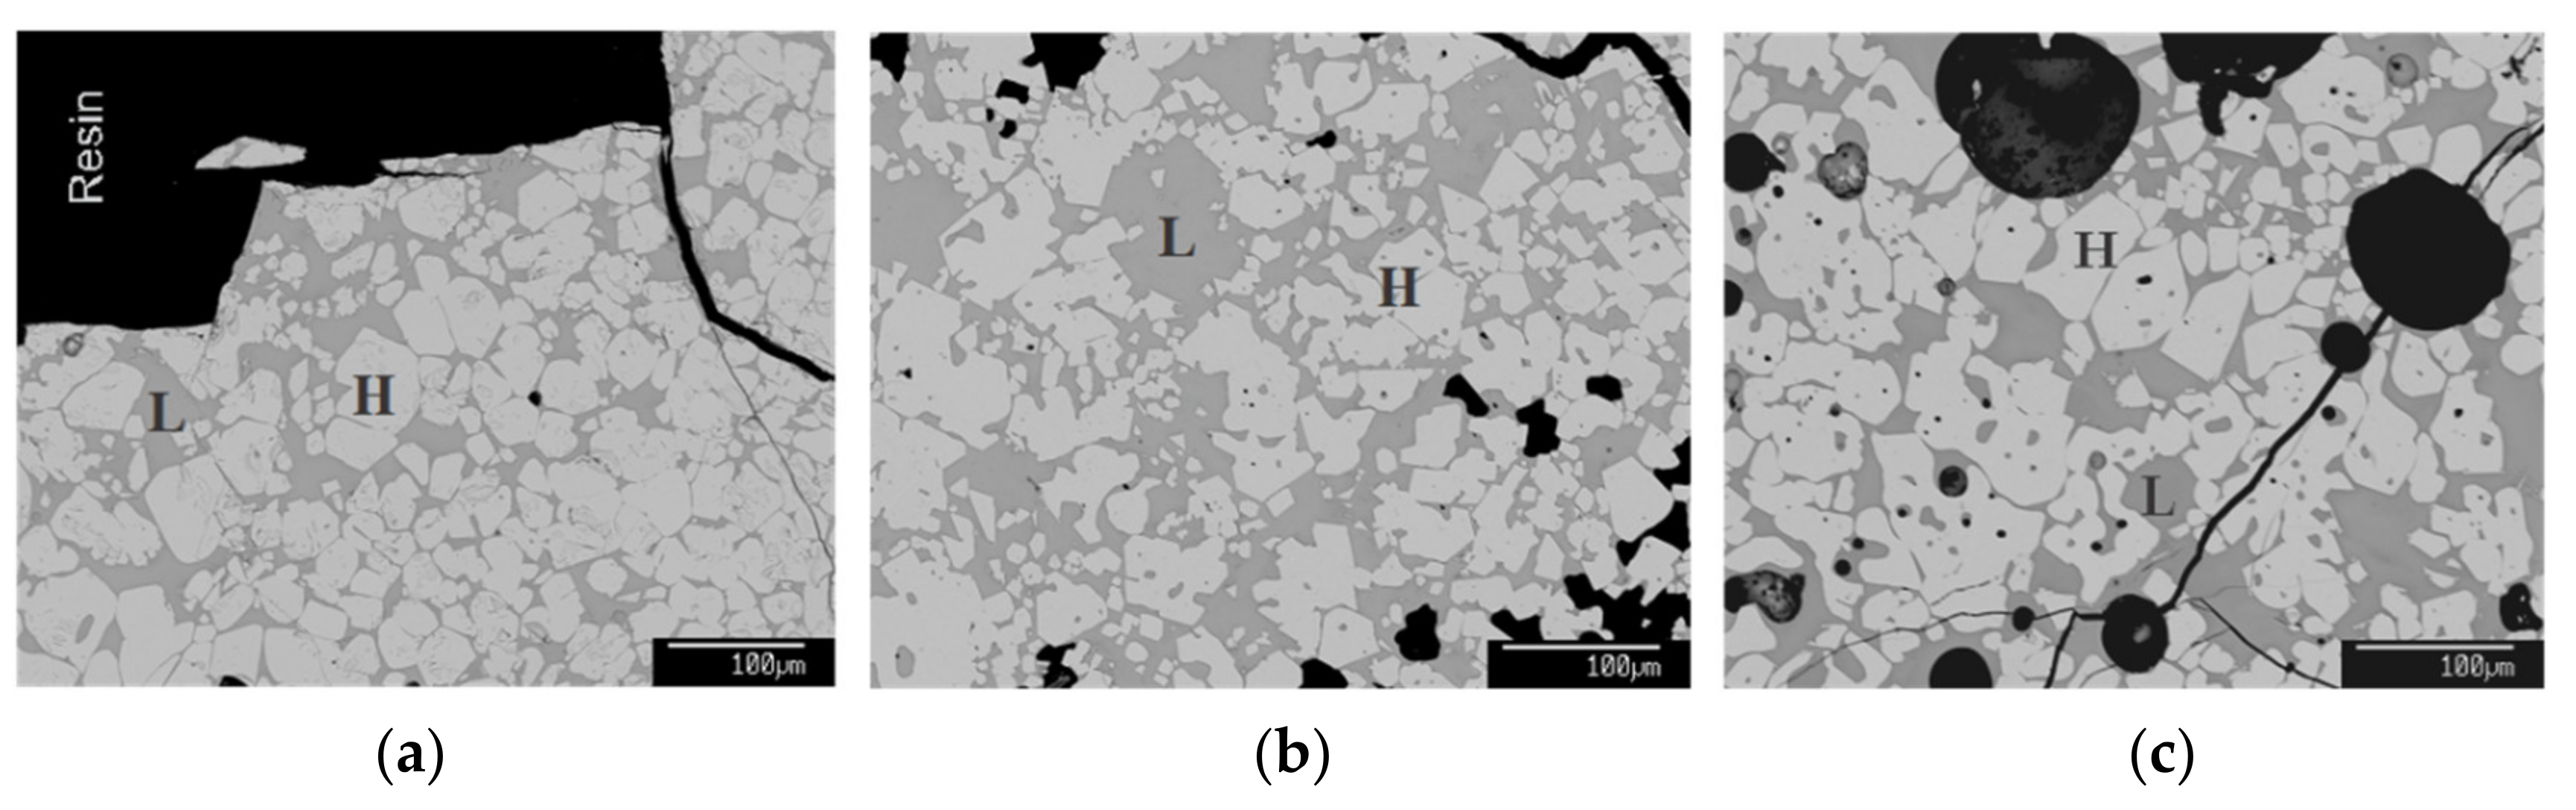
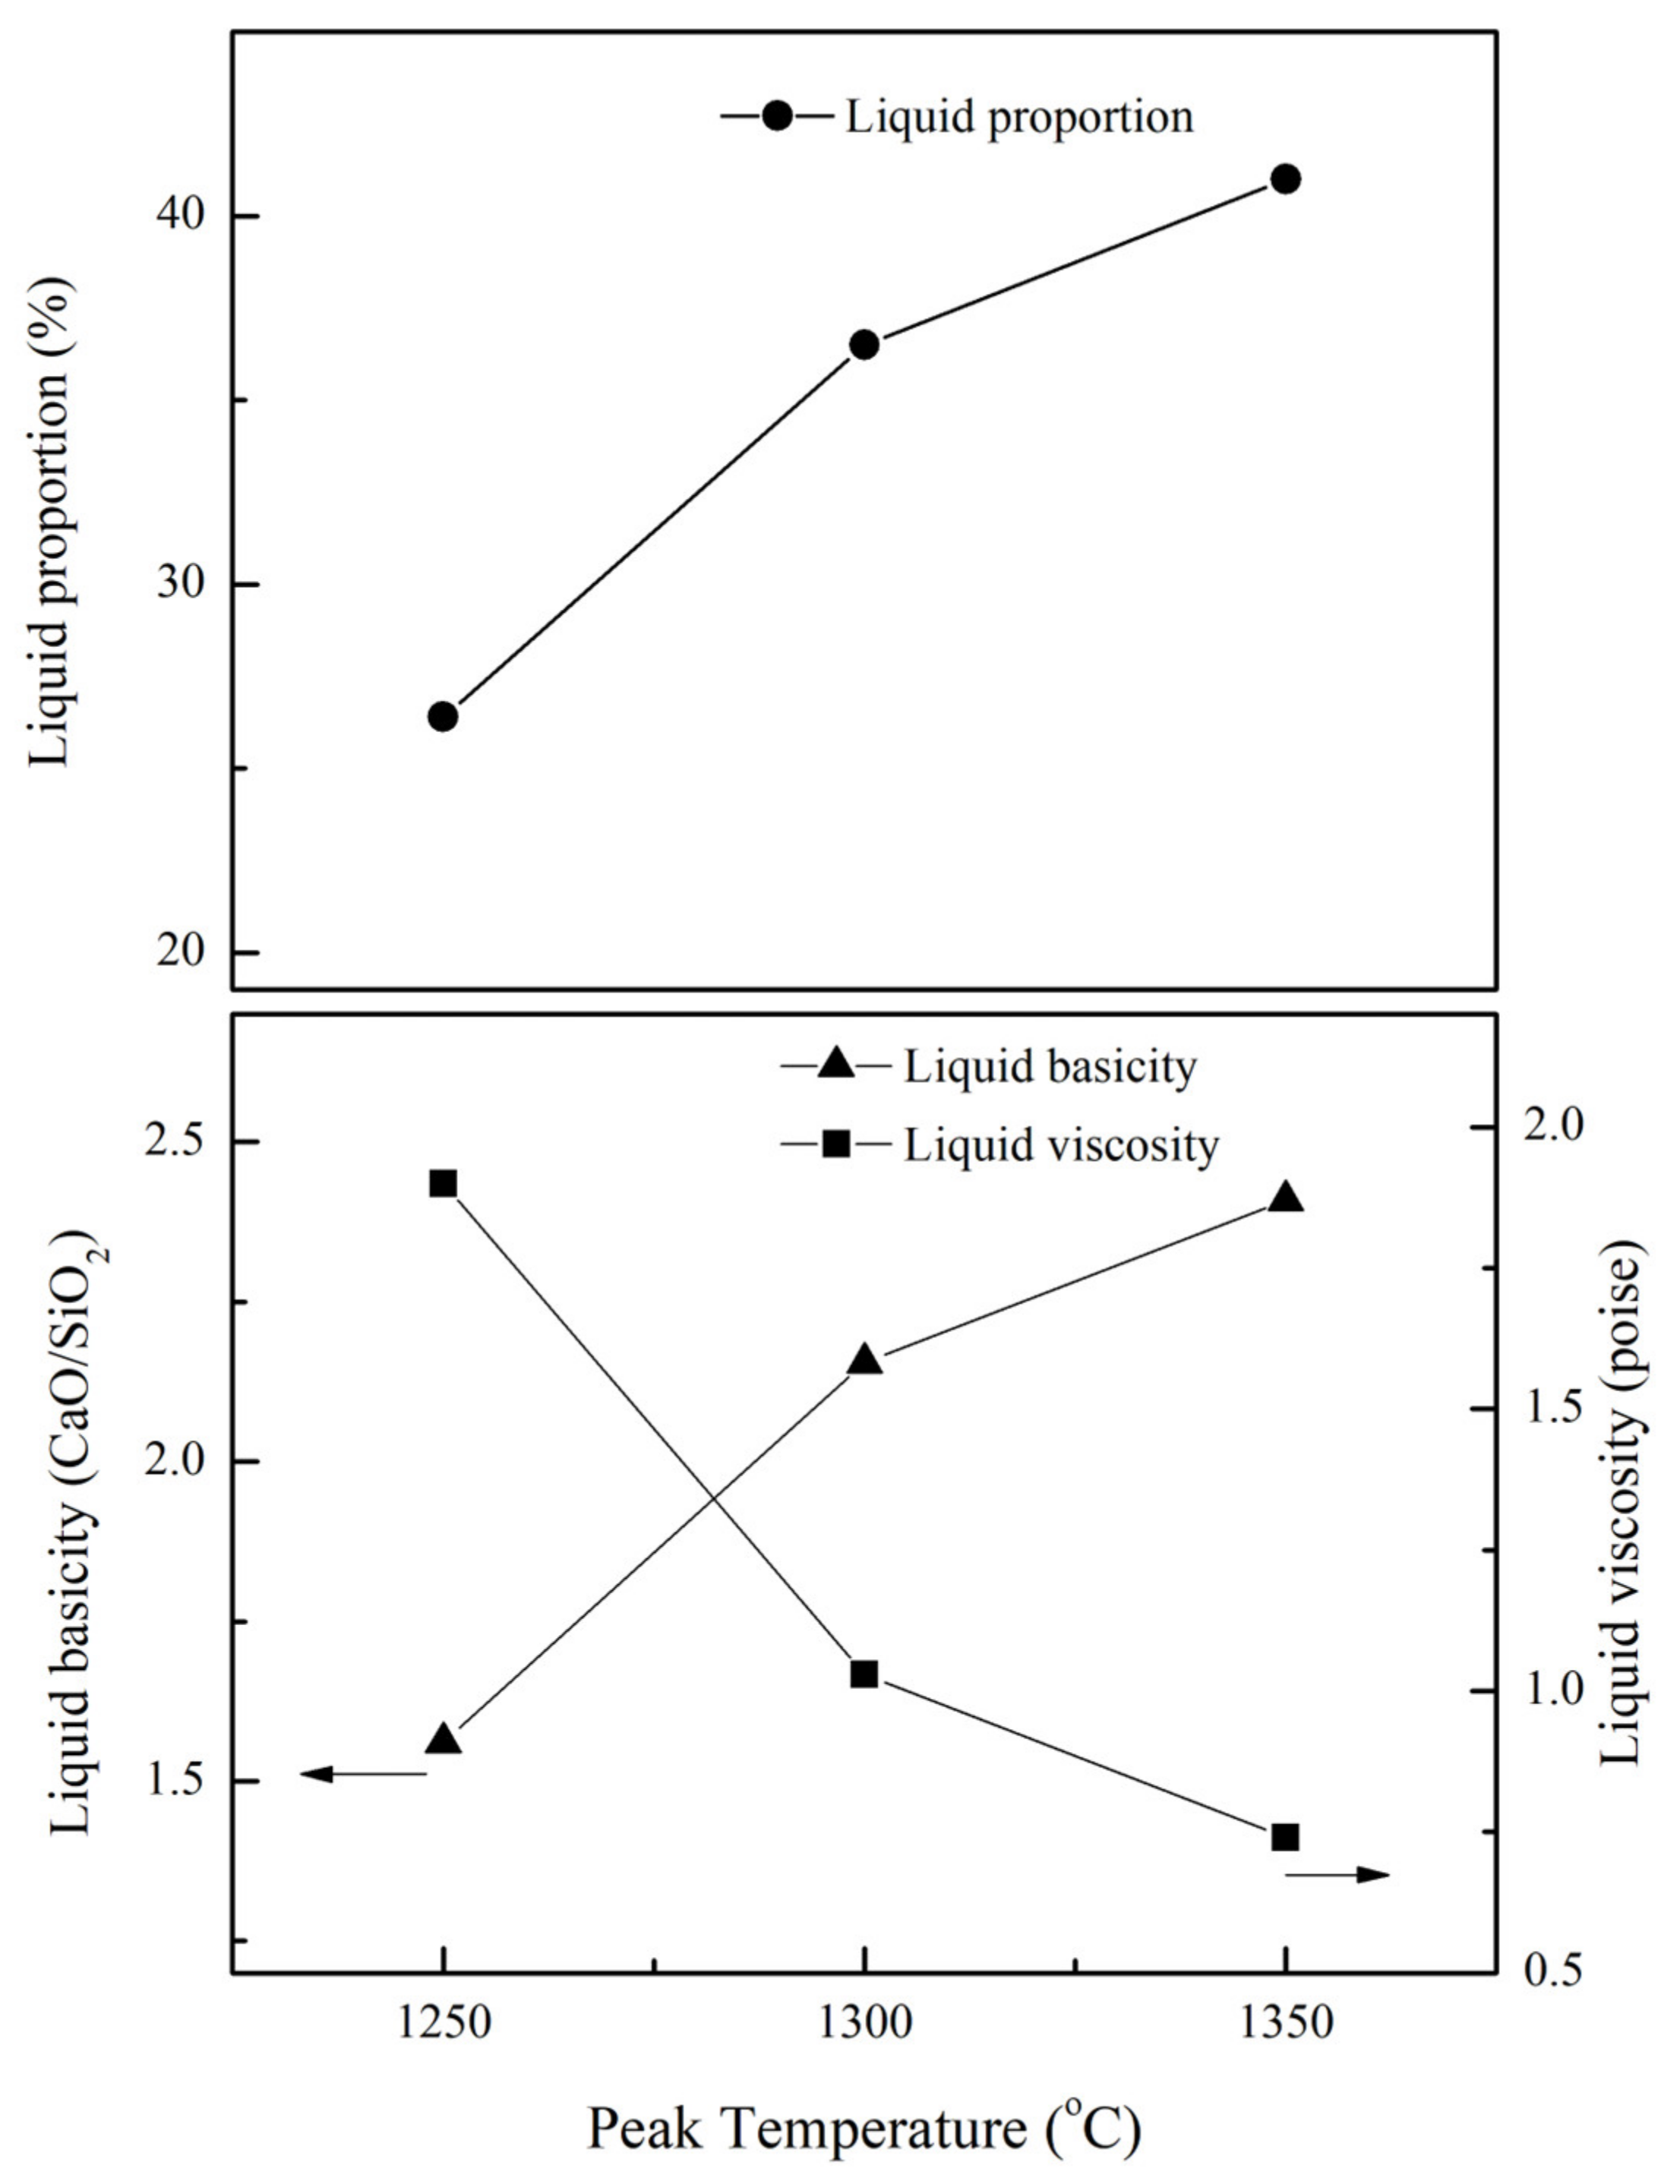
3.1.2. Effect of Peak Temperature

Experiments were carried out to analyse the impact of variation of the peak operating temperature on sinter liquid. The microstructures of reheated S2 samples are presented in Figure 4. The phases present and their compositions upon reheating and quenching are shown in Table 3.
Figure 4 shows the presence of sintering liquid and hematite upon reheating and quenching at 1250 °C, 1300 °C, and 1350 °C. The microstructures show an increase in the liquid phase and further deformation of hematite with the temperature rise. Analyses of liquid and hematite compositions in Table 3 show the increase of Fe2O3 in sinter liquid and a decrease of hematite with a temperature rise from 1250 to 1350 °C. In contrast, the SiO2 amount decreased in the liquid phase with the temperature rise. Therefore, the calculated liquid proportion and liquid basicity increased as the temperature increased, whereas the liquid viscosity decreased, as shown in Figure 5. This varied peak temperature and liquid proportion estimation help control the liquid proportion while preparing the low-silica and low-FeO sinters.

3.1.3. Effect of Holding Time

Experiments were carried out to analyse the impact of varied holding times on sinter liquid. The microstructures of reheated and quenched S2 samples are presented in Figure 6. The phases present and their compositions are shown in Table 4.
On varying the holding time from 10 min to 60 min at 1300 °C, while the liquid viscosity increased from 1.03 poise to 1.07 poise, which is a minor change, the Fe2O3 content decreased from 49.7% to 49% in the liquid phase, and the liquid basicity decreased from 2.2 to 2.0. The variation with increased holding time on liquid properties is very minimal, showing the sample was in near equilibrium for a holding time of 10 min at 1300 °C.

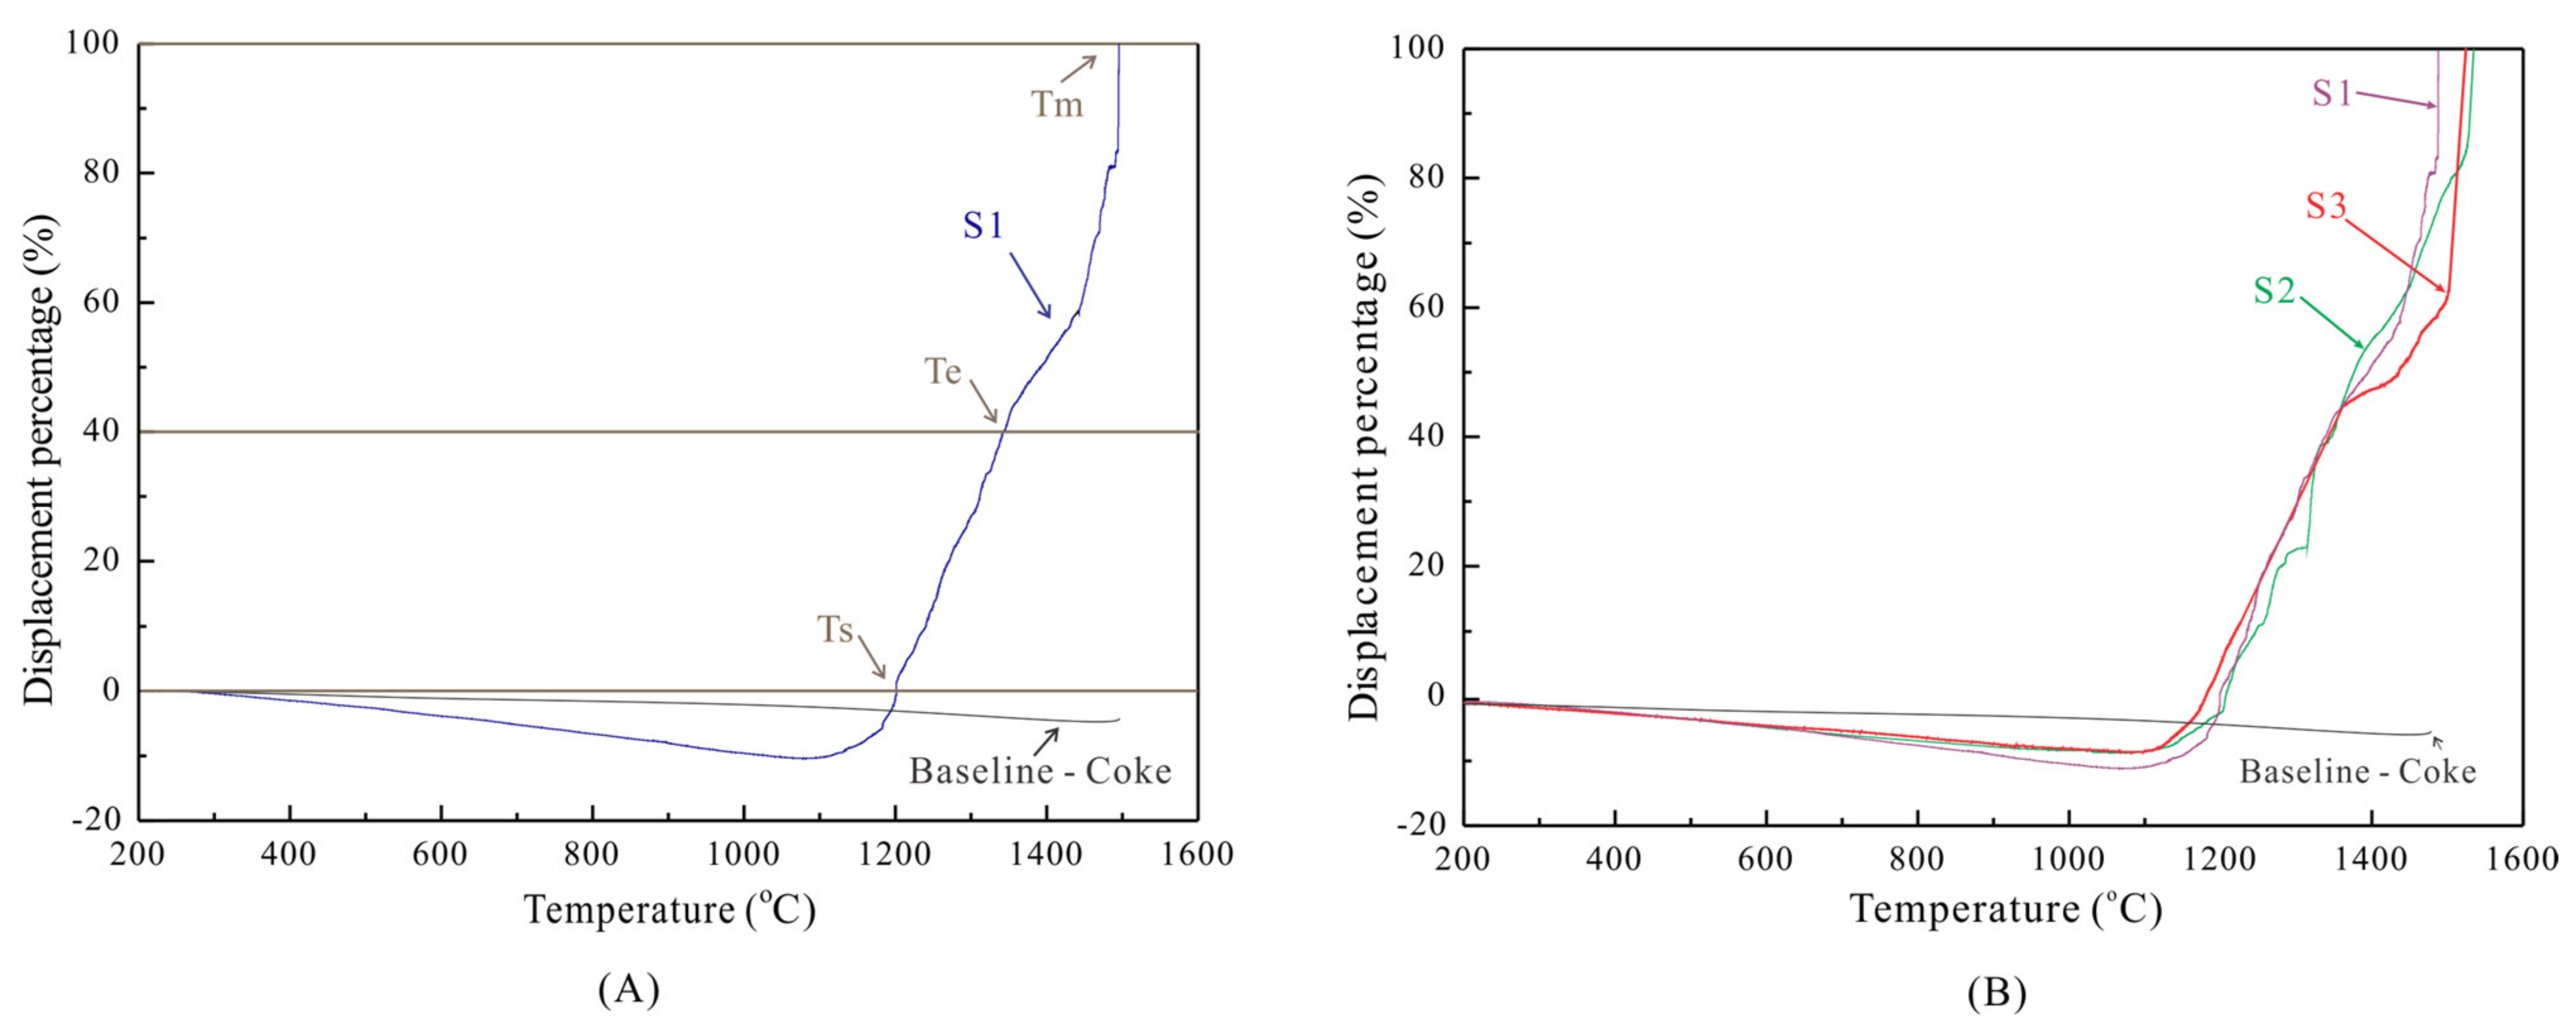
3.2. Softening Behaviour of Sinters

As the temperature increased, the sample bed initially expanded during the softening tests, and then there was a continuous contraction. The present study defines the temperature at 0% displacement contraction as the softening starting temperature (Ts). At 40% displacement contraction, the temperature is defined as the softening ending temperature (Te). Finally, the temperature at 100% displacement contraction is defined as the melting temperature (Tm) [15]. The softening and melting temperatures are represented in Graph A in Figure 7 by considering the S1 curve. The three sinters’ and coke’s displacement contraction curves are shown in Graph B in Figure 7.
The softening temperature range is the difference between the softening ending temperature and softening starting temperature (Te-Ts). The cohesive zone range is the difference between the melting and softening starting temperatures (Tm-Ts). Therefore, as the sample expands and then contracts back to the initial position, then the temperatures of Ts followed by Te and Tm are calculated at the corresponding displacement percentage. The softening and cohesive range for the three different sinters are detailed in Table 5.
The sinters should have a higher softening starting temperature and a lower melting temperature, resulting in a narrow cohesive zone for the efficient functioning of the blast furnace. Although the three sinters are currently used as blast furnace feed, on conducting the softening and melting experiments and measuring the cohesive range among these sinters, S1 has the narrowest cohesive range, while S3 has the broadest. In addition, S3, the sinter with the highest FeO content and silica content among the three sinters, has the lowest softening start temperature and the highest melting temperature.

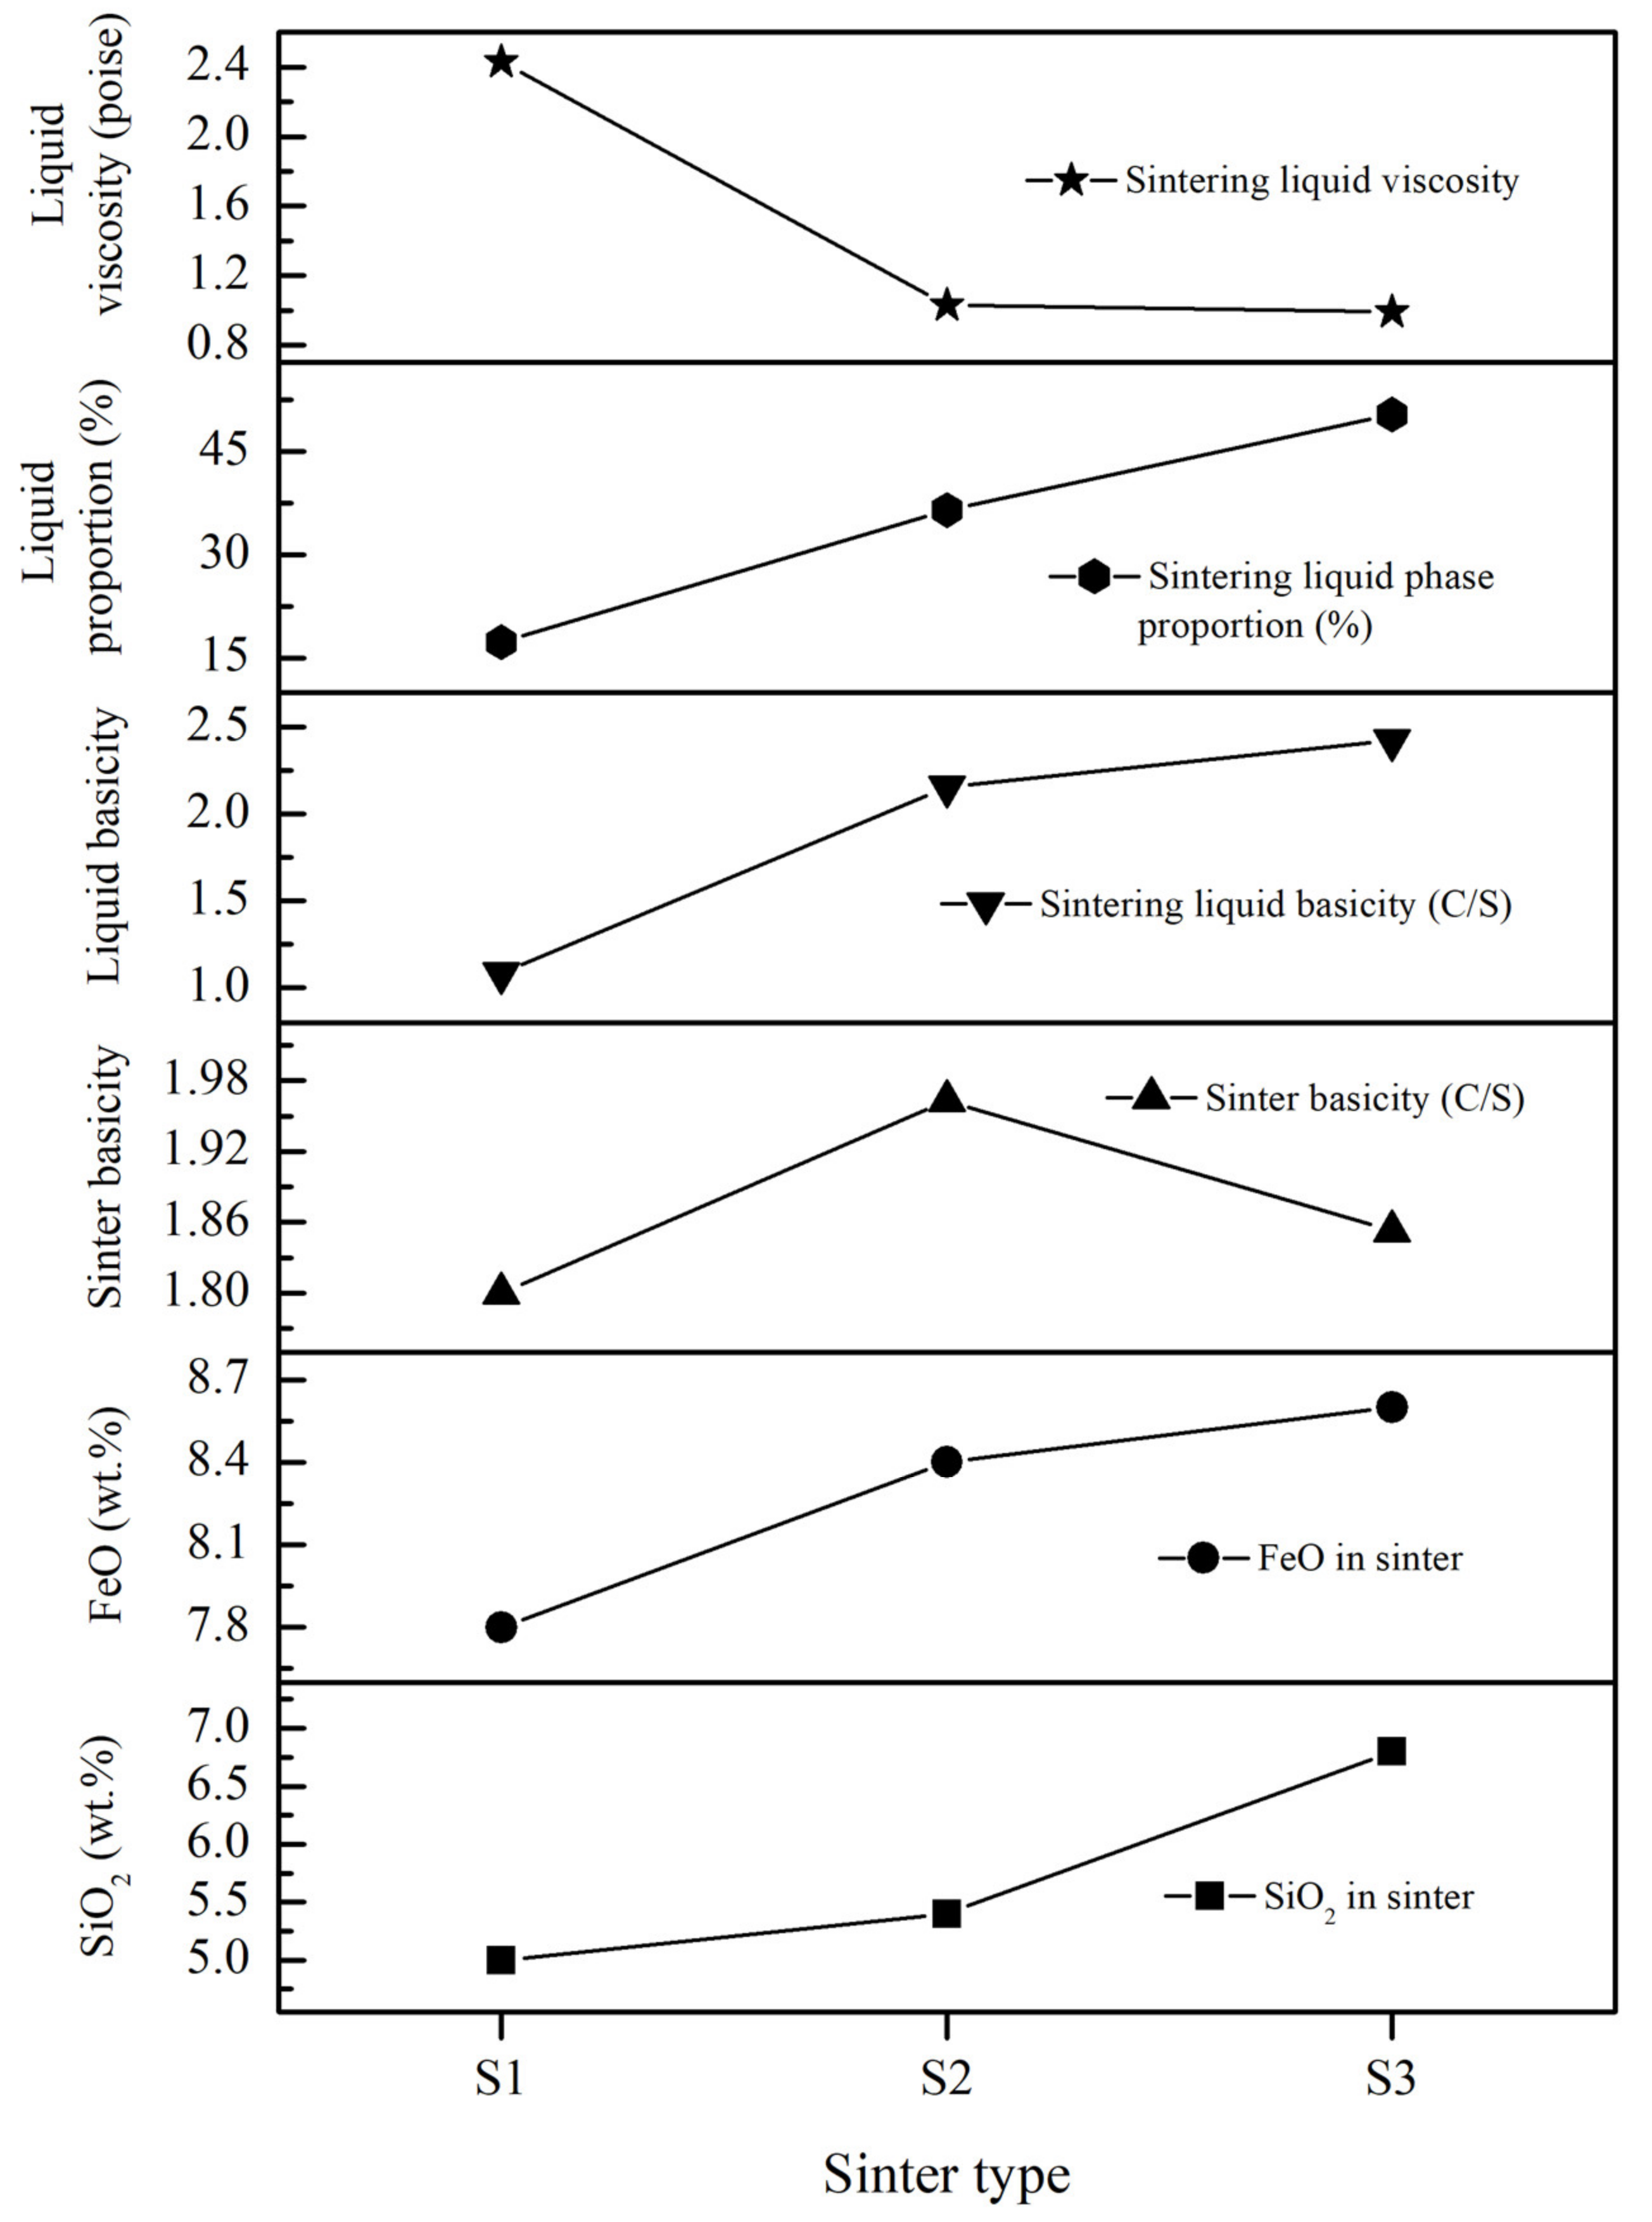
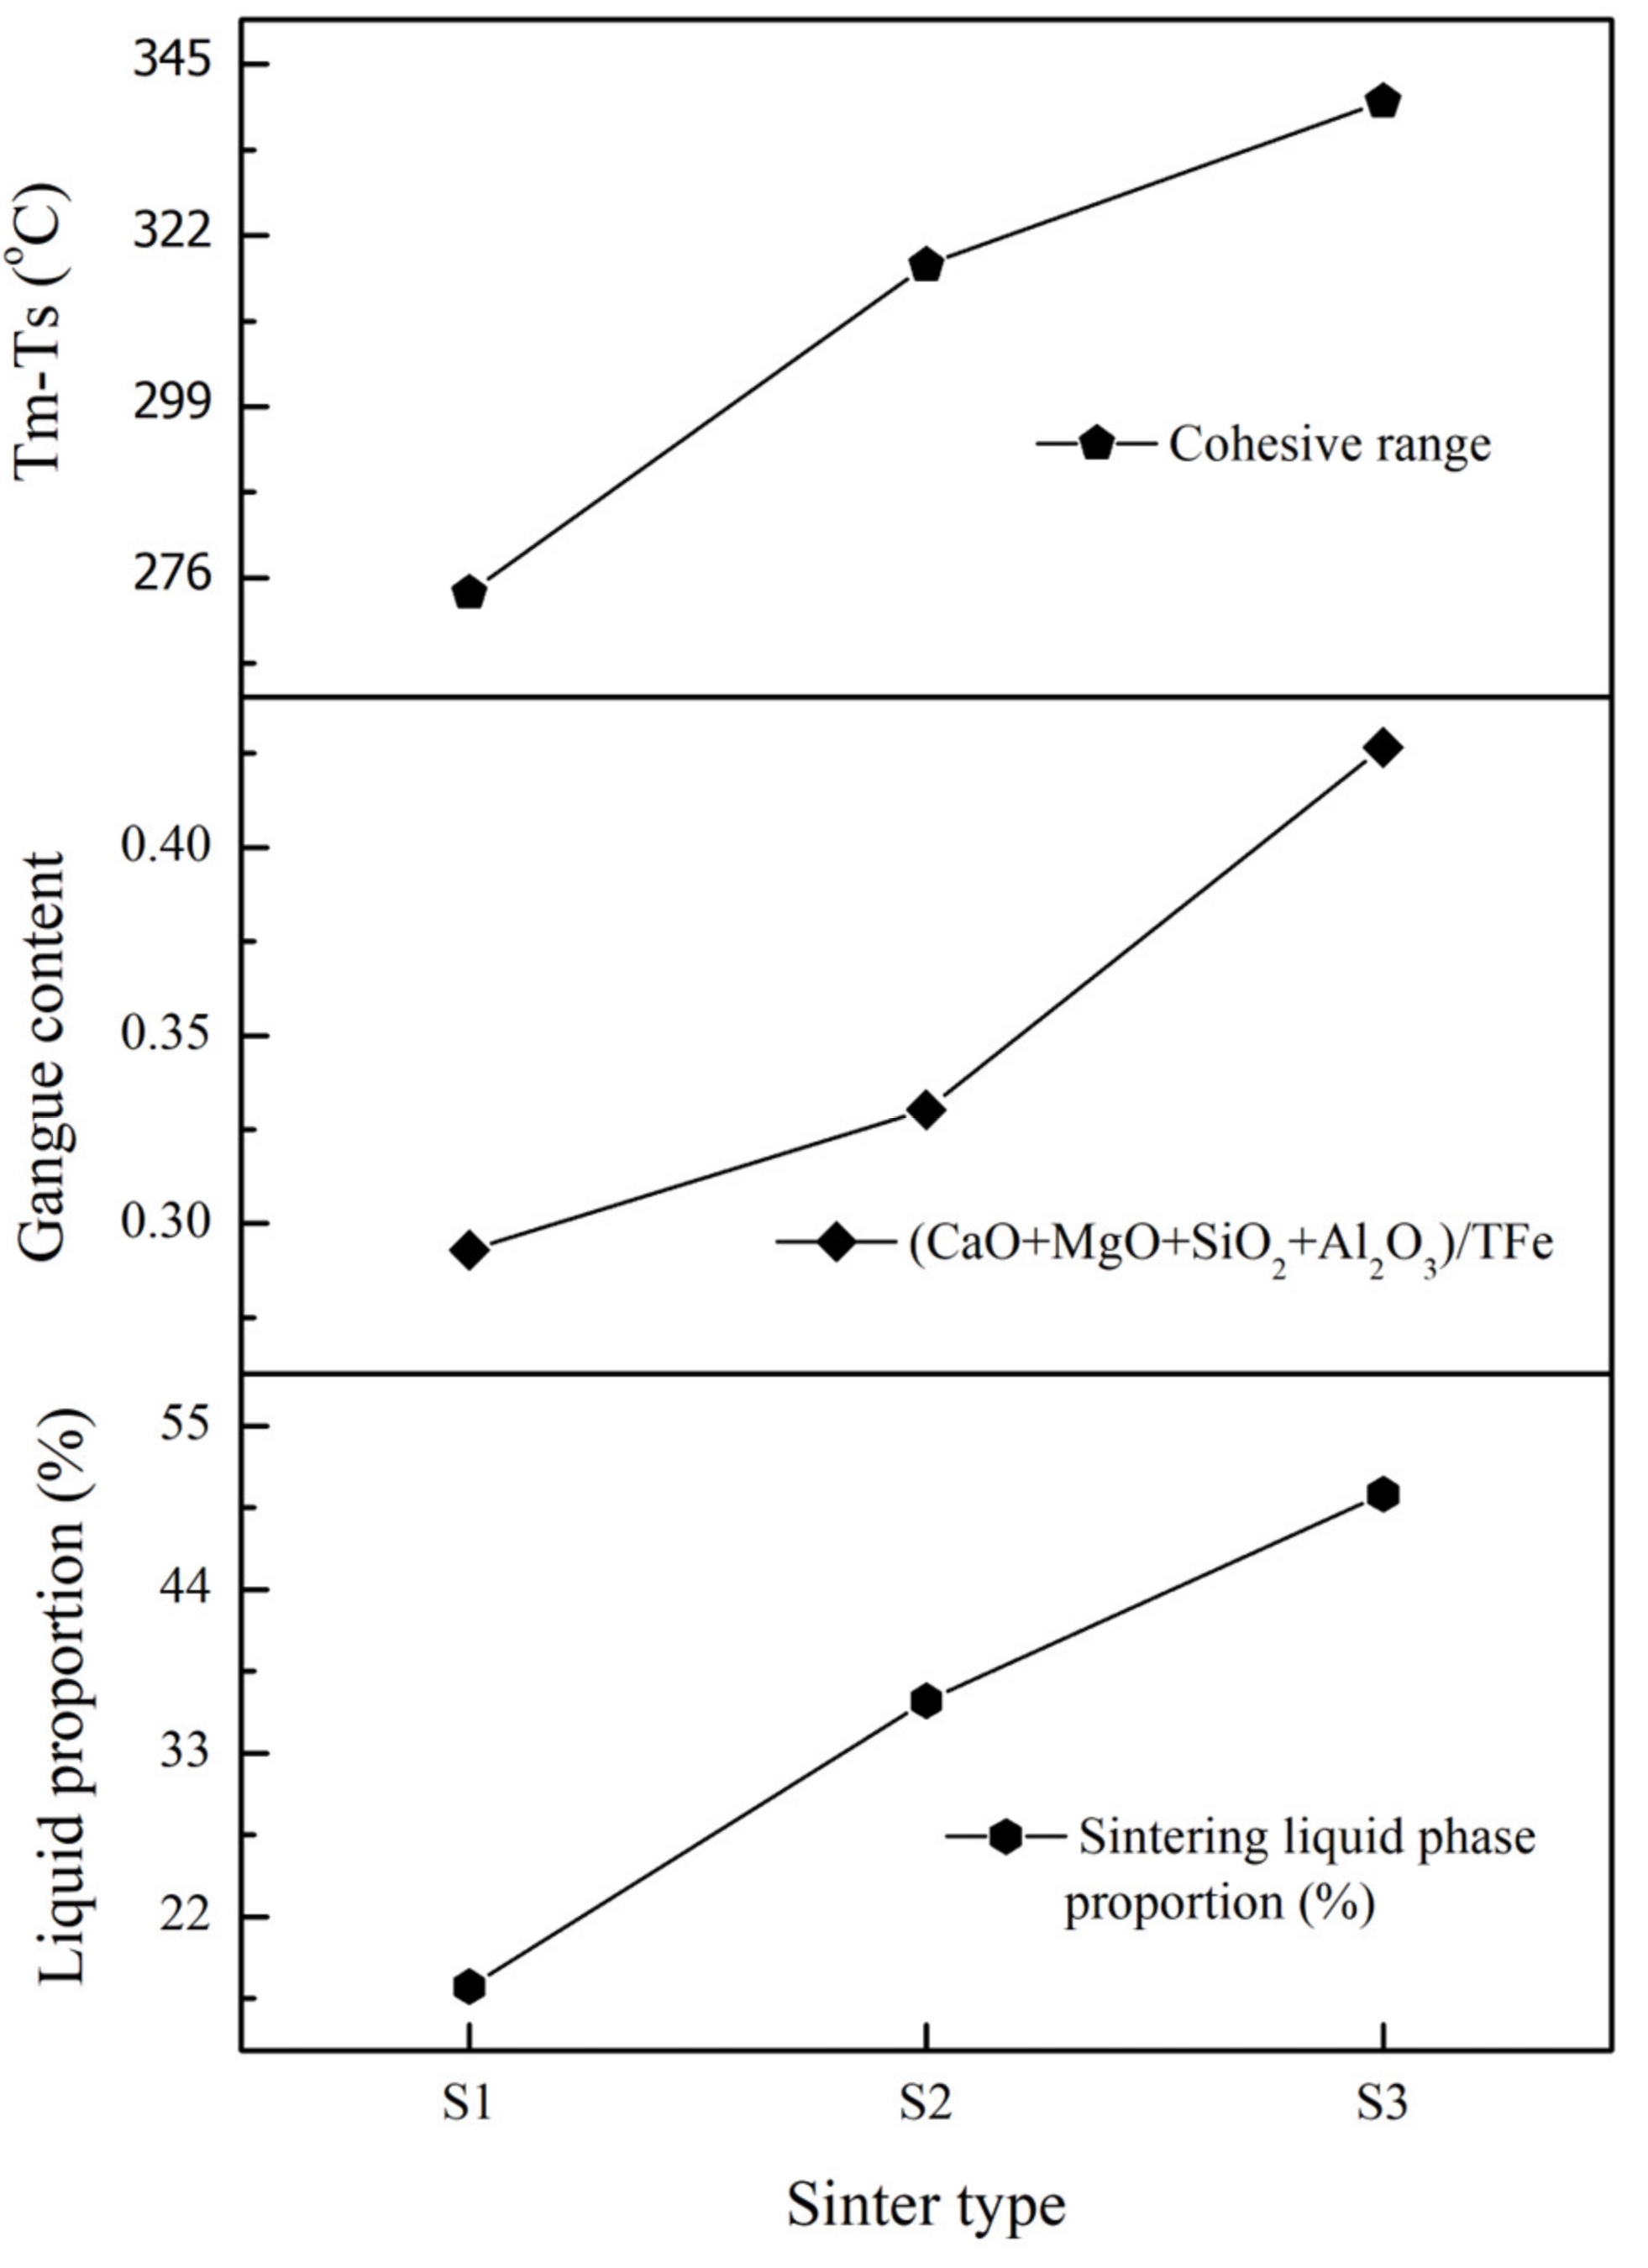
3.3. Correlation of Sinter Liquid Properties to Sinter Softening Properties

Understanding sinter bulk compositions on sinter softening behaviour is essential in preparing sinters with higher softening start temperature, low-FeO containing slags on reduction, and a narrow cohesive zone. In addition, the estimation of phases present and phase compositions at peak sinter bed conditions is vital, as the sintering liquid phase properties play a crucial role in the final sinter morphology. Once the sintering liquid properties were determined by reheating and quenching the sinters, it was followed by the sinters’ softening and melting behaviour analyses. Finally, the impact of sinter bulk compositions and gangue content ((CaO + MgO + SiO2 + Al2O3)/TFe) [3] on sinter cohesive zone behaviour was analysed and correlated to the sinter liquid behaviour in Figure 8.
The liquid proportion, gangue content, and cohesive range have increased from S1 to S3. Though the rise in gangue content from S1 to S2 was lower compared to the increase from S2 to S3, as shown in Figure 8, the liquid phase proportion more than doubled from S1 to S2, and the increased silica, calcia, and FeO contents along with decreased alumina in the sintered bulk, as detailed in Table 1, contributed to this. Despite an increase in the softening starting point from S1 to S2, as shown in Table 5, the significant rise in liquid proportion might have led to an increased glass phase in the sinters, resulting in the generation of viscous slags containing higher FeO, causing coagulation, and therefore leading to an increase in the melting point of S2. Additional increases in silica, calcia, and FeO contents in S3 showed a further rise in the liquid phase proportion. In S3, the liquid phase proportion was nearly 50% at the peak temperature of 1300 °C. It is far beyond the optimal liquid phase required; this resulted in a lower softening starting temperature and further broadening of the cohesive range from S2 to S3. This correlation shows the necessity of controlling the sintering liquid behaviour to achieve better sinter properties.

4. Conclusions

The sinters’ reheating and quenching experiments determined the phases and phase compositions present at the peak sinter bed conditions. The liquid basicity and the liquid proportion increased with an increase in silica content in sinter bulk. Apart from that, the liquid phase proportion increased on increasing the peak operational temperature.
As the gangue content increases in the sinters, broadening/widening of the cohesive range is observed, detrimental to blast furnace efficacy. This suggests that though an optimal liquid phase is needed to bind the blend, the excess liquid raises the gangue content in sinters, resulting in high-FeO containing slags on reduction, apart from increasing the glass phase and increased sinter returns generation.
This research is a primary step in exploring the relationship between sintering liquid properties, sinter bulk properties, and softening properties. This study helps better understand the sintering liquid behaviour at peak temperature, which impacts the final sinter morphology, thereby the reduction behaviour of the sinters.

Author Contributions

Conceptualization, V.K., T.E., F.T., B.Z. and X.M.; methodology, B.Z. and X.M.; validation, V.K., B.Z., F.T. and X.M.; formal analysis, V.K.; investigation, V.K.; resources, D.W., W.P., S.C., T.E., B.Z. and X.M.; data curation, V.K. and F.T.; writing—original draft preparation, V.K.; writing—review and editing, V.K., F.T. and X.M.; visualization, V.K., D.W., W.P., S.C., F.T. and X.M.; supervision, X.M.; project administration, F.T. and X.M.; funding acquisition, F.T., B.Z. and X.M. All authors have read and agreed to the published version of the manuscript.

Funding

This research was funded by Shougang Group and Rio Tinto Iron Ore.

Data Availability Statement

Not applicable.

Acknowledgments

The authors would like to thank Shougang Group and Rio Tinto for providing the sinter samples and their financial support. The authors acknowledge the facilities, and the scientific and technical assistance, of the Australian Microscopy and Microanalysis Research Facility at the Centre for Microscopy and Microanalysis, the University of Queensland.

Conflicts of Interest

The authors declare no conflict of interest.

References

  1. Fernández-González, D.; Ruiz-Bustinza, I.; Mochón, J.; González-Gasca, C.; Verdeja, L.F. Iron Ore Sintering: Process. Mineral Process. Extr. Metall. Rev. 2017, 38, 215–227. [Google Scholar] [CrossRef]
  2. Ghosh, A.; Chatterjee, A. Iron Making and Steelmaking: Theory and Practice; PHI Learning Pvt. Ltd.: New Delhi, India, 2008. [Google Scholar]
  3. Shatokha, V.; Velychko, O. Study of Softening and Melting Behaviour of Iron Ore Sinter and Pellets. High Temp. Mater. Processes 2012, 31, 215–220. [Google Scholar] [CrossRef]
  4. Higuchi, K.; Takamoto, Y.; Orimoto, T.; Takehiko, S.; Koizumi, F.; Kazuyuki, S.; Furuta, H. Quality Improvement of Sintered Ore in Relation to Blast Furnace Operation. Nippon Steel Tech. Rep. 2006, 96, 36–41. [Google Scholar]
  5. Lv, X.; Bai, C.; Deng, Q.; Huang, X.; Qiu, G. Behavior of liquid phase formation during iron ores sintering. ISIJ Int. 2011, 51, 722–727. [Google Scholar] [CrossRef] [Green Version]
  6. Wu, S.; Zhai, X. Factors influencing melt fluidity of iron ore. Metall. Res. Technol. 2018, 115, 505. [Google Scholar] [CrossRef]
  7. Wu, S.-L.; Wang, Q.-F.; Bian, M.-L.; Zhu, J.; Long, F.-Y. Influence of iron ore characteristics on FeO formation during sintering. J. Iron Steel Res. Int. 2011, 18, 5–10. [Google Scholar] [CrossRef]
  8. Murao, R.; Kimura, M. Investigation on reaction schemes of iron ore sintering process by high temperature in-situ x-ray diffraction and micro-texture observation. Nippon. Steel Sumitomo Met. Tech. Rep. 2018, 118, 59–64. [Google Scholar]
  9. Zhang, G.-L.; Wu, S.-L.; Chen, S.-G.; Su, B.; Que, Z.-G.; Hou, C.-G. Influence of gangue existing states in iron ores on the formation and flow of liquid phase during sintering. Int. J. Miner. Metall. Mater. 2014, 21, 962–968. [Google Scholar] [CrossRef] [Green Version]
  10. Kasai, E.; Sakano, Y.; Kawaguchi, T.; Nakamura, T. Influence of properties of fluxing materials on the flow of melt formed in the sintering process. ISIJ Int. 2000, 40, 857–862. [Google Scholar] [CrossRef] [Green Version]
  11. Okazaki, J.; Higuchi, K.; Hosotani, Y.; Shinagawa, K. Influence of Iron Ore Characteristics on Penetrating Behavior of Melt into Ore Layer. ISIJ Int. 2003, 43, 1384–1392. [Google Scholar] [CrossRef] [Green Version]
  12. Van den Berg, T.; de Villiers, J.; Cromarty, R. Variation of the redox conditions and the resultant phase assemblages during iron ore sintering. Int. J. Mineral Process. 2016, 150, 47–53. [Google Scholar] [CrossRef] [Green Version]
  13. Nicol, S.; Chen, J.; Qi, W.; Mao, X.; Jak, E.; Hayes, P.C. Measurement of Process Conditions Present in Pilot Scale Iron Ore Sintering. Minerals 2019, 9, 374. [Google Scholar] [CrossRef] [Green Version]
  14. Nishimura, T.; Higuchi, K.; Naito, M.; Kunitomo, K. Evaluation of Softening, Shrinking and Melting Reduction Behavior of Raw Materials for Blast Furnace. ISIJ Int. 2011, 51, 1316–1321. [Google Scholar] [CrossRef] [Green Version]
  15. Wang, D.; Chen, M.; Zhang, W.; Zhao, Z.; Zhao, B. Softening Behaviors of High Al2O3 Iron Blast Furnace Feeds. In Proceedings of the 10th CSM Steel Congress & 6th Baosteel Biennial Academic Conference, Shanghai, China, 21–23 October 2015. [Google Scholar]
  16. Chen, M.; Zhao, B. Phase Equilibrium Studies of “Cu2O”–SiO2–Al2O3 System in Equilibrium with Metallic Copper. J. Am. Ceram. Soc. 2013, 96, 3631–3636. [Google Scholar] [CrossRef]
Figure 1. Schematic diagram of Pyrox furnace used for softening and melting test along with the sandwich bed containing coke and sinters, and laser displacement sensor.
Metals 12 00885 g001
Figure 2. Microstructural BSE images of various reheated sinters quenched from 1300 °C. Microstructure (A) S1, (B) S2, and (C) S3. All samples comprise the hematite (H) and liquid phase (L).
Metals 12 00885 g002
Figure 3. Sintering liquid properties of the three sinters upon reheating and quenching with respect to sinter bulk compositions.
Metals 12 00885 g003
Figure 4. Microstructural BSE images of reheated sinter ‘S2’ at varied peak temperatures. (a) 1250 °C, (b) 1300 °C, and (c) 1350 °C.
Metals 12 00885 g004
Figure 5. Variation of sinter liquid properties with varied reheating temperatures.
Metals 12 00885 g005
Figure 6. Microstructural BSE images of reheated S2 sinters at different holding times. (a) 10 min, and (b) 60 min.
Metals 12 00885 g006
Figure 7. Graph (A) indicates the softening and melting temperature at the respective displacement percentage for sinter S1. Graph (B) shows the sinter softening and melting behaviour with initial expansion followed by continuous contraction for the three sinters, S1, S2 and S3.
Metals 12 00885 g007
Figure 8. Correlation of sintering liquid proportion and sinters gangue content with the sinters cohesive range.
Metals 12 00885 g008
Table 1. Sinter samples used in the present study along with their bulk compositions.
SinterComposition (wt.%)
Fe2O3FeOCaOSiO2Al2O3MgO
S174.77.89.05.01.91.6
S272.38.410.65.41.81.5
S367.88.612.66.82.22.0
Table 2. Phases and phase compositions present upon reheating the three sinters at 1300 °C for 10 min and Po2 of 0.01 atm, followed by quenching and EPMA.
Composition (wt.%)
SinterPhaseFe2O3CaOSiO2Al2O3MgOPhase Proportion (%)Liquid BasicityViscosity (Poise)
S1Sintering liquid38.431.328.91.30.117.31.12.43
Hematite962.201.40.482.7N/AN/A
S2Sintering liquid49.731.914.83.30.336.52.21.03
Hematite95.72.301.60.463.5N/AN/A
S3Sintering liquid49.732.713.53.70.450.42.40.99
Hematite94.92.601.70.849.6N/AN/A
Table 3. Phases and phase compositions present in sinter ‘S2’ upon reheating at 1250 °C, 1300 °C, and 1350 °C, followed by quenching and EPMA.
Composition of Liquid (wt.%)
Peak Temperature (°C)Holding Time (min)PhaseFe2O3CaOSiO2Al2O3MgOPhase Proportion (wt.%)Liquid BasicityViscosity (Poise)
125010Sintering liquid44.332.020.53.20.126.41.61.90
Hematite97.41.10.01.30.273.6N/AN/A
130010Sintering liquid49.731.914.83.30.336.52.21.03
Hematite95.72.301.60.463.5N/AN/A
135010Sintering liquid51.231.813.23.70.241.02.40.74
Hematite94.02.90.01.41.659.0N/AN/A
Table 4. Phases present and phase compositions in sinter ‘S2’ upon reheating for two different holding times of 10 min and 60 min at 1300 °C.
Composition of Liquid (wt.%)
Peak Temperature (°C)Holding Time (min)PhaseFe2O3CaOSiO2Al2O3MgOPhase Proportion (wt.%)Liquid BasicityViscosity (Poise)
130010Sintering liquid49.731.914.83.30.336.52.21.03
Hematite95.72.301.60.463.5N/AN/A
130060Sintering liquid49.032.015.83.10.134.32.01.07
Hematite96.12.20.01.20.565.7N/AN/A
Table 5. Softening and melting temperatures of the sinters S1, S2, and S3 along with softening and cohesive range.
SampleSoftening Starting
Temperature
(Ts, °C)
Softening
Ending
Temperature
(Te, °C)
Melting
Temperature
(Tm, °C)
Softening
Temperature Range
(Te-Ts, °C)
Cohesive Range
(Tm-Ts, °C)
S1120513331479128274
S2120913351527126318
S3117813341518128340
Publisher’s Note: MDPI stays neutral with regard to jurisdictional claims in published maps and institutional affiliations.

