Abstract
In the current work, the phase equilibria of CaO-SiO2-La2O3-Nb2O5 system at 1200 °C in reducing atmosphere (PO2 = 10−15 atm) was investigated according to the melting separation process for extracting lanthanum and niobium resources from Bayan Obo tailing. High temperature equilibrium experiment, scanning electron microscope, and energy dispersive spectrometer (SEM-EDS) were used to determine the compositions of equilibrium phases. According to the experiment results, the phase equilibria of the CaO-SiO2-La2O3-Nb2O5 system in reducing atmosphere were ascertained and the 1200 °C isothermal phase diagram of CaO-SiO2-La2O3-Nb2O5 system in reducing atmosphere was constructed. The research results not only play an important role in guiding the development of the lanthanum and niobium extraction process, but also enrich the thermodynamic data of relevant silicate slag systems.
1. Introduction
Both lanthanum and niobium are indispensable metal materials in modern industry. In Baotou, China, a large quantity of lanthanum and niobium resources remained in the Bayan Obo tailing, which causes a severe waste of resources [1,2]. Through the continuous research of scholars, a process for extracting lanthanum and niobium resources from tailing had been designed, which is “carbon thermal reduction—melting separation—ferroniobium smelting” [3,4,5,6]. CaO-SiO2-La2O3-Nb2O5 is the basic slag system during the process whose thermodynamic data, such as phase equilibria, may provide a theoretical basis for the formulation of process parameters. At present, phase equilibria of CaO-SiO2-La2O3-Nb2O5 system have been studied only in air atmosphere [7,8,9], and related studies [10,11,12,13,14] have been conducted by me and my subject group. However, during the extraction process mentioned above, there exist both processes in air atmosphere and processes in reducing atmosphere, and it is not sufficient to only determine the phase equilibria of CaO-SiO2-La2O3-Nb2O5 system in air atmosphere. Therefore, the current research on the phase equilibria of CaO-SiO2-La2O3-Nb2O5 system in reducing atmosphere was carried out with the aim of providing a more adequate thermodynamic information for the lanthanum and niobium extraction process.
High temperature equilibrium experiment is a scientific and accurate measurement method recognized in the field of silicate phase equilibria; it has been widely used in different systems [15,16,17]. In the current work, phase equilibria of CaO-SiO2-La2O3-Nb2O5 system at 1200 °C in reducing atmosphere (PO2 = 10−15 atm) were investigated experimentally by using high temperature equilibrium experiment combing with scanning electron microscope and energy dispersive spectrometer (SEM-EDS). The 1200 °C isothermal phase diagram of CaO-SiO2-La2O3-Nb2O5 system in reducing atmosphere was constructed and presented by spatial phase diagram, in which six equilibrium phase regions were divided. The research results can supplement the thermodynamic data of relevant silicate slag systems as well as guide the development of the process for extracting lanthanum and niobium resources from Bayan Obo tailing.
2. Experimental Method
2.1. Preparation of Slag Samples
First, CaO, SiO2, La2O3 and Nb2O5 reagents (provided by the Sinopharm Chemical Regent Co., Ltd. Beijing, China.) with a purity of 99.99% were calcined at 1000 °C for 4 h to evaporate moisture and impurity. Then, according to the designed compositions of slags, the reagents with a total weight of 10 g were weighted by an electronic balance with an accuracy of 0.1 mg, sufficiently mixed in a platinum crucible and pre-melted in MoSi2 furnace (B type-thermocouple, temperature control accuracy: ±1 °C, temperature measurement accuracy: ±1 °C). The furnace was heated to 1600 °C with a speed of 3.3 °C/min and kept for 9 h to completely homogenize the slags. Finally, the resulting slags were quenched in ice water within 2 s. The above experimental procedures were all carried out in air atmosphere. After the experiment, the slags were analyzed by scanning electron microscope and energy dispersive spectrometer (SEM-EDS), and at least 6 points were analyzed for each phase in each slag. The details of SEM were EHT = 20 kV and I probe = 200 pA. The standard samples for EDS were O(SiO2), Si(SiO2), Ca(Wollastonite), Nb (Nb) and La (LaB6).The accuracy of EDS was within 1%. Figure 1 shows the SEM photo of pre-melted slag 1, which shows homogeneous liquid phase, indicating that the pre-melted slags were completely melted. The compositions of the pre-melted slags were determined according to the EDS results, as shown in Table 1, which were considered to be the initial compositions of slags.
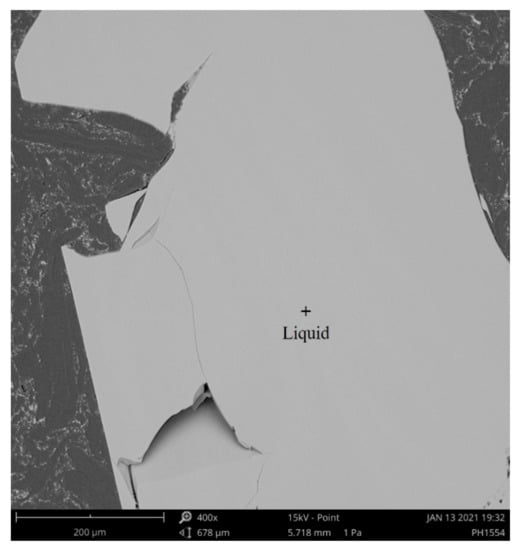
Figure 1.
SEM photo of pre-melt slag 1.

Table 1.
Compositions of pre-melted slags.
2.2. Experimental Atmosphere Control
During the high temperature equilibrium experiment, the atmosphere within the furnace was controlled at PO2 = 10−15 atm by using H2 gas according to the pre-experiment results of atmosphere measurement. In course of the pre-experiment, different flow rates of H2 and CO2 were blowed into the furnace, and a DS oxygen probe (Producer: Australian Oxytrol System Pty. Ltd. Victoria, Australia; Oxygen measurement range: 10−24 atm to 1 atm PO2; Accuracy: within 2 mV of theoretical output.) was employed to assay the oxygen partial pressure in the furnace. The determined oxygen partial pressure under various flow rates were recorded as shown in Table 2, which claims that 500 mL/min of H2 gas is fit for the present experiment condition (1200 °C, PO2 = 10−15 atm).

Table 2.
Oxygen partial pressure measurement results at 1200 °C.
2.3. High Temperature Equilibrium Experiment
The furnace used in the pre-melt experiment was also used in current experiment. Platinum crucible containing 1.5 g pre-melted slag and covered by a corundum crucible was hung at the heat zone of the furnace. The furnace was first heated to 1600 °C and kept for 2 h to completely melt the slag, then cooled down to the equilibrium experiment temperature (1200 °C) and kept for 24 h to ensure the slag had achieved thermodynamic equilibrium state. Finally, the slag was quenched in ice water within 2 s. During the whole experiment, the oxygen partial pressure in the furnace was controlled at 10−15 atm by blowing 500 mL/min of high purity H2 gas (purity: 99.99%) into the furnace. After the experiment, the quenched slag was dried, embedded in epoxy resin, polished, and then analyzed by scanning electron microscope and energy dispersive spectrometer (SEM-EDS), and at least 6 points were analyzed for each phase in each slag. The details of SEM were EHT = 20 kV and I probe = 200 pA. The standard samples for EDS were O (SiO2), Si (SiO2), Ca (Wollastonite), Nb (Nb) and La (LaB6). The accuracy of EDS was within 1%.
3. Results and Discussion
3.1. Equilibrium Phases and Phase Equilibria
SEM-EDS results of slags were shown in Figure 2 and Table 3. All of the slags contain obvious liquid phase region with uniform composition and precipitated phases with complete form, which indicates the slags had reached thermodynamic equilibrium state. Meanwhile, the SEM-EDS results reveal that slag 2 to slag 5 are four-phase coexistence and other slags are three-phase coexistence, the grey matrix phases are liquid, the black phases are CaSiO3 or SiO2, the light grey phases are CaNb2O6 or Ca2Nb2O7, and the white phases are LaNbO4.
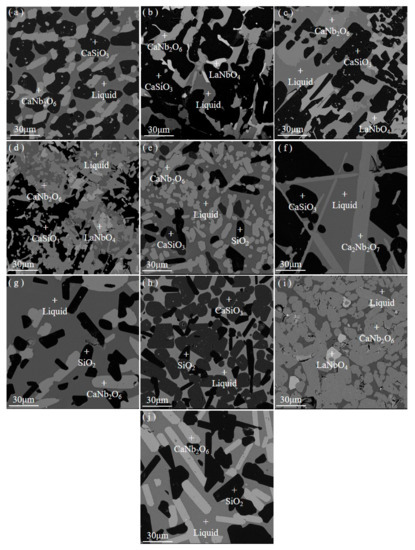
Figure 2.
SEM photos of high temperature equilibrium experiment slags. (a) slag 1 (L+CN+CS), (b) slag 2 (L+CN+CS+LN), (c) slag 3 (L+CN+CS+LN), (d) slag 4 (L+CN+CS+LN), (e) slag 5 (L+CN+CS+S), (f) slag 6 (L+C2N+CS), (g) slag 7 (L+CN+S), (h) slag 8 (L+CS+S), (i) slag 9 (L+CN+LN), and (j) slag 10 (L+CN+S).

Table 3.
EDS results of high temperature equilibrium experiment slags (mol%).
According to the present experiment results, the phase equilibria of CaO-SiO2-La2O3-Nb2O5 system at 1200 °C in reducing atmosphere were determined as shown in Table 4 and Figure 3. It should be noted that L, CN, CS, LN, = C2N, S in Table 4 represent liquid phase, CaNb2O6, CaSiO3, LaNbO4, Ca2Nb2O7, SiO2, respectively, which are same in the following. The experimental results show that the primary crystal regions of CN, CS, C2N and LN are adjacent to each other, the primary crystal regions of CN, CS, S and LN are adjacent to each other as well. Referring to the triangular division method in the ternary phase diagram [18], for the precipitation phases whose primary crystal regions are adjacent to each other, their component points can be connected by straight lines, and the ternary phase diagram can be divided into several triangular regions. Similarly, several tetrahedral regions can be divided in the CaO-SiO2-La2O3-Nb2O5 quaternary phase diagram by connecting the component points of the precipitation phases whose primary crystal regions are adjacent to each other. In summary, based on the current experimental results, two independent tetrahedral regions can be constituted in CaO-SiO2-La2O3-Nb2O5 quaternary phase diagram in reducing atmosphere, which are CN-CS-LN-S and LN-C2N-CN-CS tetrahedral regions. Meanwhile, for slags located in CN-CS-LN-S tetrahedral region, the precipitated phases at the end of the cooling precipitation process are CN, CS, LN and S, while for slags located in LN-C2N-CN-CS tetrahedral region, the precipitated phases at the end of the cooling precipitation process are LN, C2N, CN, and CS.

Table 4.
Summary of high temperature equilibrium experiment results.
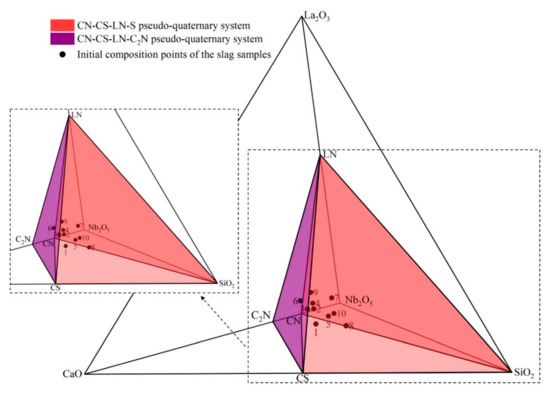
Figure 3.
Phase equilibria of CaO-SiO2-La2O3-Nb2O5 system.
In addition, the adjacent relationships between the primary crystal regions of the precipitated phases determined in the present study were completely consistent with those in the CaO-SiO2 [19], CaO-Nb2O5 [20], CaO-SiO2-Nb2O5 [21], and CaO-SiO2-Nb2O5-La2O3 [7] system in air atmosphere.
3.2. Isothermal Phase Diagram at 1200 °C in Reducing Atmosphere
Under the current experiment condition, the equilibrium phases of slag 1, slag 2, slag 5 are L+CN+CS, L+CN+CS+LN, L+CN+CS+S, respectively. The experiment results were reflected in spatial phase diagram as shown in Figure 4, where ⓐ–ⓒ points represent the liquid compositions of slag 2, slag 1, slag 5 and ⓞ–ⓠ points represent the initial compositions of slag 2, slag1, slag 5, respectively. It can be seen that the initial composition point of slag 1 locates on the surface constituted by the liquid composition point of slag 1 and the composition points of CN, S phases, which conforms to the lever rule [9,22]. The initial composition point of slag 2 lies in the tetrahedron region constituted by the liquid composition point of slag 2 and composition points of CN, CS, LN phases, which also conforms the lever rule. Similarly, the experiment result of slag 5 conforms the lever rule as well. All experiment results of the slags conform to the lever rule, which further proves that the experimental slags had reached the thermodynamic equilibrium state.
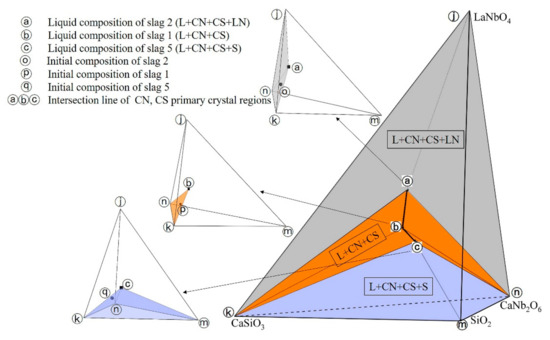
Figure 4.
Intersection line of CN and CS primary crystal regions.
According to the Gibbs phase rule [23], in the spatial isothermal phase diagram, the liquid composition point of slag 2 (L+CN+CS+LN) is an invariant point, which is the intersection point between the intersection line of CN, CS, LN primary crystal regions and 1200 °C isothermal surface; the liquid composition point of slag 1 (L+CN+CS) is located on the univariate line, which is the intersection line between the interface of CN, CS primary crystal regions and 1200 °C isothermal surface; the liquid composition point of slag 5 (L+CN+CS+S) is an invariant point, which is the intersection point between the intersection line of CN, CS, S primary crystal regions and 1200 °C isothermal surface. Meanwhile, in spatial variable temperature phase diagram, the intersection line of CN, CS, LN primary crystal regions is a boundary of the interface of CN, CS primary crystal regions; the intersection line of CN, CS, S primary crystal regions is a boundary of the interfaces of CN, CS primary crystal regions.
Based on the above geometric relations in phase diagram, the intersection line of CN, CS primary crystal regions under current experiment condition was determined as shown in Figure 4 (curve ⓐ–ⓒ), where ⓐ and ⓑ are two endpoints of the intersection line, respectively. It can be concluded that three equilibrium phase regions exist in CaO-SiO2-La2O3-Nb2O5 system at 1200 °C in reducing atmosphere, which are L+CN+CS+LN (ⓐⓚⓝⓙ tetrahedron region in Figure 4), L+CN+CS+S (ⓒⓚⓜⓝ tetrahedron region in Figure 4), L+CN+CS (ⓐⓑⓒⓚⓝ region in Figure 4).
The equilibrium phases of slag 5 are L+CN+CS+S, the equilibrium phases of slag 10 and slag 7 are both L+CN+S. Combining the liquid phase compositions of slag 5, slag 10, slag 7 with the Gibbs phase rule, the intersection line of CN, S primary crystal regions was constructed in spatial phase diagram as shown in Figure 5 (curve ⓒ–ⓔ), where the ⓒ–ⓔ points represent the liquid phase compositions of slag 5, slag 10 and slag 7, the ⓡ, ⓢ points represent the initial compositions of slag 10, slag 7, respectively. It is observed that the experiment results conform to the lever rule, which also proves that the experimental slags had reached the thermodynamic equilibrium state. It can be concluded that two equilibrium phase regions exist in CaO-SiO2-La2O3-Nb2O5 system at 1200 °C in reducing atmosphere, which are L+CN+CS+S (ⓒⓚⓜⓝ tetrahedron region in Figure 5) and L+CN+S (ⓒⓓⓔⓜⓝ region in Figure 5).
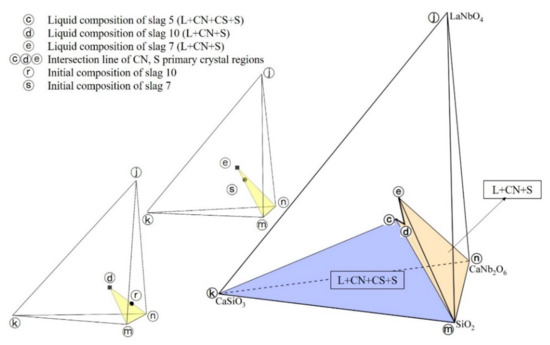
Figure 5.
Intersection line of CN, S primary crystal regions.
The equilibrium phases of slag 2, slag 3 and slag 4 are all L+CN+CS+LN, the equilibrium phases of slag 9 are L+CN+LN. Combining the liquid phase compositions of the above slags with the Gibbs phase rule, the intersection line of CN, LN primary crystal regions was constructed in spatial phase diagram as shown in Figure 6 (line ⓐⓖ), where the ⓐ, ⓖ points represent the liquid phase compositions of slag 2, slag 9 and the ⓣ point represents the initial composition of slag 9, respectively. It can be seen that the experiment results of slag 9 conform to the lever rule, which also explains the slag 9 had reached the thermodynamic equilibrium condition. Thus, two equilibrium phase regions were determined in CaO-SiO2-La2O3-Nb2O5 system at 1200 °C in reducing atmosphere, which are L+CN+CS+LN (ⓐⓚⓝⓙ tetrahedron region in Figure 6) and L+CN+LN (ⓐⓖⓝⓙ tetrahedron region in Figure 6).
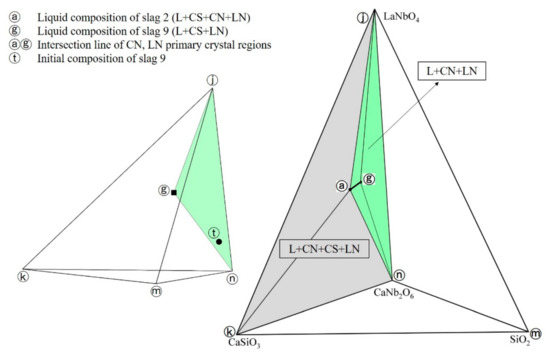
Figure 6.
Intersection line of CN, LN primary crystal regions.
The equilibrium phases of slag 5, slag 8 are L+CN+CS+S and L+CS+S, respectively. Combining the liquid phase compositions of the slag 5 and slag 8 with the Gibbs phase rule, the intersection line of CS, S primary crystal regions was constructed in spatial phase diagram as shown in Figure 7 (line ⓒⓕ), where the ⓒ, ⓕ points represent the liquid phase compositions of slag 5, slag 8, respectively, and the ⓤ point represents the initial composition of slag 8. It is obvious that the experiment results of slag 8 conform to the lever rule as well, which illustrates slag 8 had reached the thermodynamic equilibrium state. Thus, two equilibrium phase regions exist in CaO-SiO2-La2O3-Nb2O5 system at 1200 °C in reducing atmosphere, which are L+CN+CS+S (ⓒⓚⓜⓝ tetrahedron region in Figure 7) and L+CS+S (ⓕⓚⓜⓒ tetrahedron region in Figure 7).
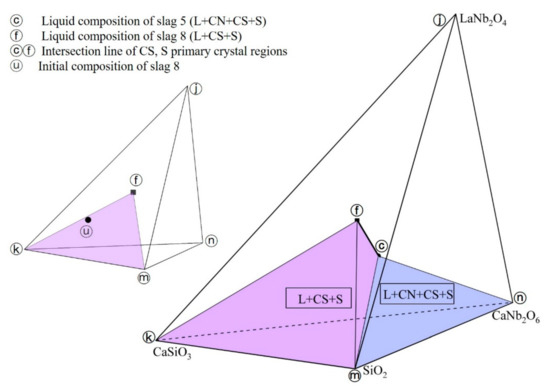
Figure 7.
Intersection line of CS, S primary crystal regions.
Bases on the above research results, the 1200 °C isothermal phase diagram of CaO-SiO2-La2O3-Nb2O5 system in reducing atmosphere was constructed, as shown in Figure 8. The ⓐ–ⓒ, ⓒ–ⓔ, ⓒⓕ, ⓐⓖ curves are not only the intersection lines of primary crystal regions mentioned above, but also the liquidus lines at 1200 °C, which divide the phase diagram into L+CN+CS+LN (ⓐⓚⓝⓙ tetrahedron region), L+CN+CS+S (ⓒⓚⓜⓝ tetrahedron region), L+CN+CS (ⓐⓑⓒⓚⓝ region), L+CN+S (ⓒⓓⓔⓜⓝ region), L+CS+S (ⓕⓚⓜⓒ tetrahedron region) and L+CN+LN (ⓐⓖⓝⓙ tetrahedron region) equilibrium phase regions. Meanwhile, based on these liquidus lines, the liquidus surface could be plotted in the phase diagram, and the area enclosed by the liquidus surface was the low melting point region of the CaO-SiO2-La2O3-Nb2O5 system.
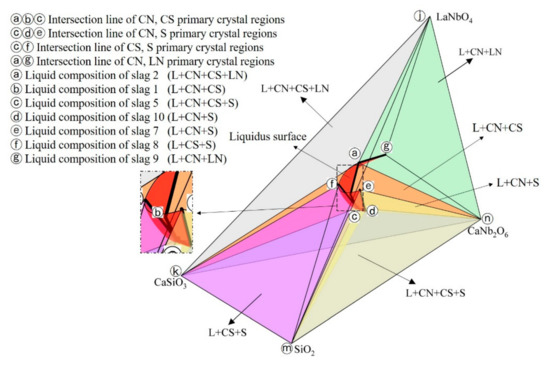
Figure 8.
Isothermal phase diagram of CaO-SiO2-La2O3-Nb2O5 system in reducing atmosphere at 1200 °C.
Obviously, the isothermal phase diagram of CaO-SiO2-La2O3-Nb2O5 system could provide guidance for the niobium and lanthanum extraction process of the Bayan Obo tailing. For example, the enrichment of niobium in CN phase and the enrichment of lanthanum in liquid phase could be realized by controlling the tailing composition in the L+CN+S equilibrium phase region, while the enrichment of niobium and lanthanum in liquid phase could be realized by controlling the tailing composition in the L+CS+S equilibrium phase region.
3.3. Practice Relevance of the Results
The current research results can provide guidance for the niobium and lanthanum extraction process of the Bayan Obo tailing. When the extraction process is conducted at 1200 °C in reducing atmosphere, the enrichment of niobium and lanthanum in specific phases can be realized by controlling the tailing composition in a specific equilibrium phase region. For example, the enrichment of niobium in CN phase and the enrichment of lanthanum in liquid phase can be realized by controlling the tailing composition in the L+CN+S equilibrium phase region, while the enrichment of niobium and lanthanum in liquid phase can be realized by controlling the tailing composition in the L+CS+S equilibrium phase region.
4. Conclusions
In the present work, the equilibrium phases of slags located in specific region of CaO-SiO2-La2O3-Nb2O5 system were ascertained at 1200 °C in reducing atmosphere through high temperature equilibrium experiment followed by scanning electron microscope and energy dispersive spectrometer (SEM-EDS). According to the experiment results, the phase equilibria of CaO-SiO2-La2O3-Nb2O5 system were determined. Finally, the 1200 °C isothermal phase diagram of CaO-SiO2-La2O3-Nb2O5 system in reducing atmosphere was constructed, in which the L+CN+CS+S, L+CN+CS+LN, L+CS+S, L+CN+LN, L+CN+CS, L+CN+S equilibrium phase regions were divided.
Author Contributions
Funding acquisition, L.S. and M.J.; Methodology, L.S.; Project administration, L.S. and M.J.; Writing—review & editing, L.S.; Data curation, Z.L.; Formal analysis, Z.L.; Software, Z.L.; Writing—original draft, Z.L.; Supervision, M.J. All authors have read and agreed to the published version of the manuscript.
Funding
This work was financially supported by the National Natural Science Foundation of China (NSFC, No. 51874082, No. 52174383) and the National Key R&D Program of China (Grant No.2021YFC2901200).
Institutional Review Board Statement
Not applicable.
Informed Consent Statement
Not applicable.
Conflicts of Interest
The authors declare no conflict of interest.
References
- Guo, C.S.; Li, M.; Liu, Z.G.; Zhang, D.L.; Gao, K. Present status and new ideas on utilization of Bayan Obo rare earth and niobium resource. Chin. Rare Earths 2014, 35, 96–100. [Google Scholar] [CrossRef]
- Wang, S.H.; Yang, Z.F.; Wang, Z.J. Study on niobium and rare earth occurrence state in Bayan Obo tailings. Nonferrous Met. Eng. 2019, 9, 60–66. [Google Scholar] [CrossRef]
- Liu, Y.B.; Wang, J.S.; Zhang, X.H.; Zhao, E.X.; Xue, Q.G.; She, X.F. Selective reduction of Baotou Nb-bearing iron ore concentrate. Iron Steel 2016, 51, 22–27. [Google Scholar] [CrossRef]
- Jiang, Y.J.; Zhao, Z.W.; Dong, X.M.; An, W.H. Rare earth enrichment from iron concentrates of main and east orebodies of Bayan Obo by direct reduction and melting separation method. Chin. Rare Earths 2015, 35, 54–58. [Google Scholar] [CrossRef]
- Qu, S.G.; Mao, Y.J.; Zhong, X. Smelting Nb-Fe alloy from low and medium grade niobium concentrate by two-stage electric furnace process. Kuangye Gongcheng 1997, 17, 46–49. [Google Scholar]
- Fang, J.; Wang, Z.R.; Zhang, J.Y.; Zhang, Y.G.; Huang, Y.H.; Li, X.G. Experiment research on smelting of Baotou niobium ore with high iron content. J. Northeast. Univ. Nat. Sci. 1996, 17, 35–40. [Google Scholar]
- Qiu, J.Y.; Liu, C.J. Solid phase equilibrium relations in the CaO-SiO2-Nb2O5-La2O3 system at 1273 K. Metall. Mater. Trans. B 2018, 49, 69–77. [Google Scholar] [CrossRef]
- Qiu, J.Y.; Liu, C.J. Subsolidus phase relations in the CaO–SiO2–Nb2O5–La2O3 quarternary system at 1273 K. ISIJ Int. 2017, 57, 2107–2114. [Google Scholar] [CrossRef] [Green Version]
- Liu, C.J.; Qiu, J.Y.; Sun, L.F. Liquidus and phase equilibrium in CaO-SiO2-Nb2O5-10% La2O3 system. ISIJ Int. 2018, 58, 612–619. [Google Scholar] [CrossRef] [Green Version]
- Qiu, J.Y.; Liu, C.J.; Liu, Z.Y. Phase equilibria in medium basicity region of CaO-SiO2-Nb2O5-(5%, 10%, 15%) La2O3 system. Ceram. Int. 2019, 45, 2281–2288. [Google Scholar] [CrossRef]
- Qiu, J.Y.; Liu, C.J.; Liu, Z.Y.; Yu, Z. Phase equilibria in low basicity region of CaO-SiO2-Nb2O5-(5 wt%, 10 wt%, 15 wt%) La2O3 system. J. Rare Earths 2020, 38, 100–107. [Google Scholar] [CrossRef]
- Qiu, J.Y.; Liu, C.J.; Liu, Z.Y.; Zhu, D.Y.; Wang, Y.G. Phase equilibria in the system CaO–SiO2–Nb2O5–La2O3 at 1473 K with pO2=10−15.47 atm. Ceram. Int. 2020, 46, 7711–7718. [Google Scholar] [CrossRef]
- Qiu, J.Y.; Liu, C.J.; Liu, Z.Y.; Zhu, D.Y. Liquidus Phase Diagram of CaO-SiO2-La2O3-Nb2O5 system with w(La2O3) = 15 to 25 pct. Metall. Mater. Trans. B 2020, 51, 1190–1200. [Google Scholar] [CrossRef]
- Liu, C.J.; Qiu, J.Y.; Liu, Z.Y. Phase Equilibria in the System CaO-SiO2-La2O3-Nb2O5 at 1400 °C. Metals 2021, 11, 1892. [Google Scholar] [CrossRef]
- Shi, J.J.; Sun, L.F.; Qiu, J.Y.; Jiang, M.F. Phase equilibria of CaO-SiO2-5wt.%MgO-30 wt.%Al2O3-TiO2 system at 1400 °C and 1450 °C relevant to high Al2O3 Ti-bearing blast furnace slag system. J. Alloys Compd. 2017, 722, 25–32. [Google Scholar] [CrossRef]
- Le, T.H.; Malfliet, A.; Blanpain, B.; Guo, M.X. Phase Relations of the CaO-SiO2-Nd2O3 system and the implication for rare earths recycling. Metall. Mater. Trans. B 2016, 47, 1736–1744. [Google Scholar] [CrossRef]
- Kimura, H.; Endo, S.; Yajima, K.; Tsukihashi, F. Effect of oxygen partial pressure on liquidus for the CaO-SiO2-FeOx system at 1573 K. ISIJ Int. 2004, 44, 2040–2045. [Google Scholar] [CrossRef] [Green Version]
- Tian, Y.W.; Zhai, X.J.; Liu, K.R. A Concise Course of Metallurgical Physical Chemistry, 1st ed.; Chemical Industry Press: Beijing, China, 2007; p. 99. [Google Scholar]
- Hillert, M.; Sundman, B.; Wang, X.Z. An Assessment of the CaO-SiO2 System. Metall. Mater. Trans. B 1990, 21, 303–312. [Google Scholar] [CrossRef]
- Bozena, P.; Aleksandra, J.P.; Irena, S. Phase equilibria in the CaO–Nb2O5 system up to 1600 °C: New experimental results. Ceram. Int. 2019, 45, 1562–1568. [Google Scholar]
- Jongejan, A.; Wilkins, A.L. Phase relationships in the high-lime part of the system CaO-Nb2O5-SiO2. J. Less-Common Met. 1969, 19, 203–208. [Google Scholar] [CrossRef]
- Bai, Z.M.; Deng, Y.X. Physical Chemistry of Silicates, 1st ed.; Chemical Industry Press: Beijing, China, 2018; pp. 71–72. [Google Scholar]
- Liu, J.J.; Zhou, Y.P.; Li, S.L.; Feng, X. Physical Chemistry, 6th ed.; Higher Education Press: Beijing, China, 2017; pp. 237–241. [Google Scholar]
Publisher’s Note: MDPI stays neutral with regard to jurisdictional claims in published maps and institutional affiliations. |
© 2022 by the authors. Licensee MDPI, Basel, Switzerland. This article is an open access article distributed under the terms and conditions of the Creative Commons Attribution (CC BY) license (https://creativecommons.org/licenses/by/4.0/).