
Effect of Quenching Parameters on Distortion Phenomena in AISI 4340 Steel


Abstract
:
1. Introduction
2. Materials and Methods
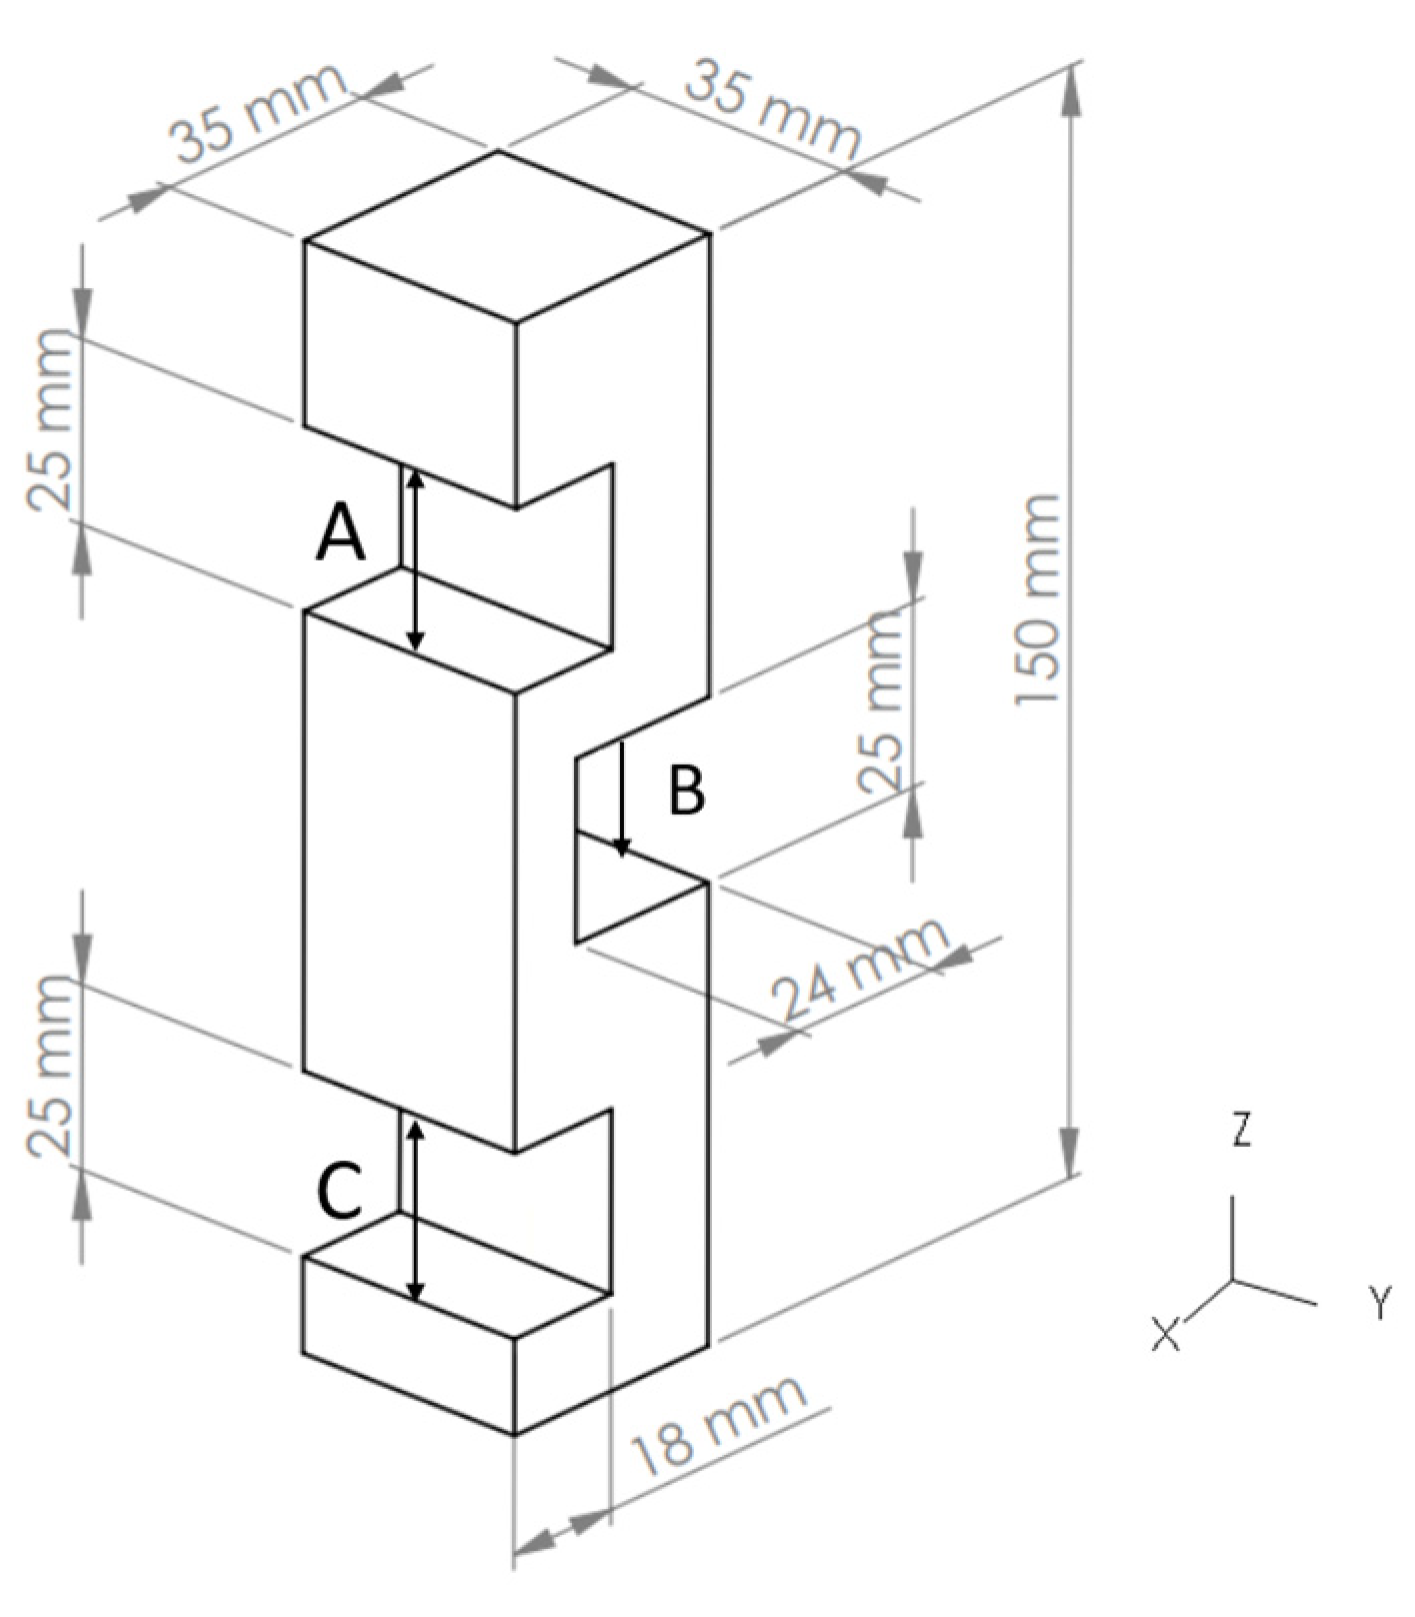
2.1. Materials and Experimentral Procedure
2.2. Heat Treatment Process
2.3. Microstructural Analysis
2.4. Hardness Evaluation
3. Modeling of the Quenching Process
3.1. Heat Transfer
3.2. Phase Transformation
3.3. Mechanical Interactions
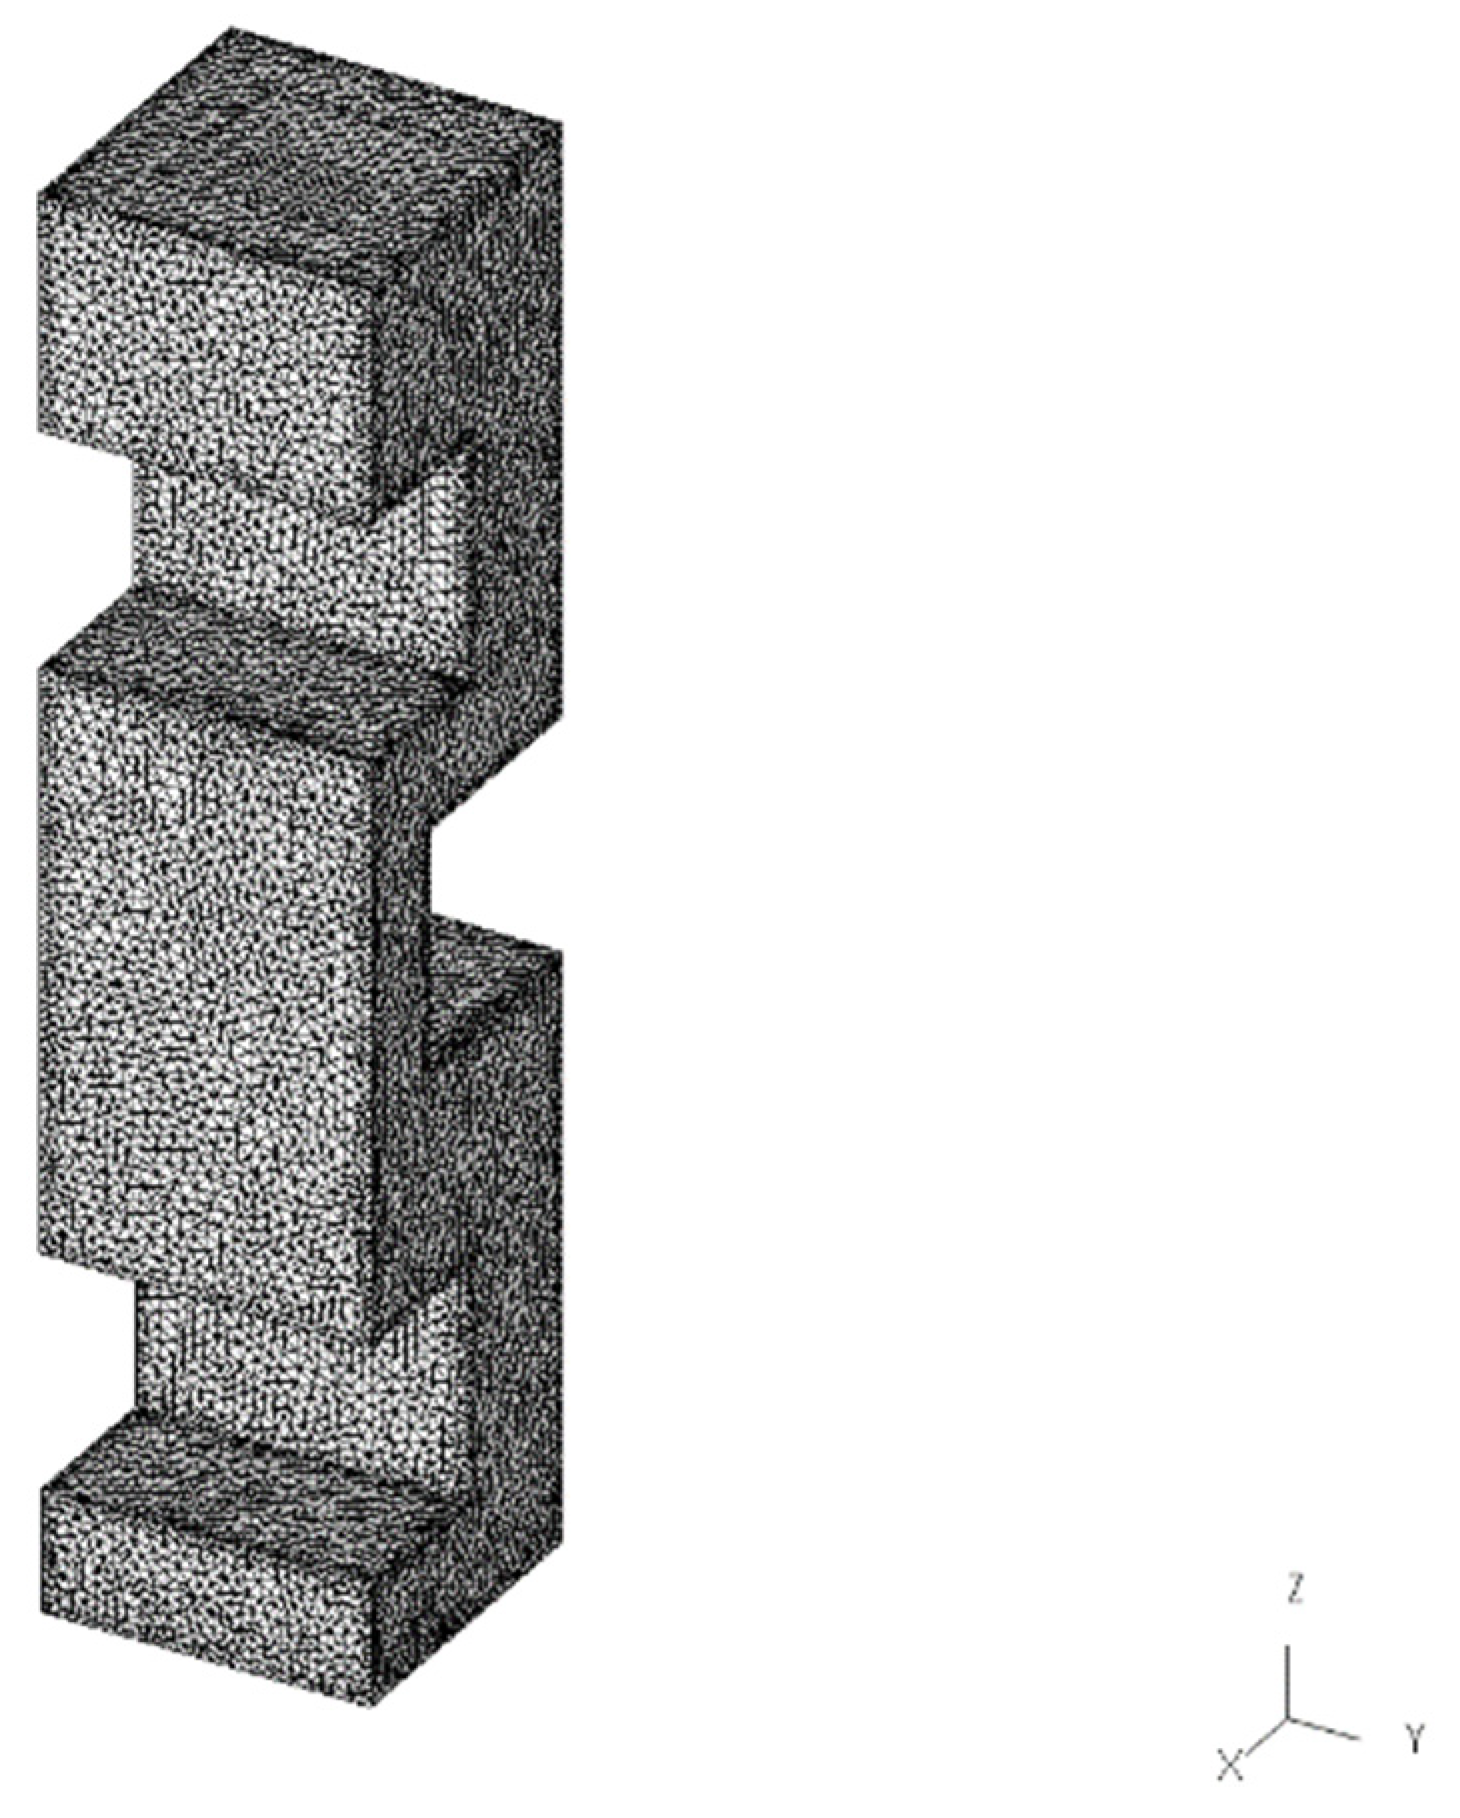
3.4. Finite Element Simulation Conditions
4. Results and Discussion
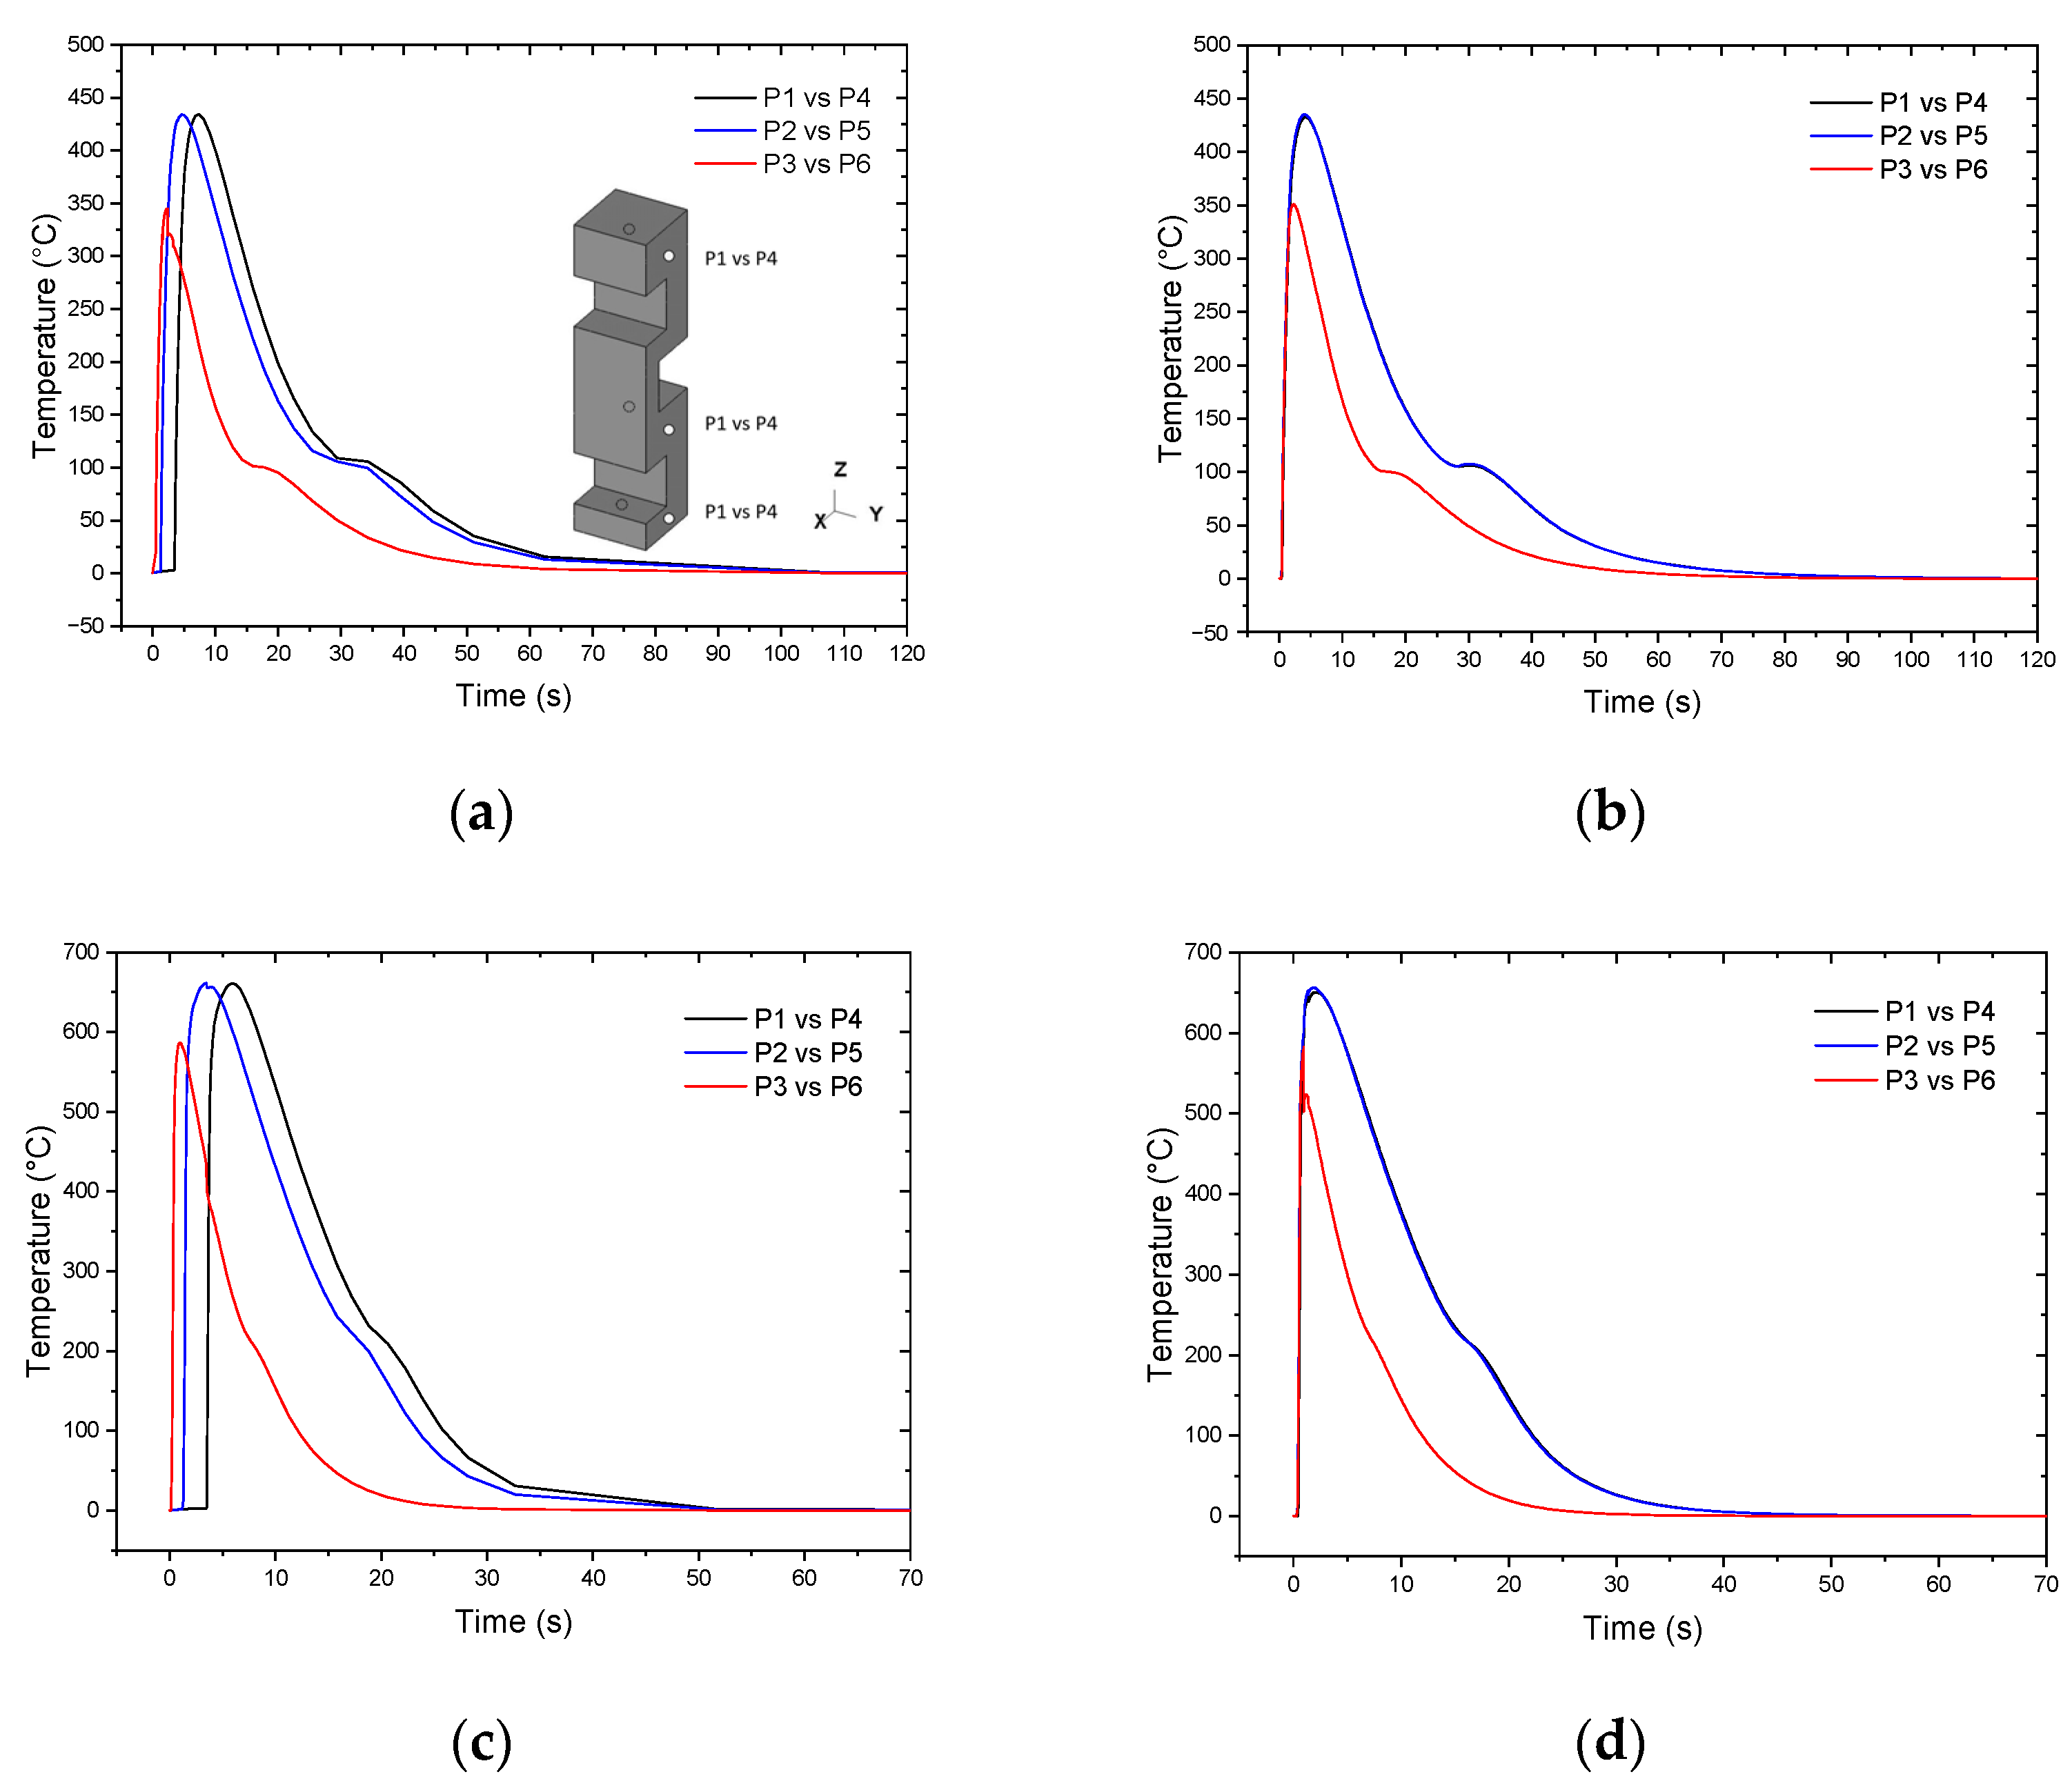
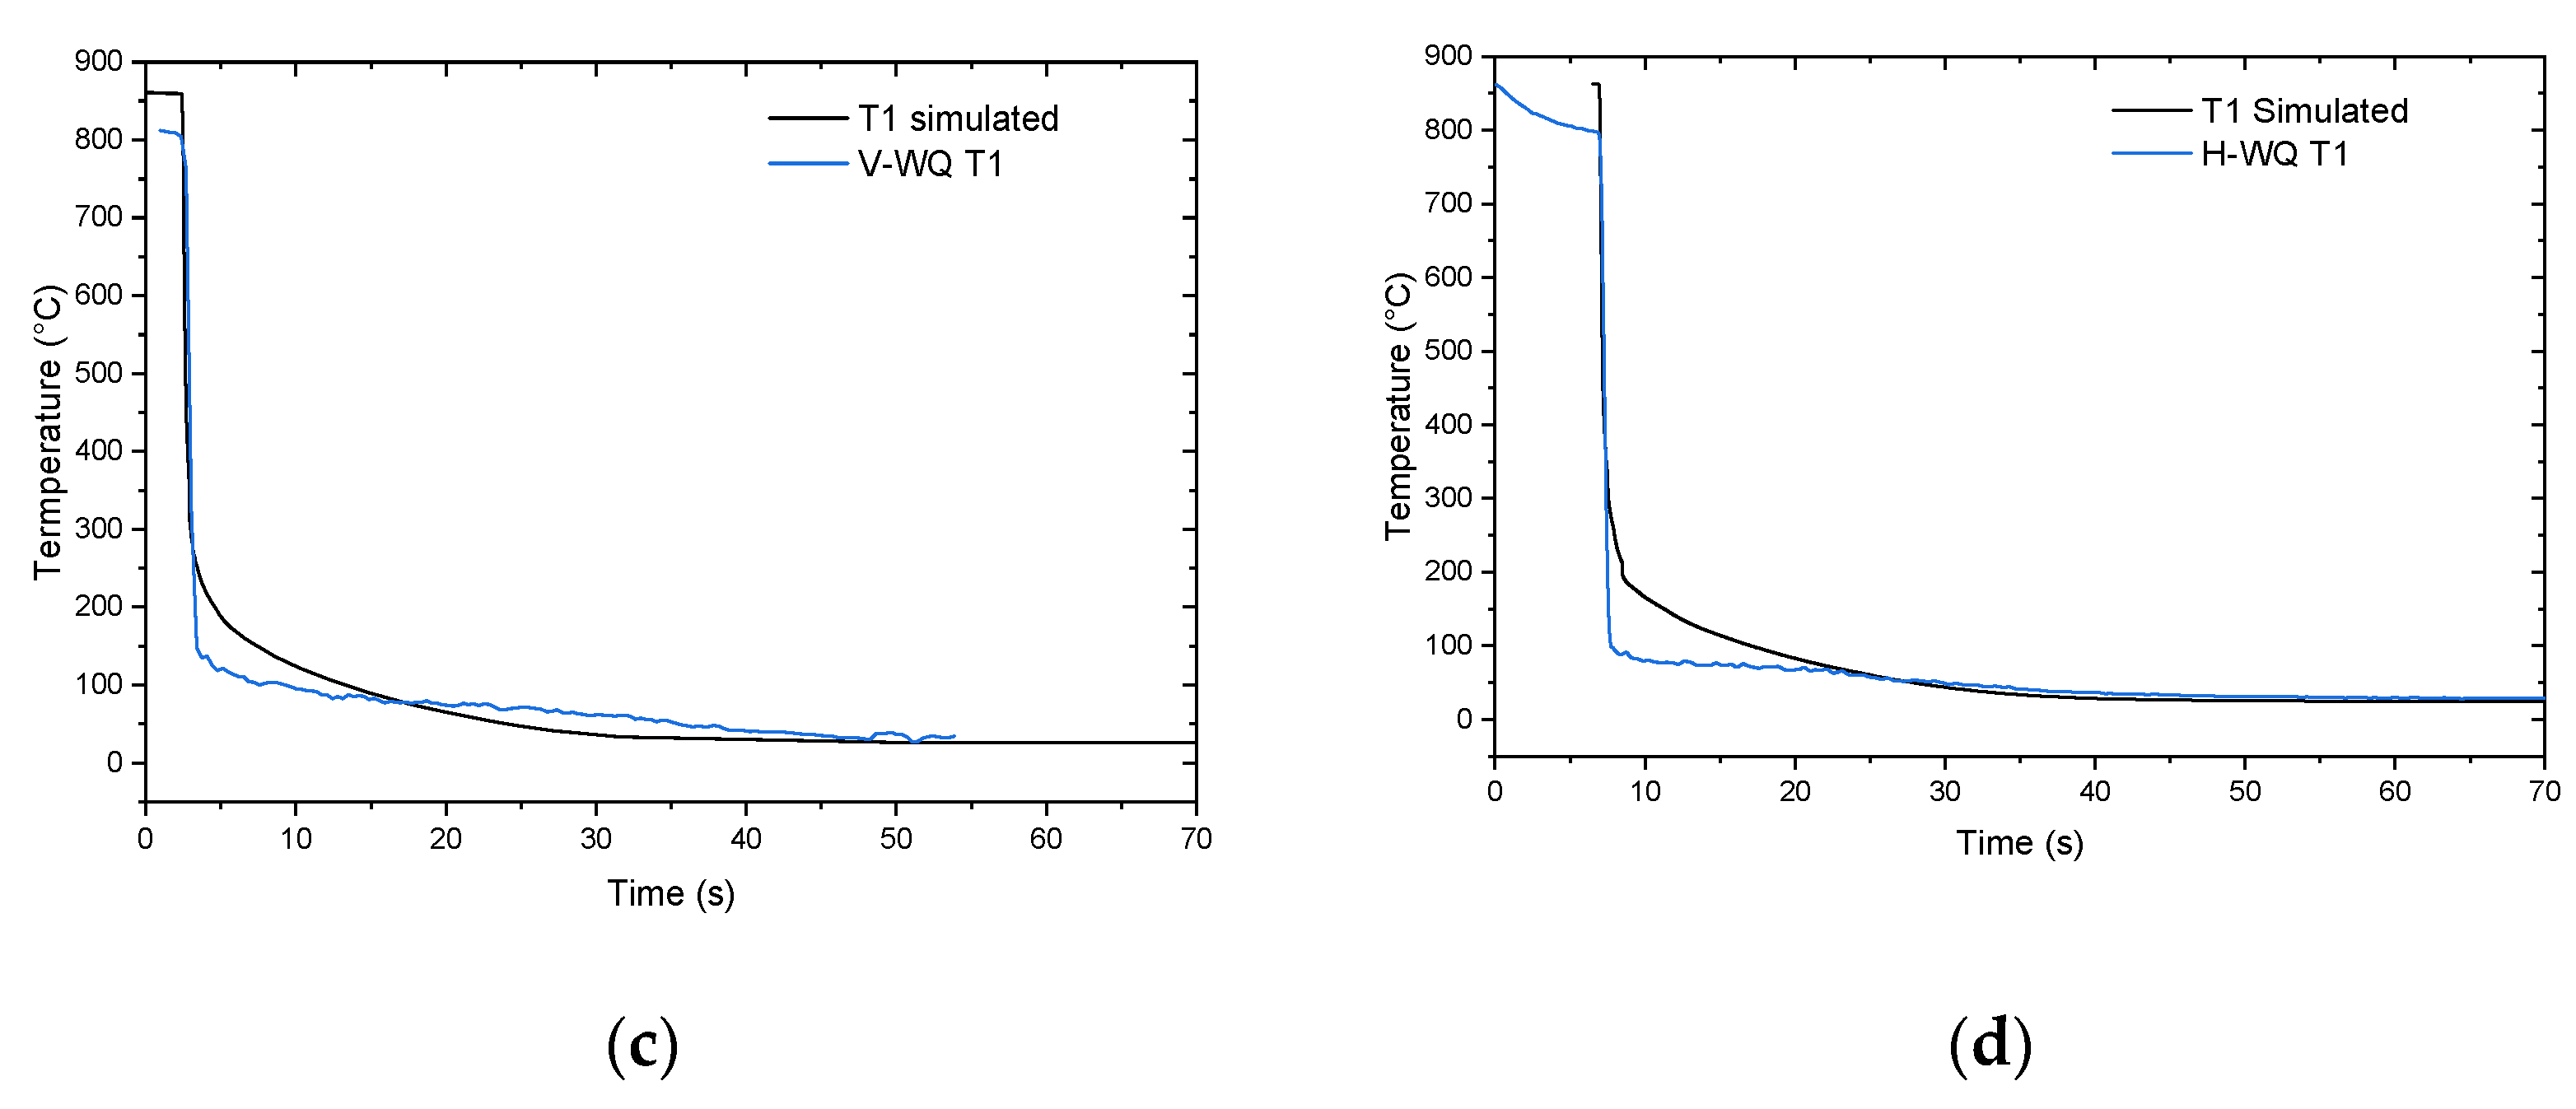
4.1. Thermal Analysis
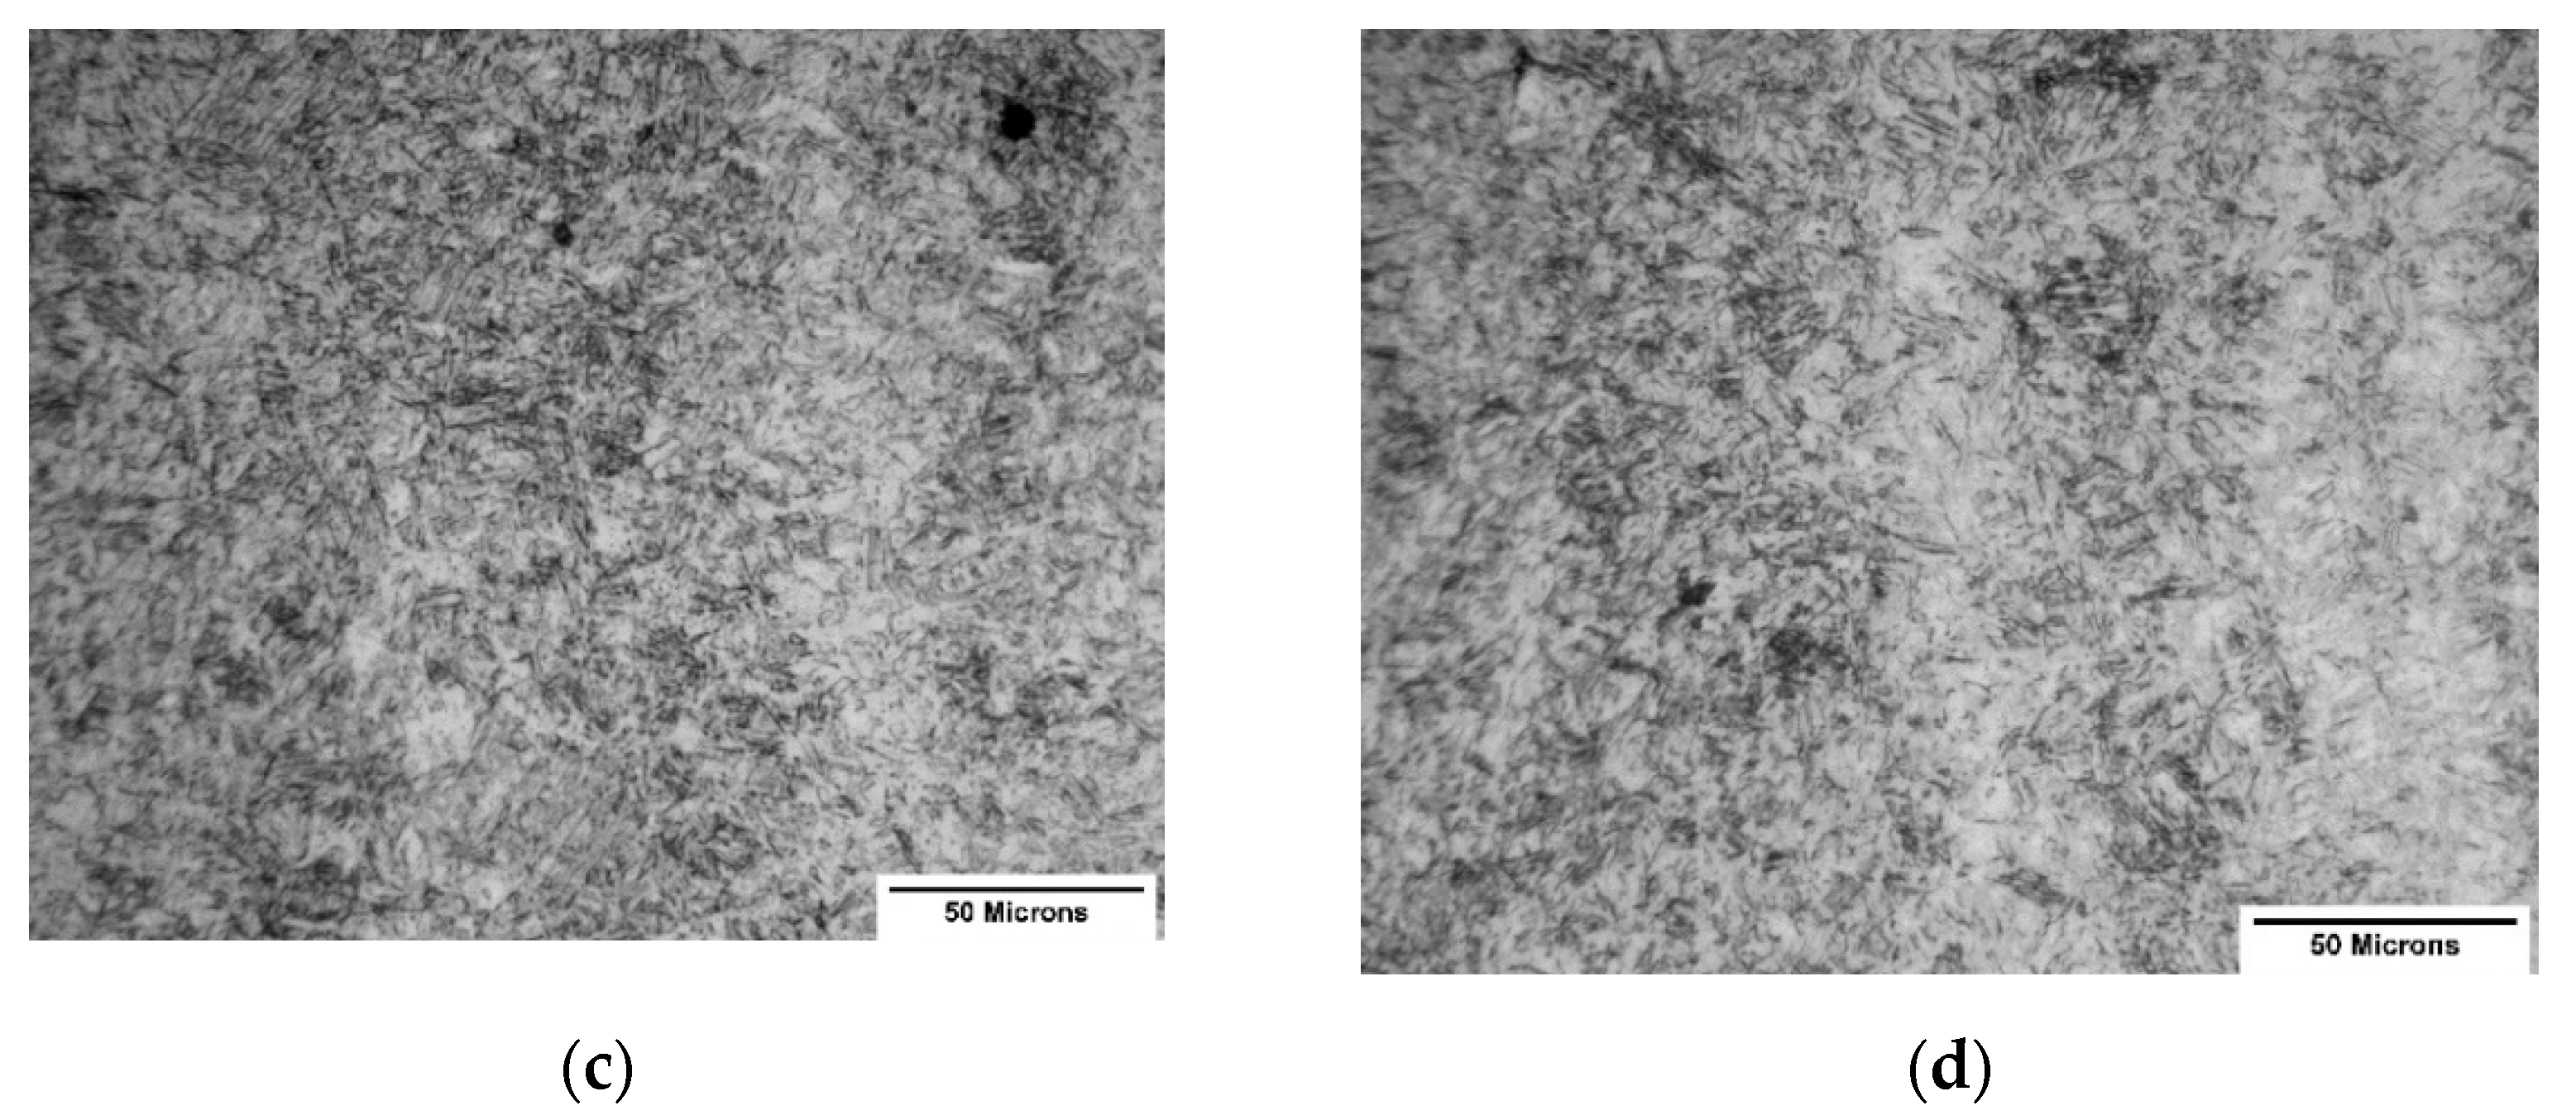
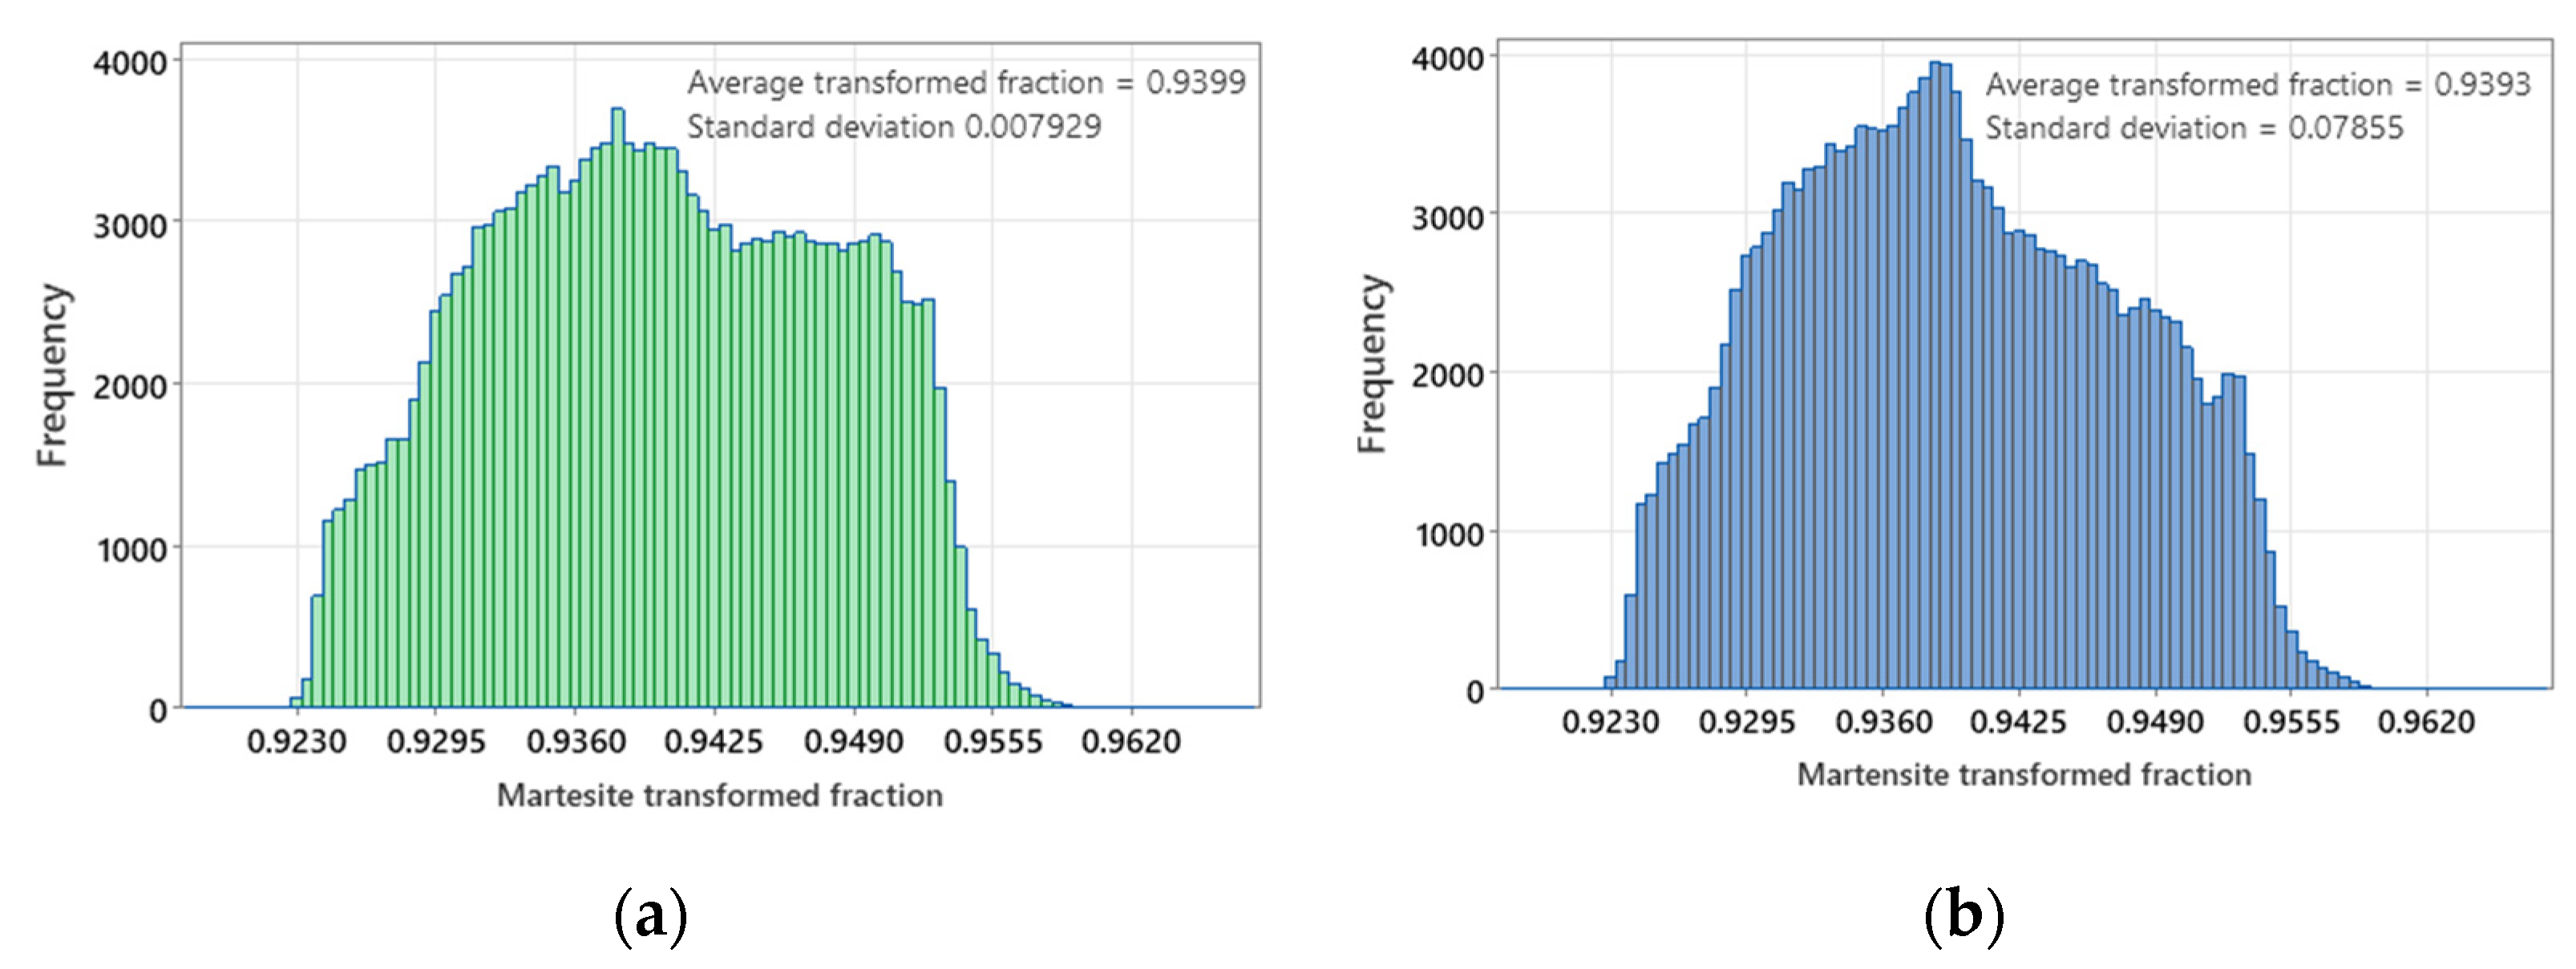
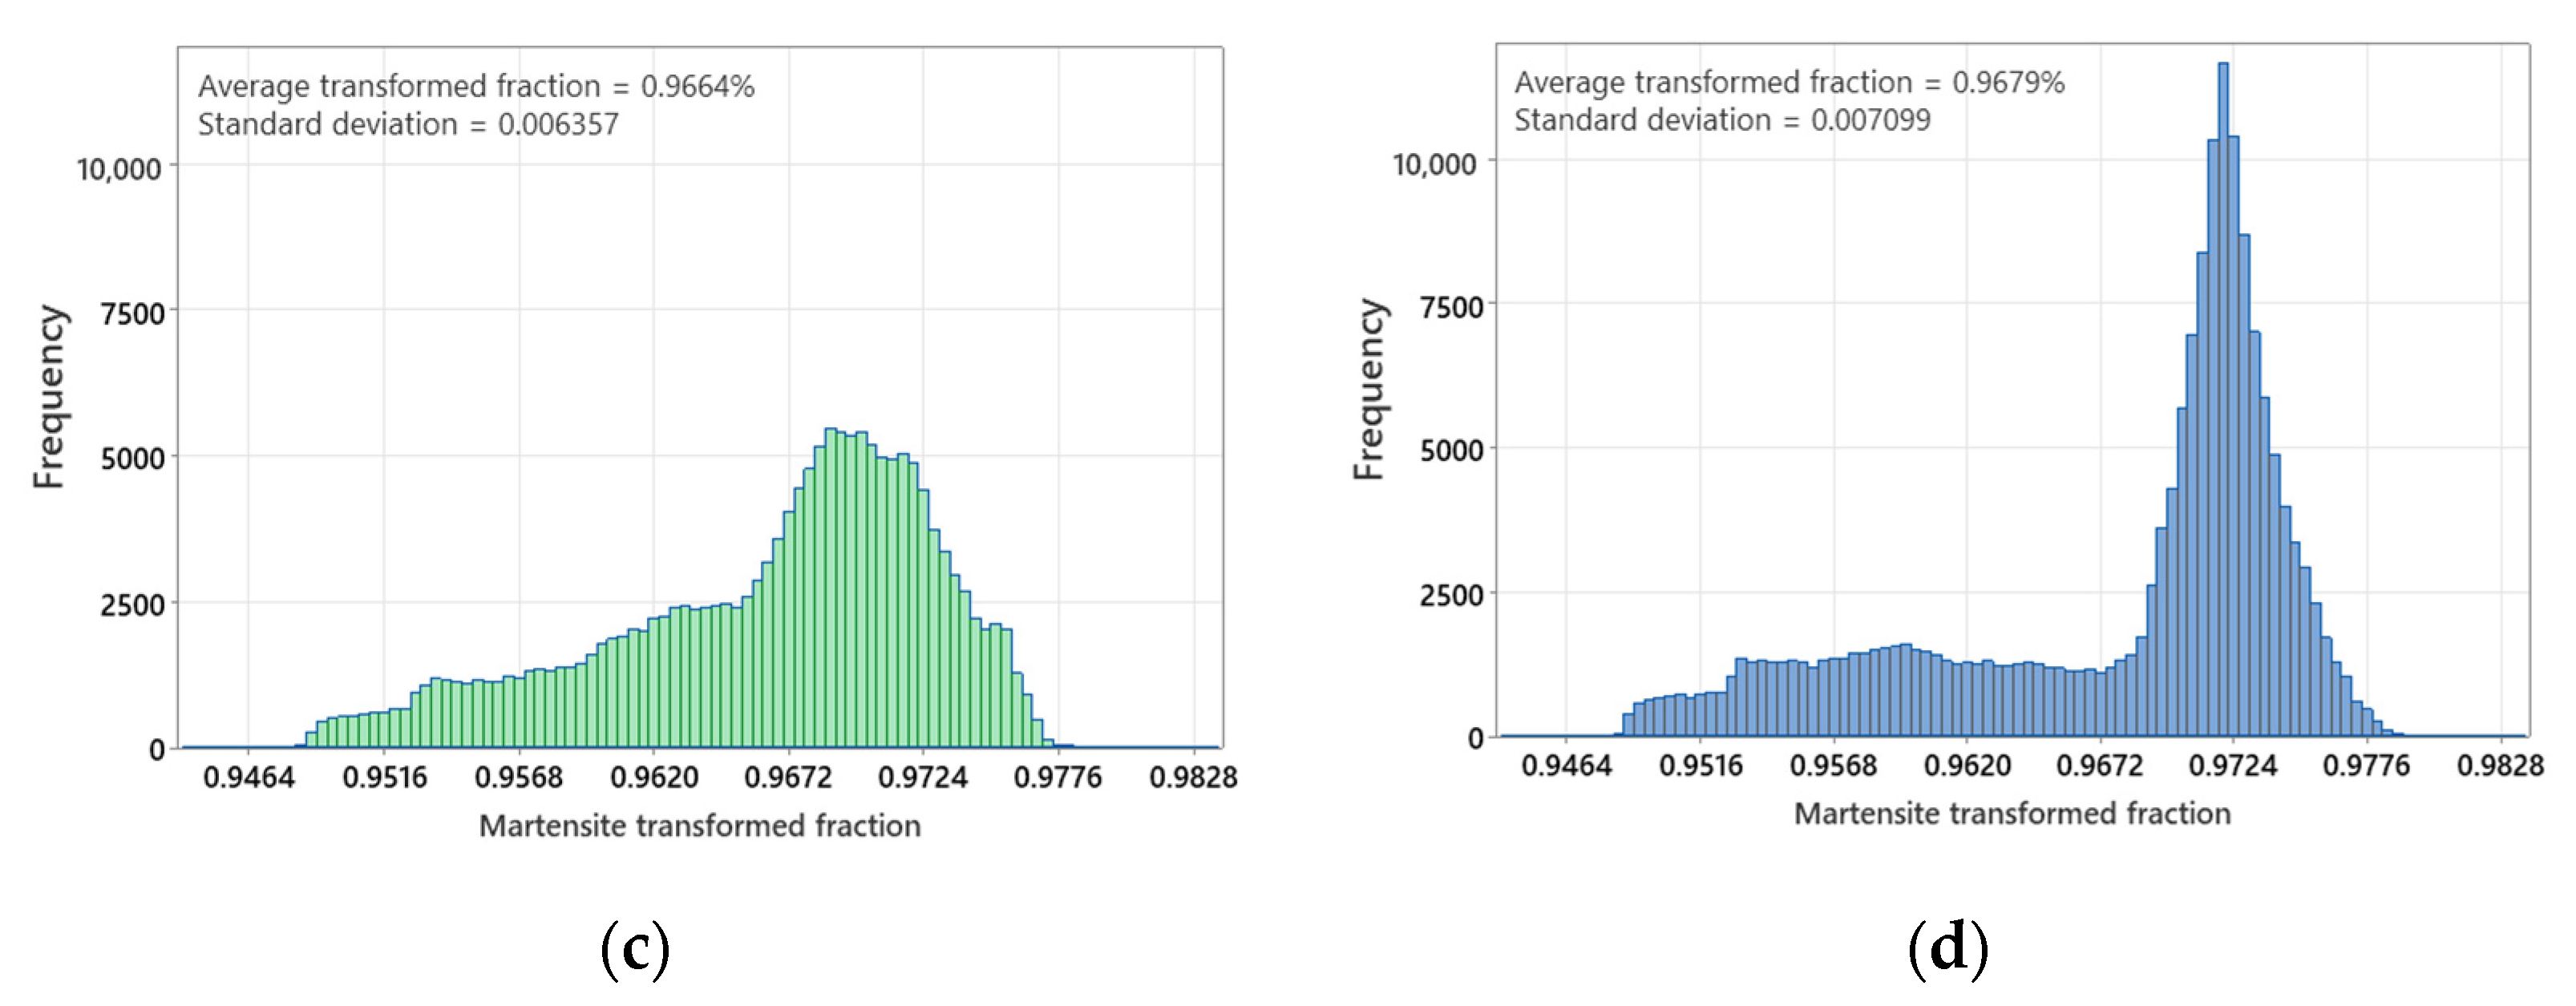
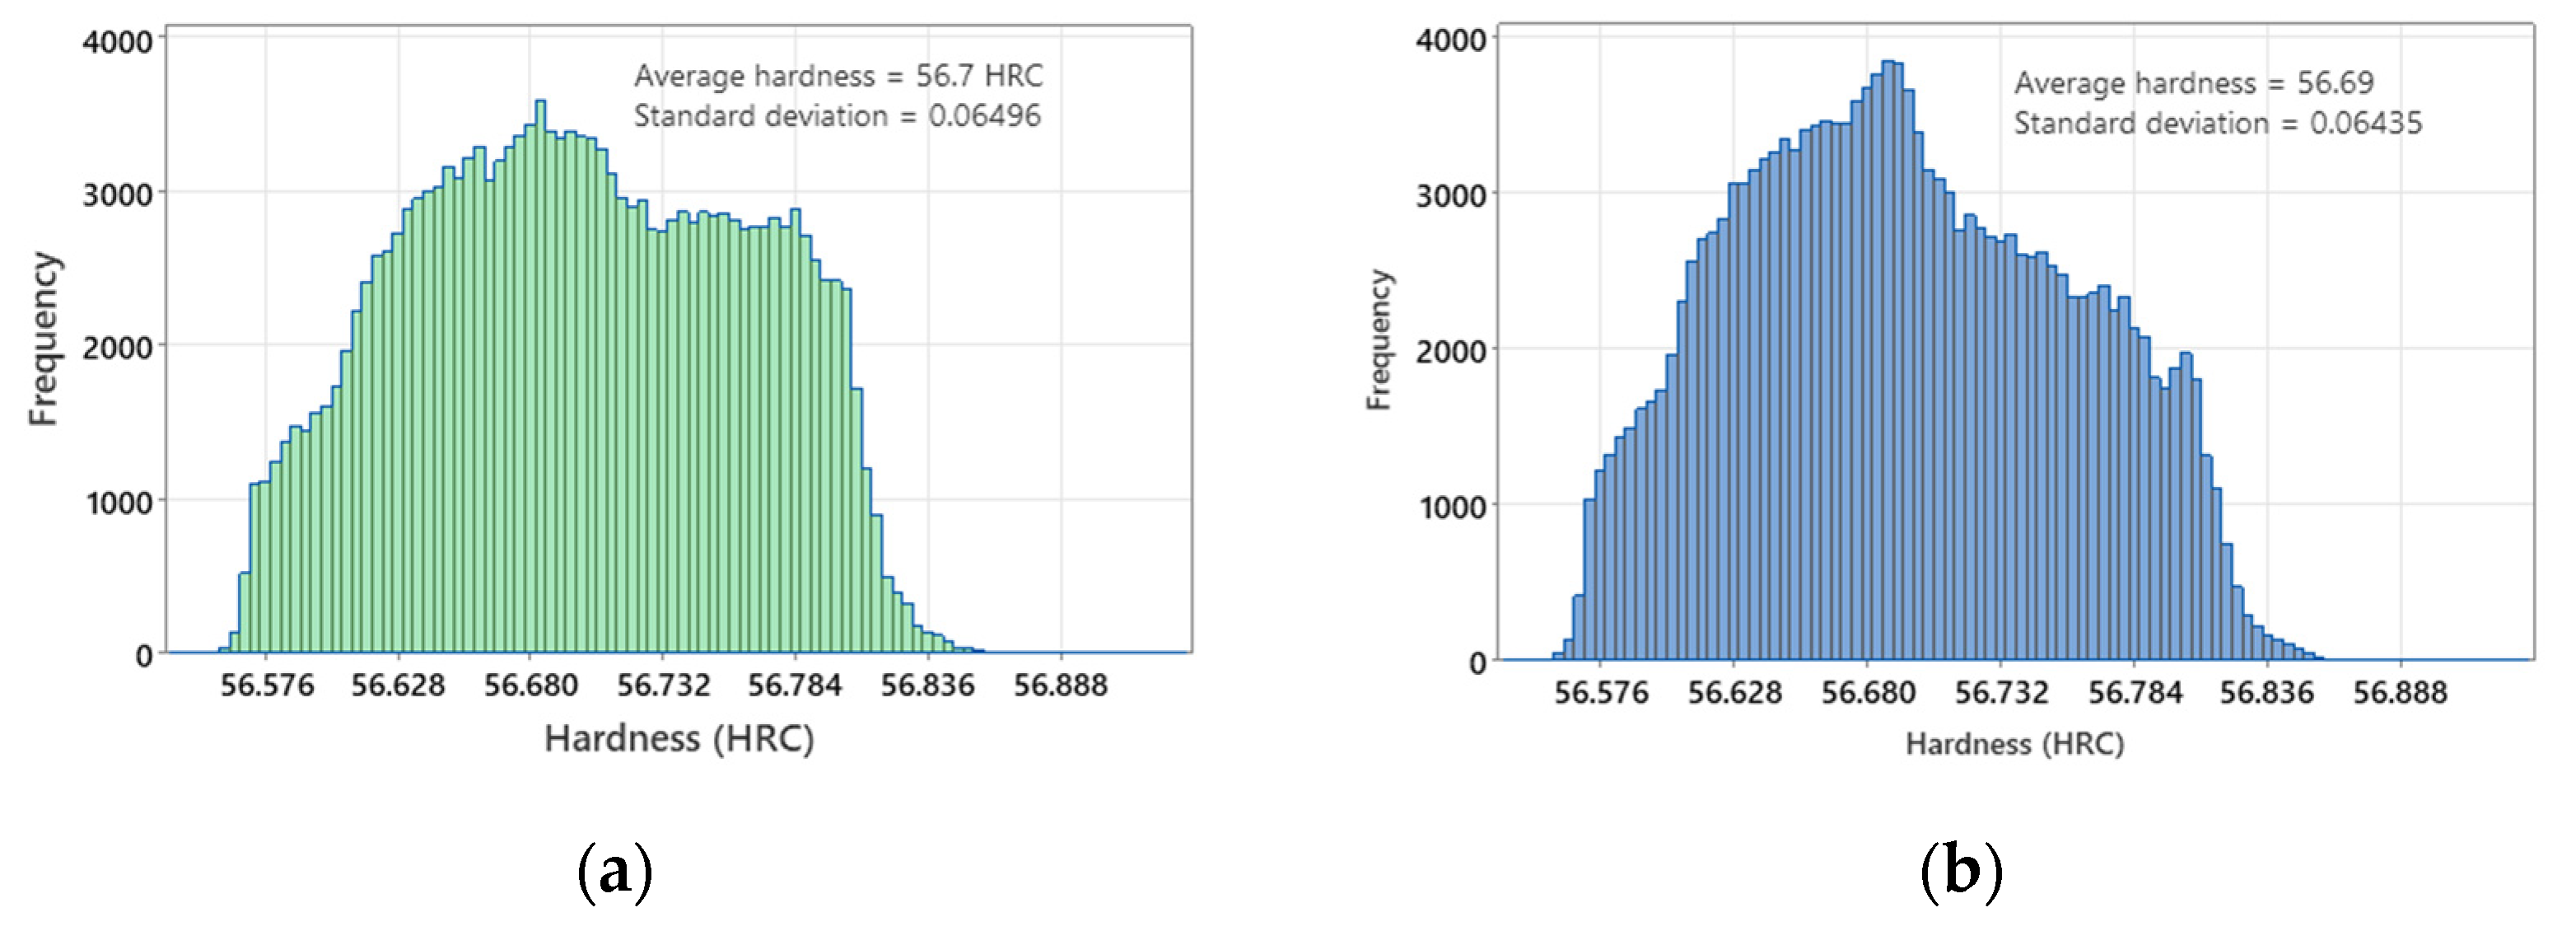
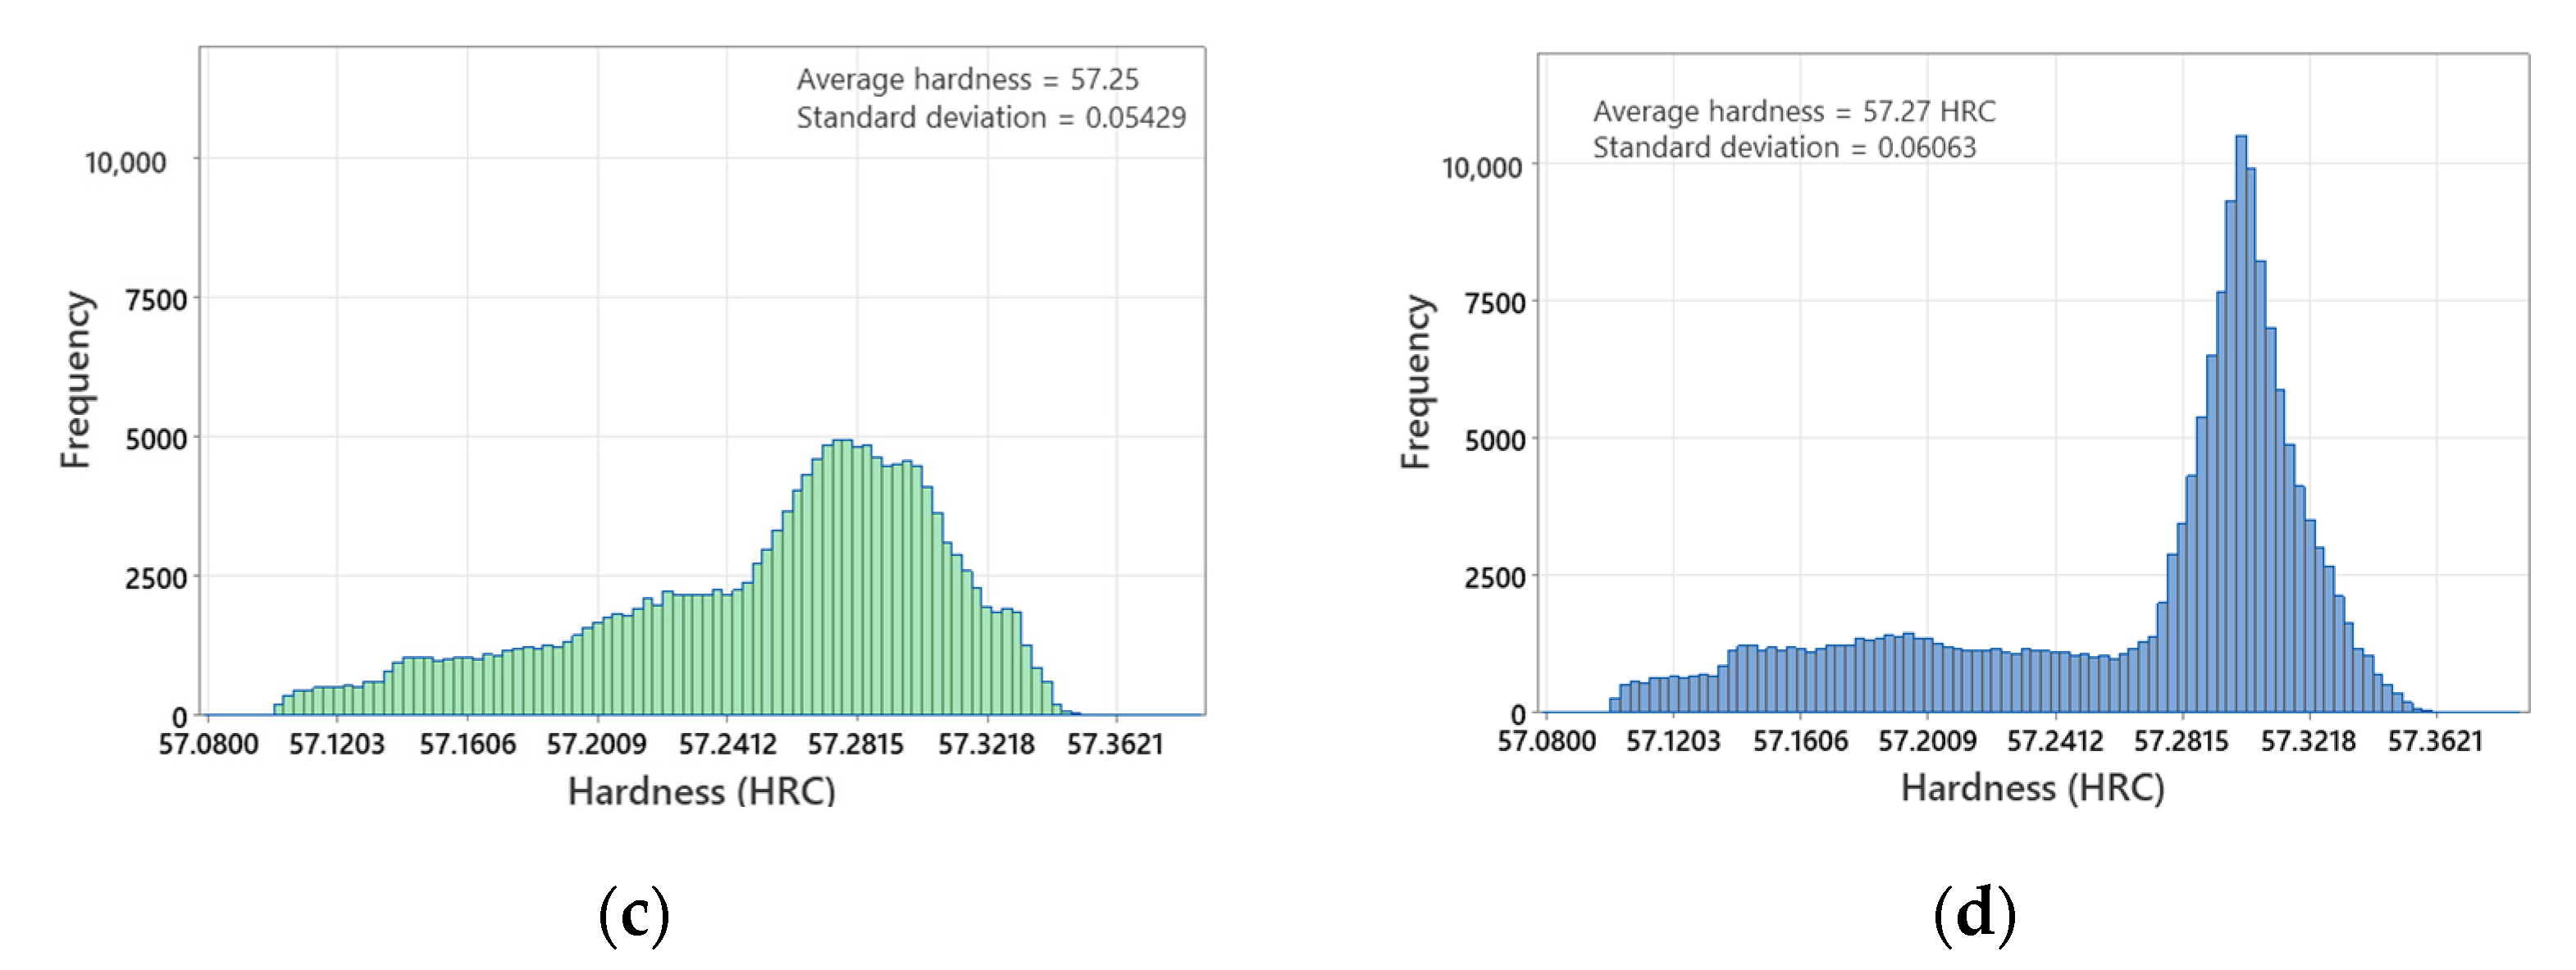
4.2. Microstructure and Hardness
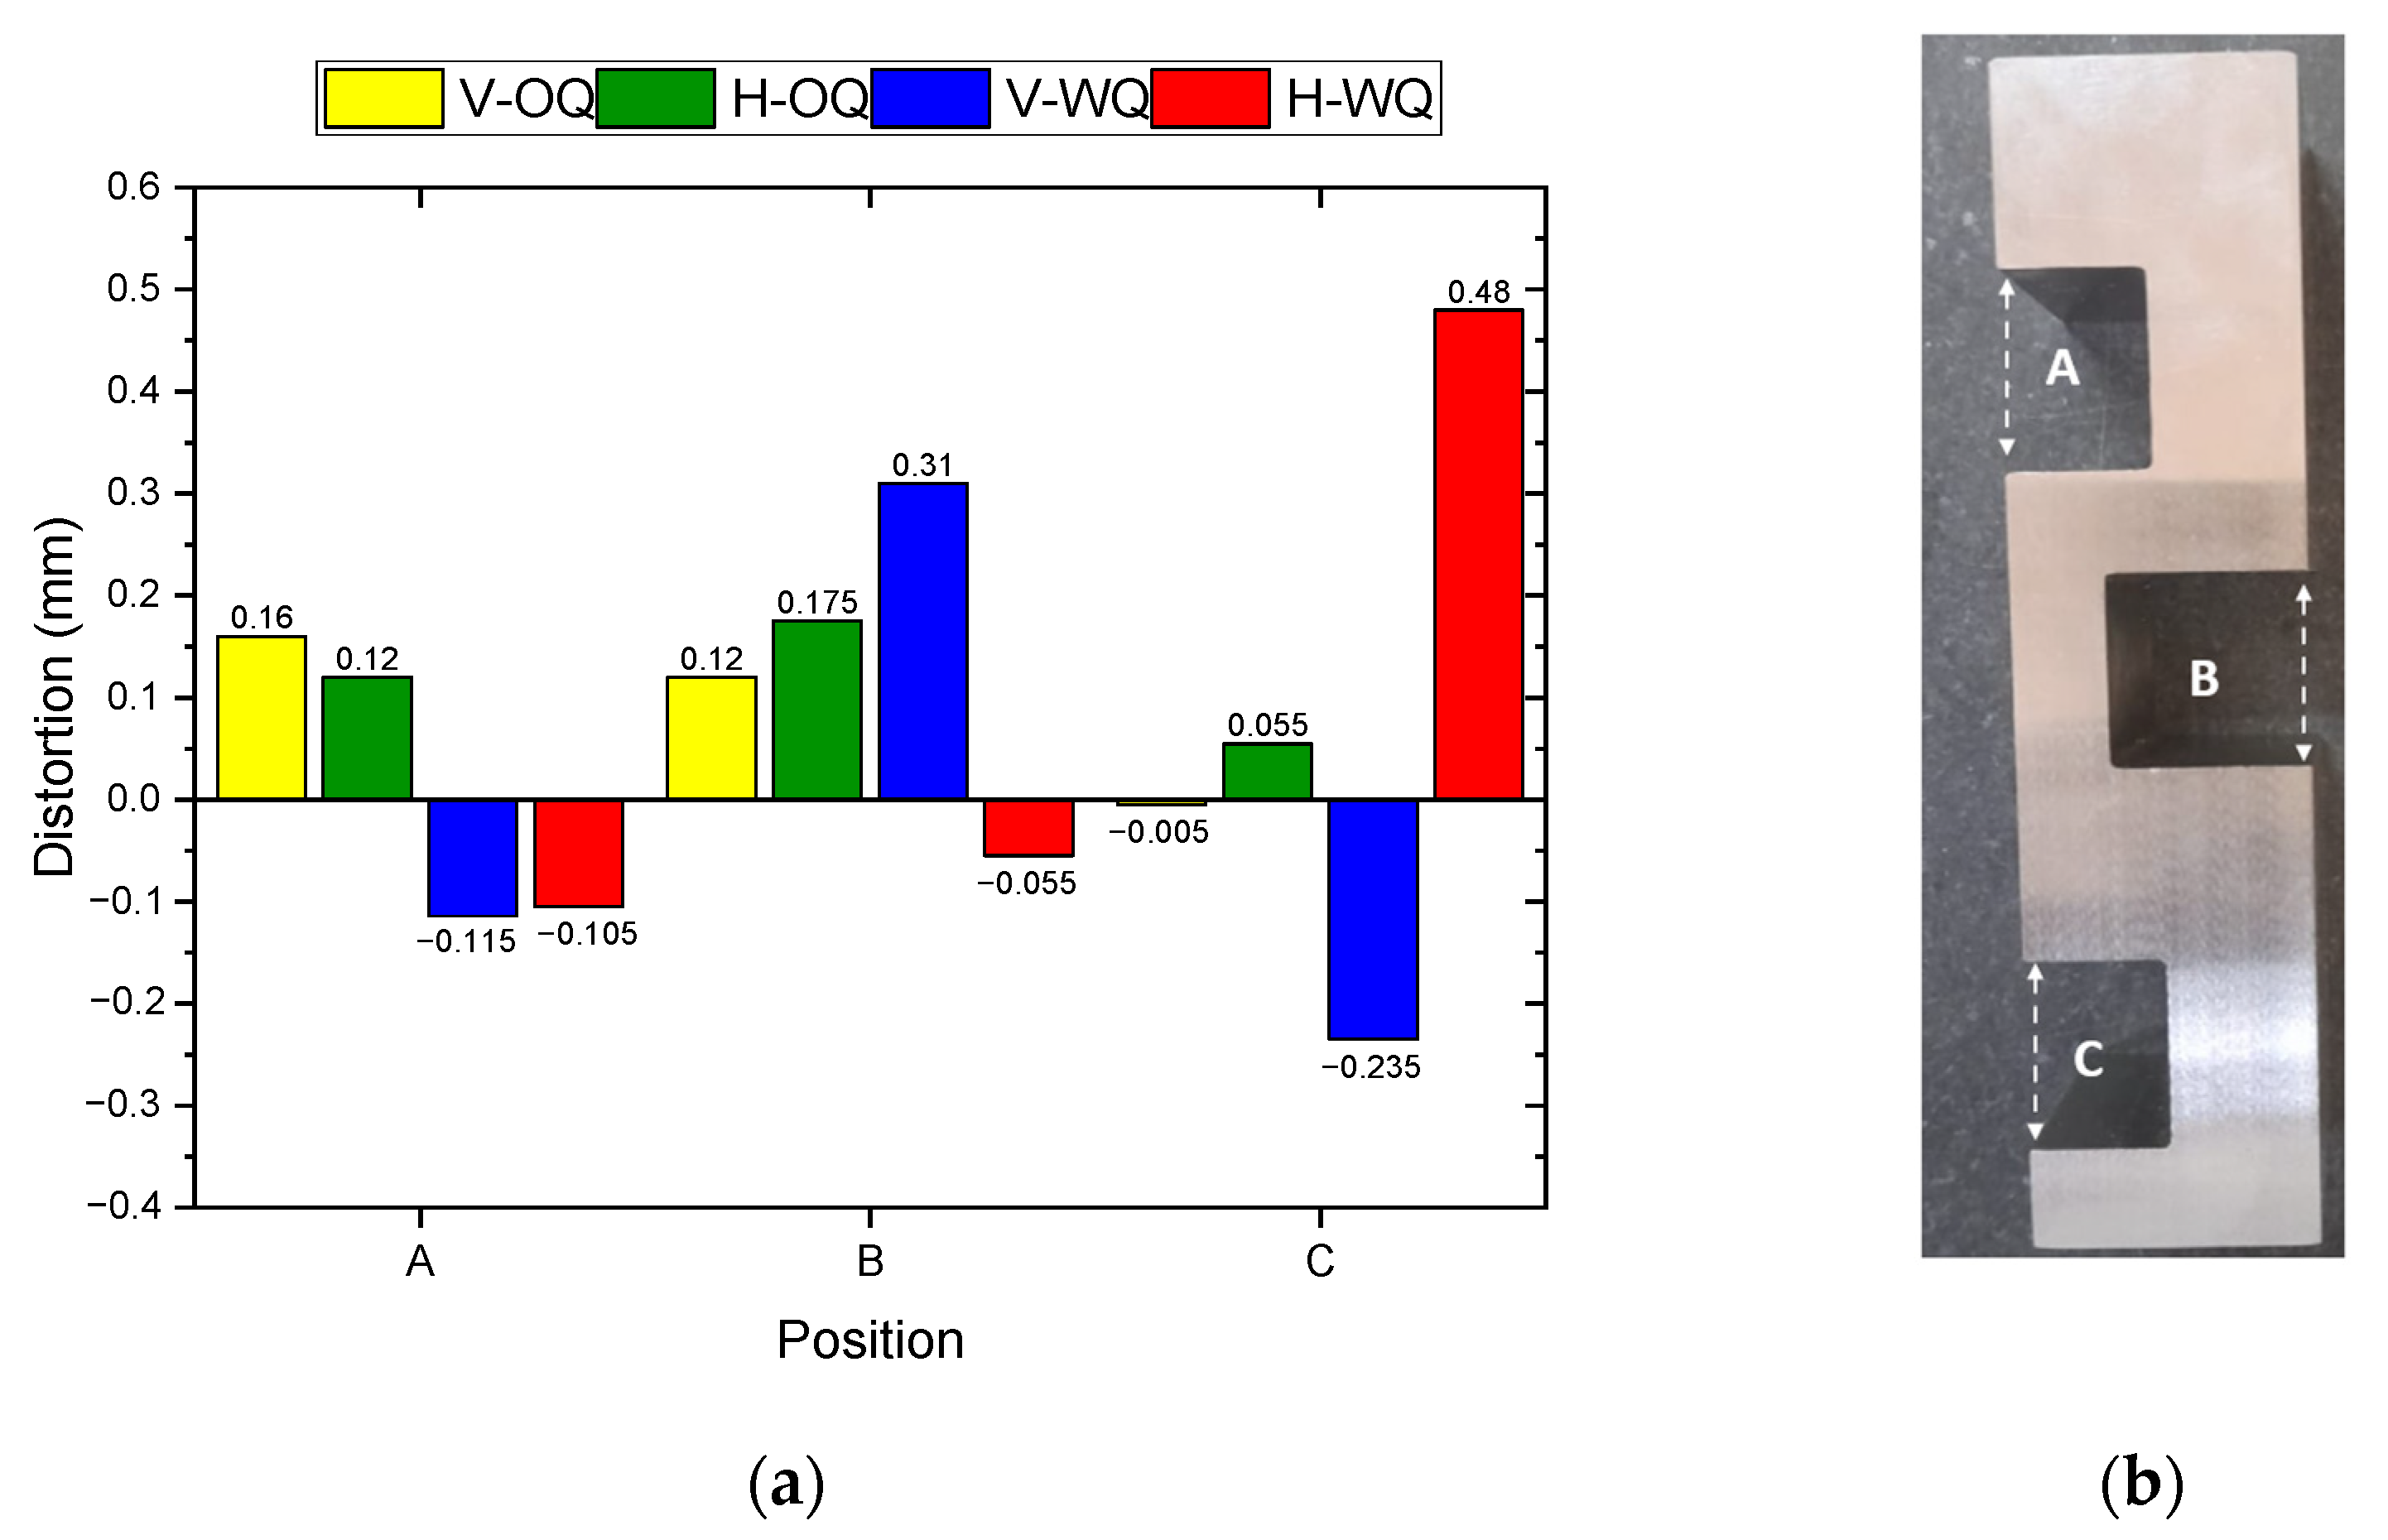
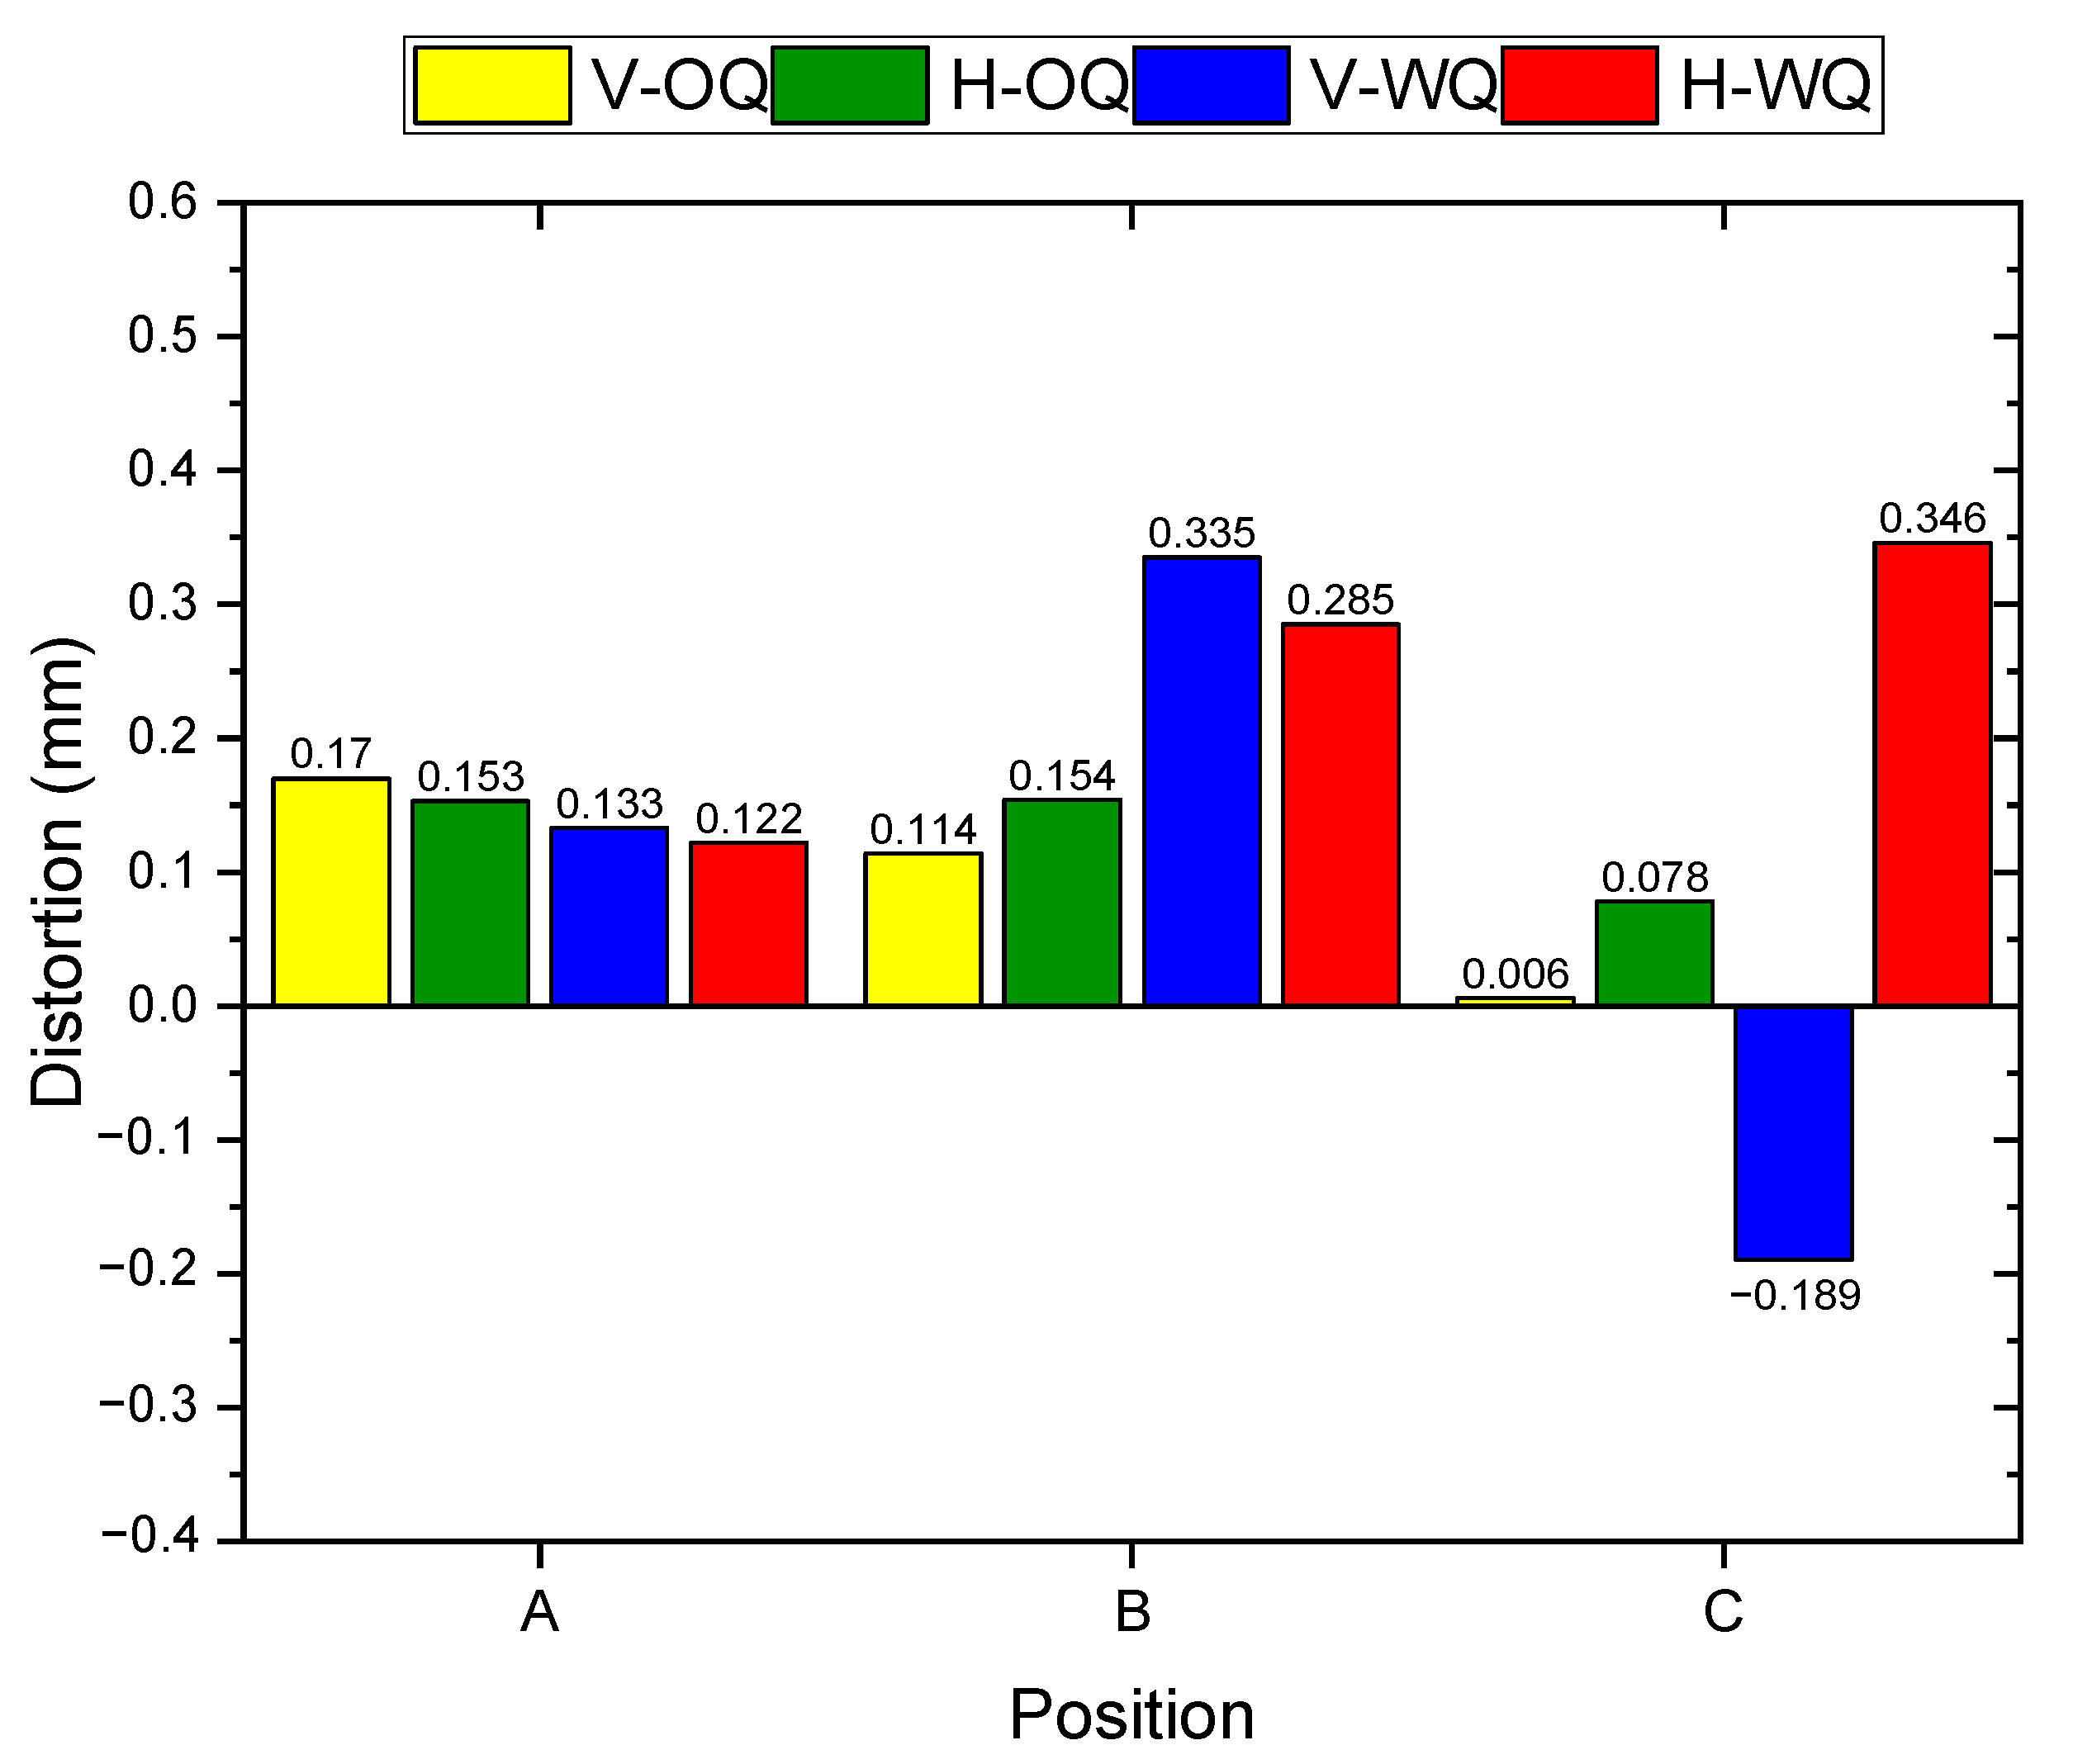
4.3. Distortion
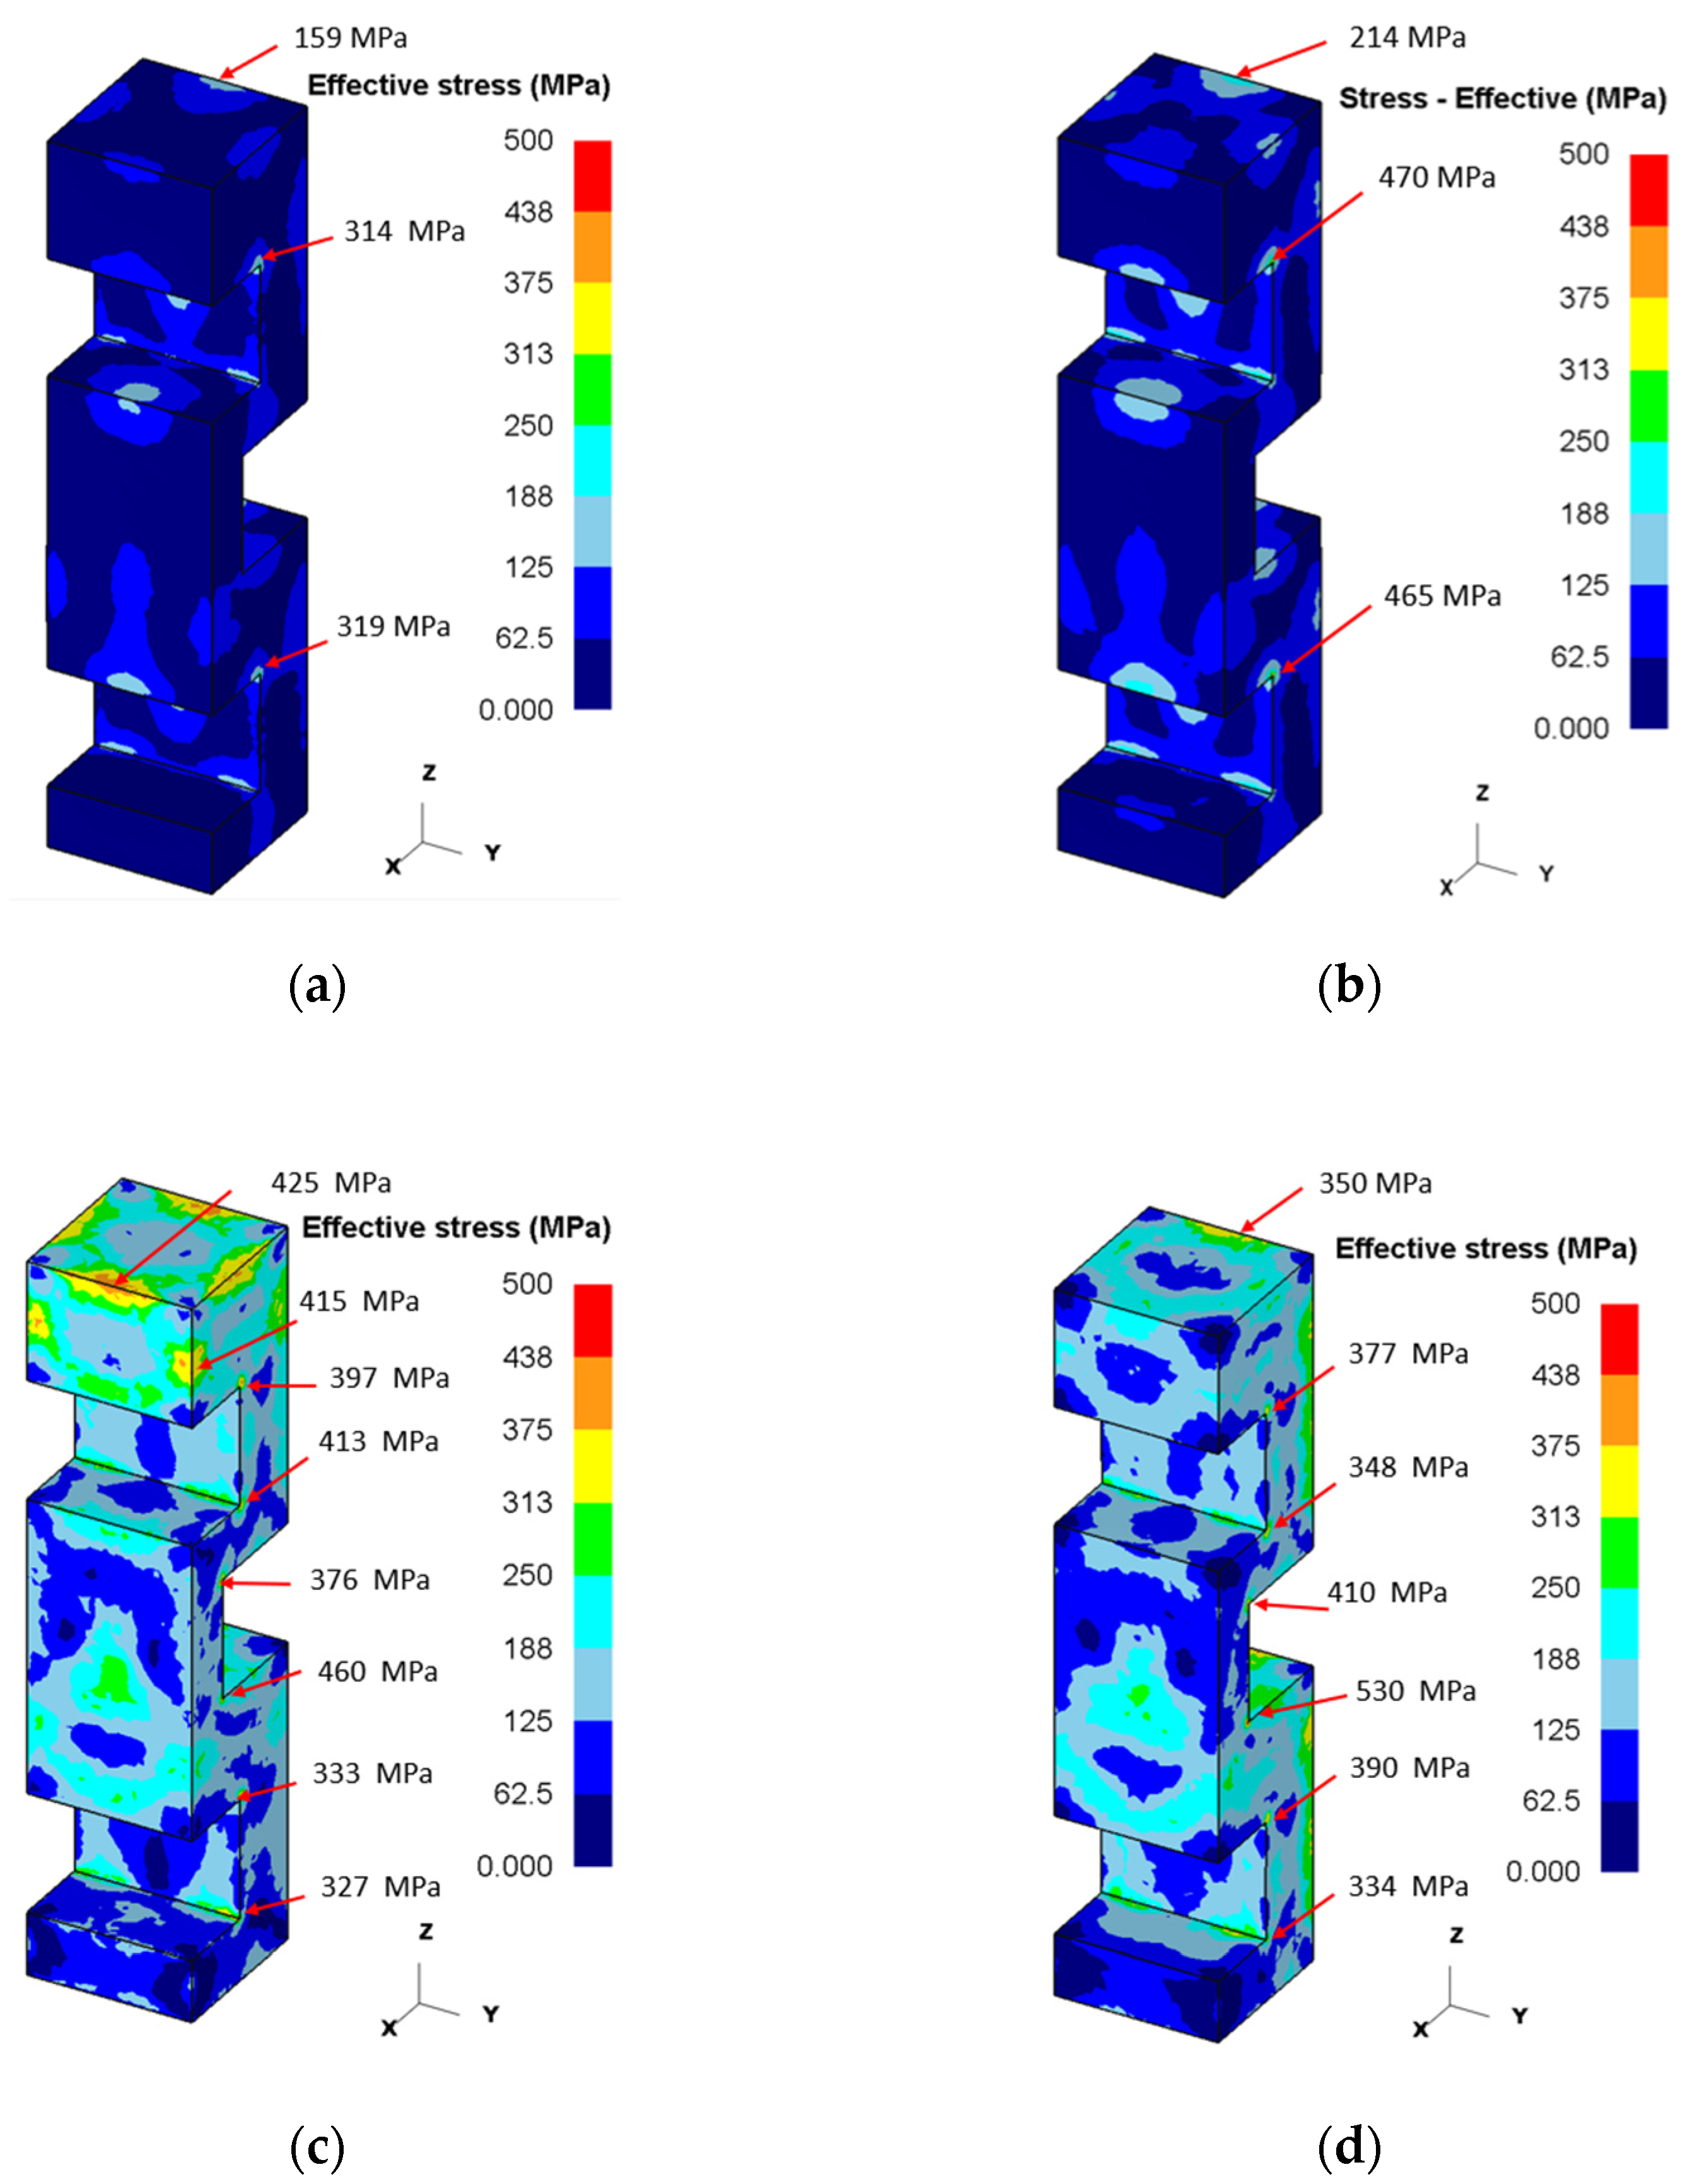
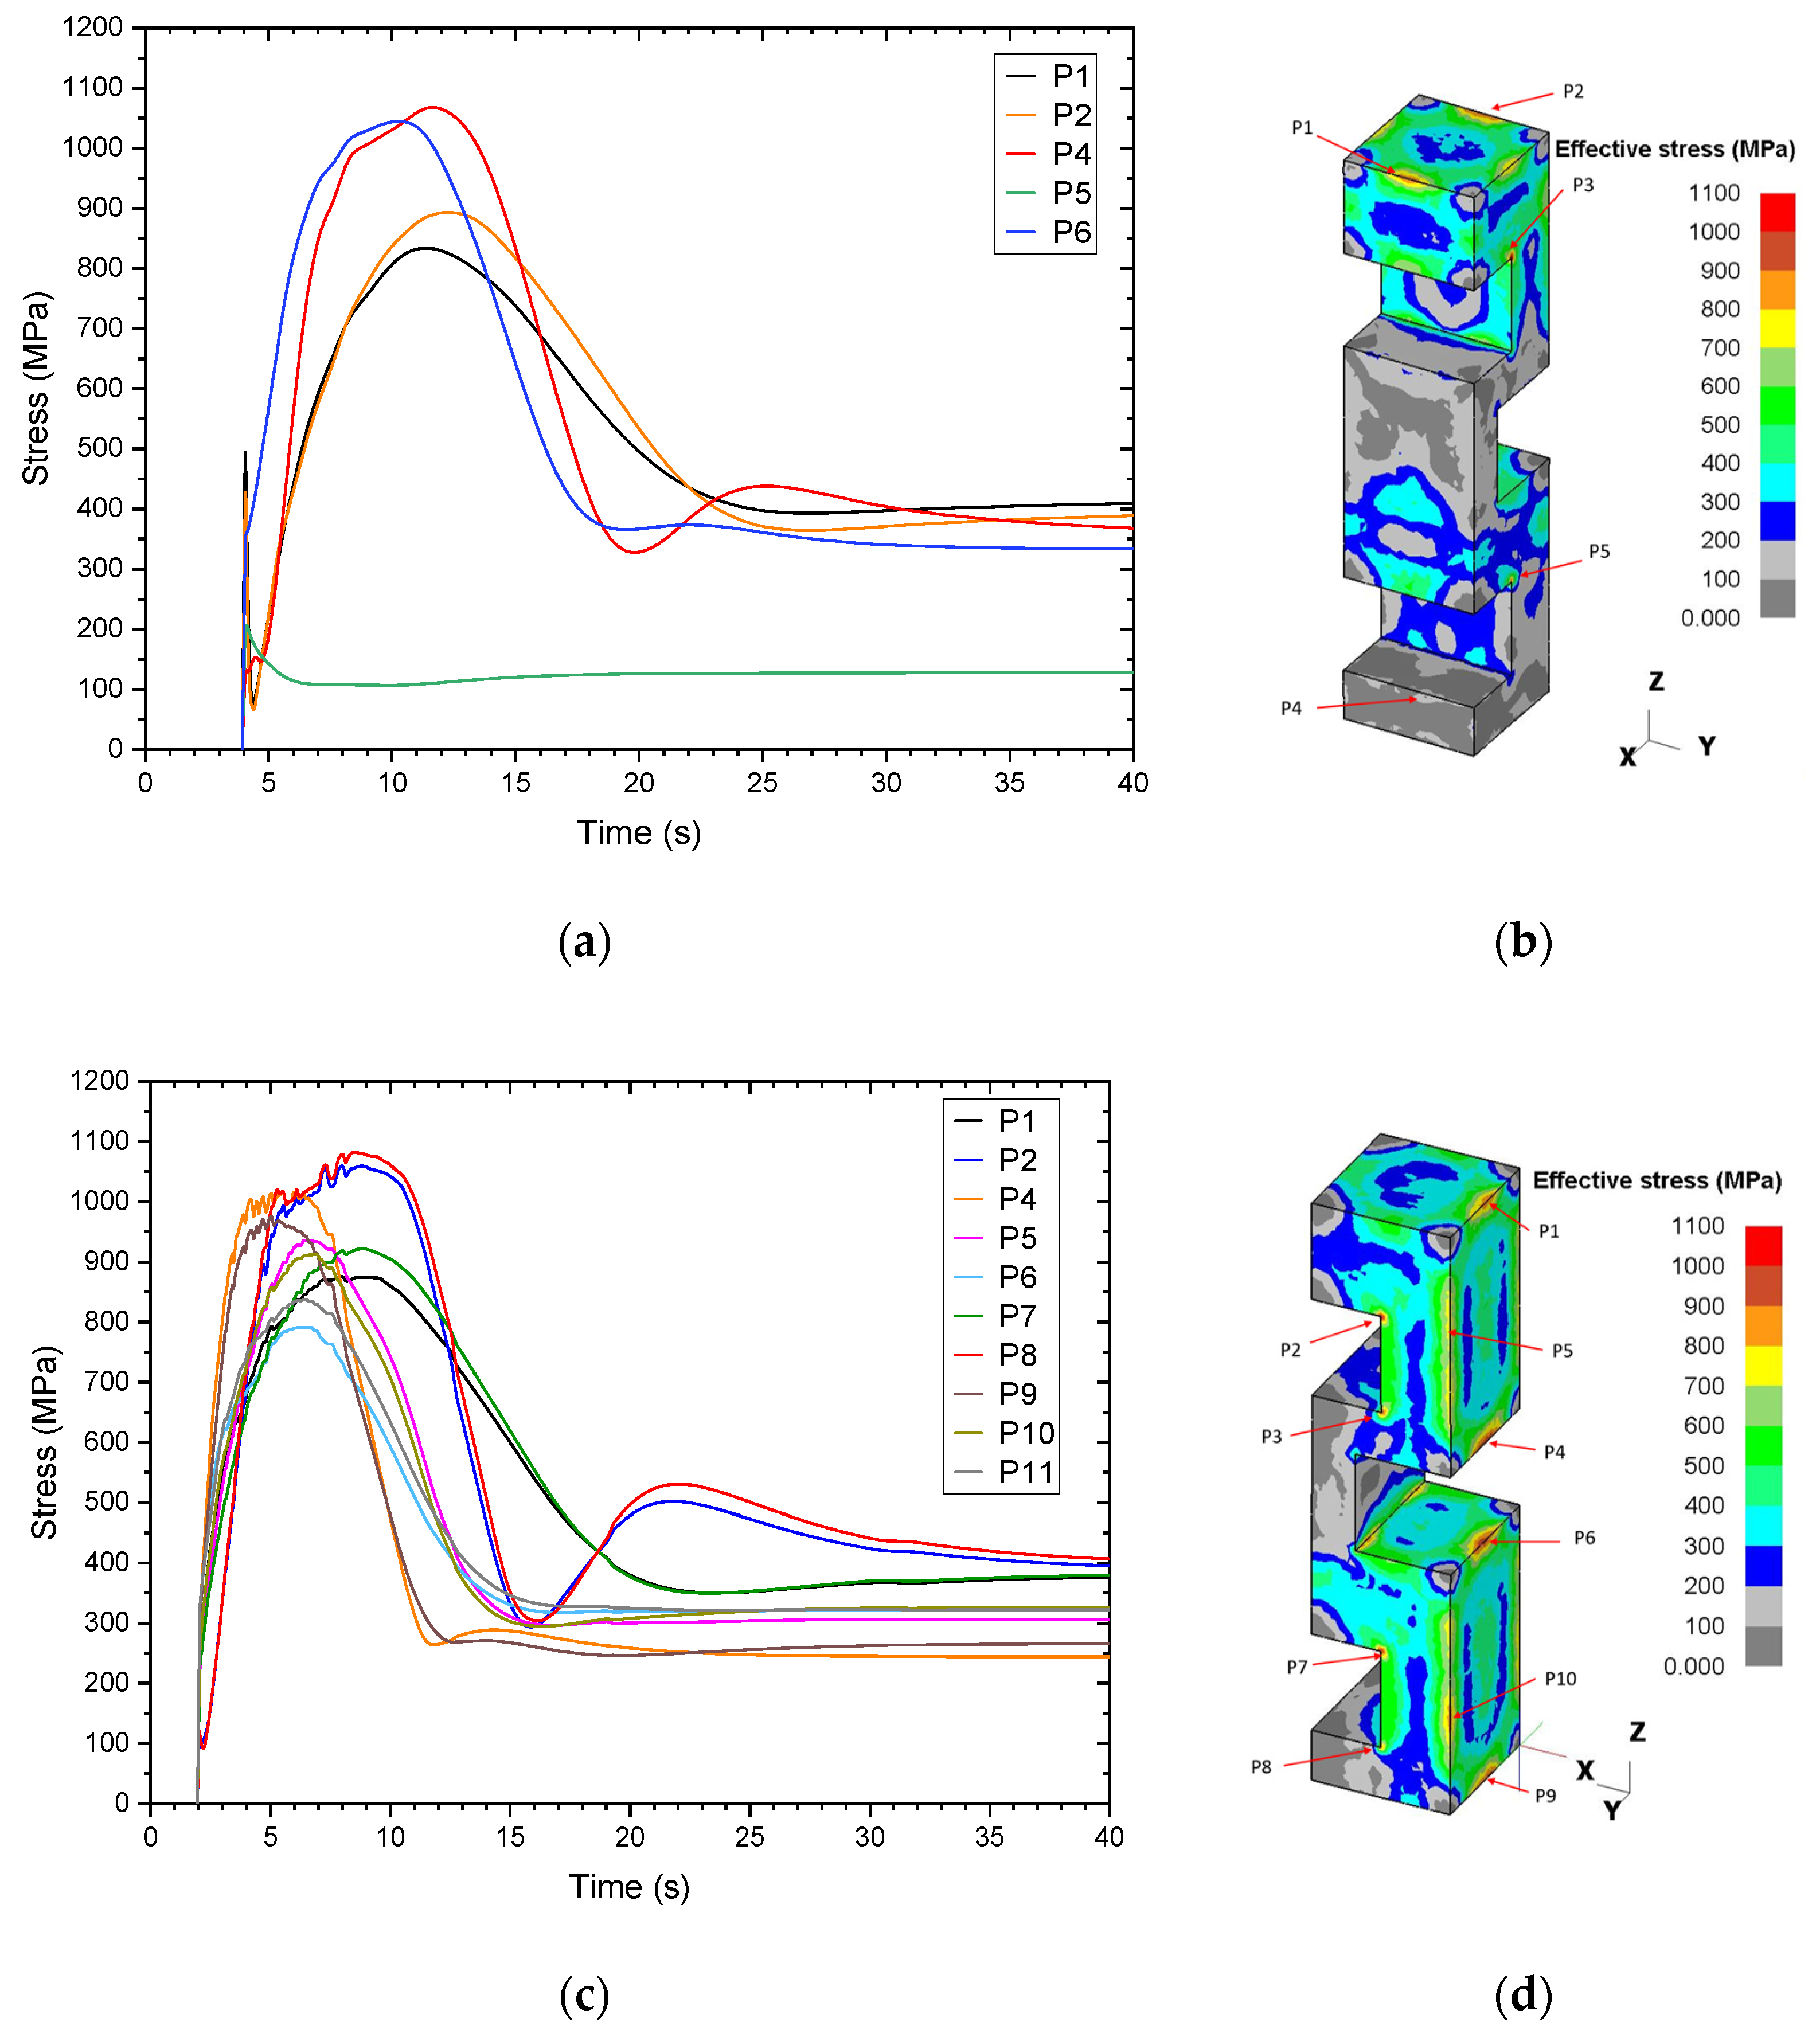
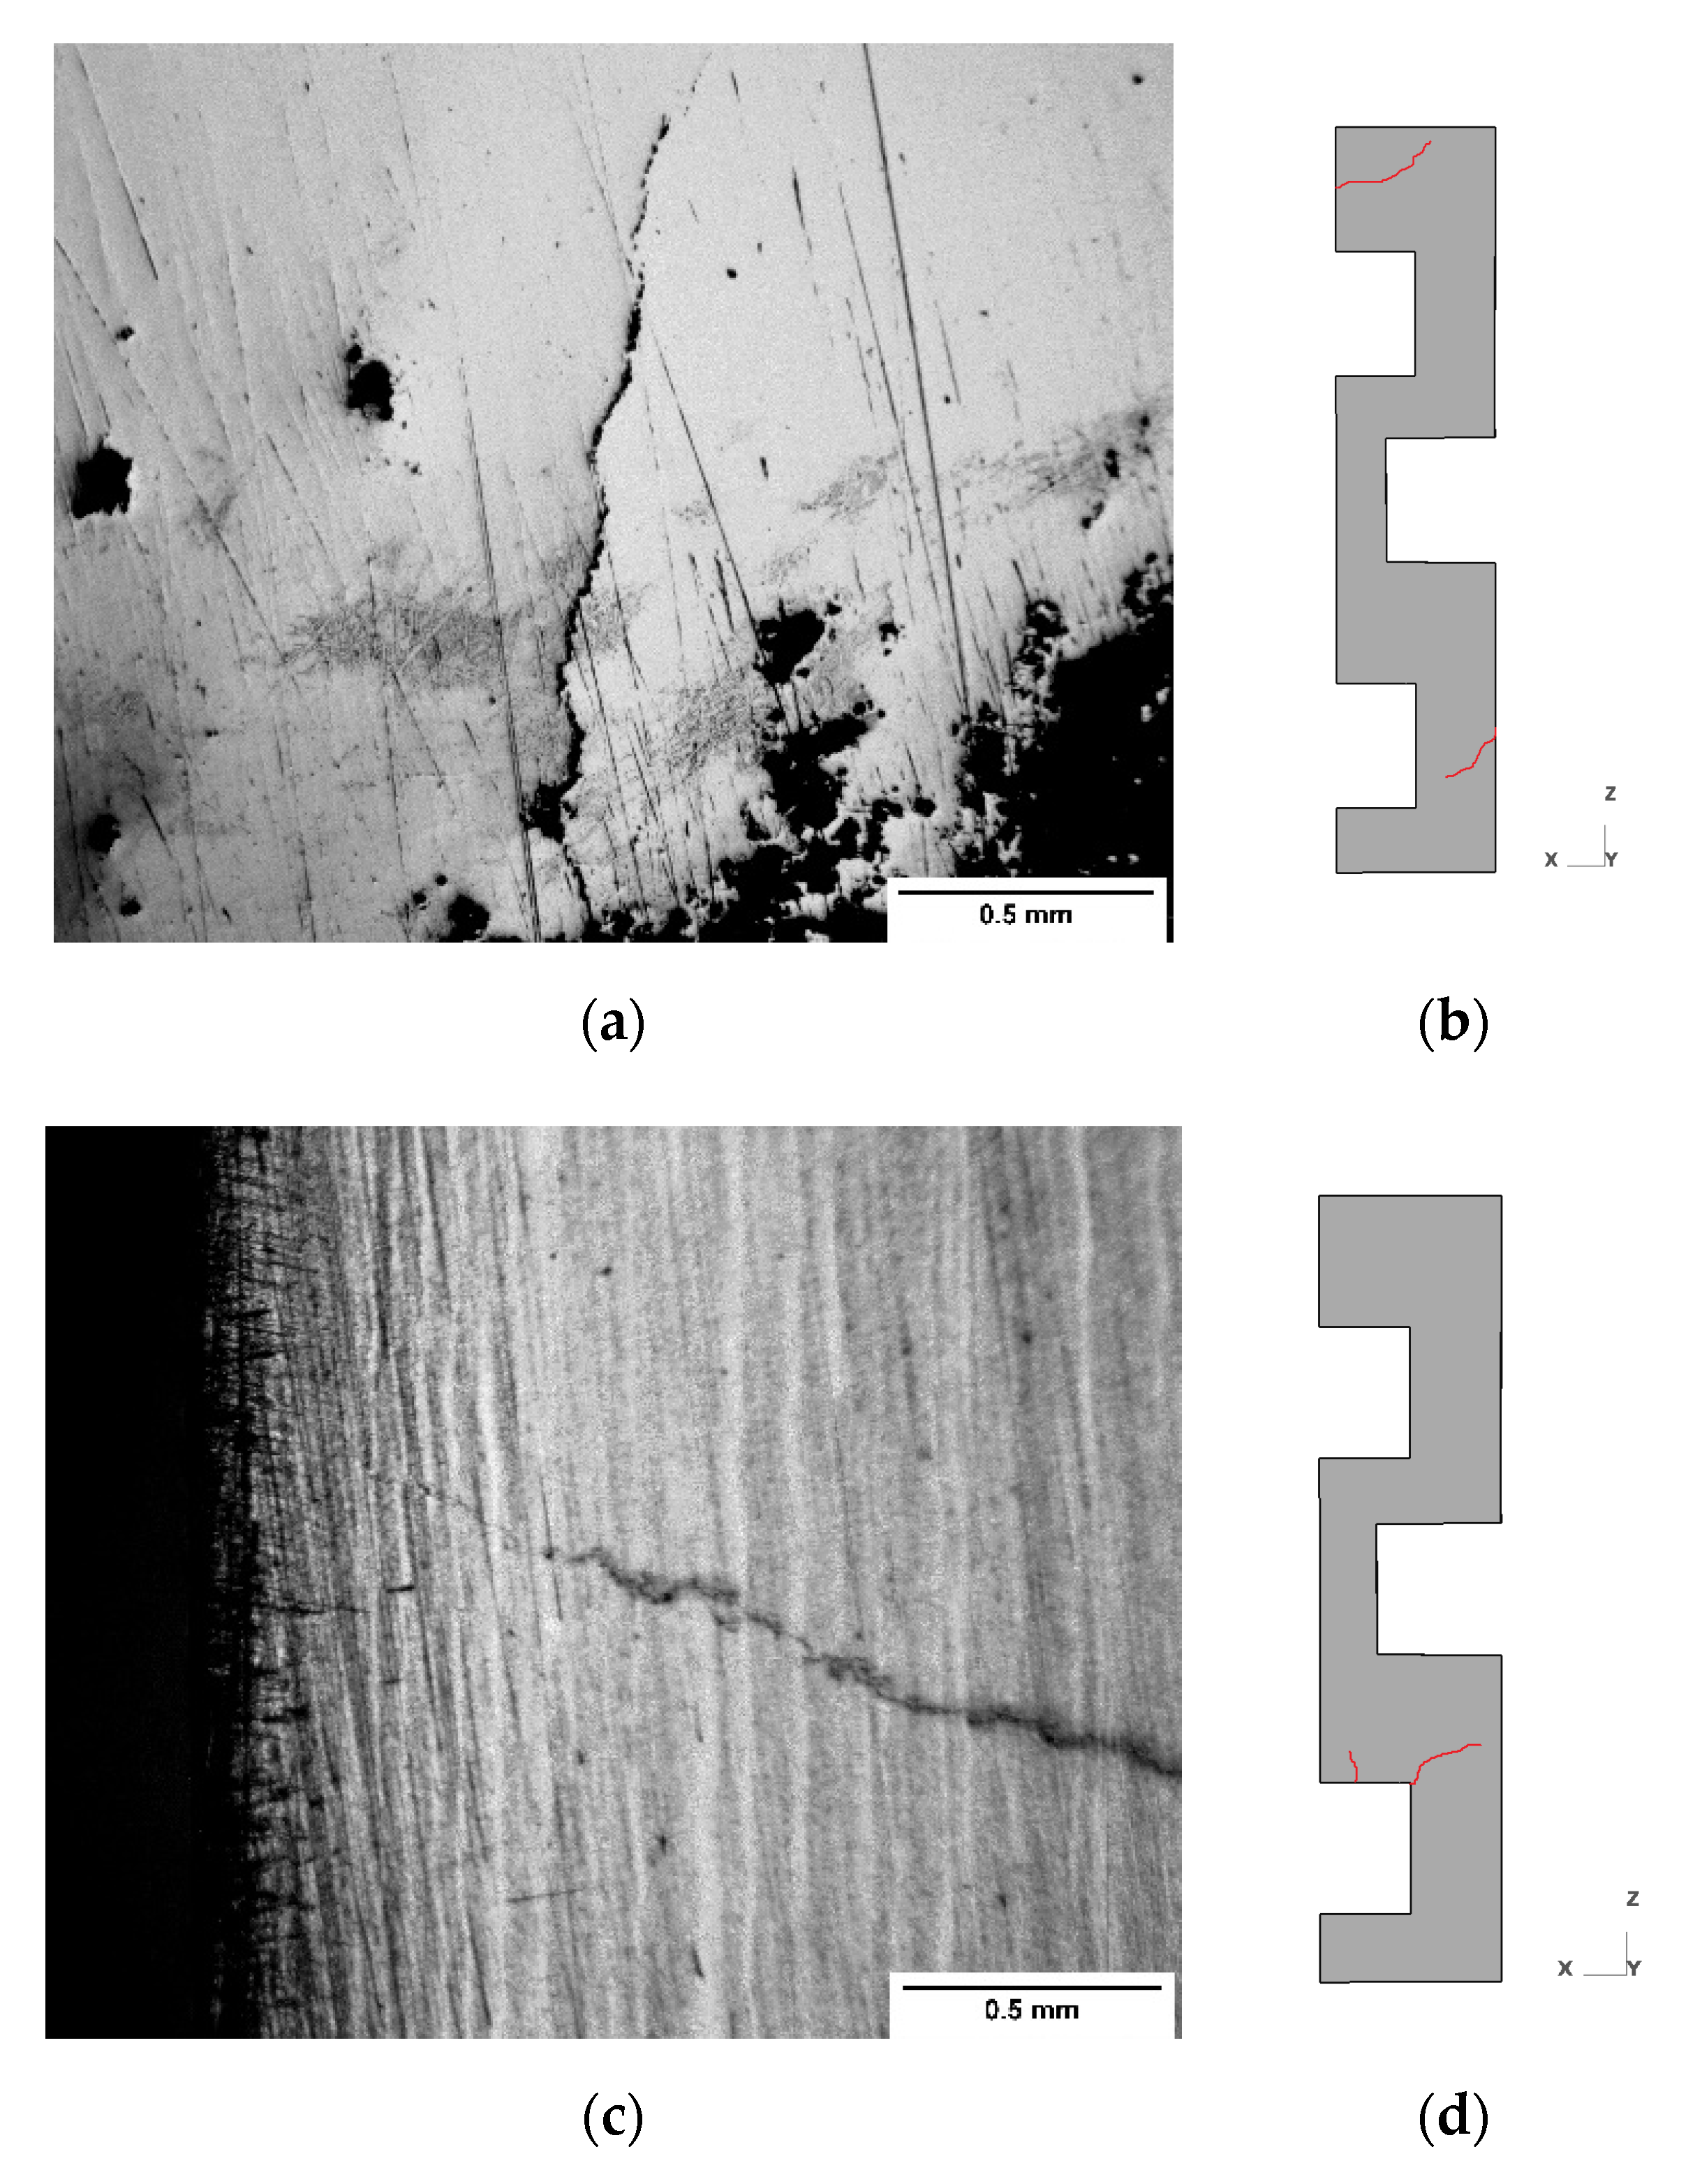
4.4. Simulated Residual Stresses and Precense of Cracks
5. Conclusions
- The highest magnitude of thermal gradients was present when using water as the cooling medium and the direction of horizontal immersion, increasing the presence of high values of stress with thermal origin and decreasing the dimensional precision and its mechanical properties;
- There are favorable conditions during the quenching process to reduce those phenomena that affect the quality of the quenched pieces. The condition of vertical immersion and the employment of oil at 60 °C presented a lower magnitude of effective stresses according to the FEM model used, as well as more minor distortion and higher hardness values when compared with the horizontal immersion in both quenching media;
- The present research allowed us to analyze the distortion behavior in a geometrically non-conventional piece under two different quenching media using FEM modeling, becoming a potent tool in the design of heat treatments for real engineering elements with complex geometries;
- Once certain variables have been defined, such as the immersion direction and the quenching media, in which a low level of residual stresses and distortion can obtained, it is advisable to continue researching other critical conditions in the process that contribute to reducing and predicting the distortion and cracking in quenched steels.
Author Contributions
Funding
Institutional Review Board Statement
Informed Consent Statement
Data Availability Statement
Acknowledgments
Conflicts of Interest
References
- Denis, S.; Sjostrom, S.; Simon, A. Coupled Temperature, Stress, Phase Transformation Calculation; Model Numerical Illustration of the Internal Stresses Evolution During Cooling of a Eutectoid Carbon Steel Cylinder. Metall. Trans. A Phys. Metall. Mater. Sci. 1987, 18, 1203–1212. [Google Scholar] [CrossRef]
- Li, Z.; Freborg, A.M.; Hansen, B.D.; Srivatsan, T.S. Modeling the Effect of Carburization and Quenching on the Development of Residual Stresses and Bending Fatigue Resistance of Steel Gears. J. Mater. Eng. Perform. 2012, 22, 664–672. [Google Scholar] [CrossRef]
- Šolić, S.; Podgornik, B.; Leskovšek, V. The occurrence of quenching cracks in high-carbon tool steel depending on the austenitizing temperature. Eng. Fail. Anal. 2018, 92, 140–148. [Google Scholar] [CrossRef]
- Da Silva, A.; Pedrosa, T.; Gonzalez-Mendez, J.; Jiang, X.; Cetlin, P.; Altan, T. Distortion in quenching an AISI 4140 C-Ring—Predictions and experiments. Mater. Des. 2012, 42, 55–61. [Google Scholar] [CrossRef]
- Jami, M.; Gil, E.; Ushiña, E.; Cabrera, V.H.; Cartagena, A. Determine hardness and torsional resistance of AISI/SAE 4340 steel, treated by quenching at 860 °C and tempering at 300 °C, 350 °C and 400°C. Mater. Today Proc. 2021, 49, 35–42. [Google Scholar] [CrossRef]
- Fakir, R.; Barka, N.; Brousseau, J.; Caron-Guillemette, G. Analysis of the Mechanical Behavior of AISI 4340 Steel Cylindrical Specimens Heat Treated with Fiber Laser. J. Manuf. Process. 2020, 55, 41–56. [Google Scholar] [CrossRef]
- Huang, D.; Arimoto, K.; Lee, K.; Lambert, D.; Narazaki, M. Prediction of Quench Distortion on Steel Shaft with Keyway by Computer Simulation. In Proceedings of the ASTM Proceedings: Heat Treating, St. Louis, MO, USA, 9 –12 October 2000; pp. 708–712. [Google Scholar]
- Watanabe, K.; Yamada, M.; Nakasaki, M.; Matsumoto, R.; Utsunomiya, H. Determination of Transformation Transformation Plasticity Plasticity Coefficient Coefficient of Steel Steel by Horizontal Quenching of Shaft. Procedia Manuf. 2020, 50, 498–502. [Google Scholar] [CrossRef]
- De Oliveira, W.P.; Savi, M.A.; Pacheco, P.M.C.L. Finite element method applied to the quenching of steel cylinders using a multi-phase constitutive model. Arch. Appl. Mech. 2013, 83, 1013–1037. [Google Scholar] [CrossRef]
- Kang, S.-H.; Im, Y.-T. Three-dimensional thermo-elastic–plastic finite element modeling of quenching process of plain-carbon steel in couple with phase transformation. Int. J. Mech. Sci. 2007, 49, 423–439. [Google Scholar] [CrossRef]
- He, L.; Li, H. FEM simulation of quenching residual stress for the plane strain problems. In Proceedings of the 2010 International Conference on Computer Design and Applications, Qinhuangdao, China, 25–27 June 2010; Volume 3, pp. 119–123. [Google Scholar] [CrossRef]
- Decroos, M.; Seefeldt, M. The Effect of Size on the Distortion Behavior After Carburisation and Quenching Processes of Gears. Int. J. Met. Mater. Eng. 2017, 139, 1–10. [Google Scholar] [CrossRef] [Green Version]
- Jung, M.; Kang, M.; Lee, Y.-K. Finite-element simulation of quenching incorporating improved transformation kinetics in a plain medium-carbon steel. Acta Mater. 2012, 60, 525–536. [Google Scholar] [CrossRef]
- Basak, A.; Levitas, V.I. Finite element procedure and simulations for a multiphase phase field approach to martensitic phase transformations at large strains and with interfacial stresses. Comput. Methods Appl. Mech. Eng. 2019, 343, 368–406. [Google Scholar] [CrossRef]
- Lopez-Garcia, R.D.; Garcia-Pastor, F.A.; Castro-Roman, M.J.; Alfaro-Lopez, E.; Acosta-Gonzalez, F.A. Effect of Immersion Routes on the Quenching Distortion of a Long Steel Component Using a Finite Element Model. Trans. Indian Inst. Met. 2016, 69, 1645–1656. [Google Scholar] [CrossRef]
- Şimşir, C.; Gür, C.H. 3D FEM simulation of steel quenching and investigation of the effect of asymmetric geometry on residual stress distribution. J. Mater. Process. Technol. 2008, 207, 211–221. [Google Scholar] [CrossRef]
- Lee, S.-J.; Lee, Y.-K. Finite element simulation of quench distortion in a low-alloy steel incorporating transformation kinetics. Acta Mater. 2008, 56, 1482–1490. [Google Scholar] [CrossRef]
- Medina-Juárez, I.; Araujo de Oliveira, J.; Moat, R.J.; García-Pastor, F.A. On the Accuracy of Finite Element Models Predicting Residual Stresses in Quenched Stainless Steel. Metals 2019, 9, 1308. [Google Scholar] [CrossRef] [Green Version]
- Şimşir, C. Modeling and Simulation of Steel Heat Treatment-Prediction of Microstructure, Distortion, Residual Stress, and Cracking. In Steel Heat Treating Technologies; Dossett, J.L., Totten, G.E., Eds.; ASM International: Metals Park, OH, USA, 2014; pp. 409–466. ISBN 978-1-62708-166-5. [Google Scholar]
- Nie, Z.; Wang, G.; Lin, Y.; Rong, Y. (Kevin) Precision Measurement and Modeling of Quenching-Tempering Distortion in Low-Alloy Steel Components with Internal Threads. J. Mater. Eng. Perform. 2015, 24, 4878–4889. [Google Scholar] [CrossRef]
- Sonar, T.; Lomte, S.; Gogte, C.; Balasubramanian, V. Minimization of Distortion in Heat Treated AISI D2 Tool Steel: Mechanism and Distortion Analysis. Procedia Manuf. 2018, 20, 113–118. [Google Scholar] [CrossRef]
- Li, Z.; Grandhi, R.V.; Srinivasan, R. Distortion minimization during gas quenching process. J. Mater. Process. Technol. 2006, 172, 249–257. [Google Scholar] [CrossRef]
- Li, Z.; Zhan, M.; Fan, X.; Wang, X.; Ma, F.; Li, R. Multi-mode distortion behavior of aluminum alloy thin sheets in immersion quenching. J. Mater. Process. Technol. 2019, 279, 116576. [Google Scholar] [CrossRef]
- Farivar, H.; Prahl, U.; Hans, M.; Bleck, W. Microstructural adjustment of carburized steel components towards reducing the quenching-induced distortion. J. Mater. Process. Technol. 2019, 264, 313–327. [Google Scholar] [CrossRef]
- Cho, J.; Kang, W.; Kim, M.; Lee, J.; Lee, Y.; Bae, W. Distortions induced by heat treatment of automotive bevel gears. J. Mater. Process. Technol. 2004, 153, 476–481. [Google Scholar] [CrossRef]
- Bouissa, Y.; Bohlooli, N.; Shahriari, D.; Champliaud, H.; Morin, J.-B.; Jahazi, M. FEM modeling and experimental validation of quench-induced distortions of large size steel forgings. J. Manuf. Process. 2020, 58, 592–605. [Google Scholar] [CrossRef]
- Nallathambi, A.K.; Kaymak, Y.; Specht, E.; Bertram, A. Sensitivity of material properties on distortion and residual stresses during metal quenching processes. J. Mater. Process. Technol. 2010, 210, 204–211. [Google Scholar] [CrossRef]
- ASTM Standard E3. In Standard Guide for Preparation of Metallographic Specimens; ASTM International: West Conshohocken, PA, USA, 2017.
- ASTM Standard E407. In Standard Practice for Microetching Metals and Alloys; ASTM International: West Conshohocken, PA, USA, 2017.
- Mirzakhani, S.; Javanbakht, M. Phase Field-Elasticity Analysis of Austenite-Martensite Phase Transformation at the Nanoscale: Finite Element Modeling. Comput. Mater. Sci. 2018, 154, 41–52. [Google Scholar] [CrossRef]
- Feulvarch, E.; Fontaine, M.; Bergheau, J.-M. XFEM investigation of a crack path in residual stresses resulting from quenching. Finite Elements Anal. Des. 2013, 75, 62–70. [Google Scholar] [CrossRef] [Green Version]
- Fourier, J.B.J. Théorie Analytique de La Chaleur; Cambridge University Press: Cambridge, UK, 2009; ISBN 9780511693229. [Google Scholar]
- Johnson, W.A. Reaction Kinetics in Processes of Nucleation and Growth. Am. Inst. Min. Met. Petro. Eng. 1939, 135, 416–458. [Google Scholar]
- Avrami, M. Kinetics of Phase Change. I General Theory. J. Chem. Phys. 1939, 7, 1103–1112. [Google Scholar] [CrossRef]
- Koistinen, D.P.; Marburger, R.E. A general equation prescribing the extent of the austenite-martensite transformation in pure iron-carbon alloys and plain carbon steels. Acta Metall. 1959, 7, 59–60. [Google Scholar] [CrossRef]
- Todinov, M.T. Mechanism for formation of the residual stresses from quenching. Model. Simul. Mater. Sci. Eng. 1998, 6, 273–291. [Google Scholar] [CrossRef]
- Vander Voort, G.F. Atlas of Time-Temperature Diagrams for Irons and Steels; ASM International: Metals Park, OH, USA, 1991; ISBN 978-0871704153. [Google Scholar]
- JMatPro 13.0 Demo Version. Available online: https://www.sentesoftware.co.uk/demo (accessed on 20 March 2022).
- Buczek, A.; Telejko, T. Investigation of heat transfer coefficient during quenching in various cooling agents. Int. J. Heat Fluid Flow 2013, 44, 358–364. [Google Scholar] [CrossRef]
- Sugianto, A.; Narazaki, M.; Kogawara, M.; Shirayori, A. Validity of Heat Transfer Coefficient Based on Cooling Time, Cooling Rate, and Heat Flux on Jominy End Quench Test. In Proceedings of the MS&T 2007, Materials Science and Technology, Detroit, MI, USA, 16–20 September 2007; pp. 171–180. [Google Scholar]
- Li, H.F.; Duan, Q.Q.; Zhang, P.; Zhang, Z.F. The Relationship between Strength and Toughness in Tempered Steel: Trade-Off or Invariable? Adv. Eng. Mater. 2019, 21, 1801116. [Google Scholar] [CrossRef]


| Element | C | Cr | Mo | Ni | Mn | Si | S | P | Fe |
|---|---|---|---|---|---|---|---|---|---|
| % wt. | 0.4 | 0.89 | 0.25 | 1.80 | 0.7 | 0.3 | 0.021 | 0.005 | Balance |
| Sample | Temp. (°C) | Soaking Time | Quenching Media | Immersion Rate (mm/s) | Orientation |
|---|---|---|---|---|---|
| V-OQ | 860 | 45 | Oil | 40 | Vertical |
| H-OQ | 860 | 45 | Oil | 40 | Horizontal |
| V-WQ | 860 | 45 | Water | 40 | Vertical |
| H-WQ | 860 | 45 | Water | 40 | Horizontal |
| Simulation Parameters | Value (s) |
|---|---|
| Number of simulation steps | 800 |
| Number of elements | 165,000 |
| Number of nodes | 36,500 |
| Initial temperature of the nodes (°C) | 860 |
| Environment temperature (°C) | 25 |
| Quenching oil temperature (°C) | 55 |
| Cooling water temperature (°C) | 25 |
| Immersion rate (mm/s) | 40 |
| Immersion direction | −Z and X |
| Iteration method | Newton–Raphson |
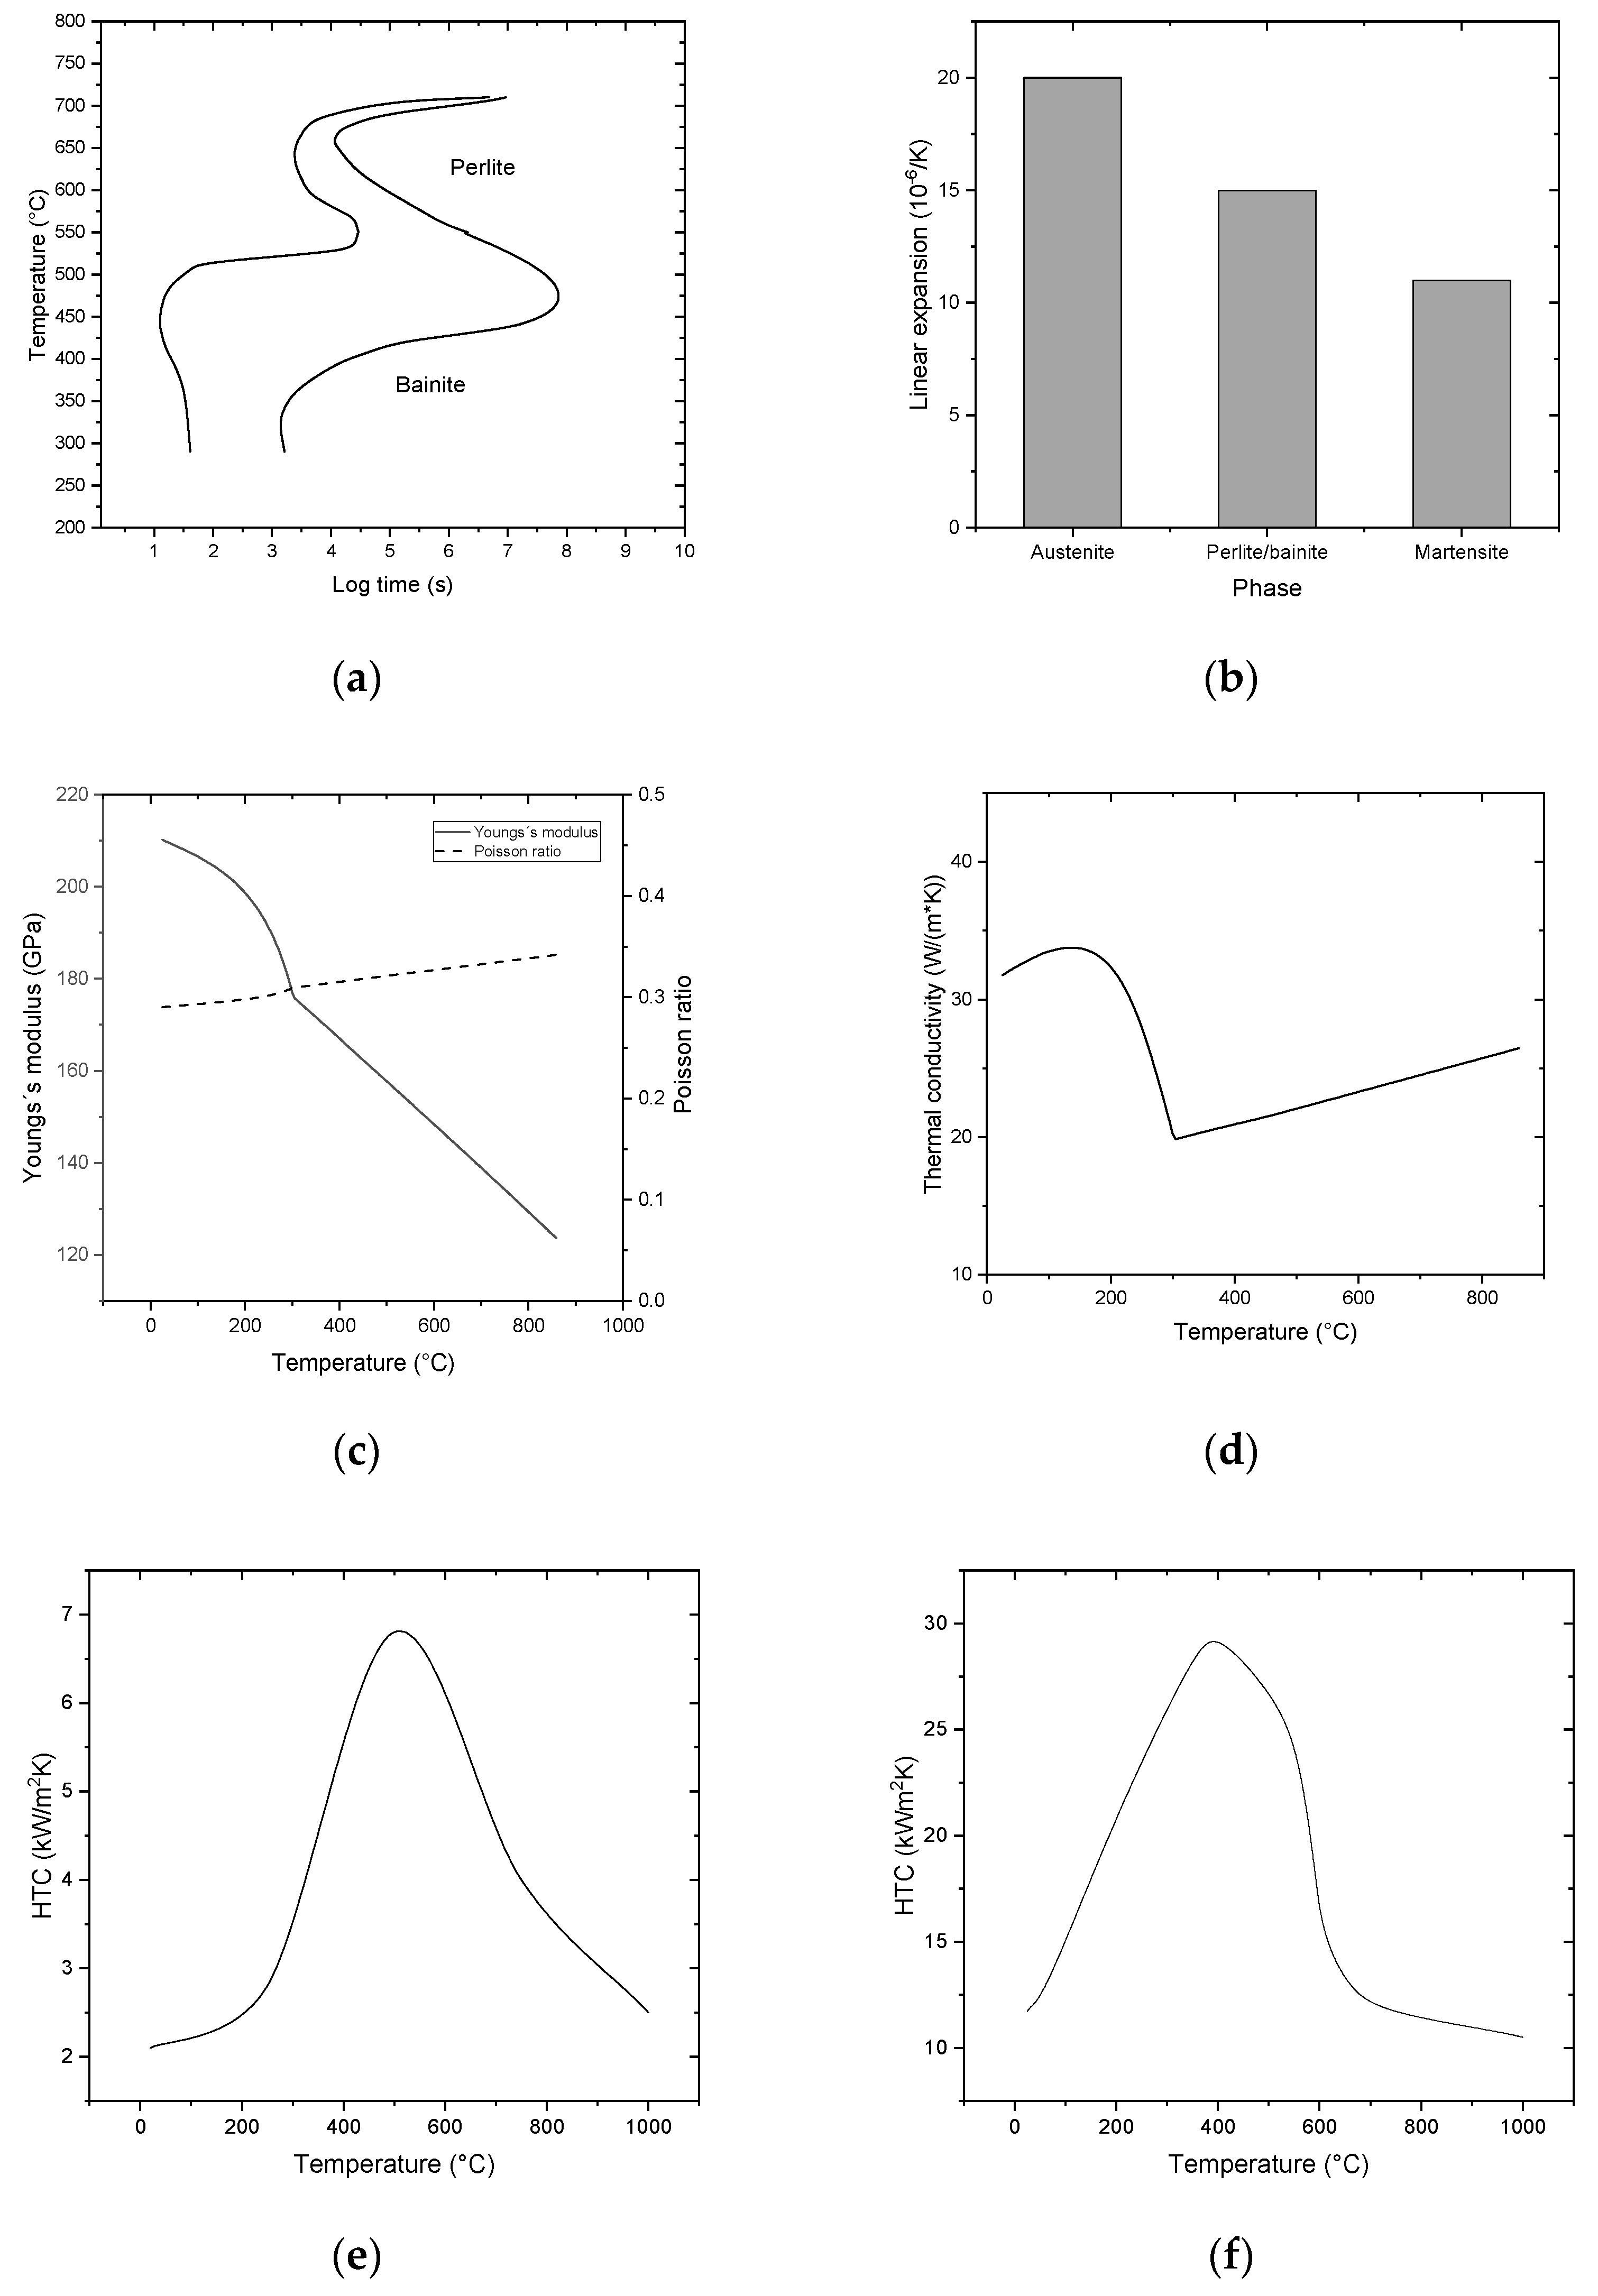
| Heat transfer coefficient | ƒ(T), shown in Figure 3e,f |
Publisher’s Note: MDPI stays neutral with regard to jurisdictional claims in published maps and institutional affiliations. |
© 2022 by the authors. Licensee MDPI, Basel, Switzerland. This article is an open access article distributed under the terms and conditions of the Creative Commons Attribution (CC BY) license (https://creativecommons.org/licenses/by/4.0/).
Share and Cite
Lopez-Garcia, R.D.; Medina-Juárez, I.; Maldonado-Reyes, A. Effect of Quenching Parameters on Distortion Phenomena in AISI 4340 Steel. Metals 2022, 12, 759. https://doi.org/10.3390/met12050759
Lopez-Garcia RD, Medina-Juárez I, Maldonado-Reyes A. Effect of Quenching Parameters on Distortion Phenomena in AISI 4340 Steel. Metals. 2022; 12(5):759. https://doi.org/10.3390/met12050759
Chicago/Turabian StyleLopez-Garcia, Ricardo Daniel, Israel Medina-Juárez, and Araceli Maldonado-Reyes. 2022. "Effect of Quenching Parameters on Distortion Phenomena in AISI 4340 Steel" Metals 12, no. 5: 759. https://doi.org/10.3390/met12050759
APA StyleLopez-Garcia, R. D., Medina-Juárez, I., & Maldonado-Reyes, A. (2022). Effect of Quenching Parameters on Distortion Phenomena in AISI 4340 Steel. Metals, 12(5), 759. https://doi.org/10.3390/met12050759