Abstract
In this work, the coarsening mechanisms of CaS inclusions in liquid steel were investigated by analyzing inclusions in experimental and industrial samples. A detailed particle size distribution evolution was reported. The observed CaS coarsening rate was compared with the theoretical coarsening rate calculated by using the models proposed in the literature. For both experimental and industrial data, it was observed that the coarsening mechanisms varied during different stages of Ca treatment. It was found that in the early stage (after Ca addition) of experiments and during Ca addition under industrial conditions, the coarsening of CaS was governed by diffusion-controlled growth. As the Ca dissolved in steel diminished, the coarsening was governed by collision-dependent mechanisms. For experimental conditions, the growth of CaS was controlled by the Brownian collisions, while the coarsening by turbulent collisions was the dominant mechanism under industrial conditions.
1. Introduction
A few decades ago, calcium treatment was introduced to improve steel castability by modifying solid Al2O3 inclusions to liquid or semi-liquid calcium aluminates inclusions (CAx, C and A denote CaO and Al2O3, respectively). Inclusions with compositions similar to C3A, C12A7, and CA are usually considered to be liquid or semi-liquid at steelmaking temperature, as opposed to solid CAx, that are CA2 and CA6. This is achieved by calcium reacting with oxygen in Al2O3 inclusions. It is important to note that calcium has a high affinity to sulfur, so CaS inclusions are a common product of the calcium treatment. The formation of CaS inclusions does have some advantages. For example, the presence of CaS as transient CaS can act as a source of Ca supply for the modification of oxide inclusions [1,2]. Moreover, precipitating S in the form of CaS suppresses the formation of MnS inclusions. However, an excess amount of stable CaS inclusions is usually considered detrimental, as they behave similarly to other solid inclusions [3,4,5], such as Al2O3. The impact of CaS inclusions on both the castability and the product quality is related to their size. The presence of larger CaS inclusions accelerates the clogging and deteriorates the product’s physical properties. To the best of the authors’ knowledge, despite being a well-known inclusion type, there is no research on the growth of CaS inclusions in steelmaking conditions.
The common coarsening mechanisms are diffusion-controlled growth, coarsening due to Ostwald ripening, Brownian motion, ascending velocity difference, and laminar and turbulent flows [6,7,8,9]. The diffusion-controlled growth mechanism is applicable to conditions where the rate of inclusion coarsening is limited by the mass transport of species in liquid steel. Ostwald ripening is a unique diffusion-related scenario driven by the concentration gradient at the interface associated with different inclusion sizes. As a result, some inclusions grow at the expense of smaller ones. Continuous irregular motion causes inclusions to move randomly in the liquid steel. Such motion independent of fluid flow is characterized as Brownian motion, leading to the collision and coalescence of inclusions. The coarsening of inclusions due to the ascending velocity of small inclusions is suggested to be proportional to the square of their radii [10], so the larger inclusions may encounter smaller ones during floatation, which then increases the inclusion size. Inclusions can also collide and coalesce when driven by laminar and turbulent flows.
Two approaches in the literature are applied to determine the growth mechanisms of inclusions. The first compares the change in the average diameter of inclusions detected using SEM with those predicted by various theoretical coarsening mechanisms. The one that gives the closest agreement is considered to be the predominant mechanism. This approach was used in the work of Suzuki et al. [7] to determine the coarsening mechanism of SiO2 inclusions in continuous casting slabs and test ingots. The mechanism was reported to be Ostwald ripening, as the theoretical prediction of Ostwald ripening had the best agreement with the observations. The same approach was also used by Ohta and Suito [6] for MgO, ZrO2, Al2O3, CaO-Al2O3, and MnO-SiO2 inclusions in laboratory studies. The observed size change slightly deviated from the theoretical prediction; hence, they concluded Ostwald ripening to be the predominant mechanism but suggested that the effect of Stokes motion cannot be neglected. Wang et al. [8] also studied the impact of steel and inclusion compositions on the growth of oxide inclusions in experimental conditions using a similar method. Again, the reported mechanism was Ostwald ripening, but only during the first 10 min after aluminum (Al) addition. The mechanisms for the latter part were not reported. Overall, the previous studies emphasized the importance of Ostwald ripening on the growth of many oxide inclusions. It was unclear why the primary diffusion-controlled growth was never discussed in those studies and only included the unique diffusion-related mechanism of Ostwald ripening. Further, the first approach is accessible, and relationships between the inputs and the predicted inclusion size are clearly defined. However, it is essential to note that the particle size distribution (PSD), which provides more detail about the coarsening process, cannot be obtained through this method.
The second method to predict the change in inclusion diameter is to utilize the population balance equations (PBEs). It calculates how a fixed number of monomers are distributed between clusters; hence, they become inclusions of different sizes. This approach was first suggested in the study of Smoluchowki [11] and allows one to calculate the PSD. Later, this approach was used by Zhang and Pluschkell [9] and Zhang and Lee [12] to study the coarsening rate of Al2O3 inclusions. Based solely on the PBE calculation, Zhang and Pluschkell [9] suggested that after the initial nucleation, Al2O3 grew by Ostwald ripening and then by Brownian motion and turbulent collision for inclusions with diameters smaller than 2 μm and larger than 4 μm, respectively. However, the calculated PSD was not validated against any experimental or industrial data. Such shortness was improved later in the work of Zhang and Lee [12], whose calculation of the PBE reached the same conclusion in terms of the coarsening mechanism of Al2O3, except Stokes motion was proposed to be also effective starting about 1 min after the initial nucleation. Moreover, the PSD predicted based on PBE was compared with the experimentally observed PSD. The predicted and the observed values for the PSD of Al2O3 inclusions were in agreement for the initial stage of the defined experimental conditions. Some studies [13,14] used only quantification of collision frequency in PBE to determine the controlling coarsening mechanism, and they did not predict the evolution of PSD. An example is the work of Yin et al. [13], who studied the formation and growth of TiN clusters. By comparing the collision volume of Brownian collision, turbulent collision, and Stokes collision, they showed that the effect of Brownian collision on TiN growth was less significant than the other two collision mechanisms. Another example is the modeling work by Rimbert et al. [14] on precipitation and agglomeration of aluminum titanates. Again, by calculating the collision volume, Brownian motion was found to govern the growth of small micron size inclusions, and the increase in inclusion size caused the dominant mechanism to shift to collision in the turbulent flow, then Stokes motion. Overall, the PBE-based studies usually found diffusion to be significant in the early stages and later aggregation, but depending on the inclusion type and size, the significance of different collision-related mechanisms may differ. Compared to the first approach, all coarsening mechanisms can be considered simultaneously when applying the PBE, and their overall effects on the PSD can be studied. As the PBE is a more fundamental way of calculating the size change, it takes more calculation power and is less accessible [15]. Because diffusion-related growth mechanisms (Ostwald ripening and diffusion-controlled growth) depend primarily on the correct estimation of the number of monomers, applying the complete form of PBE, including both diffusion- and collision-related coarsening mechanisms to calculate the evolution of PSD of inclusions can be challenging.
The authors conducted laboratory-scale inclusion modification experiments at 1873 K using synthetic steel with compositions similar to a typical LCAK commercial product. Moreover, industrial samples were retrieved from the ladle after Ca addition and from tundish. The characteristics of inclusions were analyzed mainly using an automated SEM-EDS system called ASPEX. The present study focused on understanding the growth mechanism of the CaS inclusions in experimental and industrial conditions. This was done by comparing the observed and the predicted size change of CaS inclusions by different controlling mechanisms. The effect of coagulation on the evolution of CaS PSD was also calculated using PBE. The results were compared with the observed change in inclusion number density to reveal the critical coarsening mechanisms in industrial conditions.
2. Experimental Methodology
The high-temperature experimental setup is shown in Figure 1. In total, 0.3 g graphite rod, 6.5 g Mn, electrolytic Fe, and an appropriate amount of FeS depending on the targeted S content were placed inside an Al2O3 crucible at room temperature and then heated in the vertical tube furnace to 1873 K and held for 10 min to homogenize the melt. Throughout the experiment, 99.999% Ar gas was fed into the furnace at a rate of 0.5 L/min to maintain a protective atmosphere. After that, Al and Si were added to deoxidize the steel melt. The melt was homogenized for an additional 15 min after deoxidation. Thereafter, Ca was added. The Ca addition technique was adopted from Verma et al. [3]. A mixture of electrolytic Fe and Ca enclosed in a capsule of steel shim was guided to the crucible. It helped Ca to immerse into the melt and increased the recovery rate. The total mass of raw materials was approximately 500 g.
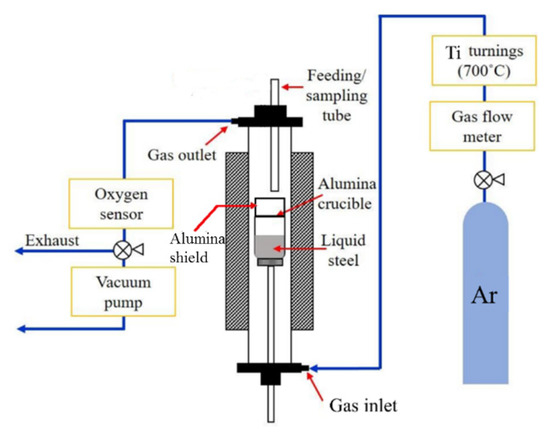
Figure 1.
Schematic diagram of the experimental setup.
The present study used data from three laboratory experiments and four industrial heats. The compositions are summarized in Table 1. This study did not involve Heat 2 [2], which was studied in the authors’ previous work due to a low number of CaS inclusions. The laboratory experiments are denoted in the form of “[S content (ppm)] [final Ca content (ppm)]”.

Table 1.
Chemical composition of experimental and industrial samples (wt. pct.).
Pin-shaped samples with 0.005 m diameter and about 0.1 m length were taken at 1, 3, 5, 10, and 20 min after Ca addition and were cooled in air. Additional samples were taken at 30 and 40 min in Exp. 2025. The sample taken during the experiment are referred to as “pin samples”. The rest of the experimental steel was cooled inside the furnace at a rate of 10 K/min. Samples taken from the remaining steel are “bulk samples”. Lollipop samples were taken from ladle and tundish in 4 industrial heats. The lollipop samples are approximately 10 mm × 32 mm × 35 mm. A schematic diagram and the dimensions are shown in Figure 2.

Figure 2.
Schematic diagram of the lollipop sample.
The surface of collected pin samples was cleaned, then the pin samples were sectioned for chemical analysis and inclusions analysis. Al, Si, Mn, and Ca contents of steel samples were measured using inductively coupled plasma optical emission spectrometry (ICP-OES). In Exp. 2035 and Exp. 3035 (see Table 1), an initial 0.03 wt. pct. Al content was achieved. All concentrations have the unit of wt. pct. in this study unless specified. In Exp. 2025, no Al was added. The Mn, Si, and S contents were constant in an experiment, but Al increased from the initial concentration due to Ca-crucible reaction. The change was more significant in Exp. 2035 and Exp. 3035 because the initial Ca contents were higher. In Exp. 2035 and Exp. 3035, the initial Ca contents were 56 and 41 ppm, respectively, then decreased to 35 ppm in both experiments. In Exp. 2025, the Ca content reduced from 40 to 25 ppm. LECOTM CS744 carbon/sulfur analyzer was used to measure the S and C contents of steel samples. Total oxygen (T.O.) in Exp. 2035 were analyzed using a LECOTM ON736 oxygen/nitrogen analyzer. The measured concentrations were confirmed using pulse-height distribution analysis (spark OES-PDA).
A cross-section of every pin sample and a bulk sample was analyzed using an automated SEM-EDS system (ASPEX) to study the characteristics of inclusions. The automated SEM detects inclusion based on the contrast between the inclusions and the steel matrix. The SEM determines the geometric center of an inclusion, then 16 chords (diameters) are drawn, passing through the center. The average of all 16 chords is the average diameter of the inclusion. This should not be confused with the average diameter of multiple inclusions (average diameter for short), denoted as davg. Connecting the ends of all chords determines the shape, perimeter and area. The details are discussed in elsewhere [16]. The inclusions with the longest diameter (dmax) larger than 2 μm were detected. A detailed discussion on steel chemistry change and the methodology of inclusion analysis can be found in the authors’ previous publication [2] and will not be repeated here.
The detailed composition of the industrial samples can be found in Table 1. Sampling time slightly varies from heat to heat. Ladle samples L1 to L5 of Heat 1 were taken at 1848 K, and after 1, 2, 3, 4, and 5 min of the start of Ca addition. For the other three heats, only one sample (L5) was taken after Ca addition close to the end of ladle refining. Samples T1 and T2 were from tundish when about 30 and 80 t steel was cast from a 165-ton tundish at 1833 K. Lollipop samples were taken to conduct inclusion analysis. The samples were cut at 12 cm from the bottom. The intersecting surface of the lower part was cleaned and polished, then analyzed using the same automated SEM-EDS system, so the experimental and industrial inclusion data are comparable.
Based on inclusion compositions, the observed inclusions were classified into Ca-rich, liquid CAx, solid CAx, Al2O3, CaS, CaS-other, CaS-MnS, and MnS. Liquid CAx includes C3A, C12A7, and CA inclusions, whereas solid CAx includes CA2 and CA6 inclusions. Ca-rich inclusions have higher CaO content than that in the liquid CAx. CaS-other inclusions are those with compositions between CaS and CAx. CaS-MnS inclusions have a significant fraction of both CaS and MnS phases; however, their fractions are not high enough to be considered as single-phase CaS or MnS. The CaS type inclusions still contain both CaS and MnS phases, but the CaS phase is more dominant. The term “CaS” refers to CaS type inclusions for simplicity unless otherwise specified.
3. Methods of Calculating Coarsening of CaS Inclusions
This study applied two methods described in the introduction section to determine the coarsening mechanism of CaS inclusions under laboratory and industrial conditions. Both calculation methods are explained in detail in this section.
The first method was to compare the evolution of the average diameter of CaS inclusions against the theoretical growth rate predicted by individual mechanisms. Mechanisms 1 to 5 listed below were considered in the present study.
- Diffusion-controlled growth due to concentration gradient created by the Gibbs-Thomson effect (Ostwald ripening);
- Diffusion-controlled growth;
- Collision and coalescence due to the effect of Brownian motion;
- Collision and coalescence due to ascending velocity difference (Stokes motion);
- Collision and coalescence due to flow of the melt.
The second method, which was mainly used to study the coarsening of CaS inclusions under industrial conditions, was the population balance equation (PBE). Collision-related mechanisms 3 to 5 were considered. Mechanisms 1 and 2 were not used to calculate PBE because of the difficulty in estimating the number of CaS monomers that participate in the growth of CaS inclusions. The change in the volumetric number density of CaS inclusions calculated by PBE considering mechanisms 3 to 5 was compared with the observed number density change. The similarities between the two indicated the contribution of collision-related coarsening mechanisms.
3.1. Determination of the Rate-Controlling Component
To calculate the coarsening rate of inclusion due to Ostwald ripening, the first step is to determine the rate-controlling component. Equation (1) [6,7,8] is the expression of change in average radius, r, from initial radius, r0, during the time, t, at temperature, T. In Equation (1), the second term is the coarsening rate. γ is the interfacial tension between steel and CaS type inclusion, MVi is the molar volume per mole of component i in a compound, Di is the diffusion coefficient of component i, and C[i],b and C(i) are the concentrations of component i in the bulk melt and in inclusion, respectively. CaS type inclusions studied are considered as non-stoichiometric CaS-CAx-MnS complexes, so among Ca, Al, O, and S, the one that gives the lowest coarsening rate is the controlling component.
The diffusion coefficients of Ca, Al, O, and S in steel at 1873 K used in calculations were obtained from the literature [17,18]. The diffusion coefficient of Ca at 1873 K was 3.0 × 10⁻⁹ m2/s, and those for S and O were 4.3 × 10⁻⁹ and 3.1 × 10⁻⁹ m2/s, respectively. The diffusion coefficient of Al in liquid iron equaled 3.5 × 10⁻⁹ m2/s. The steel-CaS interfacial tension was assumed to be 0.6 N/m, which is similar to MnS and other sulfides such as FeS and Cu2S [19], as the exact value was never reported in the literature. The interfacial tension of liquid CAx with a weight percentage of CaO between 35 and 55 pct. can be found in the literature [20]. For CAx with CaO lower than 35 wt. pct., the interfacial tension was assumed to increase linearly to 2 N/m, which was the reported interfacial tension of Al2O3 [21,22,23,24,25]. The values used for density, , of C12A7, CA, CA2 and CA6 were 2690, 2560, 2920 and 3790 kg/m3, respectively [8,26]. A value of 2602 kg/m3 was used for CaS. The ratio between inclusion density and the molar mass can be used to calculate MVi. Moreover, the inclusion densities were used to calculate C(i), the concentration of component i in inclusions.
The mass fractions of dissolved Ca, Al, O, and S in steel were assumed to be 0.2 ppm, 0.04 wt. pct., 3 ppm, and 20 ppm, respectively. The conversion from mass fractions to mass concentration of component i, C[i],b, used the temperature–density correlation proposed by A.F. Crawley [27].
One can notice that in Table 2 the calculated coarsening rates of C12A7, CA, and CaS inclusions are consistently the lowest when Ca was considered as the rate-controlling element. This indicates that Ca is most likely the rate-controlling component. The calculated coarsening rates of CA2 and CA6, assuming that Ca is the rate-controlling element, are comparable and higher than those calculated for O, respectively. This suggests that the latter is the rate-controlling component. However, by noticing that CaS type inclusions only contained less than 10 wt. pct. of CAx phase with a composition close to CA2 and CA6 during solidification (CaS composition evolution is included in a later section), Ca being the rate-controlling component as suggested in Table 2 is a more appropriate assumption. When the fraction of CAx phase was higher, which only occurred in Exp. 2035, the modification extent of the CAx phases was equal to or higher than CA phase. In that case, the rate-controlling component was Ca. Therefore, Ca was used as the rate-controlling component in the present work when calculating the CaS diameter change controlled by Ostwald ripening.
Table 2.
The comparison of calculated coarsening rate (m3/s) of different CAx and CaS to determine the rate-controlling component, namely, Ca, Al, O, and S.
3.2. Coarsening Due to Ostwald Ripening
As Ca was determined to be the rate-controlling component, Equation (2) was used to calculate the change in the average radius of CaS inclusions due to Ostwald ripening. The theories of Ostwald ripening had already been discussed in numerous studies [28,29,30]; hence, they will not be discussed here.
When calculating the coarsening rate of CaS type inclusions, their average composition from each sample were used to estimate γ, MVCa and C(Ca). In the work of Wang et al. [8], the interfacial tension of CAx was calculated using Equation (3), where represents the molar fraction. The similar approach was used to calculate the interfacial tension of non-stoichiometric CaS-CAx-MnS complexes, i.e., CaS type inclusions, through Equation (4). The approach of predicting the molar volume of slag was used to estimate the molar volume of inclusions. In Equation (5), xCa is the molar fraction of Ca and MV denotes molar volume. The molar volumes of CaO, Al2O3, CaS and MnS can be found in the literature [20,26]. Similarly, the method of estimating the density of slag [20] was applied to calculate the density of inclusion in Equation (6). Calculating allows one to obtain C(Ca) based on the mass fraction of CaO and CaS of the average composition of CaS type inclusions.
The concentration of dissolved Ca in the bulk melt was proposed to be 0.2 ppm during the industrial Ca injection process in the literature [31]. In the present study, Ca addition was conducted once in each experiment. Because of the volatile nature of Ca, the C[Ca],b was assumed to decrease from 0.2 ppm to equilibrium C[Ca],eq following Equation (7) [32] starting at 1 min after Ca addition. The values of C[Ca],eq were calculated using FactSage 7.2 based on the steel chemistries. kCa is the mass transfer coefficient of Ca in steel, which was suggested to be in the range of 2.35 × 10⁻⁴ to 3.53 × 10⁻⁴ m/s in a previous study with a similar experimental approach as the present study [32]. An average value of 2.94 × 10⁻⁴ m/s was used here. The term in Equation (7) is the steel-Ar interfacial area per unit volume of steel calculated based on the geometry of the crucibles.
The diameter change of CaS inclusions was assumed to be neglectable after the solidification was completed. The solidus temperature was estimated to be 1773 K for all experiments using Equation (8) [33], and the estimated value was confirmed with FactSage calculation. So, with a 10 K/min cooling rate, the temperature decrease from 1873 to 1773 K was considered to be 10 min.
3.3. Coarsening Due to Ca Diffusion
It was suggested in the literature that when the coarsening of inclusion is controlled by diffusion, the movement of the steel-inclusion interface can be expressed using Equation (9) [34]. C[Ca],i is the concentration of Ca at the steel-inclusion interface. Its values were calculated using a simplification of the method adapted by Tabatabaei et al. [35]. Assuming the CAx at the surface of CaS type inclusions was insignificant, the calculation started with the mass balance at the interface, as given by Equation (10), where ni denotes the transfer of component i through the boundary layer.
Then, at any r exists
X[i],i is the molar concentration of component i in steel. The mass transfer coefficient, km,i, was suggested to follow the expression as Equation (12) [35]
where d is the diameter of inclusion. Sherwood number, Sh, can be assumed to have a constant value of 2 for small inclusions in liquid steel with low viscosity [36]. Substituting Equation (12) into Equation (11) gives
When modeling the modification of CAx inclusions, the concentration of O dissolved in steel was assumed to be at the level after Al deoxidation and before Ca addition. In other words, calcium would only affect the local steel chemistry at the early stage [35]. Using a similar assumption, the dissolved S content was considered to decrease linearly with time from a measured T.S concentration to the calculated equilibrium dissolved S concentration. Combining all the aforementioned assumptions with the concentration of other steel constituents allow one to determine X[Ca],b and X[S],b. It is common to consider that equilibrium is maintained at the steel-inclusion interface [37,38,39,40]. With the assumption that CAx phases were insignificant at the surface of CaS type inclusions, the only equilibrium established on the CaS surface was Reaction (14).
and must satisfy
where hi is the activity coefficient and is the density of steel. Equilibrium constant, Keq, was calculated based on the standard Gibbs Energy through Equation (16), which is the summation of ∆G° of related reactions from the literature [41,42]. Keq at 1873 K calculated using Equation (16) was confirmed to be similar to Keq proposed in the literature [43,44,45].
Equation (13) was solved in conjunction with Equation (15) to obtain C[S],i and C[Ca],i. The latter was substituted into Equation (9) to calculate the average diameter of CaS type inclusions with time.
3.4. Coarsening Due to the Brownian Motion
The inclusions collide and coalesce due to their random motion. In that case, the change of volumetric inclusion number, NV, can be calculated as suggested in Equation (17) [6,11,46]. NV,0, kB and η are the initial volumetric inclusion number density, Boltzmann constant and steel viscosity, respectively. Equation (18) expresses the conversion from inclusion volume fraction, f, to NV. Equation (18) can be rearranged to write NV as a function of f and r, and NV,0 as a function of f0 and r0. Substituting NV,0 and NV in Equation (17) gives Equation (19). The volume fraction was calculated by first converting the planar size distribution given by ASPEX to volumetric size distribution through the Schwartz–Saltykov method. The detailed procedure is available elsewhere [47]. Then, the total volume of CaS inclusions per unit volume of steel was estimated. The effect of temperature on steel viscosity, μ, was reported in the literature [48]. It covers the temperature from 1783 to 1853 K; therefore, the relation with temperature was extrapolated to 1773 and 1873 K.
3.5. Coarsening Due to Ascending Velocity Difference
Stoke’s law predicts that larger inclusions ascend faster than the small ones. This causes relative motion between inclusions of different sizes, leading to collision and coalescence. The inclusion radius change due to ascending velocity difference can be expressed using Equation (20) [7]. Term is the gravitational acceleration taken as 9.8 m/s2.
3.6. Coarsening Due to the Melt Flow
Inclusions can also be brought to collide and coalesce due to melt flow. In the laboratory experiments, the melt had no controlled stirring. Ca was added during the early stage of an experiment and was rapidly consumed. During the dissolution of Ca, the Ca gas bubbles formed continuously but only for a limited time. Therefore, its contribution to stirring the melt was not taken into account for the coarsening of CaS inclusions in the analysis.
3.7. Coarsening Due to the Multiple Mechanisms Predicted by Population Balance Equation (PBE)
Smoluchowski [11] formulated the particle coagulation kinetics through PBE. A general form, Equation (21), expresses the rate of change of the volumetric number density of CaS inclusions in group k, . The volumetric population density of inclusions with size k, NV,k, can increase due to the coalescence of a pair of inclusions from group i and group j, which is the first term of Equation (21). The second term is the expression of inclusions becoming too large to remain in group k after coalescing with another inclusion of sufficiently large size. The number densities of CaS inclusions in group i and j are represented by NV,i and NV,j, respectively. βC is the collision frequency function that quantifies the collective effects of Brownian motion, βB, Stokes motion, βS, as well as the turbulent flow, βT, and laminar flow, βG, on the growth of CaS inclusions. The detailed expressions are shown as Equations (22)–(26) [12]. is the energy dissipation rate that quantifies the stirring power, and was also suggested to be correlated to α, the coagulation coefficient [49]. is the velocity gradient in the laminar shear zones, which are usually near the walls [12].
In a later section, the combined contribution of relevant collision-related coarsening mechanisms on the evolution of PSD of CaS inclusions calculated using the PBE will be discussed. The particle-size-grouping (PSG) method introduced in the work of Nakaoka et al. [50] was used to simplify the calculation of PBE. This method was confirmed to give approximation close to the exact solution and had been used extensively in previous studies [51,52,53].
4. Results
4.1. CaS Growth in Experimental Conditions
Figure 3 shows the evolution of the area fraction (AF) of all inclusion types from the three laboratory experiments. The details of the evolution of inclusion types were discussed in the authors’ previous publication [2]. The value for the AF of CaS inclusions increased continuously over time in Exp. 2035 and 3035. By the end of the 20-min experiment, the values for AF of CaS were 44 and 22 ppm in Exp. 2035 and 3035, respectively. The authors suggested that CaS inclusions were stable at 1873 K [2], so these inclusions were reaction products. In Exp. 2025, in comparison, CaS was thermodynamically stable in the first 10 min after Ca addition, but the AF values were low at around 2 ppm. The AF of CaS increased to 6 ppm in the 20-min sample, followed by a slight decrease in the 40-min sample, but high CaS AF was again observed in the bulk sample to be 12 ppm. Some CaS-CAx complexes, classified as CaS-other inclusions, were also found in these experiments. SEM images and EDS mappings of typical CaS inclusions are shown in Figure 4 to provide some insight about their shape and structures. One can easily notice that the CaS inclusions were close to spherical. Therefore, in both methods of determining the coarsening mechanisms, CaS inclusions were assumed to be spherical for simplicity.
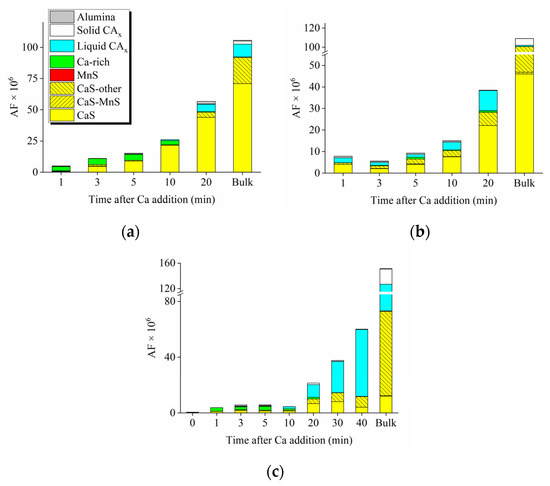
Figure 3.
Evolution of area fraction (AF) of inclusions in (a) Exp. 2035, (b) Exp. 3035, and (c) Exp. 2025.
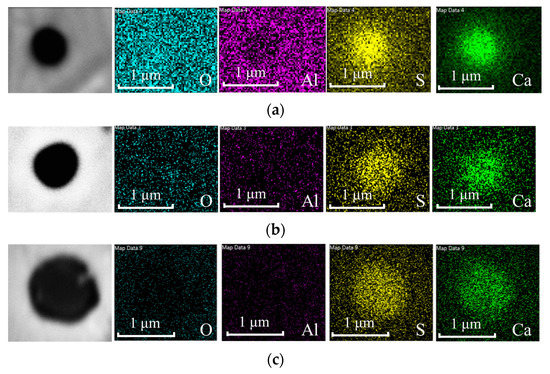
Figure 4.
SEM-EDS elemental maps of CaS inclusion in (a) 1-min sample of Exp. 2035, (b) 3-min sample of Exp. 2035 and (c) 20-min sample of Exp. 3035.
The evolutions of the average diameter and the composition of CaS type inclusions are shown in Figure 5. The CaS type inclusions in samples taken in Exp. 2035 were composed of initially 27 wt. pct. CaO. The fraction of CaO phase decreased to 3 wt. pct when the experiment was close to the end. Because Ca mainly reacted with O in the early stage (Figure 3a), CaS type inclusions (whose number was small) contained approximately 10 wt. pct. MnS. As more CaS formed as Exp. 2035 proceeded, less S was available to react with Mn, so MnS content in CaS decreased. Some concentration of Al2O3 phase was also found in the CaS type inclusions. CaS fraction increased from 58 wt. pct. to 88 wt. pct. during the 20 min experiment. In Exp. 3035, on the contrary, the fraction of CaO phase never exceeded 4 wt. pct. and the maximum MnS phase fraction was at 8 wt. pct. because CaS inclusions were formed directly [2] through Ca and S reaction. As a result, the fractions of CaS were constantly above 82 wt. pct. The distribution of phases within CaS inclusions from Exp. 2025 were similar to that of Exp. 2035 in the early stages. The fraction of CaO phase can be higher than 25 wt. pct. during the first 10 min after Ca addition. That was because Al was not added before Ca addition; hence, a significant portion of Ca added reduced Al2O3 from the crucible and became a vital oxygen bearer. However, starting at 10 min, the fraction of the CaS phase was constantly higher than 75 wt. pct.
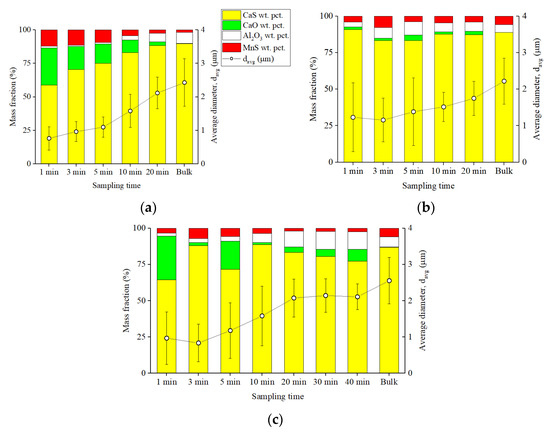
Figure 5.
Average diameters and compositions of CaS type inclusions in (a) Exp. 2035, (b) Exp. 3035, and (c) Exp. 2025.
Both the average diameters and the standard deviations of the CaS inclusions are included in Figure 5. In Exp. 2035, at least 150 CaS inclusions were analyzed in each sample by ASPEX, except for the first sample, in which the number of inclusions was 41. The average diameter of CaS inclusions was initially 0.8 μm, then gradually increased to about 2.1 μm within 20 min after Ca addition at 1873 K, then slightly increased further to 2.4 μm in the bulk sample. The standard deviation for the average diameter values increased marginally from about 0.3 to 0.4 μm. In Exp. 3035, 26 CaS inclusions were detected in the first sample. The number of CaS in later samples varied from 60 to 628. CaS average diameter increased from 1.2 to 1.7 μm, and increased by another 0.5 μm during solidification to end with 2.2 μm average diameter in the final bulk sample. Because of the relatively smaller number of CaS inclusions analyzed, especially in the first sample, the standard deviation fluctuated in Exp. 3035. The number of CaS inclusions detected in Exp. 2025 was lower than in Exp. 2035 and Exp. 3035 because of the relatively lower Ca content and S content. In most samples of Exp. 2025, the number of detected CaS can be as low as 10, such as in the 1-min sample. The number gradually increased to about 50 in the 20, 30, and 40-min samples. In bulk, a total of 104 CaS inclusions were analyzed by ASPEX. During the first 20 min of Exp. 2025, the average diameter of CaS increased from 1 to 2.1 μm. Thereafter, generally it did not change until the last bulk sample, which was found to be 2.6 μm. Notice that a decrease in standard deviation from 0.8 to 0.5 μm occurred at 20 min.
The detailed evolution of CaS particle size distributions (PSD) of the three experiments is shown in Figure 6. The x-axis and the y-axis are shown in logarithmic form for better visualization. The increase in the average diameter and the planer number density (NA) of CaS inclusions from Exp. 2035 were apparent during the first 5 min after Ca addition. The CaS showed a log-normal distribution starting at 3 min, indicated by the iconic parabolic shape [54,55,56]. One can notice that the left side of the 1, 3, and 5-min PSD curves overlapped. This trend means a consistent “supply” of newly formed small inclusions. High-temperature phenomena including inclusion formation were rarely reported to be limited by the chemical reaction rate [7,12,35,57,58], so the formation of new, small inclusions would largely depend on the rate of mass transport in the early stage of the experiment. As the experiment proceeded, the PSD curve shifted rightward while keeping a similar shape from 5 min to 20 min after Ca addition, indicating the disappearance of smaller inclusions. This was considered the result of collision and coalescence.


Figure 6.
The particle size distribution of CaS type inclusions in (a,b) Exp. 2035, (c,d) Exp. 3035, and (e,f) Exp. 2025.
During the first 5 min of the Exp. 3035, the PSD curve barely changed. That was potentially related to lower Ca supply in Exp. 3035 than that of Exp. 2035. In Exp. 3035, the total Ca content was initially 42 ppm and remained stable. Then, the dissolved Ca concentrations were likely lower in Exp. 3035. This would affect the growth rate of CaS inclusions when mass transport was the controlling mechanism. However, as the CaS inclusions grew over time, they became detectable. And with the collision occurring at the same time, inclusions coalesced, and the rightward shift of the PSD curve became apparent, as seen from the 10-min PSD curve in Figure 6d. The following steps of the Exp. 3035 at 1873 K were similar to the later stages of Exp. 2035.
Similarly, CaS inclusions in Exp. 2025 started with a relatively high number of submicron inclusions. The PSD remained almost unchanged in the first 3 min after Ca addition. Then, until 10 min, the PSD curve shifted rightward, with the peak moved from davg equals 0.8 to 1.3 μm. Because of the presence of submicron size inclusions, the growth of CaS inclusions was still mainly relevant to mass transport. A sudden change in the shape of PSD was observed at 20 min after Ca addition, where small CaS inclusions disappeared, and NA of inclusions larger than 2 μm drastically increased compared to the previous sample. This can be considered to signify the coarsening through collision and coalescence.
During solidification, the PSD curve evidently broadened and deviated from the symmetrical shape seen in the last pin sample in all experiments. In Exp. 2035, the NA of CaS inclusions with a diameter larger than 3.25 μm (log(davg) > 0.51) shown as the right side of the PSD evidently increased, while the left side of the PSD peak remained practically unchanged. A similar trend can also be observed in Exp. 2025 in Figure 6f. In Exp. 3035, the entire PSD shifted further to the right during solidification, and the width of the curve increased. These observations were correctly reflected by the change of average diameter and standard deviation shown in Figure 5, which were potentially due to the precipitation of CaS phase and MnS phase on CaS type inclusions.
4.2. CaS Growth in Industrial Conditions
The coarsening behaviors of CaS inclusions in samples taken from ladle and tundish during steel-refining processes are evaluated in this section. For this purpose, lollipop samples from four industrial heats were studied. The evolution of the average diameter of CaS type inclusions with respect to sample number is shown in Figure 7. In Figure 7, small offsets are introduced on the x-axis to improve readability.

Figure 7.
Evolution of the average diameters of CaS type inclusions in samples taken from (a) Heats 1 and 3–30 ppm S and 35 ppm T.Ca and (b) Heats 4 and 5–20 ppm S and 35 ppm T.Ca.
Figure 7 suggests that once the CaS type inclusions were observed, their average diameters were already at around 2 μm regardless of heat chemistries. In Exp. 2035 and Exp. 3035, it took about 20 min for the average diameter of CaS to increase to slightly above 2 μm. This was longer than the roughly 5-min Ca addition in industrial conditions, meaning that some differences exist between the coarsening of CaS in the two conditions. Comparing the first tundish sample (T1) with the ladle sample after Ca addition (L5), the increase in CaS average diameter is apparent. In Heat 1 and Heat 5, the difference between T1 and L5 was 0.6 and 0.9 μm, respectively. For Heat 3 and Heat 4, the difference was higher at 1.6 μm.
The evolution of the PSD of CaS inclusions in Heat 1 is shown in Figure 8 for a more detailed discussion. It is worth mentioning that Figure 8 is based on the ASPEX analysis, including inclusions with dmax (longest diameter of a non-spherical inclusion) larger than 0.5 μm. This will be referred to as 0.5 μm analysis for simplicity. All other plots and related discussions are based on the ASPEX analysis, including inclusions with dmax > 2 μm. The ASPEX processing time drastically increased when decreasing the dmax threshold from 2 to 0.5 μm, so the 0.5 μm analysis was only performed on samples of Heat 1.

Figure 8.
The evolution of particle size distribution for CaS type inclusions in Heat 1 including inclusions with dmax > 0.5 μm (a) ladle samples and (b) tundish samples.
Figure 8a includes the PSD of CaS inclusions from all the ladle samples in Heat 1. One can see that the PSD shares a very similar pattern in all five ladle samples. Small CaS inclusions formed immediately after Ca addition, showing the parabolic shape associated with the typical log-normal distribution. During the Ca addition from L1 to L5, the number density (NA) of all sizes increased. This caused the PSD curves to remain similar in all ladle samples, with the peak at around log(davg) equal to 0. This is reflected in Figure 7 by a stable average CaS inclusion diameter. The change in the PSD of CaS inclusions from ladle to tundish was very apparent in Figure 8b. The PSD of tundish samples compared to the PSD of ladle samples appeared much broadened and shifted rightward. This is reflected in Figure 7a by the increased average diameter and standard deviation in T1 compared to L5. At 33 min after Ca addition, the NA of inclusions with log(davg) < 0.24 decreased by at least one order of magnitude, while the NA of inclusions with log(davg) > 0.24 slightly increased.
5. Discussion
The evolution of PSD in all three experiments suggests that the diameter change of CaS inclusions was related to mass transport in the early stage and later depended on coagulation. To better understand the inclusion coarsening kinetics, the present work compares the change of average diameter of CaS inclusions observed through the experiments with models explained in the previous section.
5.1. Coarsening Mechanisms of CaS Inclusions under Experimental Conditions
The diameter change calculated using the methods explained in the previous sections was plotted and compared with the observed average diameters of CaS inclusions in Exp. 2035, Exp. 3035 and Exp. 2035 in Figure 9. For modeling calculations, the initial diameter of CaS inclusions was set to be 0.01 μm in all conditions. The final diameter predicted from lowest to highest are through the mechanisms of Stokes motion, Ostwald ripening, diffusion-controlled growth, and Brownian motion for all three experiments. The diameter changes due to Ostwald ripening and Stokes motion are insignificant, with less than 0.2 μm regardless of experimental conditions, which clearly underpredict the CaS inclusions diameter change. The diffusion-controlled growth shows a rapid increase in the first 5 min but then decreases. The predicted diameter decrease is much more apparent in Exp. 3035 than the other two experiments. The Brownian motion predicts the most significant change among the four mechanisms included in Figure 9. The CaS inclusion diameters are expected to increase by 2.0, 1.9, and 1.3 μm in Exp. 2035, Exp. 3035 and Exp. 2025, respectively.

Figure 9.
Comparison of the average diameters of CaS type inclusions in samples taken in (a) Exp. 2035, (b) Exp. 3035, and (c) Exp. 2025, and predicted using different coarsening mechanisms.
The authors noticed that the diffusion-controlled growth agrees with the experimental results in the first 5 min after Ca addition when assuming the initial dissolved Ca concentration being 0.1 ppm for Exp. 2035 and 0.15 ppm for Exp. 3035 and Exp. 2025. After that, the rate of growth controlled by Brownian motion is very similar to the experimentally observed growth rate. In fact, if considering the dominant CaS coarsening mechanism changed from Ca diffusion to Brownian motion at 5 min after Ca addition, one can obtain Figure 10. The solid lines in Figure 10 are the theoretical change due to diffusion already shown in Figure 9. The dashed lines were calculated by simply taking the average diameter calculated for diffusion-controlled growth at 5 min as the initial diameter and calculating the diameter change considering Brownian motion thereafter. A reasonable agreement between the experimental results and the models can be achieved by considering the transition between coarsening mechanisms. The diameter change in Exp. 3035 was over-predicted by the model for Brownian motion. Equation (19) shows that the radius change is related to the ratio of the new-to-old volume fraction . If not, all f0 participated in the formation of new CaS inclusions, for example, when some formed CaS-other inclusions, would be over-predicted; hence, so would r. Diffusion-controlled CaS formation/dissolution predicts a major decrease in the average diameter of CaS inclusions in Exp. 2035 and Exp. 2025 and some decrease in Exp. 3035 (Figure 9 black lines). In reality, diffusion-controlled growth and coarsening through Brownian collision must have occurred simultaneously. Overprediction was observed in Figure 10 because the diameter decrease due to diffusion was not incorporated in the calculation of dashed lines shown in Figure 10.

Figure 10.
Comparison of the average diameters of CaS type inclusions in samples taken from (a) Exp. 2035, (b) Exp. 3035, and (c) Exp. 2025, and predicted based on diffusion-controlled growth followed by Brownian motion.
The authors are aware that the theoretical growth shown in Figure 10 cannot accurately predict the diameter of CaS inclusions in the course of experiments. However, the focus of the present study is not to establish a model that calculates the CaS diameter change but to determine the coarsening mechanisms. Figure 9 and Figure 10 do show that none of the four coarsening mechanisms considered can independently explain the growth of CaS observed in Exp. 2035, Exp. 3035 and Exp. 2025. A transition of the controlling coarsening mechanism is clear in the experiments. The diameter change of CaS inclusions was initially governed by the diffusion and later related to Brownian-motion-driven collisions.
5.2. Cause of Change in Coarsening Mechanisms
The authors further analyzed the cause of the change in the dominating coarsening mechanism. The change in the driving force over experimental time was calculated for the diffusion-controlled growth mechanism, as shown in Figure 11. According to Equation (7), the Ca concentration in metal bulk, C[Ca],b, decreased over time; therefore, the driving force rapidly reduced. In other words, the influence of Ca diffusion on the size change of CaS inclusions became insignificant. The coarsening of CaS inclusions stopped after 5 min from Ca addition (Figure 9). Later, the driving force in Exp. 2035 and Exp. 2025 was negative while that of Exp. 3035 remained much closer to 0. The variation in driving force is related to the difference in sulfur content. With a higher C[S],i given by the lower S levels, C[Ca],i to maintain Equilibrium (14) in Exp. 2035 and Exp. 2025 were higher than that of Exp. 3035. So, the concentration differences, C[Ca],b − C[Ca],i, from Equation (9) were slightly negative starting from 10 min after Ca addition; hence, negative slopes were seen in Figure 9a,c. The lower C[Ca],i in Exp. 3035 was able to maintain C[Ca],b − C[Ca],i much closer to 0 before Exp. 3035 ended, so the theoretical diameter change due to diffusion is less apparent in Figure 9b. Further, for all experimental conditions, the importance of Brownian motion on the coarsening of CaS inclusions increased over time. This is due to the fact that Brownian motion largely depends on the volume fraction of inclusions of interest. The volume fraction of CaS inclusions increased with time as shown in Figure 12 for all three experiments. The Brownian motion eventually became the dominant coarsening mechanism at 5 min after Ca addition.
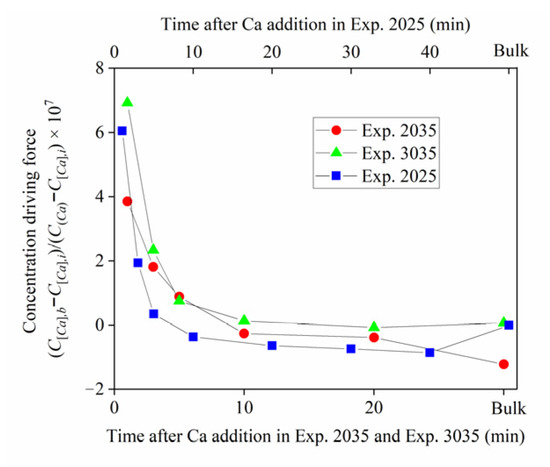
Figure 11.
Change of driving force for Ca diffusion in Exp. 2035, Exp 3035, and Exp. 2025.

Figure 12.
Variation in the volume fraction of CaS inclusions over time in Exp. 2035, Exp. 3035, and Exp. 2025.
The significance of Brownian motion over the Stokes motion can be explained by the difference in frequency of collision. The change in collision frequency function, β, of inclusion pairs with a diameter di and dj is shown in Figure 13. Figure 13a–d correspond to di equal to 0.5, 1, 2, and 3 μm, respectively. These values cover the diameter range of CaS type inclusions shown in Figure 5a. The range of dj was set from 0 to 4 μm in all four plots. The temperature was set to 1873 K and the viscosity was equal to 2.3 × 10⁻³ kg/(m·s). The values for steel density and CaS density were 6975 and 2650 kg/m3, respectively. Even though the densities were estimated, the authors confirmed that slight density change opposes minor change on the orders of magnitudes of β values; hence, it has no impact on the findings.

Figure 13.
Comparison of collision frequency function of Brownian motion and Stokes motion for an inclusion of diameter di (a) 0.5 μm, (b) 1 μm, (c) 2 μm, (d) 3 μm and varied dj.
In Figure 13, the frequency function of Brownian motion, βB, remains stable at the same order of magnitude, i.e., around −17 to −16 m3/s, for all four di. The values are slightly higher at lower dj, but decrease to a stable level as dj increases. In comparison, when di < 2 μm, βS values are generally lower than that of βB until dj increases to higher than approximately 2.5 μm. That is partially due to the presence of the dip at dj equals to di. The reason being inclusions of similar sizes show no relative motion while ascending; hence, they cannot coalesce during flotation. The βS are higher than βB in Figure 13d across almost the entire dj range. Based on Figure 5 and Figure 13, it can be inferred that the frequency of inclusions to collide is higher due to Brownian motion than due to Stokes motion in almost the entire size range of CaS type inclusions observed in the experimental conditions. As a result, the prediction given by the Brownian motion model is relatively more in agreement with the experimental data, as seen in Figure 9. The collision frequency due to Stokes motions is higher when an inclusion in an inclusion pair is close to 3 μm. Still, according to Figure 5 and Figure 6, inclusions of such diameters are a small portion of the entire CaS population in the experiments, and they are mainly found close to the end of experiments. With the limited available time for further collision, the effect of Stokes motion is understandably low.
The analysis of three experimental results strongly suggests that the coarsening of CaS inclusions would be governed by the diffusion-controlled growth mechanism in laboratory conditions when Ca supply is sufficient for a limited time. After Ca evaporates, CaS inclusions may either stop growing or start to dissociate. Because of that, the growth will depend more on the Brownian collision. These findings are in line with the general trend, i.e., diffusion to collision transition reported in the previous studies [12,59], and should also be applicable to industrial conditions where the growth of CaS inclusions is not interfered by the steel flow. At the current stage, a mathematical model incorporating all coarsening mechanisms has not been established yet to predict the evolution of PSD of CaS inclusions. It will be the focus of a later study.
5.3. Coarsening Mechanisms of CaS Inclusions under Industrial Conditions
To determine the coarsening mechanism of CaS inclusions under industrial conditions, the effects of collision-related mechanisms on the rate of CaS volumetric population density were calculated using Equations (21)–(26).
The collision-related coarsening mechanisms in industrial conditions include Brownian motion, Stokes motion, and laminar and turbulent flows. For Equations (22) and (23), a constant viscosity of 2.55 × 10⁻³ kg/(m·s) was used. The energy dissipation rate, , varies with operation conditions and locations in ladle and tundish. The exact values were not measured during the sampling of industrial heats available for this study. However, it was reported that when gas was injected at a rate of 8.4 m3/hr, the velocity gradient varied from 0.7 to 3.5 s−1, and the energy dissipation rate was from 0.001 to 0.007 m2/s3 close to the top of the ladle, where samples were taken [60]. Similar values were also reported in other studies [61,62]. With a similarly low Ar flow rate used in Heat 1, the velocity gradient, , of 2 s−1 was used to calculate βG, and βT was calculated using equals 1 × 10⁻³ m2/s3. The values of coagulation coefficient, , were estimated using the data reported for the steel-Al2O3 system by Taniguchi et al. [49], as data of the steel-CaS system were not available in the literature. The calculation was conducted for both the ladle and tundish samples of Heat 1. The data of 0.5 μm analysis was used as the input to calculate the rate of change due to collisions using PBE and compared with the apparent rate of change . The values for were calculated through dividing the NV difference between the two samples by elapsed time between them. The comparisons are shown in Figure 14.

Figure 14.
Comparison of the observed rate of change of CaS population density and the calculated rate of change of population density due to collision in the ladle at (a) 1 min and 2 min, (b) 3 min, and (c) 4 min after Ca addition, and (d) in tundish at 33 min after Ca addition.
Figure 14a shows that in the first three minutes after Ca injection started, the are evidently positive for inclusions lower than 2 μm. This is already shown in Figure 8. However, the calculated appears to be effectively a straight line, suggesting at the time that the combined effects of Brownian motion, Stokes motion, and laminar and turbulent flow cannot explain the growth of CaS inclusions. Considering that the actual PSD changes (red marks in Figure 14) are the results of growth by diffusion and coalescence, the authors suggest that during the first three minutes of Heat 1, the diffusion control would be the dominant mechanism for CaS inclusions growth. A similar explanation could be offered for the inclusion growth from 3 min to 4 min after Ca injection started, as shown in Figure 14b. The only exception is that the PBE predicted the PSD change due to collision to become slightly more noticeable compared to the earlier stages but is still lower than . However, at the very end of Ca addition, similarities between and can be spotted. Starting from davg equals 1.5 μm or higher (log(davg) > 0.18), the observed and PBE predicted number density change are generally the same in Figure 14c. The effect of diffusion was still significant, as disagreement can be found for the rate of change of inclusions smaller than 1.5 μm (log(davg) < 0.18). The peak of in Figure 14c is not as apparent as that is in Figure 14a,b because of the negative . The phenomenon in Figure 14c suggests that the effect of coalescence became comparable with diffusion only at the very end of the Ca injection process. No sample was taken from the ladle later than 5 min after Ca injection started, but based on the trend shown from Figure 14a–c, the similarity between curves of and is highly likely to further increase.
In the tundish, the values of drastically decreased compared to those for samples from the ladle. The change was less than 500 cm−3s−1 in all size groups, with the maximum value seen for inclusions with davg between 2 and 2.5 μm. This is again very different from the calculated due to collision and coalescence. This finding suggests that diffusion was still an important mechanism for CaS inclusions’ growth in the tundish.
Overall, Figure 14 suggests that the growth of CaS inclusions in Heat 1 depended dominantly on diffusion-controlled growth at the early stage because the size of inclusions was small during this time. As the volume fraction of inclusions increased, the effect of collision and coalescence became comparable. There was a constant supply of Ca during injection [31], so CaS grew by Ca diffusion throughout the ladle-refining process. During the tundish treatment, even though the Ca injection stopped, the decreased temperature must reduce the extent of modification of CAx and the solubility of Ca. Both prevented the dissolved Ca concentration from dropping; hence, CaS inclusions could continue growing through diffusion. The authors suggest that a similar route also occurred for Heats 3 to Heat 5. However, analyses provided in Figure 14 cannot be generated for those heats because only one sample was taken from the ladle, and the 0.5 μm analysis was not conducted.
The contribution of different collision-related coarsening mechanisms, i.e., Brownian motion, Stokes motion, and laminar and turbulent flow, can be quantified using the β values. The comparisons are shown in Figure 15. di and dj in Figure 15 include the range of CaS inclusions seen in the industrial samples.
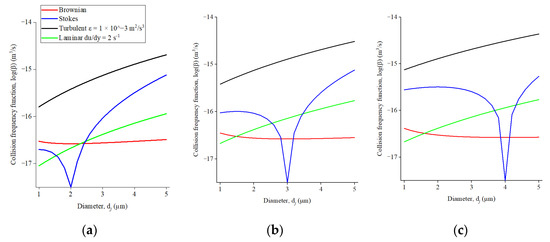
Figure 15.
Comparison of collision frequency function for Brownian motion, Stokes motion, and laminar and turbulent flow for an inclusion with a diameter di of (a) 2 μm, (b) 3 μm, (c) 4 μm and varied dj.
Figure 15 shows that the values for βT can reach up to −14 order of magnitude when one assumes the energy dissipation rate of 1 × 10⁻³ m2/s3. The values for βT are always higher than those of βB, βS and βG. The values of βB and βG are about one order of magnitude less regardless of the inclusion sizes. The values for can reach close to those for βT for some combinations of di and dj. For example, when di and dj are equal to 2 μm and 5 μm, the values for βT and βS are 2.04 × 10⁻¹⁵ and 7.6 × 10⁻¹⁶ m3/s, respectively (Figure 15a). In such a scenario, both mechanisms are responsible for the coarsening of CaS inclusions, while in other cases, the contribution of turbulent flow was dominant over the other three mechanisms. The significance of turbulent flow had also been reported in previous theoretical studies [60,63].
Overall, this study suggests that the coarsening mechanisms of CaS type inclusions followed the same route in experimental and industrial conditions. When there is sufficient Ca available at the early stage, diffusion-controlled growth is particularly critical. After more CaS inclusions formed, the increased collision volume and in some cases decreased dissolved Ca concentration made the coarsening process depend on collision-related coarsening mechanisms. As in the laboratory conditions, the dominant mechanism later becomes Brownian motion with the absence of flow. When the system is stirred like the industrial conditions, the turbulent flow will influence the coarsening process.
6. Conclusions
The coarsening mechanisms of CaS inclusions under experimental and industrial conditions were studied in this work. The findings are summarized as follows:
- Under the experimental conditions, the coarsening rate of CaS inclusions is initially controlled by the Ca diffusion. As experiments proceed, the rate of diffusion-controlled growth decreases with the rate of Ca transport due to the decrease in Ca concentration in steel. During the same time, the volume fraction of CaS inclusions increases, and the Brownian motion becomes a controlling coarsening mechanism.
- Determining the coarsening mechanisms based on the similarities between the observed and the calculated diameters of inclusions has the limitation of not incorporating the effect of each mechanism when the growth of inclusions depends on multiple mechanisms for an extended time. Hence, such a method may be only appropriate if there is limited or no mechanism change or the transition time is short, as seen in some experiments.
- The increasing importance of the collision-dependent coarsening mechanism also occurs in industrial conditions. Because of the stirring effects in ladle and tundish, the turbulent flow becomes responsible for the CaS size change sometime after Ca injection starts. Because of the stable Ca supply during Ca injection and the decrease in the modification extent of CAx, the diffusion-controlled growth remains important during both ladle and tundish treatments.
Author Contributions
Conceptualization, K.M., M.N. and N.D.; methodology, K.M. and M.N.; software, K.M.; formal analysis, K.M.; investigation, K.M.; writing—original draft preparation, K.M.; writing—review and editing, K.M., M.N. and N.D.; supervision, N.D.; project administration, N.D.; funding acquisition, N.D. All authors have read and agreed to the published version of the manuscript.
Funding
This research was funded by Natural Sciences and Engineering Research Council of Canada, Project Number CRDPJ=505545-16.
Data Availability Statement
Not applicable.
Acknowledgments
The authors want to thank Stanley Sun and Li Sun at ArcelorMittal Dofasco for their valuable time and fruitful discussions. The authors also acknowledge Canadian Centre for Electron Microscopy (CCEM) at McMaster University for assistance with SEM analysis.
Conflicts of Interest
The authors declare no conflict of interest. The funders had no role in the design of the study; in the collection, analyses, or interpretation of data; in the writing of the manuscript, or in the decision to publish the results.
References
- Verma, N.; Pistorius, P.C.; Fruehan, R.J.; Potter, M.; Lind, M.; Story, S.R. Transient Inclusion Evolution during Modification of Alumina Inclusions by Calcium in Liquid Steel: Part II Results and Discussion. Metall. Mater. Trans. B 2011, 42, 720–729. [Google Scholar] [CrossRef]
- Miao, K.; Nabeel, M.; Dogan, N.; Sun, S. Experimental Study of Inclusion Modification by Ca in AHSS. Metall. Mater. Trans. B Process Metall. Mater. Process. Sci. 2021, 52, 3151–3166. [Google Scholar] [CrossRef]
- Verma, N.; Pistorius, P.C.; Fruehan, R.J.; Potter, M.; Lind, M.; Story, S. Transient Inclusion Evolution during Modification of Alumina Inclusions by Calcium in Liquid Steel: Part I Background Experimental Techniques and Analysis Methods. Metall. Mater. Trans. B 2011, 42, 711–719. [Google Scholar] [CrossRef]
- Liu, Y.; Zhang, L.; Zhang, Y.; Duan, H.; Ren, Y.; Yang, W. Effect of Sulfur in Steel on Transient Evolution of Inclusions during Calcium Treatment. Metall. Mater. Trans. B 2018, 49, 610–626. [Google Scholar] [CrossRef]
- Geldenhuis, J.M.A.; Pistorius, P.C. Minimisation of Calcium Additions to Low Carbon Steel Grades. Ironmak. Steelmak. 2000, 27, 442–449. [Google Scholar] [CrossRef]
- Ohta, H.; Suito, H. Effects of Dissolved Oxygen and Size Distribution on Particle Coarsening of Deoxidation Product. ISIJ Int. 2006, 46, 42–49. [Google Scholar] [CrossRef]
- Suzuki, M.; Yamaguchi, R.; Murakami, K.; Nakada, M. Inclusion Particle Growth during Solidification of Stainless Steel. ISIJ Int. 2001, 41, 247–256. [Google Scholar] [CrossRef]
- Wang, L.; Li, J.; Yang, S.; Chen, C.; Jin, H.; Li, X. Nucleation and Ostwald Growth of Particles in Fe-O-Al-Ca Melt. Sci. Rep. 2018, 8, 1135. [Google Scholar] [CrossRef]
- Zhang, L.; Pluschkell, W. Nucleation and Growth Kinetics of Inclusions during Liquid Steel Deoxidation. Ironmak. Steelmak. 2003, 30, 106–110. [Google Scholar] [CrossRef]
- Sahai, Y.; Sinha, A.K. Mathematical Modeling of Inclusion Transport and Removal in Continuous Casting Tundishes. ISIJ Int. 1994, 33, 556–566. [Google Scholar] [CrossRef]
- Smoluchowski, M.V. An Experiment on Mathematical Theorization of Coagulation Kinetics of the Colloidal Solutions. Z. Phys. Chem. 1917, 92, 129–168. [Google Scholar]
- Zhang, J.; Lee, H.G. Numerical Modeling of Nucleation and Growth of Inclusions in Molten Steel Based on Mean Processing Parameters. ISIJ Int. 2004, 44, 1629–1638. [Google Scholar] [CrossRef]
- Yin, X.; Sun, Y.; Yang, Y.; Deng, X.; Barati, M.; McLean, A. Effect of Alloy Addition on Inclusion Evolution in Stainless Steels. Ironmak. Steelmak. 2017, 44, 152–158. [Google Scholar] [CrossRef]
- Rimbert, N.; Claudotte, L.; Gardin, P.; Lehmann, J. Modeling the Dynamics of Precipitation and Agglomeration of Oxide Inclusions in Liquid Steel. Ind. Eng. Chem. Res. 2014, 53, 8630–8639. [Google Scholar] [CrossRef]
- Li, C.; Cai, R. Tutorial: The Discrete-Sectional Method to Simulate an Evolving Aerosol. J. Aerosol Sci. 2020, 150, 105615. [Google Scholar] [CrossRef]
- Schamber, F. Introduction to Automated Particle Analysis by Focused Electron Beam; ASPEX Corp: Delmont, PA, USA, 2011; pp. 1–7. [Google Scholar]
- Lu, D. Kinetics, Mechanisms and Modelling of Calcium Treatment of Steel. Ph.D. Thesis, McMaster University, Hamilton, ON, Canada, 1992. [Google Scholar]
- Beskow, K.; Viswanathan, N.N.; Jonsson, L.; Sichen, D. Study of the Deoxidation of Steel with Aluminum Wire Injection in a Gas-Stirred Ladle. Metall. Mater. Trans. B 2001, 32, 319–328. [Google Scholar] [CrossRef]
- Oikawa, K.; Ohtani, H.; Ishida, K.; Nishizawa, T. The Control of the Morphology of MnS Inclusions in Steel during Solidification. ISIJ Int. 1995, 35, 402–408. [Google Scholar] [CrossRef]
- Allibert, M.; Gaye, H.; Geisler, J.; Janke, D.; Keene, B.J.; Kirner, D.; Kowalski, M.; Lehmann, J.; Mills, K.C.; Neuschutz, D.; et al. Slag Atlas, 2nd ed.; Eisenhuttenleute, V.D., Ed.; Verlag Stahleisen GmbH: Dusseldorf, Germany, 1995; ISBN 3-514-00457-9. [Google Scholar]
- Yang, W.; Duan, H.; Zhang, L.; Ren, Y. Nucleation, Growth, and Aggregation of Alumina Inclusions in Steel. JOM 2013, 65, 1173–1180. [Google Scholar] [CrossRef]
- Li, Z.; Zeze, M.; Mukai, K. Surface Tension and Wettability of Liquid Fe-16mass%Cr-S Alloy with Alumina. Mater. Trans. 2003, 44, 2108–2113. [Google Scholar] [CrossRef]
- Ogino, K. The Wettability of Solid Oxides by Liquid Iron. Tetsu-to-Hagane 1973, 59, 1237. [Google Scholar] [CrossRef]
- Pradhan, D.; Mantha, D.; Reddy, R.G. Thermodynamics of Interfacial Properties between Liquid Iron, Liquid Silicon and Solid Oxide Substrates. High Temp. Mater. Process. 2009, 28, 203–210. [Google Scholar] [CrossRef]
- Poirier, D.R.; Yin, H.; Suzuki, M.; Emi, T. Interfacial Properties of Dilute Fe-O-S Melts on Alumina Substrates. ISIJ Int. 1998, 38, 229–238. [Google Scholar] [CrossRef]
- Robie, R.A.; Bethke, P. Molar Volumes and Densities of Minerals; Unites States Department of the Interior Geological Survey: Washington, DC, USA, 1962. [Google Scholar]
- Crawley, A.F. Densities of Liquid Metals and Alloys. Int. Metall. Rev. 1974, 19, 32–48. [Google Scholar] [CrossRef]
- Baldan, A. Progress in Ostwald Ripening Theories and Their Applications to Nickel-Base Superalloys. Part I: Ostwald Ripening Theories. J. Mater. Sci. 2002, 37, 2171–2202. [Google Scholar] [CrossRef]
- Voorhees, P.W. The Theory of Ostwald Ripening. J. Stat. Phys. 1985, 38, 231–252. [Google Scholar] [CrossRef]
- Yao, J.H.; Elder, K.R.; Guo, H.; Grant, M. Theory and Simulation of Ostwald Ripening. Phys. Rev. B 1993, 47, 14110–14125. [Google Scholar] [CrossRef]
- Tabatabaei, Y.; Coley, K.S.; Irons, G.A.; Sun, S. Model of Inclusion Evolution during Calcium Treatment in the Ladle Furnace. Metall. Mater. Trans. B 2018, 49, 2022–2037. [Google Scholar] [CrossRef]
- Zhang, L.; Liu, Y.; Zhang, Y.; Yang, W.; Chen, W. Transient Evolution of Nonmetallic Inclusions during Calcium Treatment of Molten Steel. Metall. Mater. Trans. B 2018, 49, 1841–1859. [Google Scholar] [CrossRef]
- Diederichs, R.; Bleck, W. Modelling of Manganese Sulphide Formation during Solidification, Part I: Description of MnS Formation Parameters. Steel Res. Int. 2006, 77, 202–209. [Google Scholar] [CrossRef]
- Wilkinson, D.S. Mass Transport in Solids and Fluids; Cambridge University Press: Cambridge, UK, 2000. [Google Scholar]
- Tabatabaei, Y.; Coley, K.S.; Irons, G.A.; Sun, S. A Multilayer Model for Alumina Inclusion Transformation by Calcium in the Ladle Furnace. Metall. Mater. Trans. B 2018, 49, 375–387. [Google Scholar] [CrossRef]
- Szekely, J.; Themelis, N.J. Rate Phenomena in Process Metallurgy; John Wiley & Sons Inc.: New York, NY, USA, 1971; pp. 609–617. [Google Scholar]
- Bouris, D.; Bergeles, G. Investigation of Inclusion Re-Entrainment from the Steel-Slag Interface. Metall. Mater. Trans. B 1998, 29, 641–649. [Google Scholar] [CrossRef]
- Okuyama, G.; Yamaguchi, K.; Takeuchi, S.; Sorimachi, K. Effect of Slag Composition on the Kinetics of Formation of Al2O3 MgO Inclusions in Aluminum Killed Ferritic Stainless Steel. ISIJ Int. 2008, 40, 121–128. [Google Scholar] [CrossRef]
- Park, J.H.; Kim, D.S. Effect of CaO-Al2O3-MgO Slags on the Formation of MgO-Al2O3 Inclusions in Ferritic Stainless Steel. Metall. Mater. Trans. B 2005, 36, 495–502. [Google Scholar] [CrossRef]
- Ren, Y.; Zhang, L.; Pistorius, P.C. Transformation of Oxide Inclusions in Type 304 Stainless Steels during Heat Treatment. Metall. Mater. Trans. B 2017, 48, 2281–2292. [Google Scholar] [CrossRef]
- Han, Q.; Zhang, X.; Chen, D.; Wang, P. The Calcium-Phosphorus and the Simultaneous Calcium-Oxygen and Calcium-Sulfur Equilibria in Liquid Iron. Metall. Trans. B 1988, 19, 617–622. [Google Scholar] [CrossRef]
- Song, B.; Han, Q. Equilibrium of Calcium Vapor with Liquid Iron and the Interaction of Third Elements. Metall. Mater. Trans. B 1998, 29, 415–420. [Google Scholar] [CrossRef]
- Deo, B.; Boom, R. Fundamentals of Steelmaking Metallurgy; Pearson Education Limited: Harlow, UK, 1993. [Google Scholar]
- Inoue, R.; Suito, H. Calcium Desulfurization Equilibrium in Liquid Iron. Steel Res. 1994, 65, 403–409. [Google Scholar] [CrossRef]
- Japan Society for the Advancement of Science and the 19th Committee on Steelmaking. In Steelmaking Data Sourcebook; Japan Society for the Promotion of Science Edition; Gordon and Breach Science Publishers: New York, NY, USA, 1988.
- Saffman, P.G.; Turner, J.S. Corrigendum: On the Collision of Drops in Turbulent Clouds. J. Fluid Mech. 1970, 196, 599. [Google Scholar] [CrossRef]
- Takahashi, J.; Suito, H. Evaluation of the Accuracy of the Three-Dimensional Size Distribution Estimated from the Schwartz-Saltykov Method. Metall. Mater. Trans. A 2003, 34, 171–181. [Google Scholar] [CrossRef]
- Malczewski, J.; Piekarski, M. Modele Procesów Transportu Masy, Pędu i Energii; Wydaw. Nauk. PWN: Warszawa, Poland, 1992. [Google Scholar]
- Taniguchi, S.; Kikuchi, A.; Ise, T.; Shoji, N. Model Experiment on the Coagulation of Inclusion Particles in Liquid Steel. ISIJ Int. 1996, 36, S117–S120. [Google Scholar] [CrossRef]
- Nakaoka, T.; Taniguchi, S.; Matsumoto, K.; Johansen, S.T. Particle-Size-Grouping Method of Inclusion Agglomeration and Its Application to Water Model Experiments. ISIJ Int. 2001, 41, 1103–1111. [Google Scholar] [CrossRef]
- Xu, K.; Thomas, B.G. Particle-Size-Grouping Model of Precipitation Kinetics in Microalloyed Steels. Metall. Mater. Trans. A 2012, 43, 1079–1096. [Google Scholar] [CrossRef]
- Nakaoka, T.; Matsumoto, K.; Taniguchi, S. Turbulent Coagulation Model Considering Effects of London-van Der Waals Force and Wettability. Prog. Comput. Fluid Dyn. 2008, 8, 270–275. [Google Scholar] [CrossRef]
- Ling, H.; Zhang, L.; Li, H. Mathematical Modeling on the Growth and Removal of Non-Metallic Inclusions in the Molten Steel in a Two-Strand Continuous Casting Tundish. Metall. Mater. Trans. B 2016, 47, 2991–3012. [Google Scholar] [CrossRef]
- Seo, M.D.; Cho, J.W.; Kim, K.C.; Kim, S.H. Evolution of Non-Metallic Inclusions in Ultra Low Carbon Steel after Aluminum Deoxidization. ISIJ Int. 2014, 54, 475–481. [Google Scholar] [CrossRef]
- Van Ende, M.A.; Guo, M.; Zinngrebe, E.; Blanpain, B.; Jung, I.H. Evolution of Non-Metallic Inclusions in Secondary Steelmaking: Learning from Inclusion Size Distributions. ISIJ Int. 2013, 53, 1974–1982. [Google Scholar] [CrossRef]
- Zinngrebe, E.; Van Hoek, C.; Visser, H.; Westendorp, A.; Jung, I.H. Inclusion Population Evolution in Ti-Alloyed Al-Killed Steel during Secondary Steelmaking Process. ISIJ Int. 2012, 52, 52–61. [Google Scholar] [CrossRef]
- Han, Z.J.; Liu, L.; Lind, M.; Holappa, L. Mechanism and Kinetics of Transformation of Alumina Inclusions by Calcium Treatment. Acta Metall. Sin. 2006, 19, 1–8. [Google Scholar] [CrossRef]
- Miao, K.; Haas, A.; Sharma, M.; Mu, W.; Dogan, N. In Situ Observation of Calcium Aluminate Inclusions Dissolution into Steelmaking Slag. Metall. Mater. Trans. B 2018, 49, 1612–1623. [Google Scholar] [CrossRef]
- Zhang, L.; Thomas, B.G.G. Inclusion Nucleation, Growth, and Mixing during Steel Deoxidation; Report No. CCC200206; University of Illinois at Urbana-Champaign: Urbana-Champaign, IL, USA, 2003; pp. 1–19. [Google Scholar]
- Söder, M.; Jönsson, P.; Jonsson, L. Inclusion Growth and Removal in Gas-Stirred Ladles. Steel Res. Int. 2004, 75, 128–138. [Google Scholar] [CrossRef]
- Kwon, Y.J.; Zhang, J.; Lee, H.G. A CFD-Based Nucleation-Growth-Removal Model for Inclusion Behavior in a Gas-Agitated Ladle during Molten Steel Deoxidation. ISIJ Int. 2008, 48, 891–900. [Google Scholar] [CrossRef]
- Zhang, L.; Taniguchi, S.; Cai, K. Fluid Flow and Inclusion Removal in Continuous Casting Tundish. Metall. Mater. Trans. B 2000, 31, 253–266. [Google Scholar] [CrossRef]
- Ferreira, M.E.; Pistorius, P.C.; Fruehan, R.J. Liquid Inclusion Collision and Agglomeration in Calcium-Treated Aluminum-Killed Steel. Front. Mater. 2021, 8, 736807. [Google Scholar] [CrossRef]
Publisher’s Note: MDPI stays neutral with regard to jurisdictional claims in published maps and institutional affiliations. |
© 2022 by the authors. Licensee MDPI, Basel, Switzerland. This article is an open access article distributed under the terms and conditions of the Creative Commons Attribution (CC BY) license (https://creativecommons.org/licenses/by/4.0/).