Article

Evolution Behavior and Closure Mechanism of Porosity in Large Billet during the Reduction Pretreatment

National Engineering Research Center for Advanced Rolling and Intelligent Manufacturing, University of Science and Technology Beijing, Beijing 100083, China
*
Author to whom correspondence should be addressed.
Metals 2022, 12(4), 599; https://doi.org/10.3390/met12040599
Submission received: 21 February 2022 / Revised: 27 March 2022 / Accepted: 28 March 2022 / Published: 30 March 2022

Abstract

:
The reduction pretreatment process was proposed to be applied to large billets for the purpose of alleviating the center porosities and reducing the rolling ratio. This study focused on the evolution behavior and closure mechanism of porosity in a large billet during reduction pretreatment. The porosities were characterized by ultrasonic scanning and 3D reconstruction. The results showed that the porosities near the surface of the billet were firstly closed during the reduction pretreatment. The reduction began to effectively act on the center of the billet at the deformation of 0.16. When the reduction amount increased to 0.20–0.22, both the pore number and the porosity degree at the center of the billet were the smallest. As the deformation exceeded 0.25, the porosities gathered at the center of the billet, which may have caused larger defects. A numerical model for the reduction pretreatment was established to analyze the evolution behavior of porosity. The simulation results showed that the position with the maximum of strain moved toward the center of the billet as the reduction amount increased. At the position where the deformation was 0.20, the deformation would readily occur at the center, and the center strain was almost twice as much as the surface strain. The upper and lower surfaces of porosity were compressed to the center of the porosity in the thickness direction. The two ends of porosity were not stretched in the rolling direction. The closure index indicated that the deformation penetrated into the center would accelerate the deformation of porosity. The cross-sectional area of the porosity gradually decreased with the increase in the hydrostatic integration, which indicated that the hydrostatic integration could be used to assess the closure degree of porosity during the reduction pretreatment process. Both the closure index and the hydrostatic integration proved the effective role of the reduction pretreatment in the alleviation of porosity.

1. Introduction

A low casting speed and weak cooling are adopted for the production of large billets, and internal defects, such as segregation, center shrinkage porosities and center cracks, inevitably occur during the final stage of solidification. Unsurprisingly, the porosities are detrimental to mechanical performance, especially in the case of fatigue during service life [1,2]. As a result, a considerable amount of research has been carried out on the relationship between the fatigue mechanisms and porosities [3,4,5,6,7,8]. The best strategy to reduce porosities is to better understand their formation and determine the appropriate measures to eliminate them. The formation of center porosity is closely related to the solidification characteristics of large billets. The temperature gradient plays an important role in the formation of porosity, and the threshold of the temperature gradient depends on both the shape and size of a particular casting [9]. Moreover, the critical temperature gradient was shown to be inversely proportional to the square root of the cooling rate [10].
Many previous studies have reported on the evolution behaviors of center porosity during rolling and forging. Chaaban and Alexander studied the closure of cavities in swing forging [11]. Microscopic examination and bend tests showed that although the inner surfaces of holes came into contact, bonding was just initiated but was not particularly strong. Hydrostatic stress integration is usually used in free forging as a parameter to describe the closure of the center pore. The hydrostatic stress integration is in proportion to the area reduction of the pore [12]. A local effective strain value of 0.6 or greater must be achieved for the closure of the void during open die forging [13]. Wang et al. investigated the evolution behaviors of several voids with different sizes during the hot rolling process by finite element simulation and laboratory experimentation [14]. It was found that the shape of the voids with varying sizes changed in a similar manner, but the smaller voids bonded more readily than the larger ones. The compression ratio of the large billet was limited. It was difficult for deformation to penetrate into the center, and the internal defects formed during the solidification were difficult to eliminate. Moreover, a large compression ratio will reduce production efficiency and increase costs.
Soft and heavy reduction processes are proposed to alleviate the center porosity during strand continuous casting. The soft reduction can reduce the porosity, but the center porosity will still be difficult to avoid in the subsequent solidification [15]. Cao et al. established a finite element model for the soft reduction of a round billet [16]. The simulation results showed that due to the existence of a liquid core, the stress distribution of the round billet was ring-shaped during the soft reduction, which resulted in most of the reduction being consumed by the formed shell. The effect of reduction was not obvious, and cracks were easily generated on the surface of the billet. The porosities could be effectively improved by the porosity control of casting slab (PCCS) process when the central solid fraction was 0.8–0.95 and, subsequently, a qualified thick plate could be produced by rolling with a reduction ratio of 1.5–2.5 [17]. Zhao et al. developed a numerical model of heavy reduction and discussed the effect of reduction positions with different center solid fractions on eliminating center porosity and segregation [18]. The results showed that a center solid fraction of 0.8 or 0.86 was the best. Tensile stress in the mushy zone would increase during soft reduction. The fluctuation of casting speed and superheat will cause the final solidification point to shift from a reduction position and affect the reduction effect. The mushy zone is very sensitive to deformation, and the probability of the formation of internal cracks will greatly increase [19].
In order to improve the center density of large billets and avoid the generation of reduction cracks, heavy reduction after complete solidification is a novel strategy to alleviate porosities. Gradient temperature rolling was proposed to improve the center quality of ultra-heavy plates [20]. The slab was maintained at 800 °C at its surface and 1100 °C at its core. A typical temperature distribution led to a low central deformation resistance, and center voids bonded more readily compared with those of slabs rolled under conventional uniform temperature conditions. Li et al. simulated the reduction after complete solidification of continuous casting with experiments [21]. The results showed that due to the existence of temperature gradients, a small reduction led to a considerable plastic strain in the center of billet, and the center defect was significantly reduced.
In the present work, the reduction pretreatment process was proposed as a novel strategy to alleviate the center porosity in a large billet. Firstly, the experiments were designed to simulate the reduction pretreatment process, and the morphology and distribution characteristics of shrinkage porosity in a billet were detected by an ultrasonic scanning microscope and 3D reconstruction. Then, a three-dimensional model was built to analyze the strain distribution during the reduction pretreatment. Finally, the evolution behaviors of porosity were modeled to study the closure mechanism of porosity during the reduction pretreatment process. This work can provide theoretical guidance for future research on the reduction pretreatment process.

2. Materials and Methods

2.1. Material Preparation

The steel used for the experiments was 40MnSi. The actual chemical compositions were examined using chemical analysis as shown in Table 1. The steelmaking equipment was a 25 kg vacuum induction furnace (BLUE OCEAN METALLURGICAL, Xi’an, China). The billet size is shown in Figure 1a. After stripping, Billet 1 was quickly water-cooled. The temperature at the center point of the surface was measured by an infrared thermometer (MAGNITY TECHNOLOGIES, Shanghai, China). Billet 1 was directly rolled when the surface temperature was 950 °C and air-cooled to room temperature after rolling. The rolling schedule was characterized by a roller diameter of 330 mm, a rolling speed of 0.36 m·s−1, and a roll gap of 92 mm. Billet 2 was a control sample without being rolled. The center temperature of Billet 2 during solidification was measured using a B thermocouple (BOXIANG, Shanghai, China).

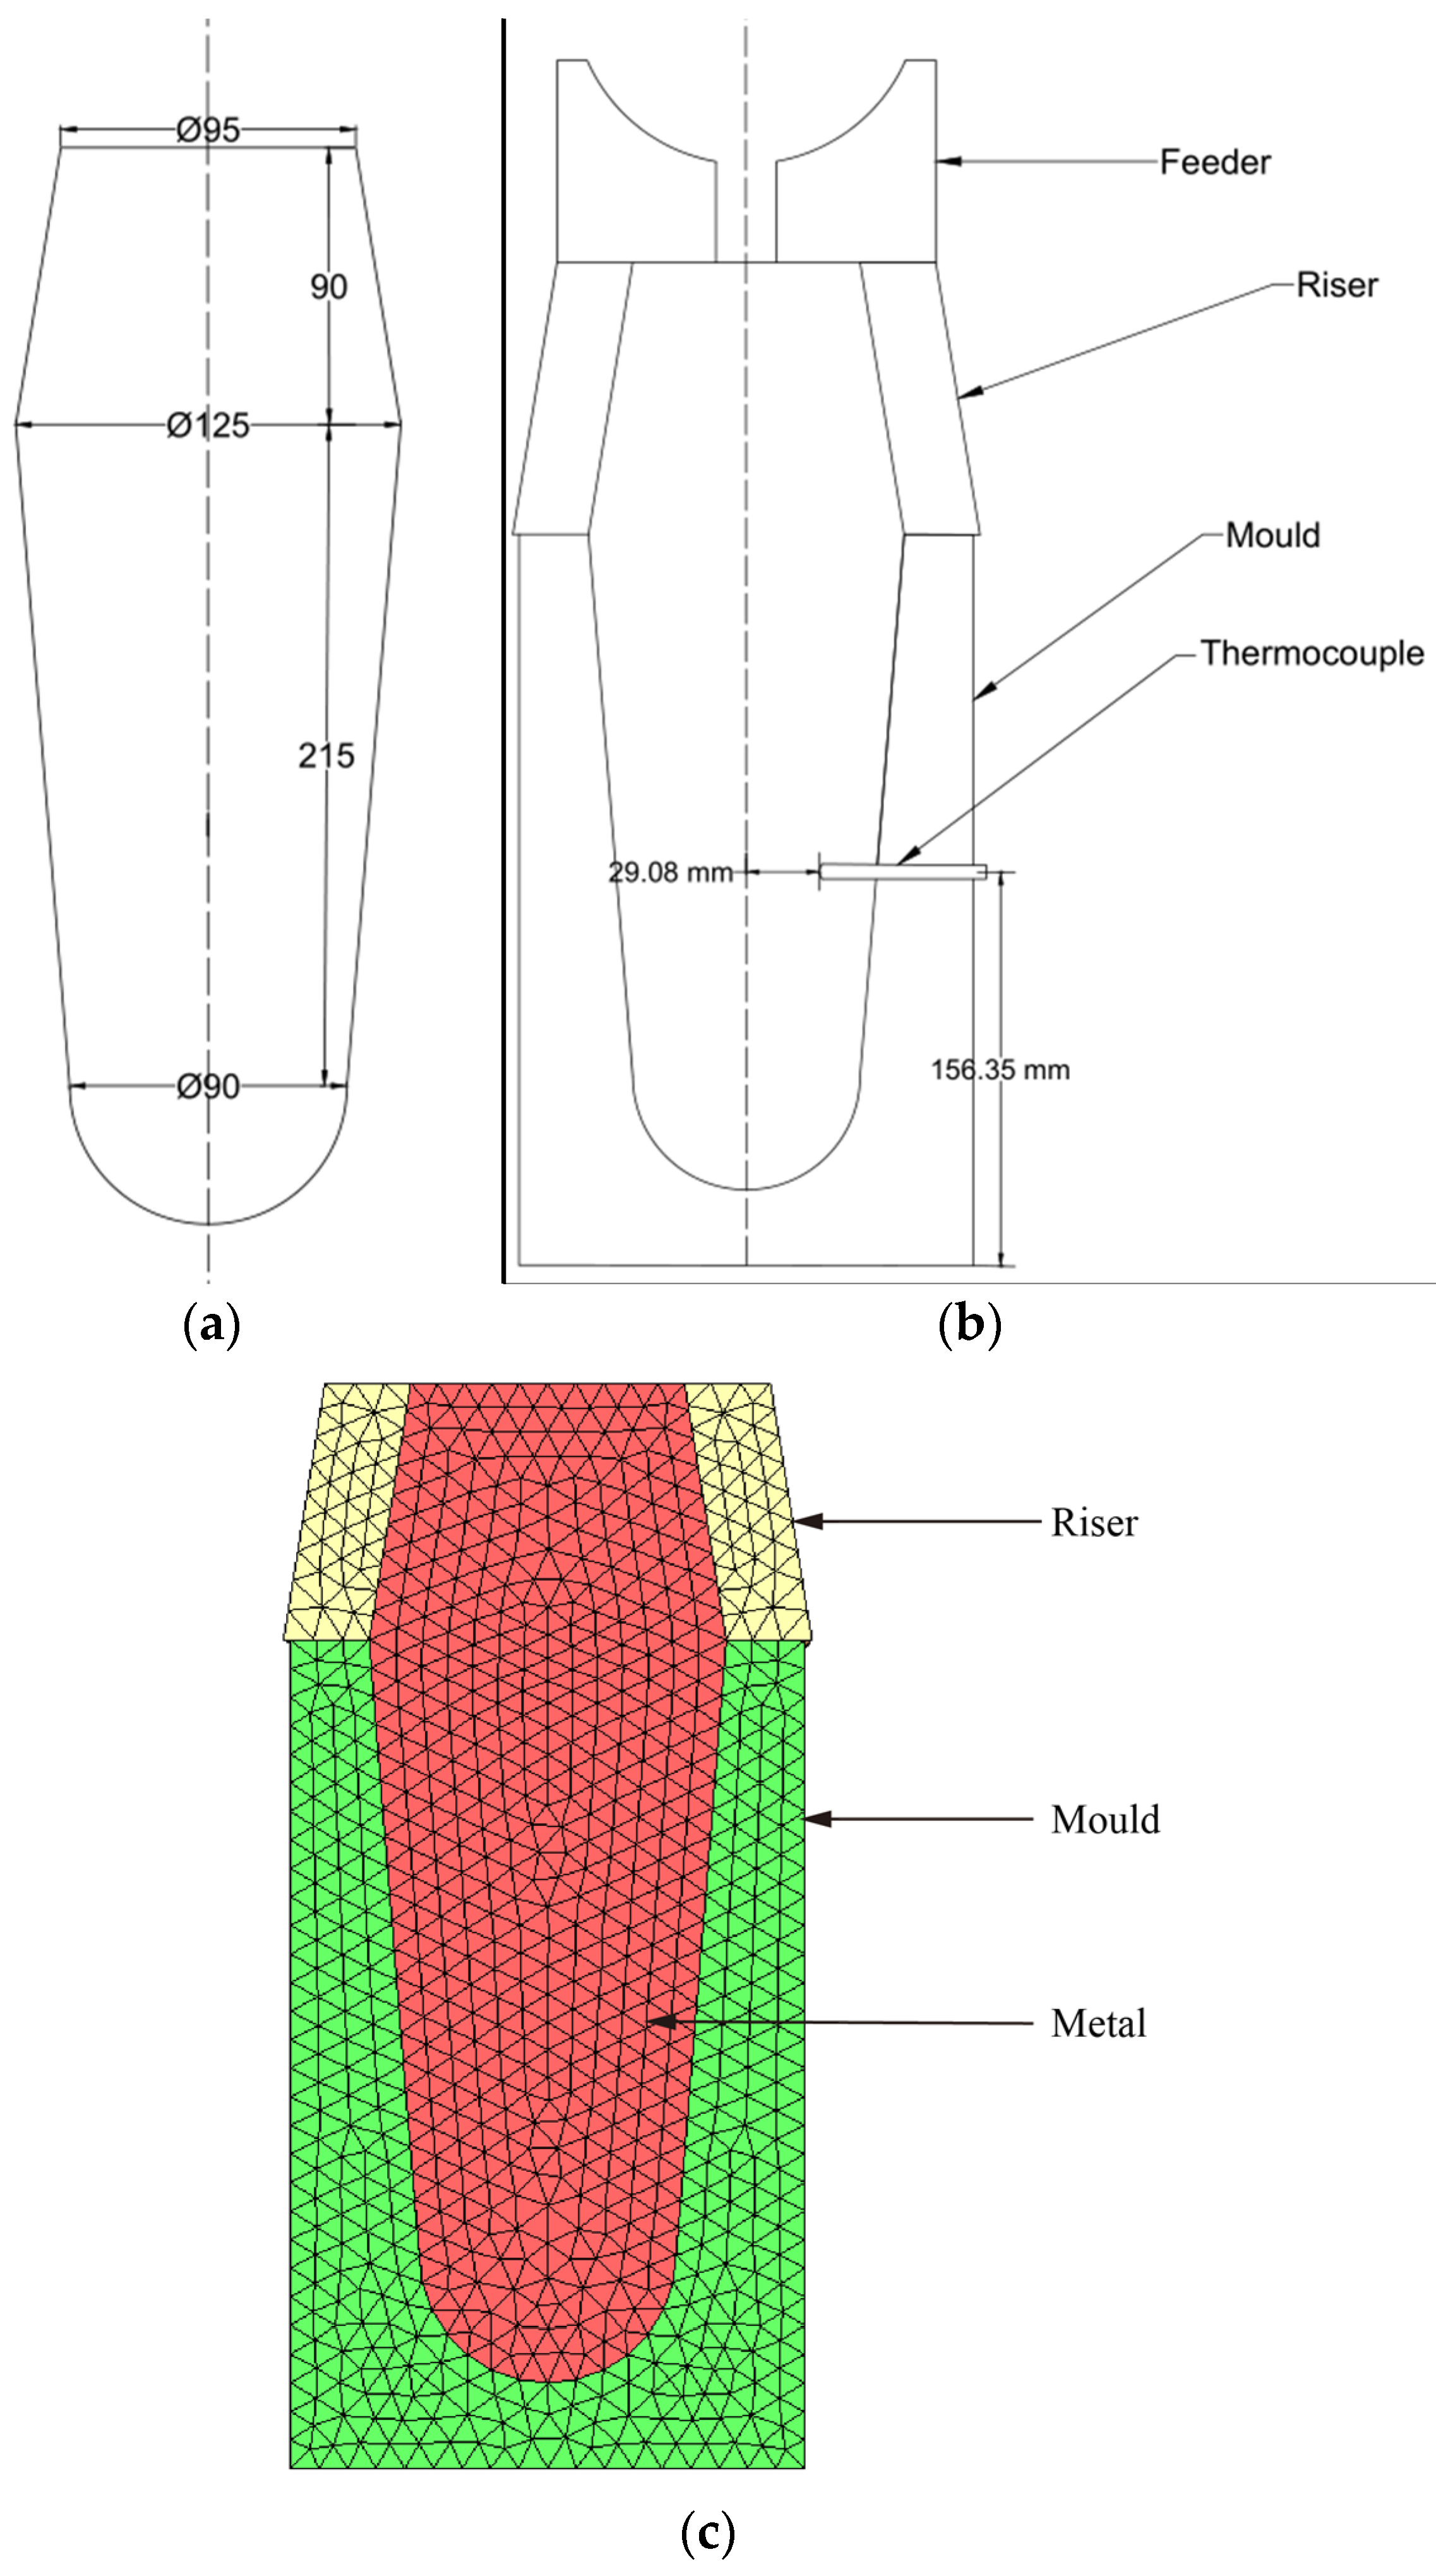
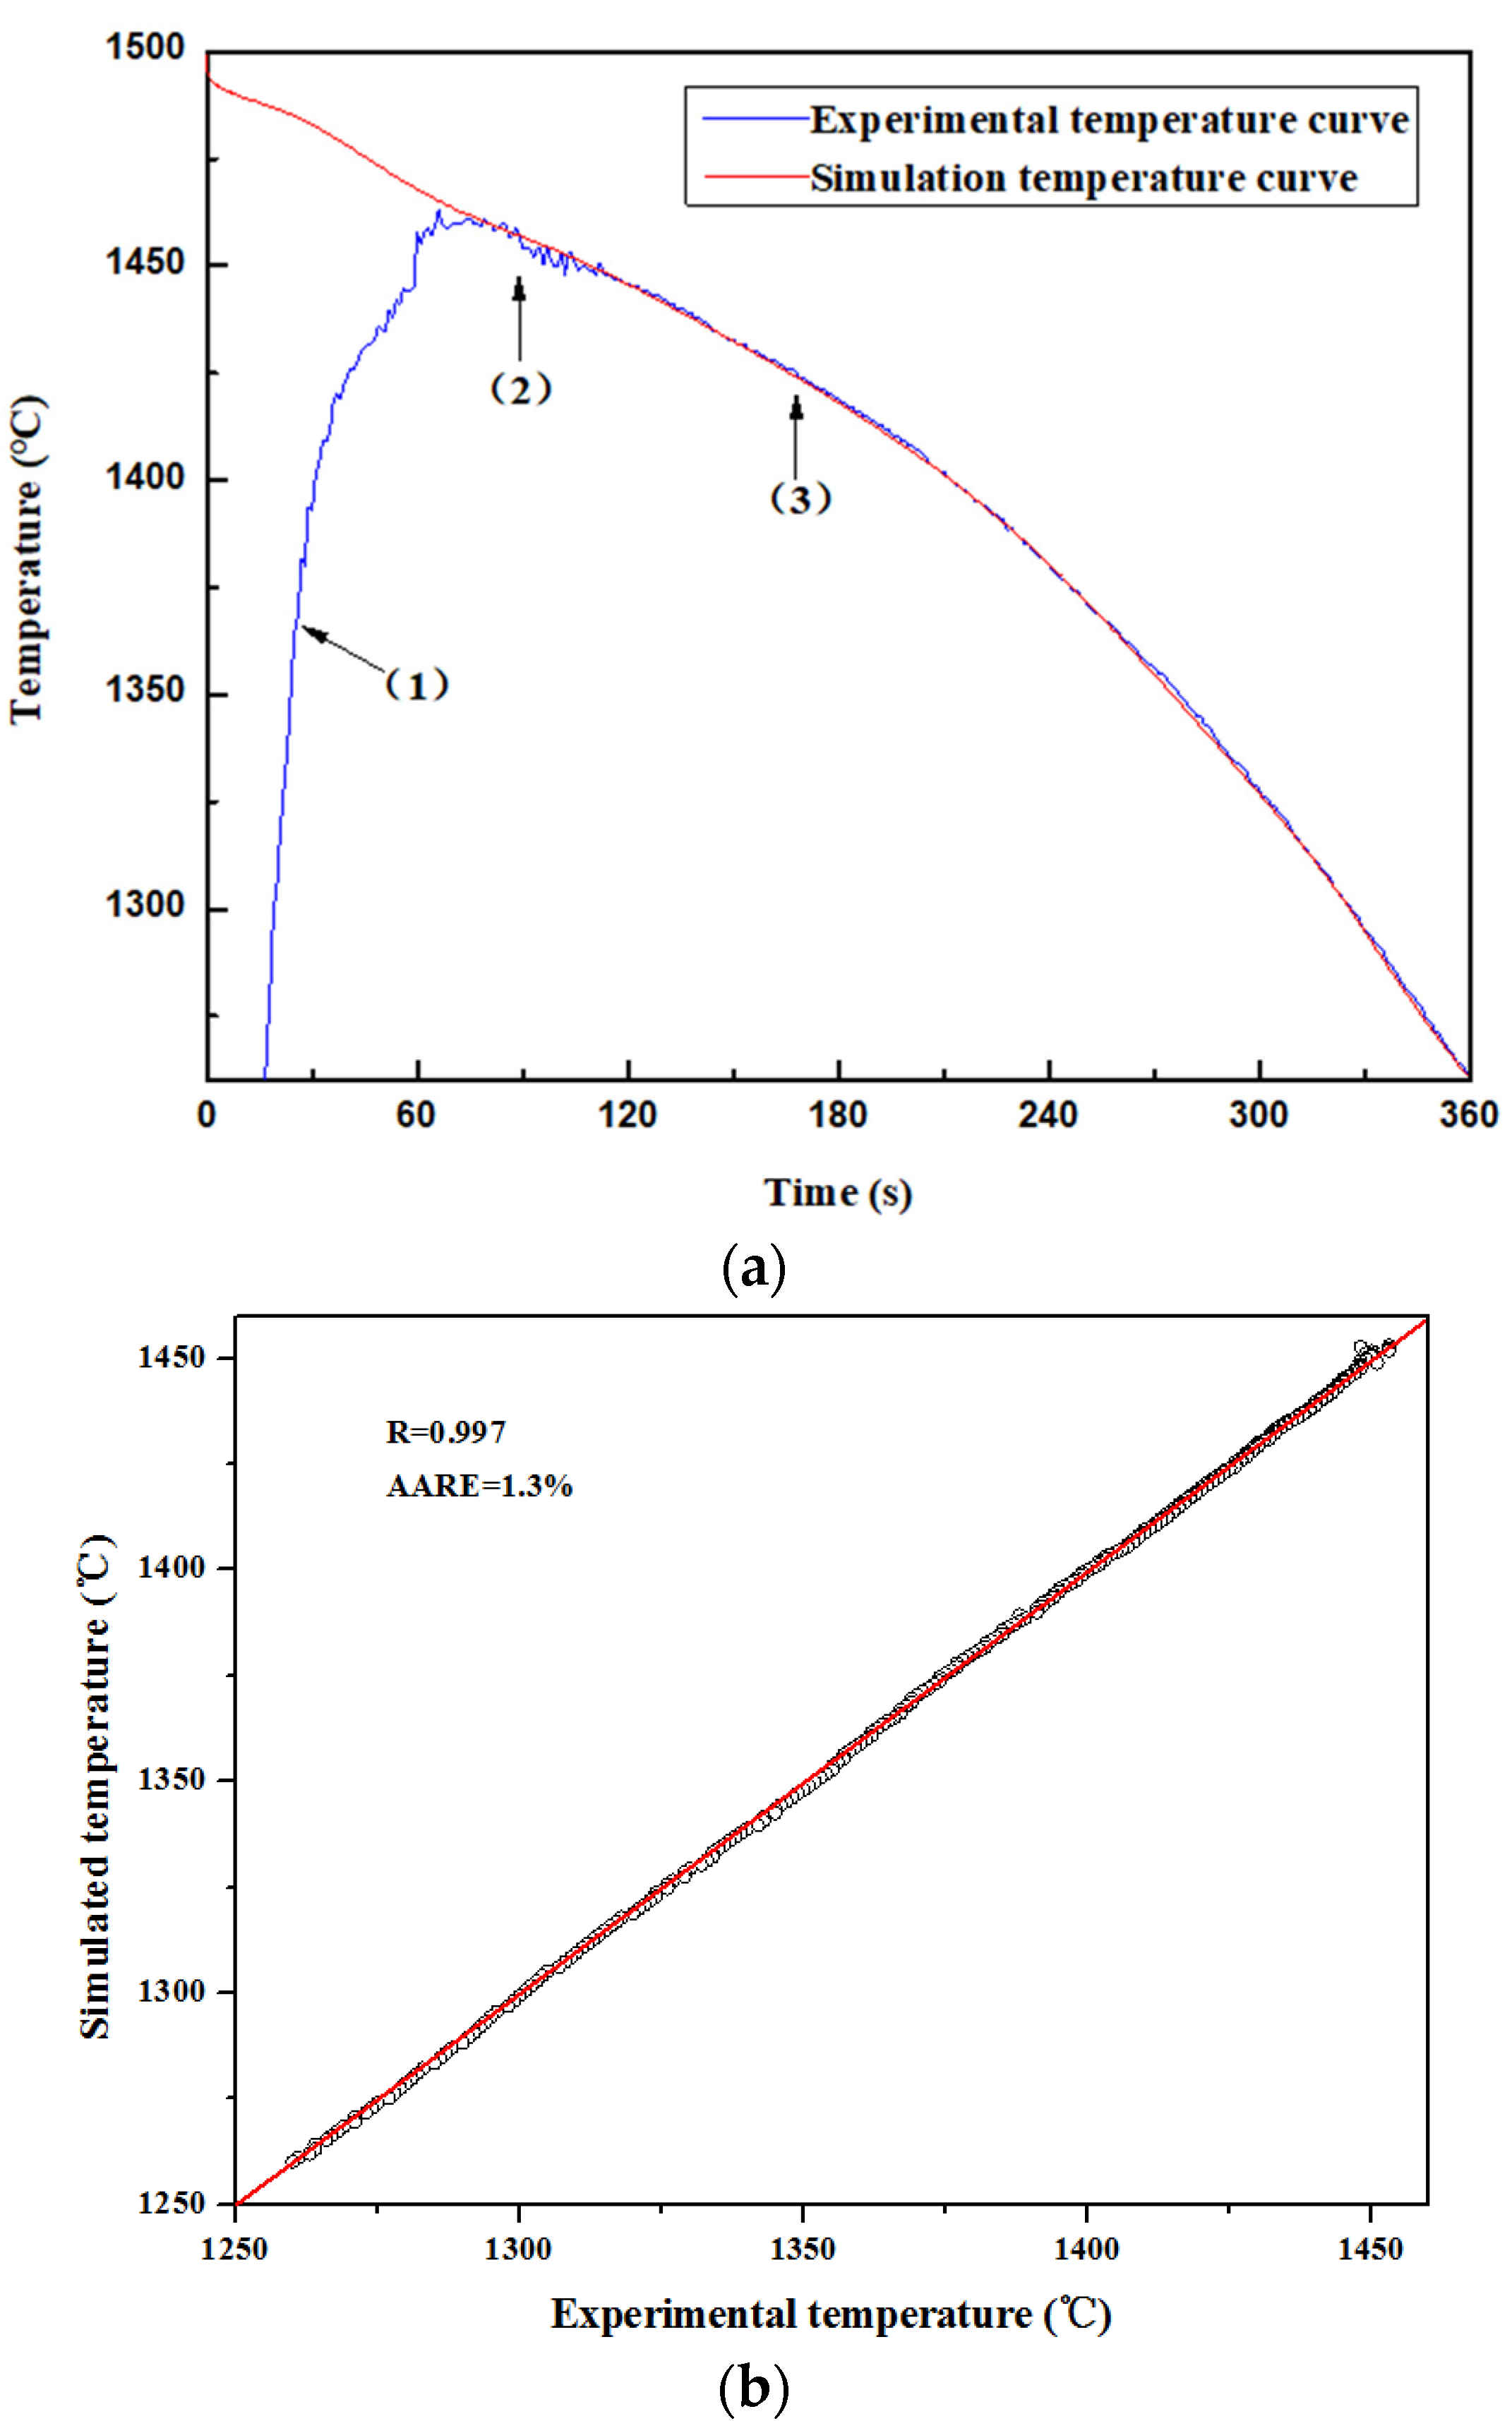
2.2. Measuring and Verification of the Casting Temperature

The temperature variation of the billet was measured using a B thermocouple and adopted to correct the heat transfer model. Figure 1b shows a schematic of the setup for measuring the temperature. A round hole, with a diameter of 10 mm, was drilled into the middle of the mold. The thermocouple was protected by a boron nitride tube and inserted into the mold through the round hole. The test-side of the thermocouple was 29.08 mm away from the center axis of the mold, and the other side was connected to a thermometer through a compensation wire to record the temperature variations of the test point. According to the temperature measurement results, the inverse calculation module of the software Procast (Procast 2013, ESI, Paris, France) was used to calculate the value of the heat transfer coefficient (h) with varying time. The solidification with phase change and the temperature distribution inside the billet can be described by an unsteady–state heat conduction equation [22,23]:
ρ ( T ) c ( T ) T t = x ( k ( T ) T x ) + y ( k ( T ) T y ) + z ( k ( T ) T z ) + q ˙
where T is the temperature (K), t is time (s), k ( T ) is the thermal conductivity (W/m K), c ( T ) is specific heat (J/kg K), ρ ( T ) is the density (kg/m3), and q ˙ is the latent heat (J/kg). The steel material parameters calculated with the commercial software JMatPro (JMatPro 9.0, SENTE SOFTWARE, Guildford, England) are shown in Table 2. The liquidus and solidus temperatures of the steel were 1490 °C and 1425 °C, respectively. The latent heat of solidification was 245,000 J/kg. In the calculation, the casting process was ignored, and the mold was assumed to be instantaneously filled with molten steel at an initial temperature of 1500 °C. The heat transfer coefficient at the interface between the molten steel and the mold was determined as shown in Table 3. After the heat transfer coefficient was obtained, a three-dimensional model of the heat transfer was established using the software Thercast (Thercast 2011, TRANSVALOR, Riviera, France) as shown in Figure 1c. The temperature field of the billet during the solidification process could be calculated by this model.

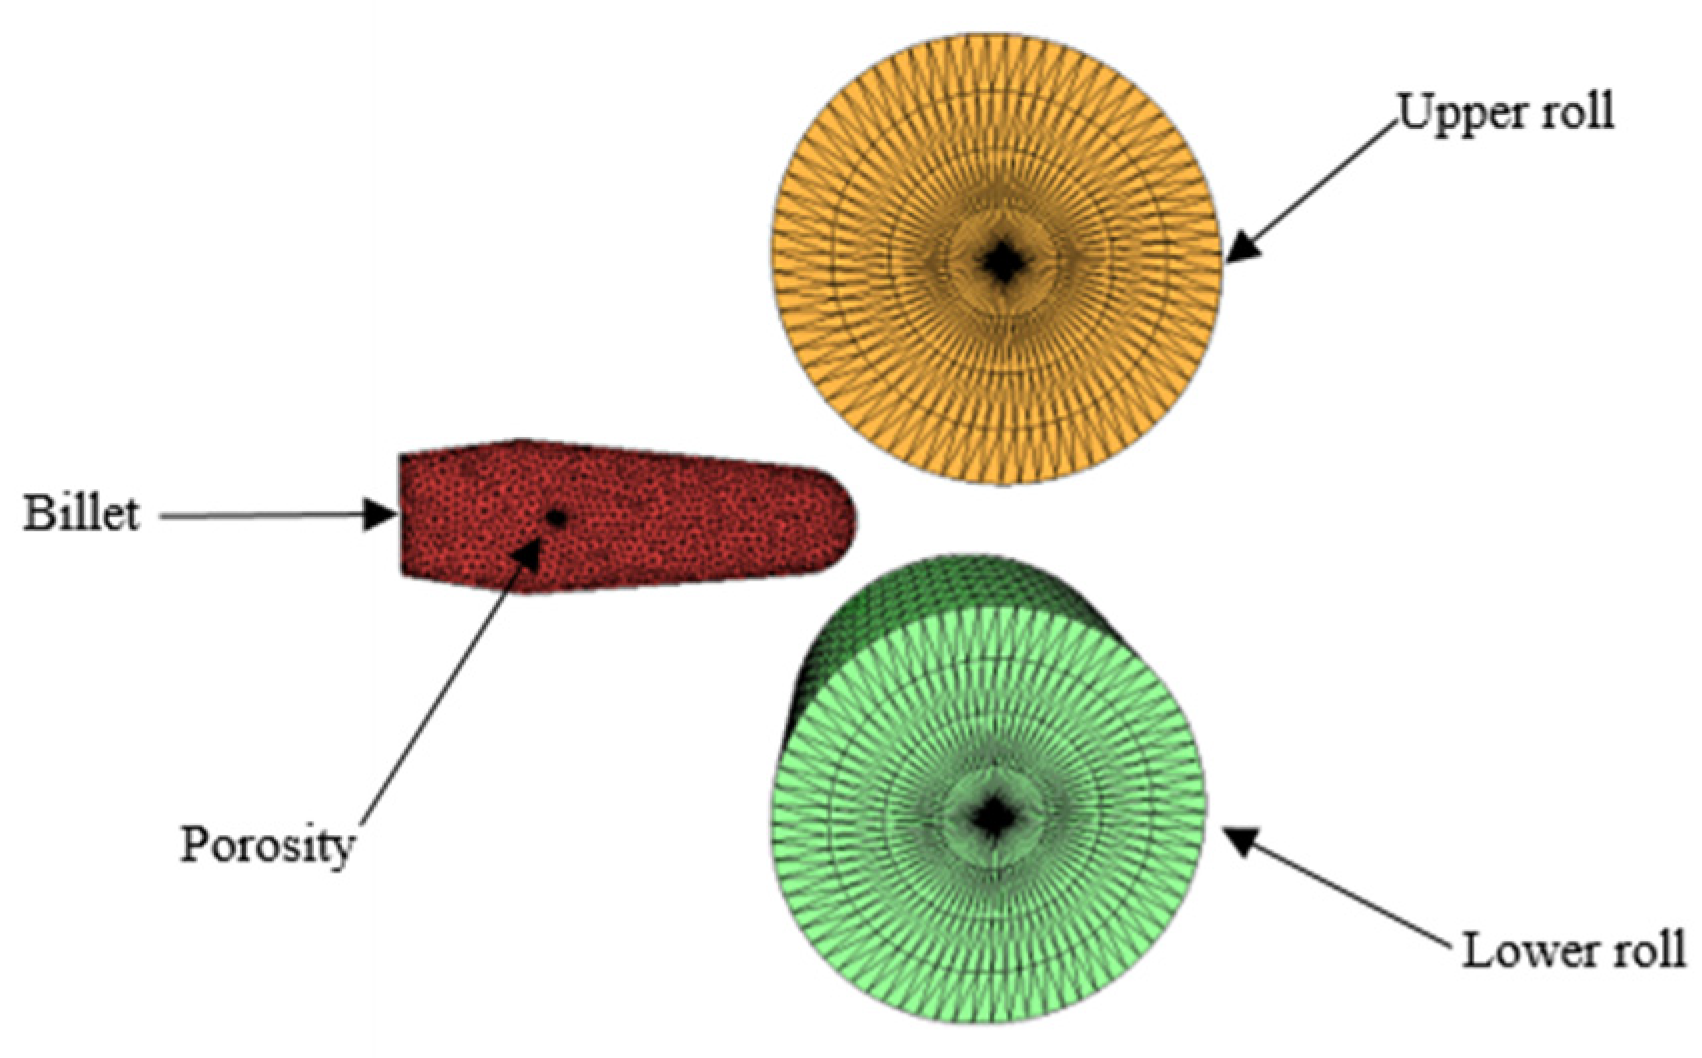
2.3. Simulation for Reduction Pretreatment

A thermo-mechanical coupling model was built to simulate the reduction pretreatment process. The finite element model for reduction pretreatment is shown in Figure 2, and Figure 3 is an enlarged view of the prefabricated porosity. Based on the law of symmetry, half of the billet was modeled with the commercial software Forge (Forge 2011, TRANSVALOR, Riviera, France). The roller was assumed to be rigid with a diameter of 330 mm, the roll speed was 0.36 m·s−1 and the roll gap was 92 mm. The friction coefficient between the billet and the roller was set to 0.3 [14]. The temperature field of the billet after being water-cooled was imported as the initial condition for the reduction pretreatment.
In this study, the Hensel–Spittel law [24] was adopted to construct the deformation resistance model for reduction pretreatment. The model includes the effects of temperature, strain rate, hardening and softening on the flow behaviors of the materials. For most materials, it can be simplified as follows:
σ f = C · ε m 1 · ε ˙ m 2 · exp ( m 3 T + m 4 ε )
where σ f is flow stress (MPa), ε is strain, ε ˙ is strain rate (s−1), T is temperature (K), C is a constant and m 1 , m 2 , m 3 and m 4 are the material sensitivity coefficients. The unknown parameters were determined by taking the logarithms on both sides of the equation and performing a linear fitting as shown in Table 4. The data used for the linear fitting were derived from the uniaxial thermal compression experiments by Gleeble-3500 (TONGYU HEAVY INDUSTRY, Jinan, China). The model could be applied at the deformation temperatures of 900–1350 °C and strain rates of 0.001–10 s−1. The compression specimen began to melt at 1350 °C and a strain rate of 0.001 s−1. Therefore, the flow stress σ f at 1350 °C and a strain rate of 0.001 s−1 was set to a very small value close to 0 during the calculation.

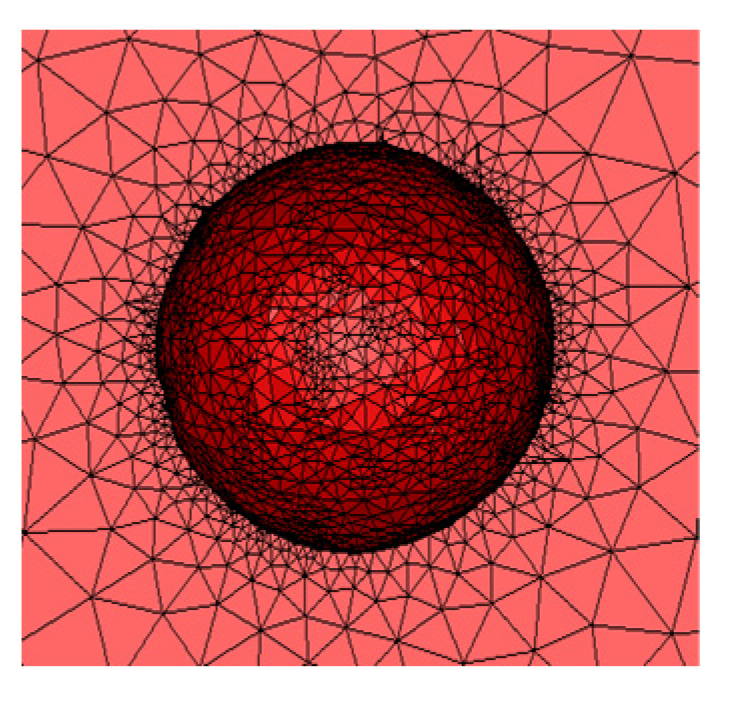
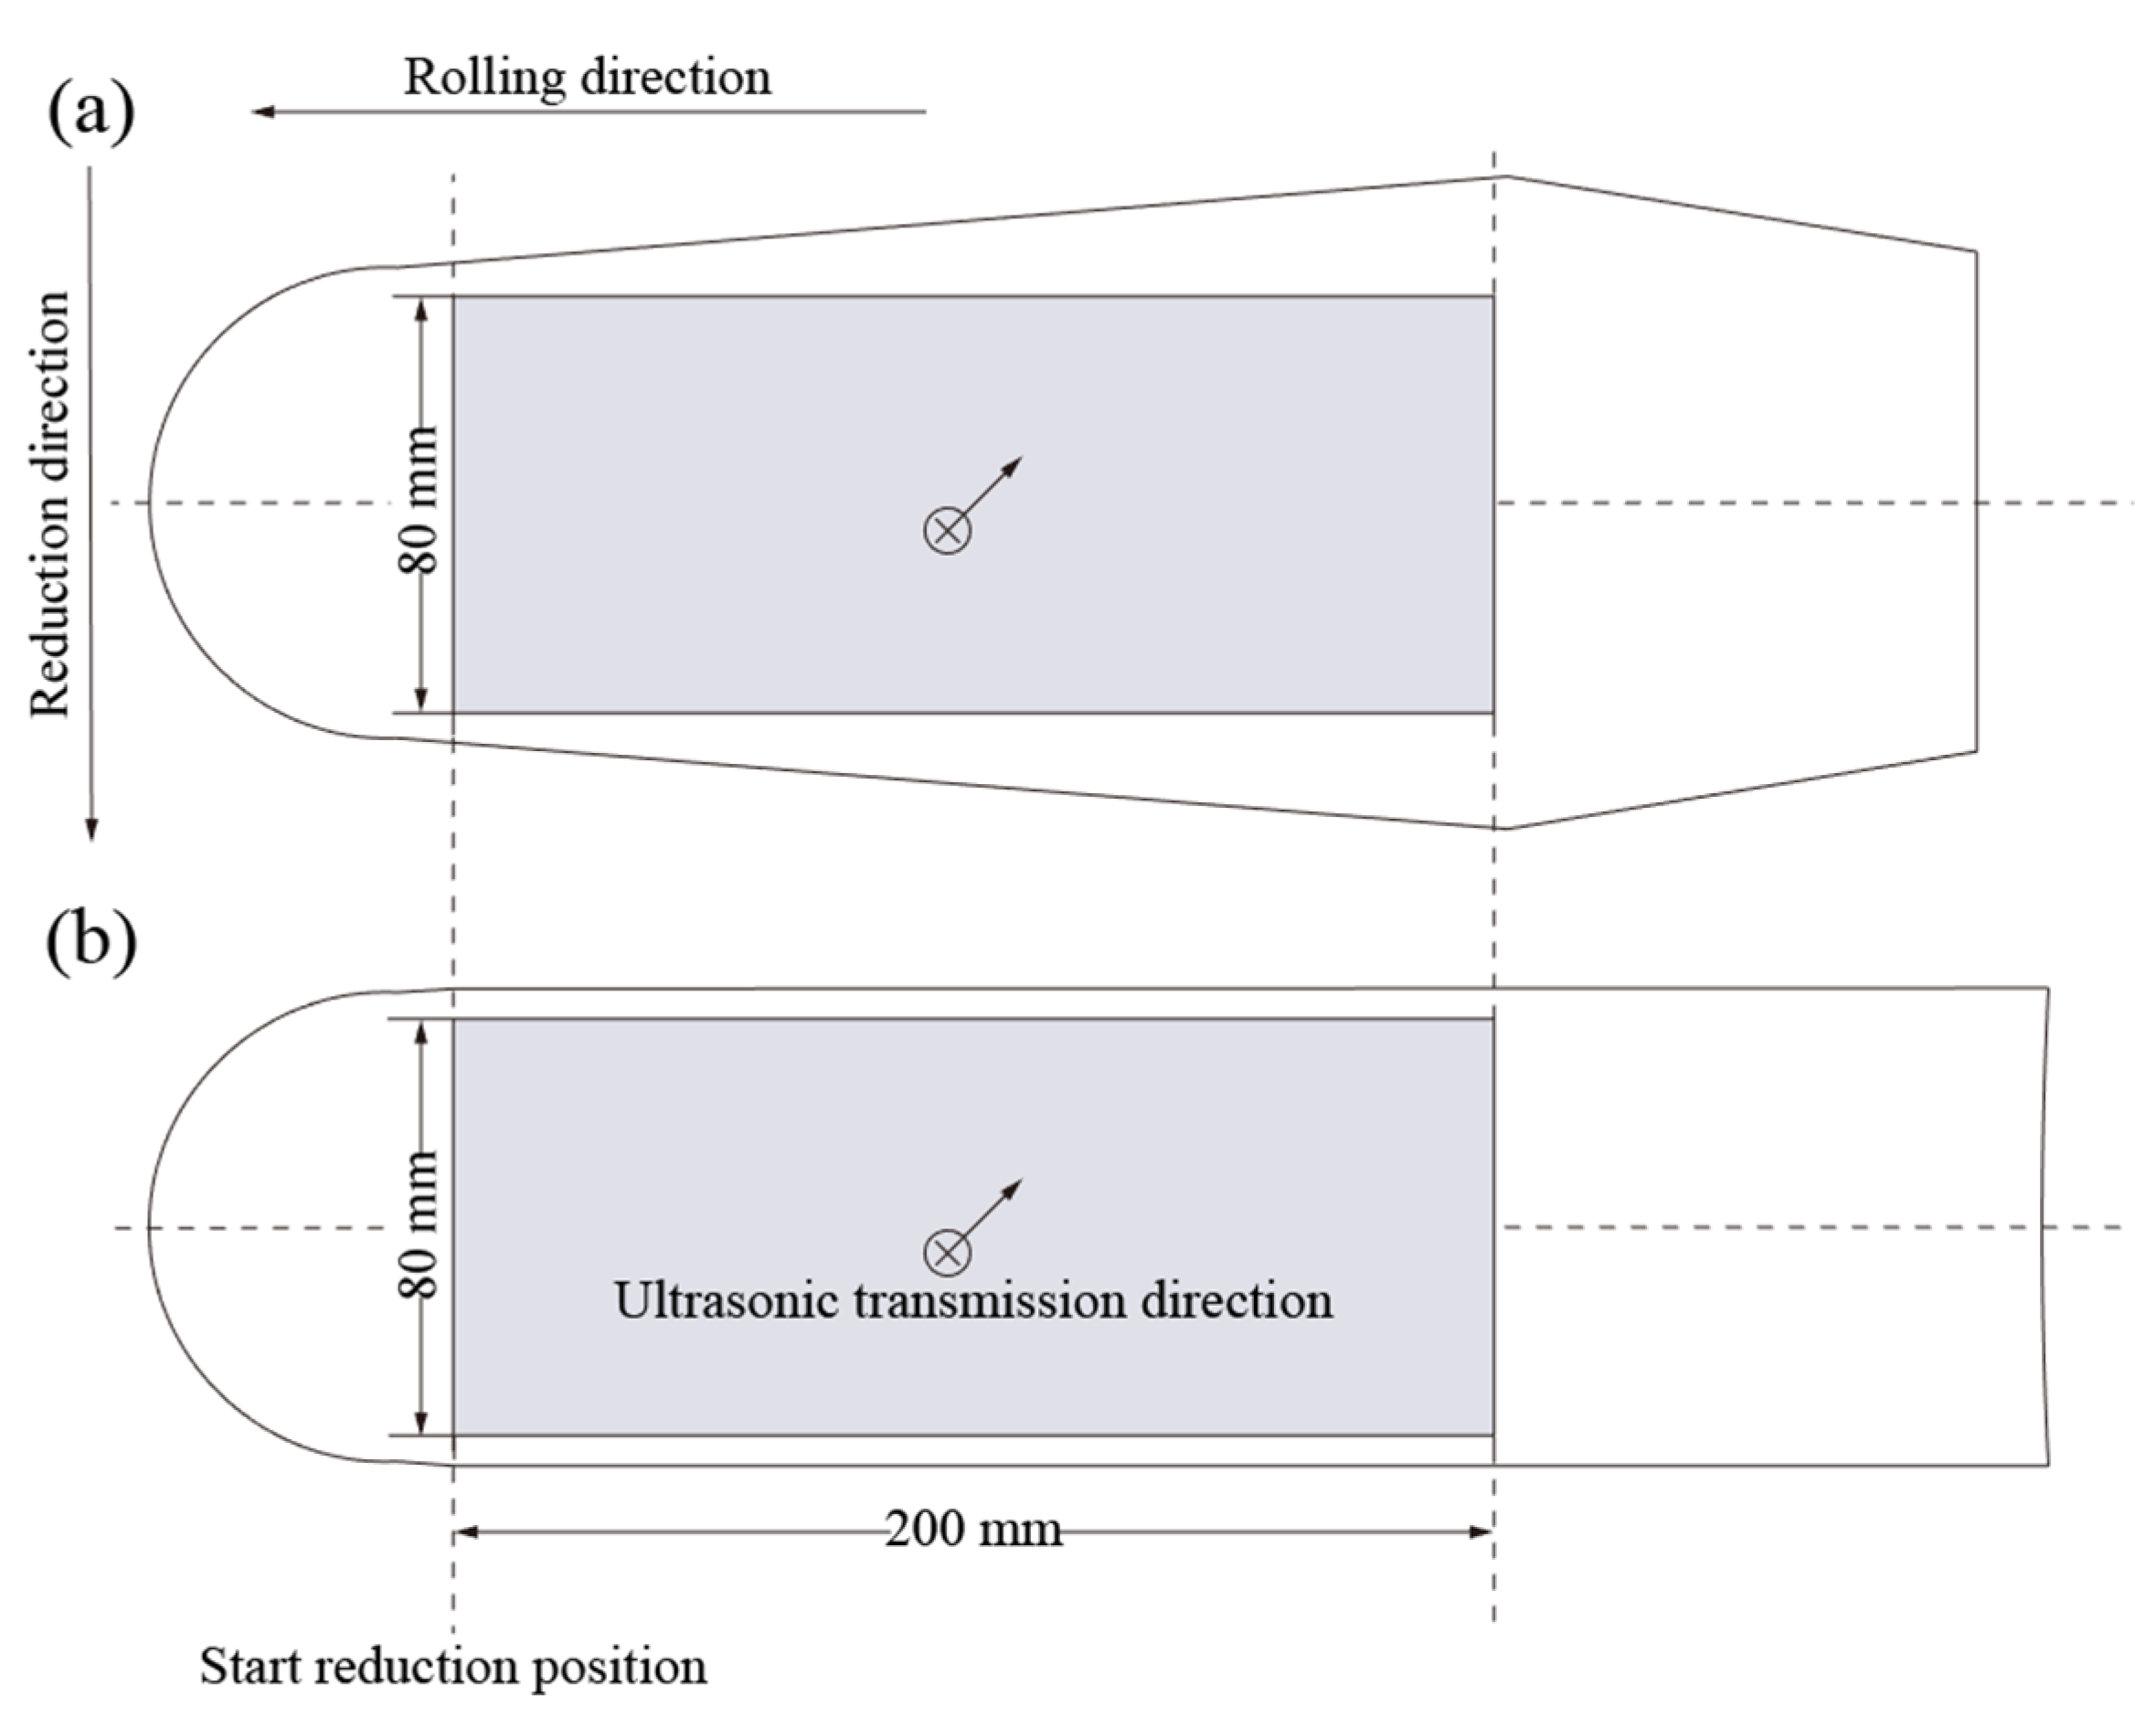
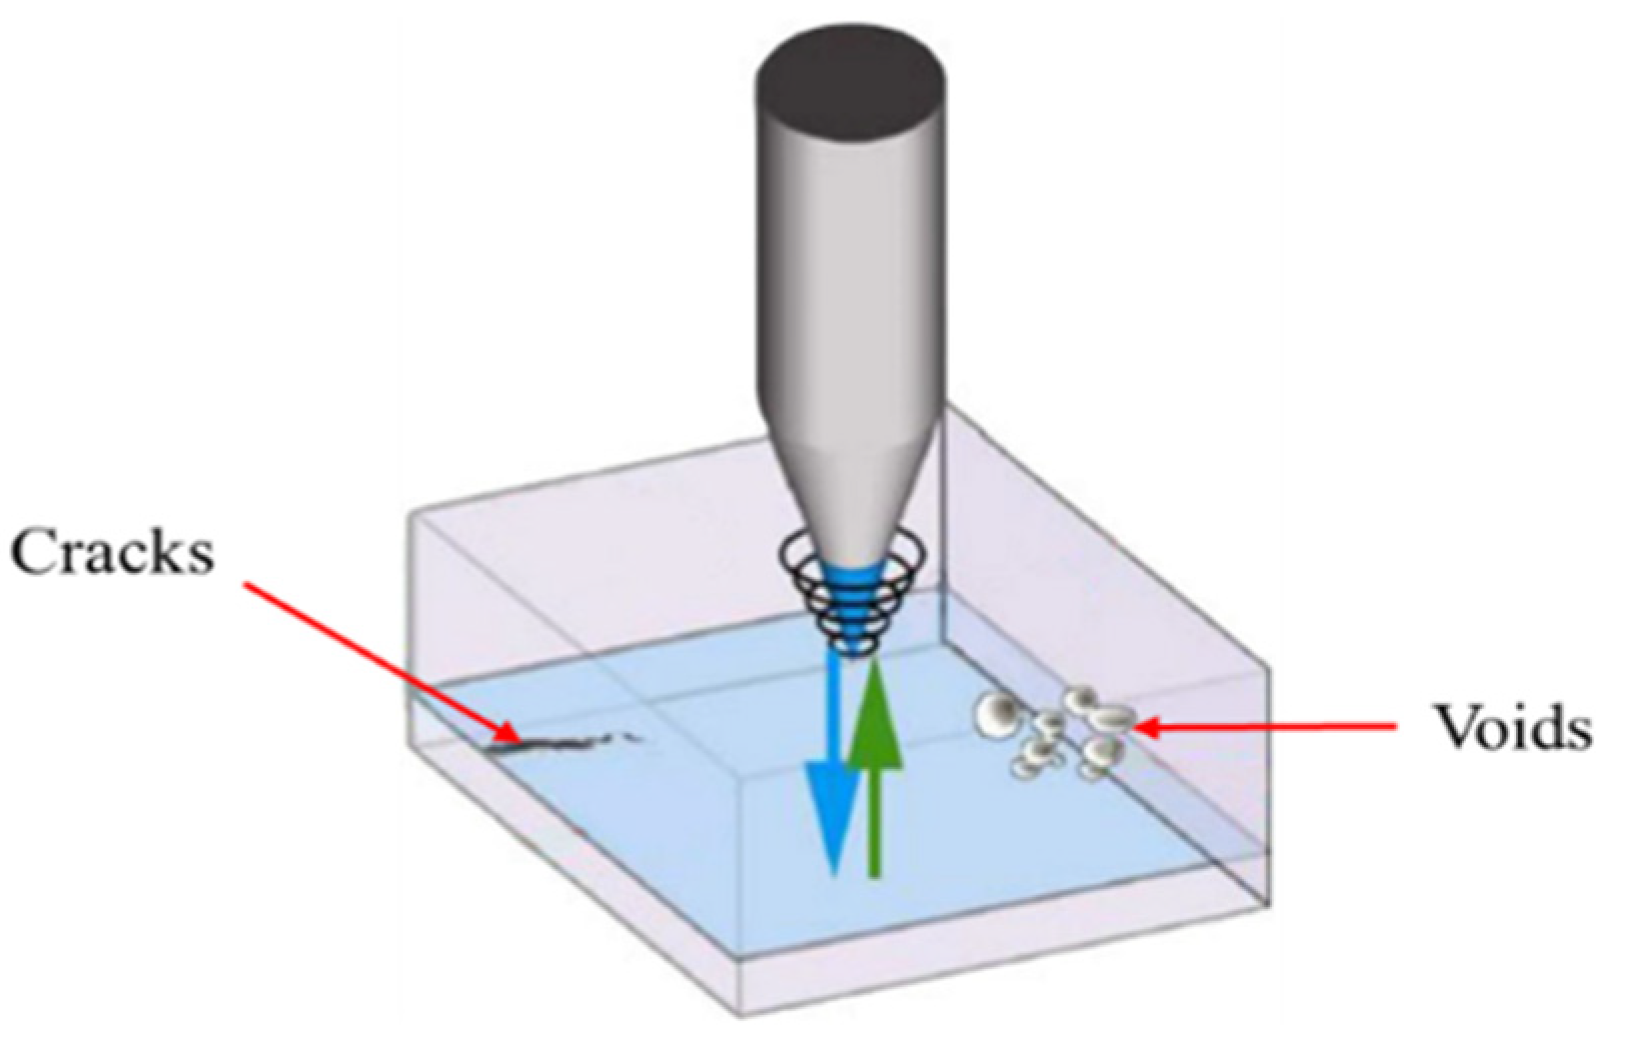
2.4. Detection of the Porosities

One rectangular specimen was cut from the symmetry plane of Billet 1 along the rolling direction. The centerline of the rectangular specimen coincided with the centerline of Billet 1, and one side of the specimen was at the start of the reduction position. Another rectangular specimen was cut from the corresponding position of Billet 2 as a control specimen. The width and height of the rectangular samples were both 200 × 80 mm as shown in Figure 4. The specimens were ground, polished and wiped with alcohol. Ultrasonic flaw detection was performed on the samples using a German ultrasonic microscope PVA SAM 300 (PVA TEPLA, Wettenberg, Germany). The principle of ultrasonic flaw detection is shown in Figure 5. Since the focal column length of the probe with 50 MHz was 330 μm, a thickness range of 300 μm was detected each time. The images recorded the data of the defects in the detected range. The probe descended by 300 μm each time, and the image information characterizing the internal defects of the material was obtained by multiple focus imaging. Figure 6 shows the analysis flow diagram of the images. Firstly, all the images were binarized by MATLAB (MATLAB R2012b, MATHWORKS, Natick, MA, USA). Then, 3D reconstruction on the binarized images was performed using the software Avizo (Avizo 8.0, FEI, Hillsboro, FL, USA), and a 3D distribution map of the internal defects of the samples was obtained. The size and number of the defects were counted. At the same time, the internal porosity degree of the samples was calculated to characterize the material uniformity. Finally, the influence of the different reductions on the internal defects of the billet was analyzed.

3. Results and Discussion

3.1. Temperature Distribution before the Reduction Pretreatment

The heat transfer coefficient at the interface between the molten steel and the mold was obtained by the inverse calculation method. Then, the temperature field of the billet during solidification could be calculated. A comparison between the measured temperature and the calculated temperature is shown in Figure 7a.
Temperature measurement results show that the temperature curve can be divided into three stages: (1) The indication of the thermocouple rose exponentially at the initial stage of pouring. The thermocouple used for temperature measurement was a B-type double platinum rhodium thermocouple. The thermal response time of the B-type thermocouple was less than 150 s. According to the analysis of the temperature measurement curve, it is known that the thermal response time was 70 s in this experiment. (2) The indication of the thermocouple fluctuated up and down for 30 s, which was caused by absorbing and releasing heat between the measurement extremity of the thermocouple and molten steel. (3) The indication of the thermocouple was stable, because the thermal equilibrium had been reached between the measurement extremity of the thermocouple and molten steel. Comparing the experimental and calculated results, it can be seen that there was a large difference only at the initial stage of pouring. It was difficult to avoid the error using the thermocouple for temperature measurements during the thermal response time. As shown in Figure 7b, in the stable stage, the simulated and experimental temperatures were basically consistent, the correlation coefficient R and the average absolute relative error (AARE) were 0.997% and 1.3%, respectively.
After stripping, Billet 1 was quickly water-cooled for 30 s. The surface temperature of Billet 1 was measured by an infrared thermometer. Figure 8 shows the temperature distribution of Billet 1 before rolling. The center temperature of the billet was 1350 °C, and the surface temperature was mostly between 900 and 950 °C. After complete solidification, an obvious temperature difference existed between the surface and the center of the billet. The temperature gradient on the surface of the billet was the largest, and the center temperature gradient was the smallest.

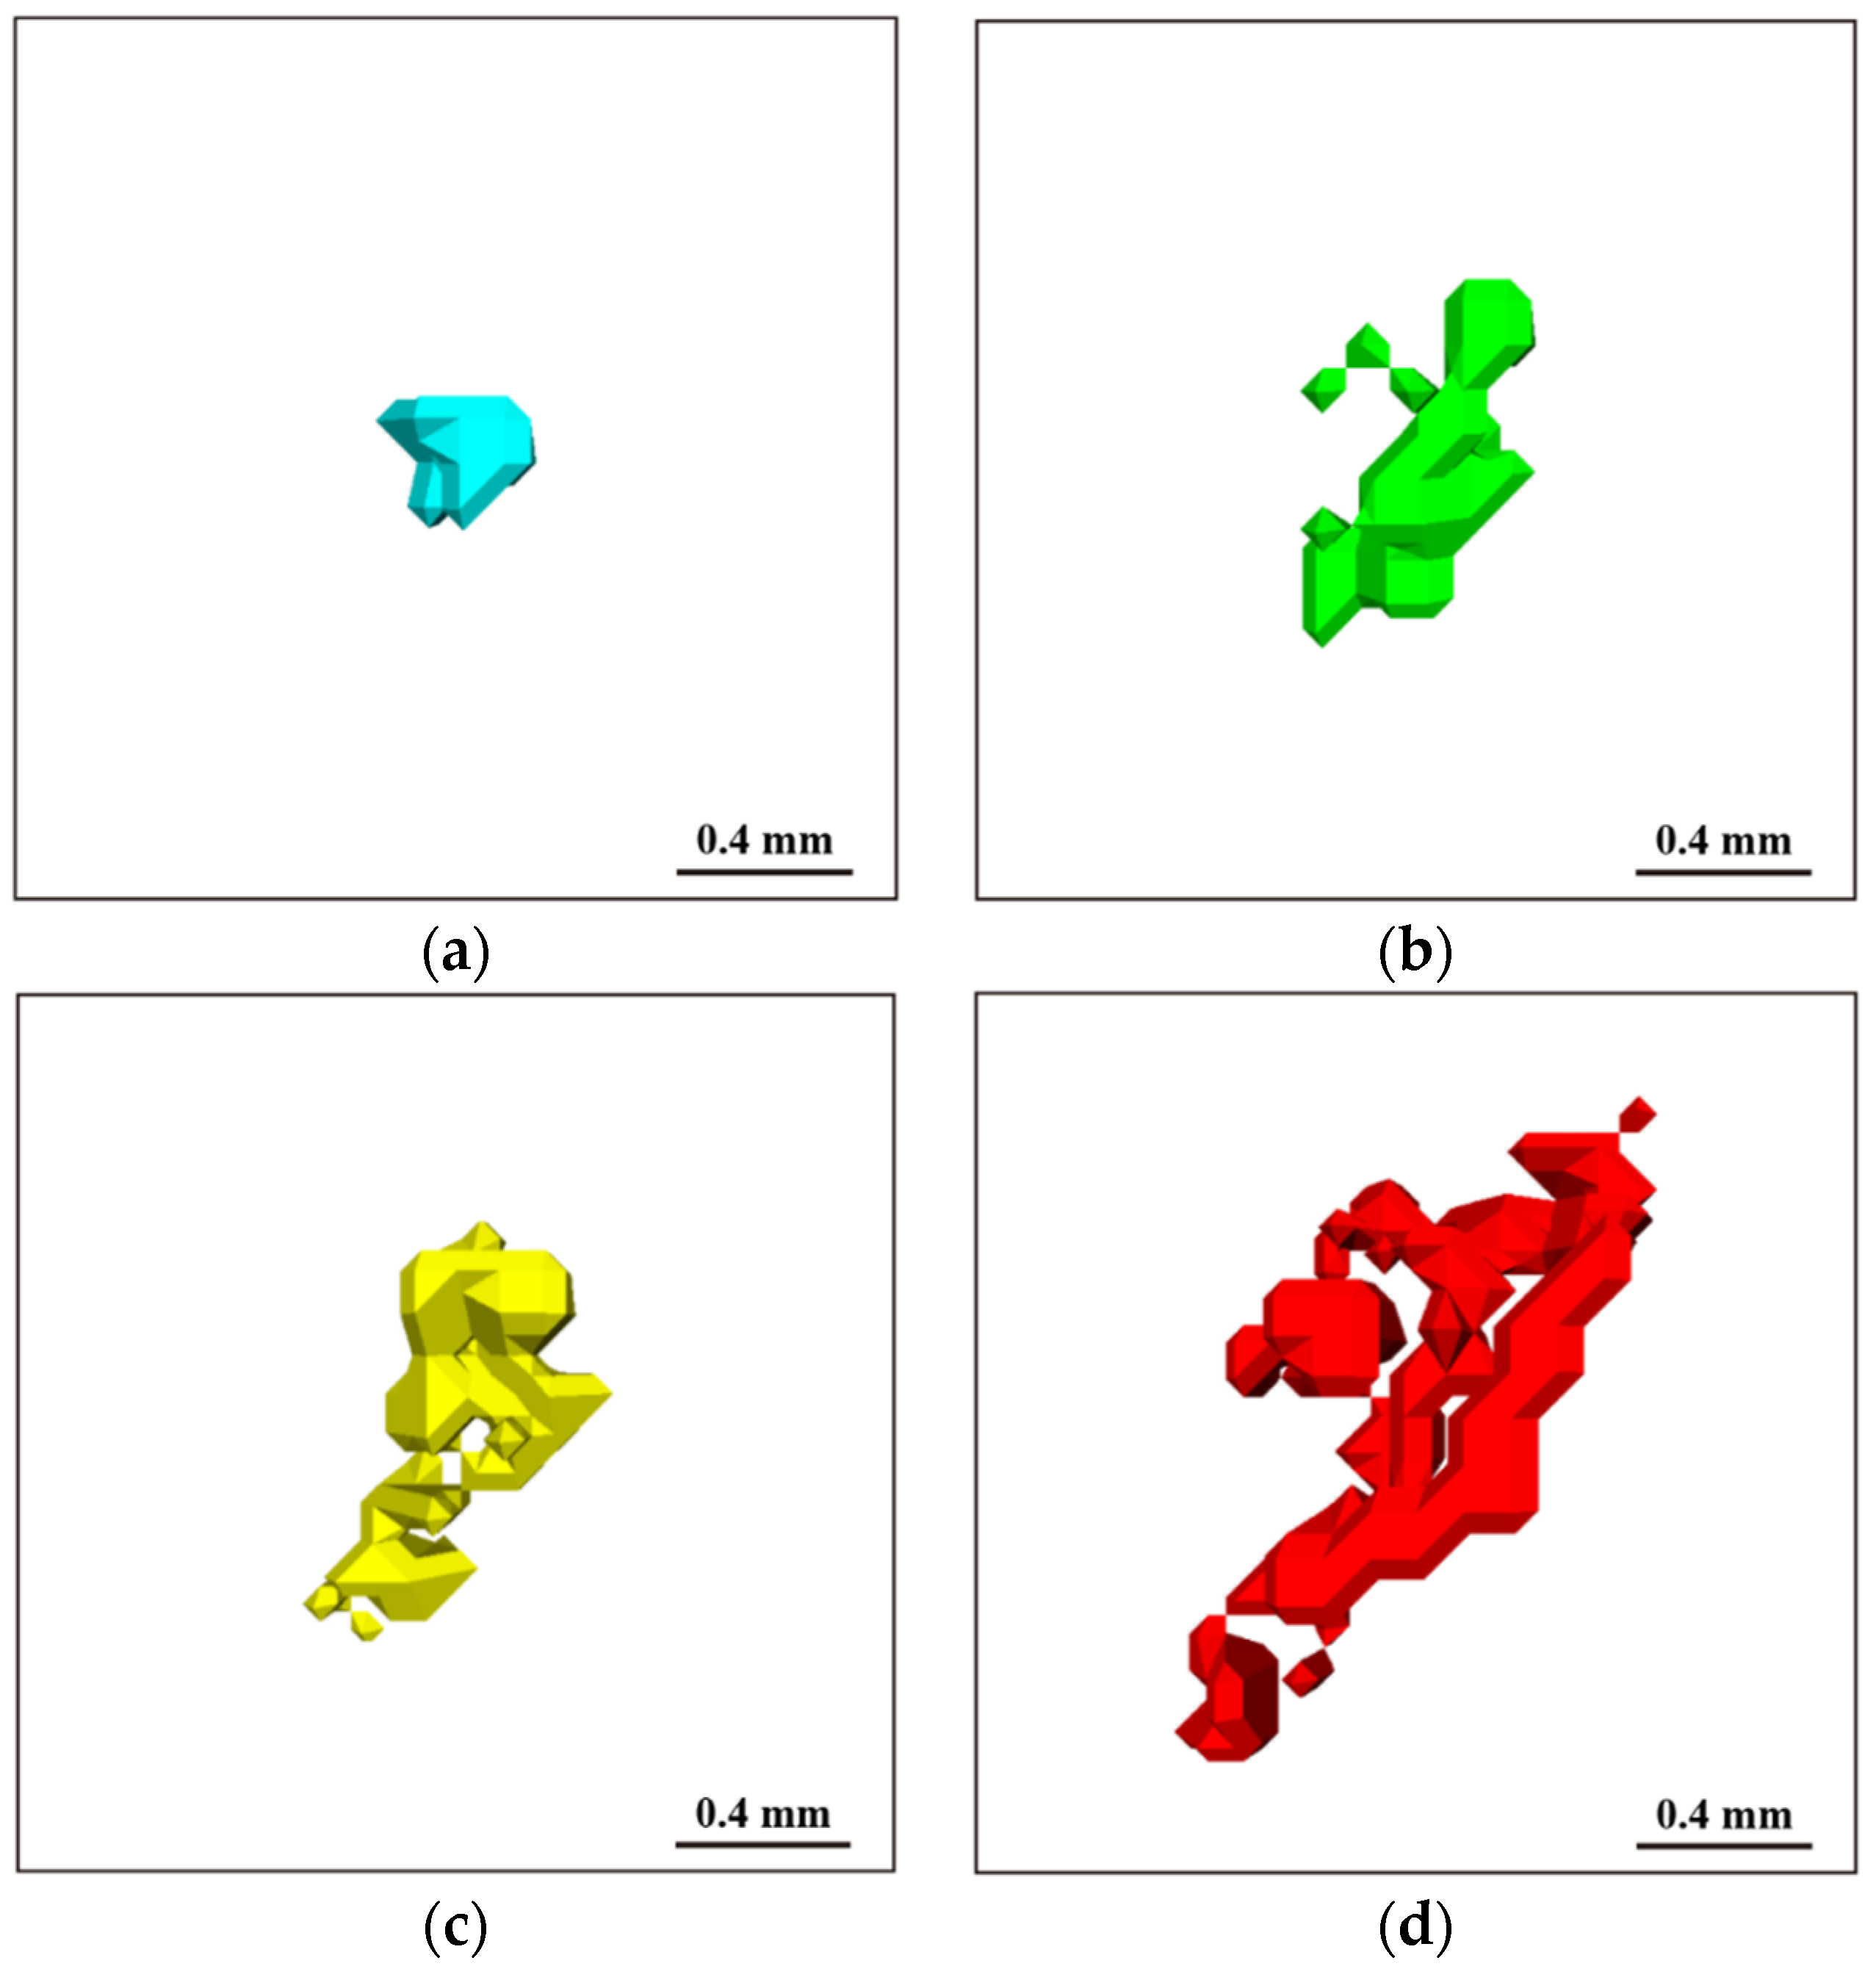
3.2. Morphological Characteristics of the Porosities

The data information on the porosity could be extracted by the 3D reconstruction of the images. According to the data on the porosity, the volume, surface area, equal volume sphere diameter and sphericity of porosity could be calculated. The equal volume sphere diameter of porosity refers to the diameter of a sphere with the same volume as a porosity, which is used to characterize the size of the porosity. Sphericity is the ratio of the surface area of the equal volume sphere to the actual surface area of a porosity, which is calculated with the following formula [25]:
  s = 36 π V 2 S 3 3  
where s is the sphericity, S is the actual surface area of the porosity (m2) and V is the actual volume (m3). The sphericity of an ideal sphere is 1. The more irregular the shape of a porosity, the smaller the sphericity. Both casting and solidification were performed under vacuum conditions in the experiment. Because the mold was preheated, no gas was generated. It was considered that the holes formed were all porosities, and the growth of porosity was restricted by the dendrites that were formed and will grow along the dendrites; thus, the porosity had an extremely complicated spatial structure. Figure 9 shows the morphology of the porosities with different sizes, and the characteristic data of the porosities are shown in Table 5.
Figure 9a shows that the equal volume sphere diameter of Porosity 1 was 0.288 mm, and the sphericity was 0.864. The shape of Porosity 1 was relatively regular and approximated a sphere. The surface of the porosity was not smooth. These small porosities less than 0.3 mm in diameter were formed between dendrites. The liquid metal between the dendrites was divided into unconnected small molten pools during the solidification. The liquid metal in the small molten pools continued to shrink without feeding during the subsequent cooling process; thus, scattered fine shrinkage pores were formed in the corresponding parts.
Figure 9b–d indicate that the sphericity decreased with an increase in the sizes of the porosities. The spatial structure of the porosity became more complicated, and the surface of the porosity became rougher. These large porosities, more than 0.3 mm in diameter, were generally formed at the final solidified part of the billet. It is difficult for the molten steel to feed the large porosities due to the poor fluidity, which results in larger and relatively concentrated porosities.

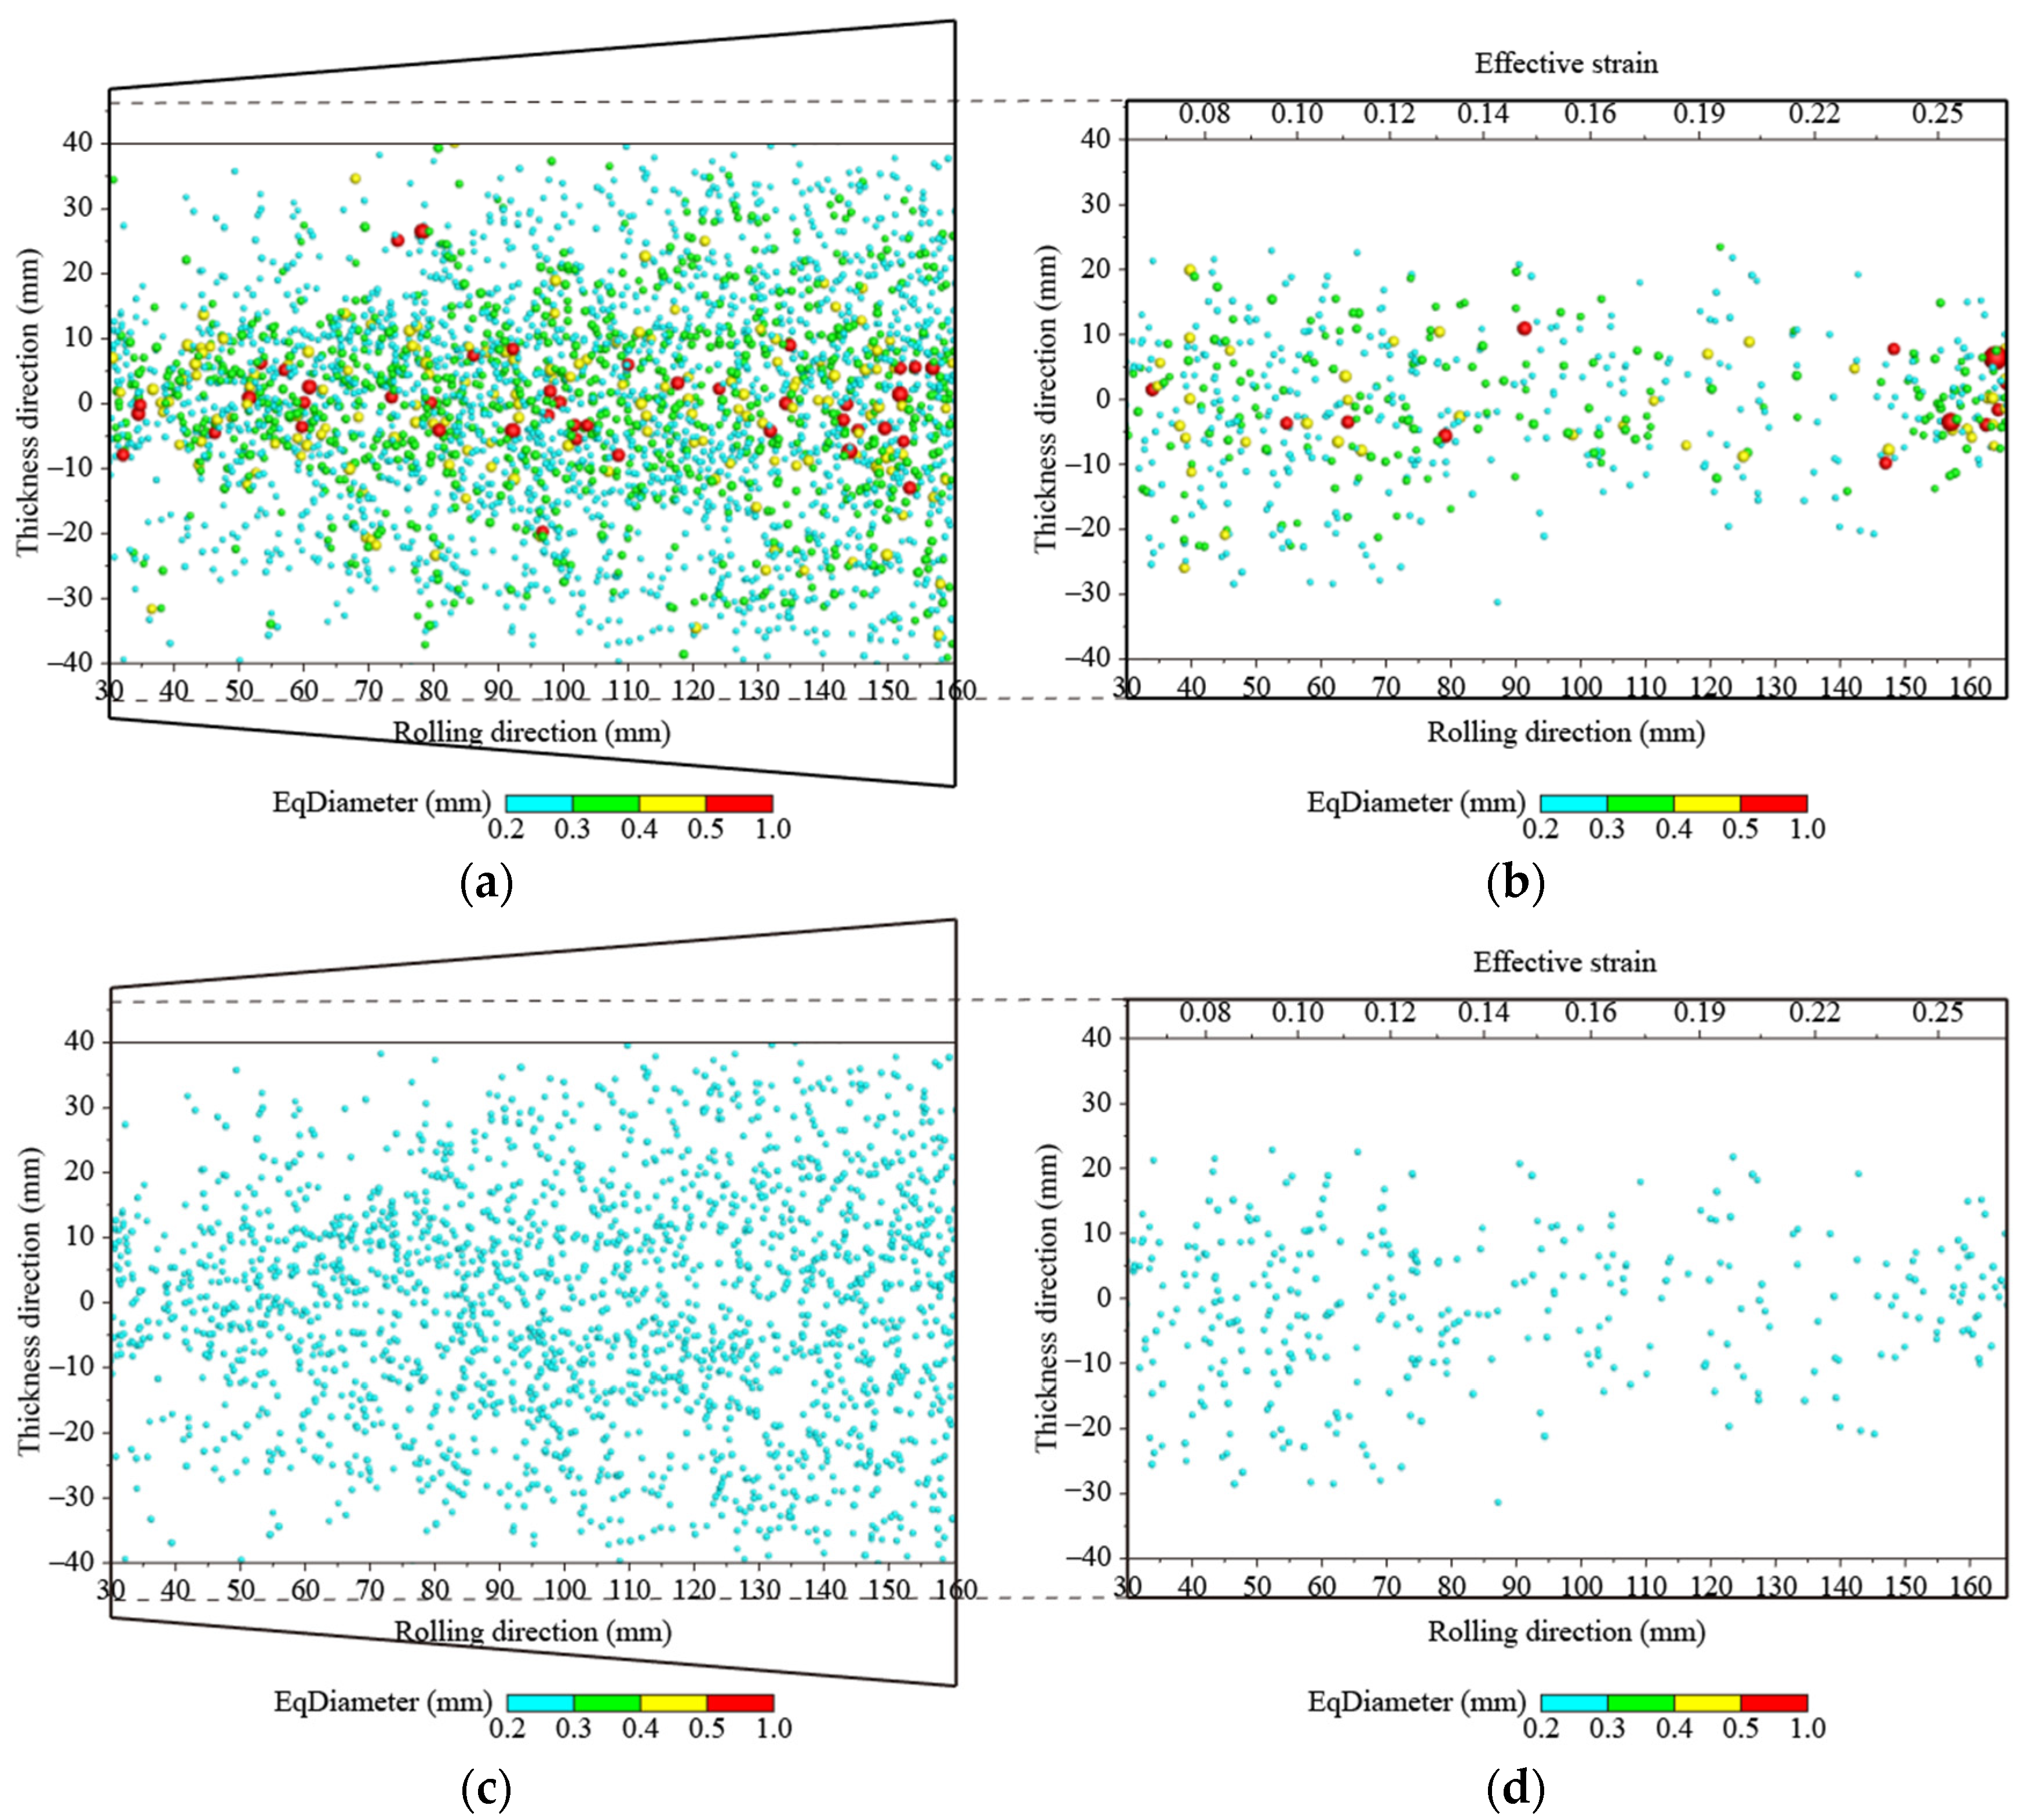
3.3. Distribution Characteristics of the Porosities

The reduction amount of each cross-section in the billet was different. In order to analyze the distribution characteristics of the porosities at the corresponding positions of the two billets, the sensor module in the software Forge (Forge 2011, TRANSVALOR, Rivieracity, France) was used to mark the tracking point on the billet before rolling. The corresponding position relationship between the two billets was determined according to the position change of the tracking point as shown in Figure 10. The abscissa is the width of the sample in the rolling direction, and the ordinate is the height of the sample in the thickness direction. After reduction, the effective strain of the section marked with the tracking point was calculated to characterize the local deformation [26].
At the same time, the size of the porosity was much smaller than that of the sample. In order to visualize the distribution of the porosities in the two samples, the positions and sizes of the porosities in the 3D reconstruction results were imported into the software Tecplot (Tecplot 360 EX 2015 R1, TECPLOT, Bellevue, WA, USA) for post-processing. The coordinates of the porosities did not change, and the images of the porosities were magnified two times and replaced by an equal volume sphere as shown in Figure 10.
Figure 10a shows the distribution of all porosities in the specimen without reduction. The number of internal porosities was large. The distribution of porosities was diffuse, and the diffuse area covered almost the whole specimen. The center of the billet was the final solidified area, and the liquid metal continued to shrink without feeding, which resulted in larger and relatively concentrated porosities. Figure 10a,c,e indicate that small porosities, less than 0.3 mm in diameter, were scattered in the external of the specimen but gathered in the center of the specimen. Large porosities, more than 0.3 mm in diameter, were mainly concentrated in the center of the specimen without reduction. The larger the size of porosity, the closer it was to the center.
Figure 10b shows the distribution of all porosities in the specimen with reduction. The total number of the porosities was significantly reduced after reduction. The porosities near the surface of the specimen disappeared first. The area where closed porosities existed gradually expanded to the center with the increase in reduction. The number of porosities in the center decreased. Figure 10b,d,f indicate that the porosities near the surface of the specimen disappeared first. The number of internal porosities decreased when the effective strain increased from 0.07 to 0.13. However, there were still many large porosities, more than 0.3 mm in diameter, in the center of the specimen.
As shown in Figure 10, the reduction began to effectively act on the center of the billet at the effective strain of 0.16, and the number of large porosities, more than 0.3 mm in diameter, was significantly reduced. When the deformation amount increased to 0.20–0.22, the porosity number at the center of the specimen was the smallest. As the deformation amount exceeded 0.25, the porosities gathered at the center of the billet, which may have caused larger defects. An appropriate reduction amount will discretize gathered defects and greatly improve the internal quality of the billet. An excessive reduction amount may compress the distribution area of defects and increase the density, but it will also cause larger defects in the center of the specimen.
The number of porosities at the reduction positions of 0.07, 0.10, 0.13, 0.16, 0.20 and 0.25 were counted, respectively, in the specimen with reduction. In the specimen without reduction, the number of porosities at the corresponding positions were also counted. The number of porosities in a unit volume of 1 cm3 at the corresponding positions of the two samples are shown in Figure 11.
As shown in Figure 11, for the specimen without reduction, the average number of porosities less than 0.3 mm in diameter was 245 per unit volume, and that more than 0.5 mm in diameter was 14 per unit volume. The number of small porosities was several times as many as that of the large porosities. There was a small difference in the number of porosities with the same diameter among different positions.
For the specimen with reduction, at the position where the effective strain was 0.07, the number of porosities less than 0.3 mm in diameter obviously decreased, which shows that the reduction effect on the small porosities was better than that on the large porosities. When the deformation increased from 0.07 to 0.13, the number of small porosities continued to decrease. As the number of large porosities decreased to a certain value, it was difficult for large porosities to continue to decrease due to the insufficient deformation. At the position where the effective strain was 0.2, the reduction can effectively act on the center of the billet. The number of porosities less than 0.4 mm in diameter was significantly reduced. The number of porosities between 0.4 and 0.5 mm in diameter at the deformation of 0.2 was more than those at the deformation of 0.1. The reason might be that the large porosities were compressed into small porosities when the reduction amount was larger. At the position where the effective strain was 0.25, the number of porosities was less than that in the specimen without reduction but more than that at other reduction positions. This shows that excessive reduction will cause high-temperature plastic damage and an increase in the number and sizes of porosities, which is not beneficial to improving the internal quality of the billet. Porosity degree at the reduction positions of 0.07, 0.10, 0.13, 0.16, 0.20 and 0.25 were counted, respectively, in the specimen with reduction. In the specimen without reduction, porosity degree at the corresponding positions were also counted. Porosity degree is the sum of the volume of all porosities in a unit volume. The statistical results of the porosity degree are shown in Figure 12.
Figure 12 shows the statistical results of the porosity degree at the reduction positions of 0.07, 0.10, 0.13, 0.16, 0.20 and 0.25, respectively, in the specimens. In the center of the specimen without reduction, the porosity degree per unit volume was between 1.8% and 2.0%. In the center of the specimen with reduction, the porosity degree decreased with the increase in reduction. When the deformation increased from 0.07 to 0.13, the change in the porosity degree was not obvious. However, the porosity degree decreased obviously as the deformation increased from 0.13 to 0.20. This shows that only if the reduction is large enough, can the reduction effectively act on the center of the billet, and the volume of the center porosity will be significantly reduced until it is closed. At the position where the deformation was 0.25, the porosity degree was significantly larger than those of other reduction positions. Due to the high center temperature, the grain boundary strength was lower than the intragranular strength. Grain boundary slip controlled by diffusion gradually replaced the dislocation movement. At the grain boundary perpendicular to the direction of tensile stress, the stress exceeds a critical value with the increase in the reduction amount and, thus, porosities are formed by vacancy aggregation. This indicates that an excessive reduction is not beneficial to improve the internal quality of the billet.

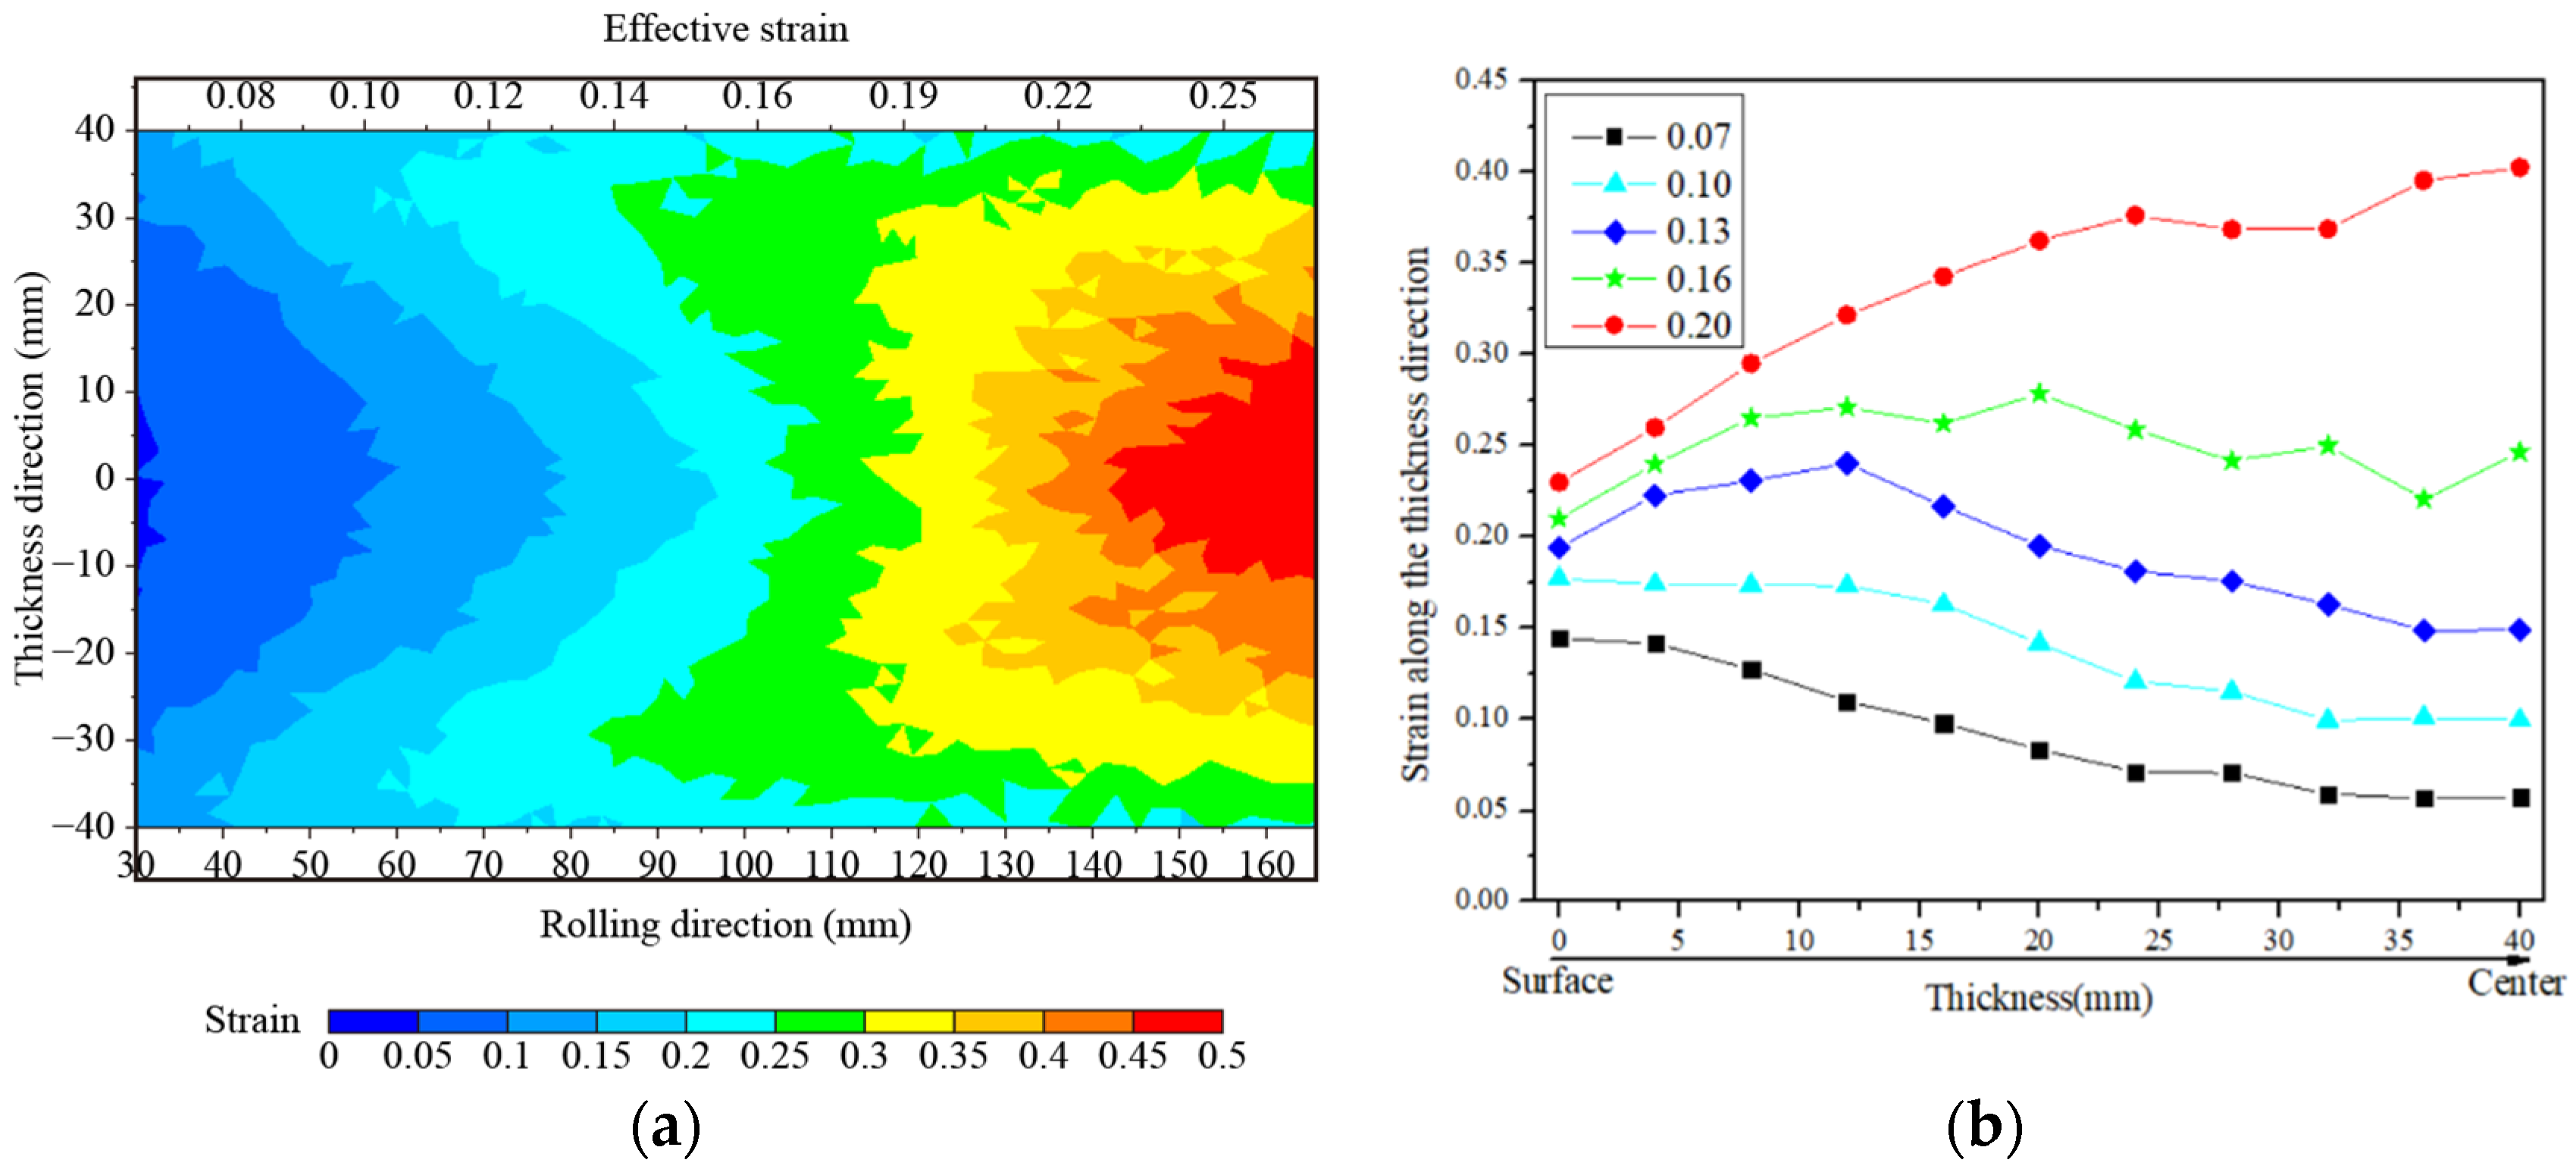
3.4. Strain Distribution of the Reduction Pretreatment

Due to uneven deformation during the rolling of large billets, the structure and properties are not uniform in the thickness direction. The reduction pretreatment using temperature gradient can change the strain distribution in the thickness direction of the billet. The strain distribution on the longitudinal section of the specimen with reduction is shown in Figure 13a. It can be seen that the maximum strain appeared near the surface of the billet when the deformation was 0.07. The phenomenon of strain stratification in the thickness direction was very obvious. The maximum strain position moved to the center along the thickness direction as the reduction amount increased.
Figure 13b shows the strain distribution at different reduction positions along the thickness direction. At the position where the deformation was 0.07, the deformation was concentrated on the surface. The surface strain was 0.14, and the center strain was 0.05. The strain gradually decreased from the surface to the center. At the position where the deformation was 0.10, the strain was uniformly distributed with an average value of 0.17 near the surface of the billet, and the internal strain was smaller than the external one. At the position where the deformation was 0.13, the position with the maximum of strain gradually moved toward the center, but it was not large enough to directly penetrate into the center from the surface. At the position where the deformation was 0.16, the internal strain was slightly larger than the strain near the surface. The strain distribution in most areas including the center was relatively uniform, and the average strain was approximately 0.25. This shows that the external reduction had a direct impact on the deformation of the center, and the reduction can be directly transferred to the center. At the position where the deformation was 0.20, the deformation penetrated into the center as the reduction increased, and the thickness becomes thinner. The surface deformation resistance of the billet was high, and the center deformation resistance was low. Deformation will preferentially occur in the center, and the center strain could reach 0.4, which is almost twice as much as the surface strain. The center strain was multiplied when the reduction amount greatly exceeded 0.20. Once the deformation amount exceeds a critical value, plastic damage will occur, and cracks may generate.
Both the results of the experimental and simulation show that a large reduction amount can effectively act at the center of the billet and promote the closure of porosities when the center temperature of the billet is above 1300 °C and there is a temperature difference of 400 °C between the surface and the center. The shape ratio of each cross-section of the bullet-shaped billet had small difference when the reduction was the same. Therefore, the effects of reduction and temperature on deformation penetration are mainly discussed.

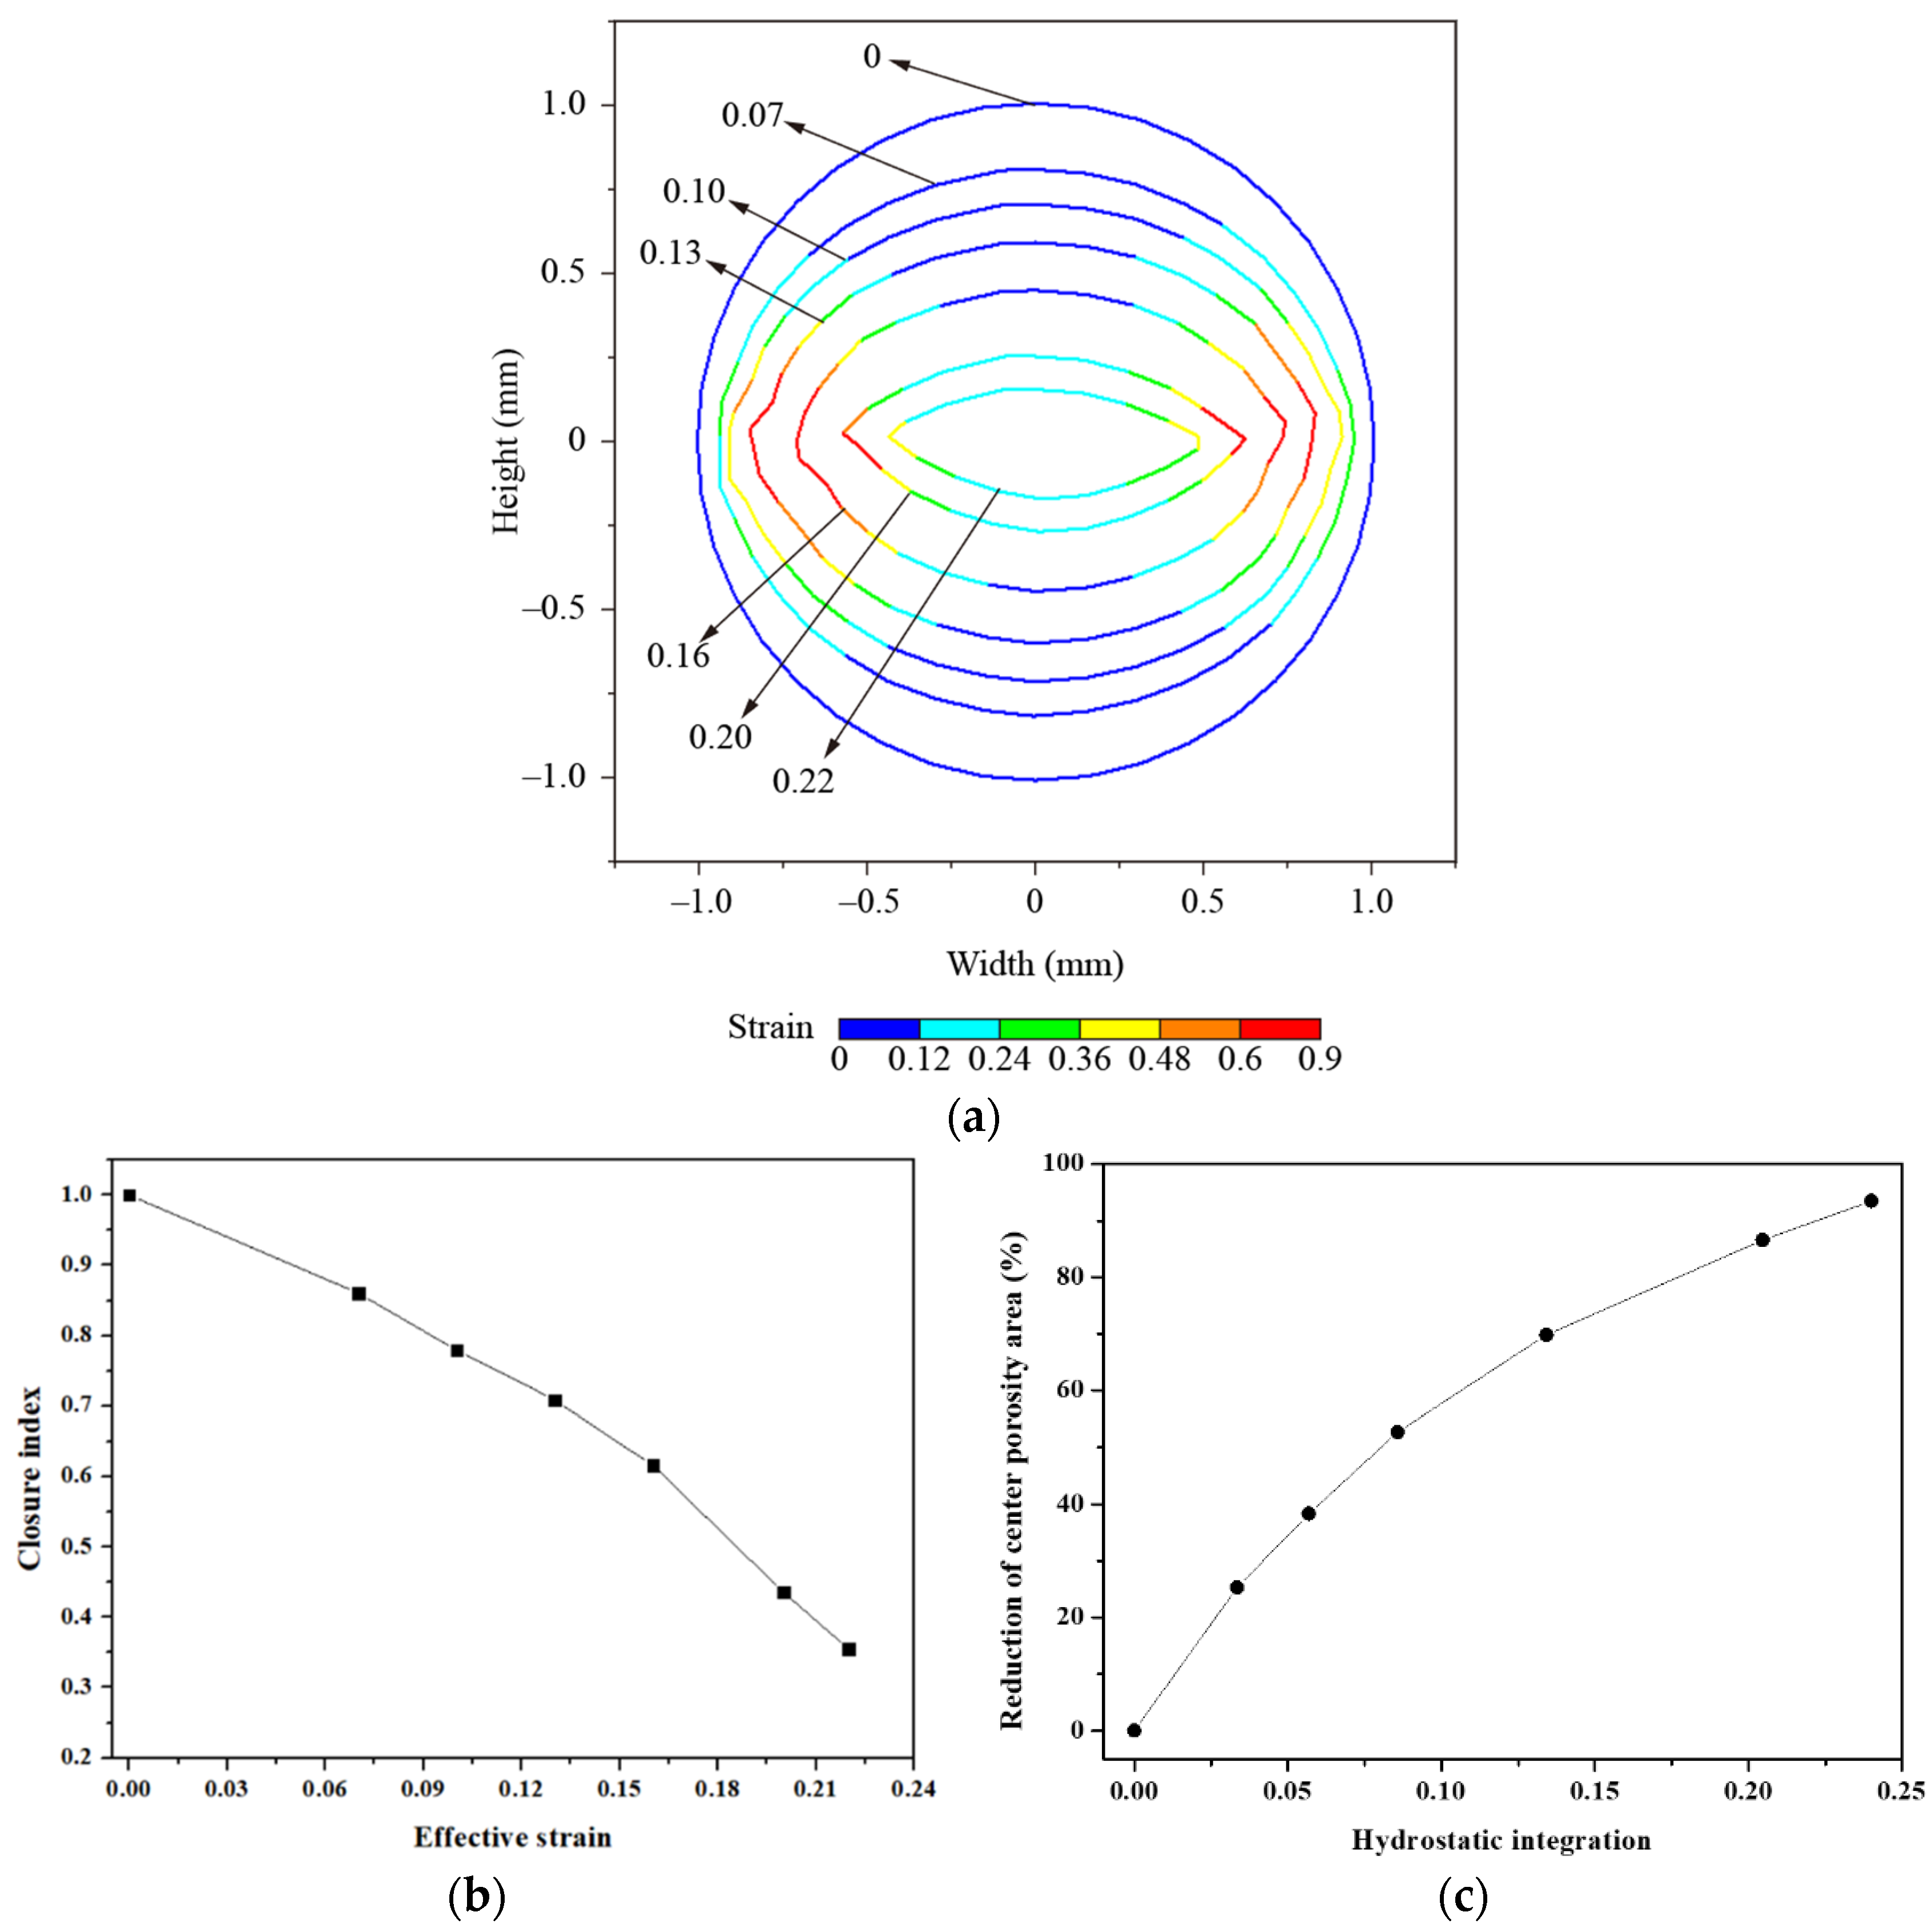
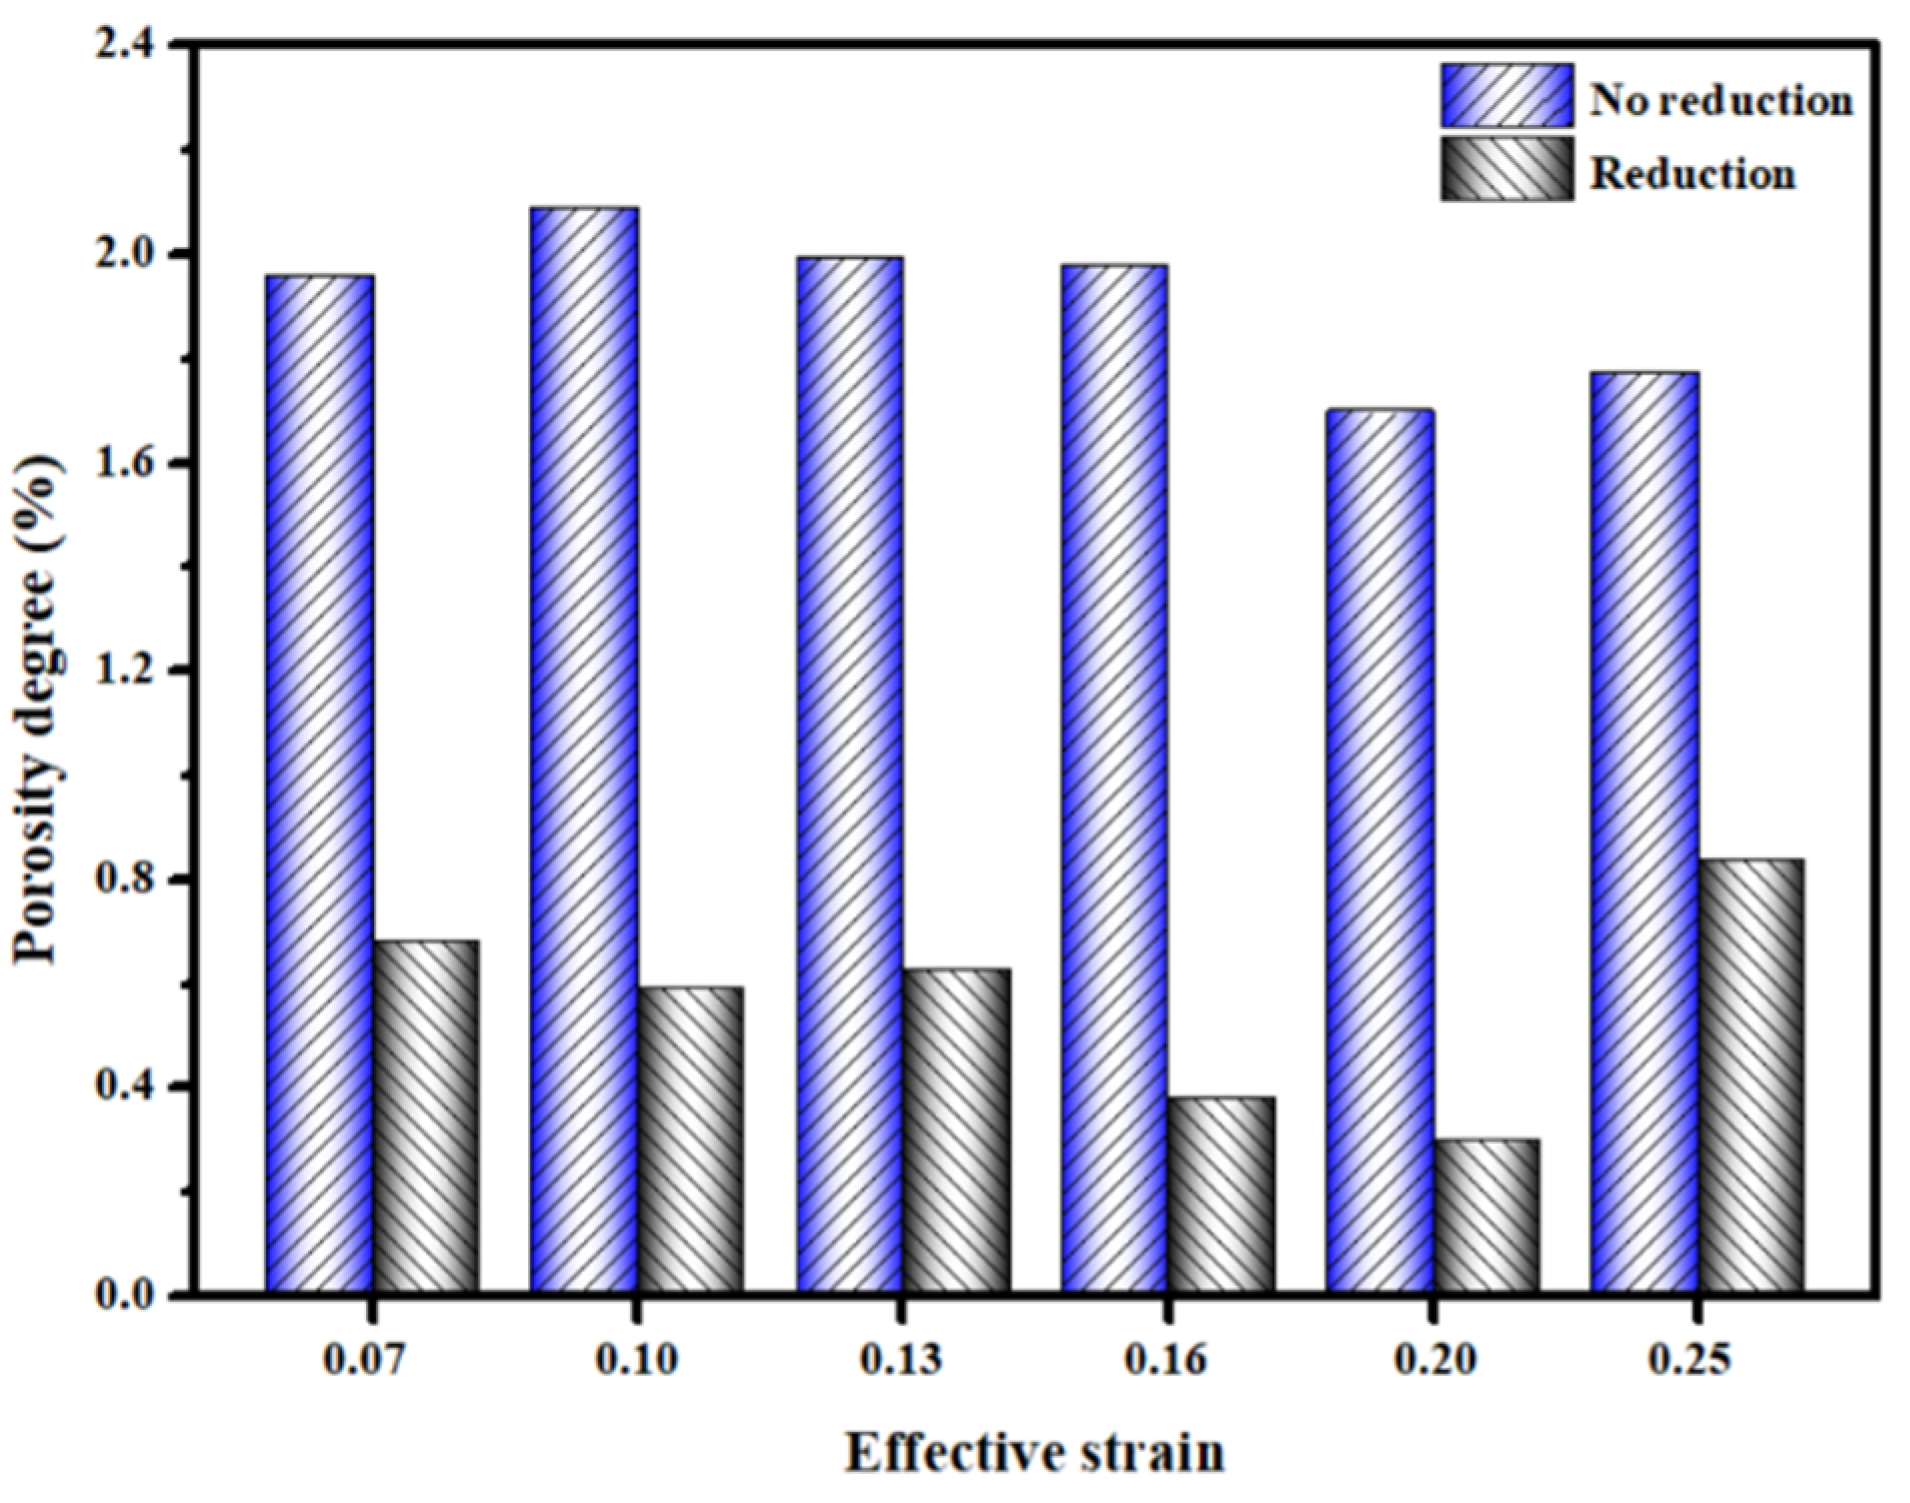
3.5. Analysis of Porosity Closure

Figure 14a shows the shape change of the spherical porosity with a diameter of 2 mm at the center of the billet and the strain distribution around the porosity. The initial shape of the center section of the spherical porosity was circular. As the reduction amount increased, the upper and lower surfaces of the porosity were compressed to the center of the porosity in the thickness direction. The two ends of the porosity were not significantly stretched but bonded together in the rolling direction. The cross-section gradually changed from a circle to an irregular ellipse, and the cross-sectional area of the porosity was significantly reduced.
In the thickness direction, the equivalent strain of the upper and lower surfaces of the porosity gradually increased as the reduction amount increased, but the increase was not obvious. When the deformation was less than 0.16, the equivalent strain of both surfaces of the porosity was less than 0.1. In the rolling direction, the equivalent strain of both ends of the porosity increased as the reduction amount increased, which indicates that the stress in this area was more concentrated. The equivalent strain of the closed region at both ends of the porosity was above 0.6. It is basically consistent with the study by Lee et al. [13]. Their results showed that when the local equivalent strain exceeded 0.6, the internal porosity of the casting would be closed during the forging process. The closer the two ends of the porosity were to the closed area, the greater the equivalent strain.
In order to quantitatively analyze the shape change of the porosity, the porosity closure index k = H / W was defined, where k is the closure index, H and W are the height and width of the porosity, respectively. The smaller the closure index k, the greater the change in the shape of the porosity.
The hydrostatic integration ( G m ) is usually used to evaluate the closure degree of the center porosity in single-pass forging and rolling processes. The hydrostatic integration G m is expressed as follows:
  G m = 0 ε ( σ m σ e q ) d ε
where σ m is the mean normal stress (MPa), σ e q is the equivalent stress (MPa) and ε is the equivalent strain.
Figure 14b shows the relationship between the porosity closure index k = H / W and the reduction amount. The initial section of porosity is a circle, and the closure index is 1. The closure index decreased with the increase in the reduction amount. The relationship between the porosity closure index and the reduction amount was basically linear. The curve can roughly be divided into two sections according to the slopes. When the deformation was less than 0.16, the slope of the curve was relatively small. When the reduction amount was greater than 0.16, the slope of the curve was relatively large. The distribution characteristics of the strain showed that when the deformation was 0.16, the internal strain distribution in the billet was uniform, and the effect of reduction on the center of the billet was obvious. With the further increase in the reduction amount, the change in the height of the porosity accelerated, which was more conducive to the closure of the porosity and improved the reduction efficiency.
The relationship between the reduction in the section area of the porosity and the hydrostatic integration is shown in Figure 14c. As the reduction amount increased, the mean normal stress and equivalent strain around the porosity increased in the multiple. Therefore, the hydrostatic integration also increased, and the section area of the porosity gradually reduced. This indicates that hydrostatic integration can be used to assess the closure degree of porosity during the reduction pretreatment. Both the closure index and the hydrostatic integration prove the effective role of reduction pretreatment in the alleviation of porosity.

4. Conclusions

In the present study, the reduction pretreatment process was proposed as a novel strategy to alleviate the center porosities in large billets. The mechanism of the reduction pretreatment was studied by experiments and simulations. The main conclusions are as follows:
(1) After complete solidification, an obvious temperature difference existed between the surface and the center of the billet. The temperature gradient on the surface of the billet was the largest, while the center temperature gradient was the smallest. The reduction pretreatment using the temperature gradient can increase the center deformation;
(2) The porosity has a complicated spatial structure. The porosities near the surface of the billet were firstly closed during the reduction pretreatment. The reduction began to effectively act on the center of the billet at the deformation of 0.16. When the deformation increases to 0.20–0.22, both the pore number and the porosity degree at the center of the billet were the smallest. As the deformation exceeded 0.25, the porosities gathered at the center of the billet, which may have caused larger defects;
(3) The position with the maximum of strain moved toward the center of the billet as the reduction amount increased. The reduction began to effectively act on the center of the billet at the deformation of 0.16. At the position where the deformation was 0.20, the deformation will readily occur at the center, and the center strain was almost twice as much as the surface strain;
(4) The upper and lower surfaces of porosity were compressed to the center of the porosity in the thickness direction. The two ends of porosity were not stretched in the rolling direction. The closure index indicated that the deformation penetrating into the center will accelerate the deformation of porosity. The cross-sectional area of the porosity gradually decreases with the increase in the hydrostatic integration, which indicates that hydrostatic integration can be used to assess the closure degree of porosity during the reduction pretreatment process. Both the closure index and the hydrostatic integration prove the effective role of the reduction pretreatment in the alleviation of porosity.

Author Contributions

Conceptualization, Y.L. and J.L.; methodology, Y.L. and J.L.; software, Y.L.; validation, Y.L., J.L. and Y.H.; formal analysis, Y.L.; investigation, Y.L. and Y.H.; resources, Y.L., J.L. and Y.H.; data curation, Y.L., J.L. and Y.H.; writing—original draft preparation, Y.L.; writing—review and editing, Y.L.; visualization, Y.L.; supervision, J.L. and Y.H.; project administration, J.L. and Y.H.; funding acquisition, J.L. and Y.H. All authors have read and agreed to the published version of the manuscript.

Funding

This work was funded by the National Key Research and Development Program of China (2021YFE0113200) and the Fundamental Research Funds for the Central Universities (FRF-TP-20-104A1).

Institutional Review Board Statement

Not applicable.

Informed Consent Statement

Not applicable.

Data Availability Statement

Not applicable.

Acknowledgments

The authors would like to thank the National Engineering Research Center for Advanced Rolling and Intelligent Manufacturing, University of Science and Technology Beijing, for providing their technical support.

Conflicts of Interest

The authors declare no conflict of interest. The funding sponsors had no role in the choice of research project; design of the study; in the collection, analyses or interpretation of data; in the writing of the manuscript; or in the decision to publish the results.

References

  1. Hu, Y.N.; Wu, S.C.; Withers, P.J.; Zhang, J.; Bao, H.Y.X.; Fu, Y.N.; Kang, G.Z. The effect of manufacturing defects on the fatigue life of selective laser melted Ti-6Al-4V structures. Mater. Des. 2020, 192, 108708. [Google Scholar] [CrossRef]
  2. Sonsino, C.M.; Ziese, J. Fatigue strength and applications of cast aluminium alloys with different degrees of porosity. Int. J. Fatigue 1993, 15, 75–84. [Google Scholar] [CrossRef]
  3. Bao, J.; Wu, S.; Withers, P.J.; Wu, Z.; Li, F.; Fu, Y.; Sun, W. Defect evolution during high temperature tension-tension fatigue of SLM AISi10Mg alloy by synchrotron tomography. Mater. Sci. Eng. A 2020, 792, 139809. [Google Scholar] [CrossRef]
  4. Dezecot, S.; Maurel, V.; Buffiere, J.Y.; Szmytka, F.; Koster, A. 3D characterization and modeling of low cycle fatigue damage mechanisms at high temperature in a cast aluminum alloy. Acta Mater. 2017, 123, 24–34. [Google Scholar] [CrossRef]
  5. Skallerud, B.; Iveland, T.; Härkegård, G. Fatigue life assessment of aluminum alloys with casting defects. Eng. Fract. Mech. 1993, 44, 857–874. [Google Scholar] [CrossRef]
  6. Buffière, J.Y.; Savelli, S.; Jouneau, P.H.; Maire, E.; Fougères, R. Experimental study of porosity and its relation to fatigue mechanisms of model Al-Si7-Mg0.3 cast Al alloys. Mater. Sci. Eng. A 2001, 316, 115–126. [Google Scholar] [CrossRef]
  7. Leitner, M.; Garb, C.; Remes, H.; Stoschka, M. Microporosity and statistical size effect on the fatigue strength of cast aluminium alloys EN AC-45500 and 46200. Mater. Sci. Eng. A 2017, 707, 567–575. [Google Scholar] [CrossRef]
  8. Cai, C.; Geng, H.; Cui, Q.; Wang, S.; Zhang, Z. Low cycle fatigue behavior of AlSi10Mg(Cu) alloy at high temperature. Mater. Charact. 2018, 145, 594–605. [Google Scholar] [CrossRef]
  9. Niyama, E.; Uchida, T.; Morikawa, M.; Saito, S. Predicting shrinkage in large steel castings from temperature gradient calculations. Int. J. Cast Met. Res. 1981, 6, 16–22. [Google Scholar]
  10. Niyama, E.; Uchida, T.; Morikawa, M.; Saito, S. A method of shrinkage prediction and its application to steel casting practice. Int. J. Cast Met. Res. 1982, 7, 52–63. [Google Scholar]
  11. Chaaban, M.A.; Alexander, J.M. A study of the closure of cavities in swing forging. In Proceedings of the Seventeenth International Machine Tool Design and Research Conference, Birmingham, UK, 20–24 September 1976; pp. 633–645. [Google Scholar] [CrossRef]
  12. Nakasaki, M.; Takasu, I.; Utsunomiya, H. Application of hydrostatic integration parameter for free-forging and rolling. J. Mater. Process. Technol. 2006, 177, 521–524. [Google Scholar] [CrossRef]
  13. Lee, Y.S.; Lee, S.U.; Van Tyne, C.J.; Joo, B.D.; Moon, Y.H. Internal void closure during the forging of large cast ingots using a simulation approach. J. Mater. Process. Technol. 2011, 211, 1136–1145. [Google Scholar] [CrossRef]
  14. Wang, B.; Zhang, J.; Xiao, C.; Song, W.; Wang, S. Analysis of the evolution behavior of voids during the hot rolling process of medium plates. J. Mater. Process. Technol. 2015, 221, 121–127. [Google Scholar] [CrossRef]
  15. Chen, Y.; Li, G.; Yang, S.; Zhu, M. Dynamic soft reduction for continuously cast rail bloom. J. Iron Steel Res. Int. 2007, 14, 13–17. [Google Scholar] [CrossRef]
  16. Cao, X.; Wang, Y.; Chen, J. Finite element analysis of soft reduction for round bloom continuous casting. Contin. Cast. 2018, 43, 14–16. [Google Scholar] [CrossRef]
  17. Hiraki, S.; Yamanaka, A.; Shirai, Y.; Satou, Y.; Kumakura, S. Development of new continuous casting technology (PCCS) for very thick plate. Mater. Jpn. 2009, 48, 20–22. [Google Scholar] [CrossRef] [Green Version]
  18. Zhao, X.; Zhang, J.; Lei, S.; Wang, Y. The position study of heavy reduction process for improving centerline segregation or porosity with extra-thickness slabs. Steel Res. Int. 2014, 85, 645–658. [Google Scholar] [CrossRef]
  19. Wang, W.; Ning, L.; Bülte, R.; Bleck, W. Formation of internal cracks in steel billets during soft reduction. J. Univ. Sci. Technol. Beijing Miner. Metall. Mater. 2008, 15, 114–119. [Google Scholar] [CrossRef]
  20. Yu, W.; Li, G.; Cai, Q. Effect of a novel gradient temperature rolling process on deformation, microstructure and mechanical properties of ultra-heavy plate. J. Mater. Process. Technol. 2015, 217, 317–326. [Google Scholar] [CrossRef]
  21. Li, G.; Yu, W.; Cai, Q. Investigation of reduction pretreatment process for continuous casting. J. Mater. Process. Technol. 2016, 227, 41–48. [Google Scholar] [CrossRef]
  22. Zhao, J.; Ma, L.; Zayed, M.E.; Elsheikh, A.H.; Li, W.; Yan, Q.; Wang, J. Industrial reheating furnaces: A review of energy efficiency assessments, waste heat recovery potentials, heating process characteristics and perspectives for steel industry. Process Saf. Environ. Prot. 2021, 147, 1209–1228. [Google Scholar] [CrossRef]
  23. Janik, M.; Dyja, H. Modelling of three-dimensional temperature field inside the mould during continuous casting of steel. J. Mater. Process. Technol. 2004, 157, 177–182. [Google Scholar] [CrossRef]
  24. Hensel, A.; Spittel, T. Kraft- und Arbeitsbedarf Bildsamer Formgebungsverfahren, 1st ed.; VEB Deutscher Verlag fur Grundstoffindustrie: Leipzig, Germany, 1978. [Google Scholar]
  25. Jiang, L.; Chawla, N.; Pacheco, M.; Noveski, V. Three-dimensional (3D) microstructural characterization and quantification of reflow porosity in Sn-rich alloy/copper joints by X-ray tomography. Mater. Charact. 2011, 62, 970–975. [Google Scholar] [CrossRef]
  26. Lee, Y.; Kim, Y.H. Approximate analysis of roll force in a round-oval-round pass rolling sequence. J. Mater. Process. Technol. 2001, 113, 124–130. [Google Scholar] [CrossRef]
Figure 1. Schematic of the casting experiment: (a) dimensions of the billet (mm); (b) setup for measuring temperature; (c) finite element model of heat transfer.
Metals 12 00599 g001
Figure 2. Model of reduction pretreatment.
Metals 12 00599 g002
Figure 3. Meshing of the porosity.
Metals 12 00599 g003
Figure 4. Schematic of the ultrasonic scanning area: (a) specimen without reduction; (b) specimen with reduction.
Metals 12 00599 g004
Figure 5. Schematic of ultrasonic flaw detection.
Metals 12 00599 g005
Figure 6. Analysis flow diagram.
Metals 12 00599 g006
Figure 7. A comparison between the measured and simulation temperatures: (a) during solidification; (b) correlation between the simulated and experimental temperatures in the stable stage.
Metals 12 00599 g007
Figure 8. Temperature distribution before the reduction pretreatment.
Metals 12 00599 g008
Figure 9. Morphology of the porosities with different sizes: (a) Porosity 1; (b) Porosity 2; (c) Porosity 3; (d) Porosity 4.
Metals 12 00599 g009
Figure 10. Defects distribution diagrams of porosities in the specimens: (a) all porosities in the specimen without reduction; (b) all porosities in the specimen with reduction; (c) small porosities in the specimen without reduction; (d) small porosities in the specimen with reduction; (e) large porosities in the specimen without reduction; (f) large porosities in the specimen with reduction.
Metals 12 00599 g010aMetals 12 00599 g010b
Figure 11. Distributions of porosities in the specimens: (a) the number of porosities with a diameter between 0.2 and 0.3 mm; (b) the number of porosities with a diameter between 0.3 and 0.4 mm; (c) the number of porosities with a diameter between 0.4 and 0.5 mm; (d) number of porosities with a diameter more than 0.5 mm.
Metals 12 00599 g011
Figure 12. Results of the porosity degree for the different reduction conditions.
Metals 12 00599 g012
Figure 13. Distribution of strain: (a) cloud map of strain distribution; (b) plastic strain along the thickness direction with different reduction amounts.
Metals 12 00599 g013
Figure 14. Closure of porosity with different reduction conditions: (a) analysis of morphology and equivalent strain of porosity; (b) closure index; (c) the relationship between hydrostatic integration and the reduction of porosity area.
Metals 12 00599 g014
Table 1. Chemical composition of the experimental billets (wt%).
CSiMnPSFe
Billet 10.400.501.480.00550.0064BAL
Billet 20.390.511.500.00590.0061BAL
Table 2. Simulation parameters.
ParametersValue
Temperature (°C)80012001400142514901500
Density (kg·m−3)760074007300720070007000
Specific heat (J·kg−1·K−1)600661692700810830
Thermal conductivity (W·m−1·K−1)25303334170170
Table 3. Heat transfer coefficient in the simulation.
ParametersValue
t (s)03366100150200250300330360
h (W·m−2·k−1)30001500100205140120130145260180
Table 4. Parameters of the deformation resistance model.
C m 1 m 2 m 3 m 4 Correlation Coefficient
2704.034−0.0031−0.01060.1706−0.01920.98
Table 5. Characteristic data of the porosities in Figure 9.
PorosityVolume (mm3)Surface Area (mm2)EqDiameter (mm)Sphericity
10.0130.3020.2880.864
20.0270.6440.3740.681
30.0551.1790.4710.590
40.1012.4400.5780.430
Publisher’s Note: MDPI stays neutral with regard to jurisdictional claims in published maps and institutional affiliations.

