Article

Numerical Modelling of Blasting Dust Concentration and Particle Size Distribution during Tunnel Construction by Drilling and Blasting

1
Beijing Key Laboratory of Urban Underground Space Engineering, School of Civil and Resource Engineering, University of Science and Technology Beijing, Beijing 100083, China
2
Faulty of Public Security and Emergency Management, Kunming University of Science and Technology, Kunming 650093, China
*
Author to whom correspondence should be addressed.
Metals 2022, 12(4), 547; https://doi.org/10.3390/met12040547
Submission received: 24 January 2022 / Revised: 18 March 2022 / Accepted: 19 March 2022 / Published: 23 March 2022
(This article belongs to the Special Issue Green Low-Carbon Technology for Metalliferous Minerals)

Abstract

:
In order to reduce the blasting dust concentration in the tunnel during the drilling and blasting, accelerate the tunnel excavation process, and improve the working environment for the construction workers, a three-dimensional geometric model of dust transport was established based on the gas-solid two-phase flow model using the DesginModeler software, and the discrete phase model (DPM) in the FLUENT software was used to simulate the variation of dust concentration and the distribution of dust particle size at different locations along the tunnel route within 1200 s after tunnel blasting. The results showed that the concentration of blasting dust gradually decreased over time, with the fastest decrease in the range of 2 s to 120 s, and after 900 s, the dust concentration stabilized. The overall spatial distribution of the dust concentration showed a trend of decreasing from the palm face to the tunnel entrance and from the bottom plate to the upper part. The distribution pattern of dust with different particle sizes was not the same along the length of the tunnel. The large particles settled in the area of 25 m from the palm face under the action of gravity. With the increases of distance, the mass flow rate decreased, and the dust particle size became smaller, but the proportion of small particles gradually increased, while the R-R distribution index increased. The results in this study were confirmed to be reliable by comparing the measured data to provide guidance for the dust reduction technology in tunnel blasting, so as to quickly remove the dust generated during the blasting process and improve the engineering construction efficiency.

1. Introduction

The green low-carbon technology of metal mining process has become a research hotspot for scholars at home and abroad in recent years. Green low-carbon technology is vital to promote the development of metalliferous mineral resources shifting from extensive destructive mining to clean and energy-saving mining in future decades. The drilling and blasting method is one of the most widely used and cost-effective excavation construction methods in tunneling projects, but a large amount of dust with extremely high mass concentrations would be generated in the process of blasting [1,2], which is not in line with green low-carbon mining. The high dust concentration not only greatly affects the safety and progress of tunnel construction, but also causes a serious threat to the health of the operators. By the end of 2020, a total of 17,064 new cases of various occupational diseases were reported nationwide, of which occupational pneumoconiosis alone accounted for 14,367 cases [3]. Therefore, the study of the tunnel blasting dust transport law and particle size distribution characteristics can be used to explore a green low-carbon mining method to reduce the dust generated by blasting, improve the tunnel construction environment, and protect the health of operators.
At present, the research on dust migration properties by international and domestic scholars is mainly focused on the field of coal mining. Its roadway cross-sectional area is small, much smaller than the current cross-sectional area of the new road tunnel. Therefore, the dust generated by blasting mainly accumulates near the blasting excavation surface, which produces more serious pollution [4,5]. Yucheng Li [6] studied the non-stationary transport law of blasting dust in the roadway space and derived the distribution trend of the settling amount of different particle sizes of dust along the longitudinal direction of the roadway. Guoliang Zhang [7] simulated the dust motion trajectory of a plateau mine based on FLUENT, and the results can be used to determine the minimum dust exhaust air velocity of a mine in a plateau environment. Lichao Zhang [8] analyzed the spatial distribution of the dust concentration and particle size at the fully mechanized coal mining face. Sa [9] derived reasonable ventilation parameters by studying the changes of the dust concentration by ventilation in 20 min after blasting in a cavern stope and the dust trajectory at different wind speeds. In terms of tunnel dust migration, Kanaoka [10] performed numerical simulations of wind flow, dust mass concentration distribution, and particle movement in construction tunnels. Yapeng Wang [11] simulated the drilling dust migration in a long-distance single-ended tunnel and established the ventilation parameters and dust removal methods. Zhongqiang Sun [12] analyzed the stress condition of dust particles in the tunnel space and simulated the transport law of dust in different processes. Mengmeng Quan [13] conducted a simulation analysis of blasting dust transport and obtained the time required for the dust concentration to fall to the permissible value. Cao [14] conducted a numerical simulation to analyze the variation pattern of the dust concentration in tunnels during the construction period at different altitudes, and the results showed that the dust concentration tends to decrease linearly with increasing altitude.
In summary, in terms of researching the transport characteristics of tunnel blasting dust, previous studies have focused on the variation pattern of the dust concentration. However, at the microscopic level, the distribution pattern of the dust particle size in the tunnel space has been rarely investigated. At the same time, due to the influence of the confinement of the tunnel space, as well as the large amount of blasting dust and the characteristics of a wide distribution of the particle size, the previous research results are not applicable to exploring the effect of the particle size of tunnel blasting dust on dust reduction and transport patterns. In view of this, on the basis of the above research results, this paper used numerical simulation to study not only the law of dust concentration changes with time after tunnel blasting by the drilling and blasting method, but also analyzed the distribution characteristics of the dust particle size at different locations along the tunnel and explains the law of dust transport from the microscopic level. The results of this study were compared with the experimental data obtained by previous authors to optimize blasting methods for green and low-carbon mining, so as to provide guidance for blasting dust reduction at tunnel sites.

2. Mathematical Model of Air Flow and Dust Flow

2.1. Overview of Gas–Solid Two-Phase Flow Model

The mathematical models for simulating gas–solid two-phase flow in the FLUENT software (ANSYS Inc., Canonsburg, PA, USA) include the discrete phase model (DPM), the mixture model, the Eulerian model, and the VOF model. These models can be grouped into two categories: the Eulerian-Eulerian method and the Eulerian-Lagrange method. The discrete phase model belongs to the Euler–Lagrange method. It requires that the volume of the particle phase should not be too large and uniformly distributed in the continuous phase, which means the local volume concentration of particles should be less than 10% [15]. By calculating the velocity and turbulent kinetic energy of the continuous flow field, the trajectories of individual particles are obtained, and the trajectories of a large number of particles are calculated, so that the flow field distribution of the discrete phase can be derived. At present, the study of the trajectory of tunnel blasting dust particles in a continuous flow field usually uses the DPM model, which essentially belongs to the Euler–Lagrange method [16].
In this paper, the air flow field in the tunnel space was considered as a continuous phase and the blasting dust particles were considered as a discrete phase, while the variation characteristics of the tunnel blasting dust concentration and particle size distribution were simulated and analyzed using the DPM model. First, the quality of the grid division was verified. Second, the transient pressure-based solver was used, and the wind flow velocity and turbulent kinetic energy of the flow field were calculated using the SIMPLE algorithm. Finally, the random orbit model was opened, and the trajectories of individual particles were integrated in the Lagrangian coordinate system to obtain all particle transport trajectories.

2.2. Mathematical Model of Airflow

The mathematical model of gas flow is mainly used to determine the velocity field and pressure distribution of the air in the tunnel. As Re is generally larger than 1 × 10⁶ in the tunnel space and the airflow state is usually turbulent flow, so the turbulence can be simulated numerically by solving the transient 3D equations in the grid size of the turbulence scale. Considering the gas flow in the tunnel as a constant incompressible adiabatic flow, the 3D Euler-Euler model was used to describe the continuous gas phase in the tunnel, and the continuity and momentum equations for the gas phase in the tunnel are as follows [17,18].
ρ t + ( ρ u i ) x i = 0
( ρ u i ) t + ( ρ u i u j ) x j = ρ x i + τ i j x j + ρ g i F i
where ρ is the density of air, kg/m3; τij is the Reynolds stress tensor; gi is the acceleration of gravity, kg/m2; Fi is the particle flow resistance, N.
The Reynold’s time-averaged equation was used to model turbulence, the basic idea of which is that the transient pulsations in the time-averaged equation are represented by a k-ε two-path turbulence model [19,20].
The kinetic energy equation for turbulent pulsations (also known as the k equation) can be expressed as:
( ρ k ) t + ( ρ k u i ) x i = x j [ ( μ + μ t σ k ) k x j ] + G k ρ ε
The equation for the energy dissipation rate of turbulent pulsation kinetic energy (also known as the ε equation) can be expressed as:
( ρ ε ) t + ( ρ ε u i ) x i = x j [ ( μ + μ t σ ε ) ε x j ] + C 1 ε ε k G k C 2 ε ρ ε 2 k
where, G k = μ t [ u i x j + u j x i ] u i x j , μ t = ρ C μ k 2 ε .
In the above equation sets, k is the turbulent kinetic energy, m2/s2; ε is the turbulent kinetic energy dissipation rate, m2/s3; μ is the laminar viscosity coefficient; μt is the viscosity coefficient of turbulent flow, Pa·s; ui, uj are the velocities in the x, y directions, respectively, m/s; Gk is the generation term of turbulent kinetic energy generated by the average velocity gradient, kg/(s3.m); C, C, Cμ, σε, and σk are constants with values of 1.44, 1.92, 0.09, 1.00, and 1.30, respectively [21,22].

2.3. Control Equation of the Movement of Dust

In the process of calculating the trajectory of tunnel blasting dust movement, only the effect of gravity and resistance was considered, and other forces can be neglected. The equilibrium equation for the motion of dust particles is [23,24,25]:
d u p d t = F D ( u u p ) + g x ( ρ p ρ ) ρ p
F D = 0.75 C D ρ | u p u | ρ p d p
where FD(uup) is the particle traction force per unit mass, N; CD is the traction coefficient; μ is the fluid phase velocity, m/s; μp is the particle motion velocity, m/s; ρ is the fluid density, kg/m3; ρp is the particle density, kg/m3; dp is the particle diameter, m.
The controlling equation for the particle trajectory is [14]:
d u p d t = 1 τ p [ u ¯ + u ( t ) u p ]
where τp is the particle relaxation time, s; μ ¯ is the average velocity, m/s; μ ( t ) is the pulsation velocity, m/s. here, u = ζ ( u ) 2 ¯ , and ζ is a random number obeying normal distribution.
For the k-ε model, assuming that the local turbulence is isotropic, the following equation is satisfied [26].
( u ) 2 ¯ = ( v ) 2 ¯ = ( w ) 2 ¯ = 2 3 k
In order to obtain the turbulent diffusion law and dust concentration distribution of particles, the instantaneous velocity was integrated within segmented time, i.e., performing the integration in discrete time steps to derive the equation of the particle trajectory.

2.4. Dust Particle Size Distribution Function

One of the more widely used models and methods for studying the dust particle size distribution is the Rosin–Rammler distribution function (R-R distribution) [27,28]. This paper assumed that the tunnel face is the injection source of dust particles, and the particle size distribution of dust follows the R-R distribution, which was used to describe the particle size distribution characteristics and settlement law of dust in the tunnel space. The R-R distribution in FLUENT describes the function relationship between the particle size and mass fraction in the following equation.
Y d = e ( d / d ¯ ) n
where d ¯ is the average particle size, m; n is the size distribution index.

3. Geometric Model Establishment and Solution

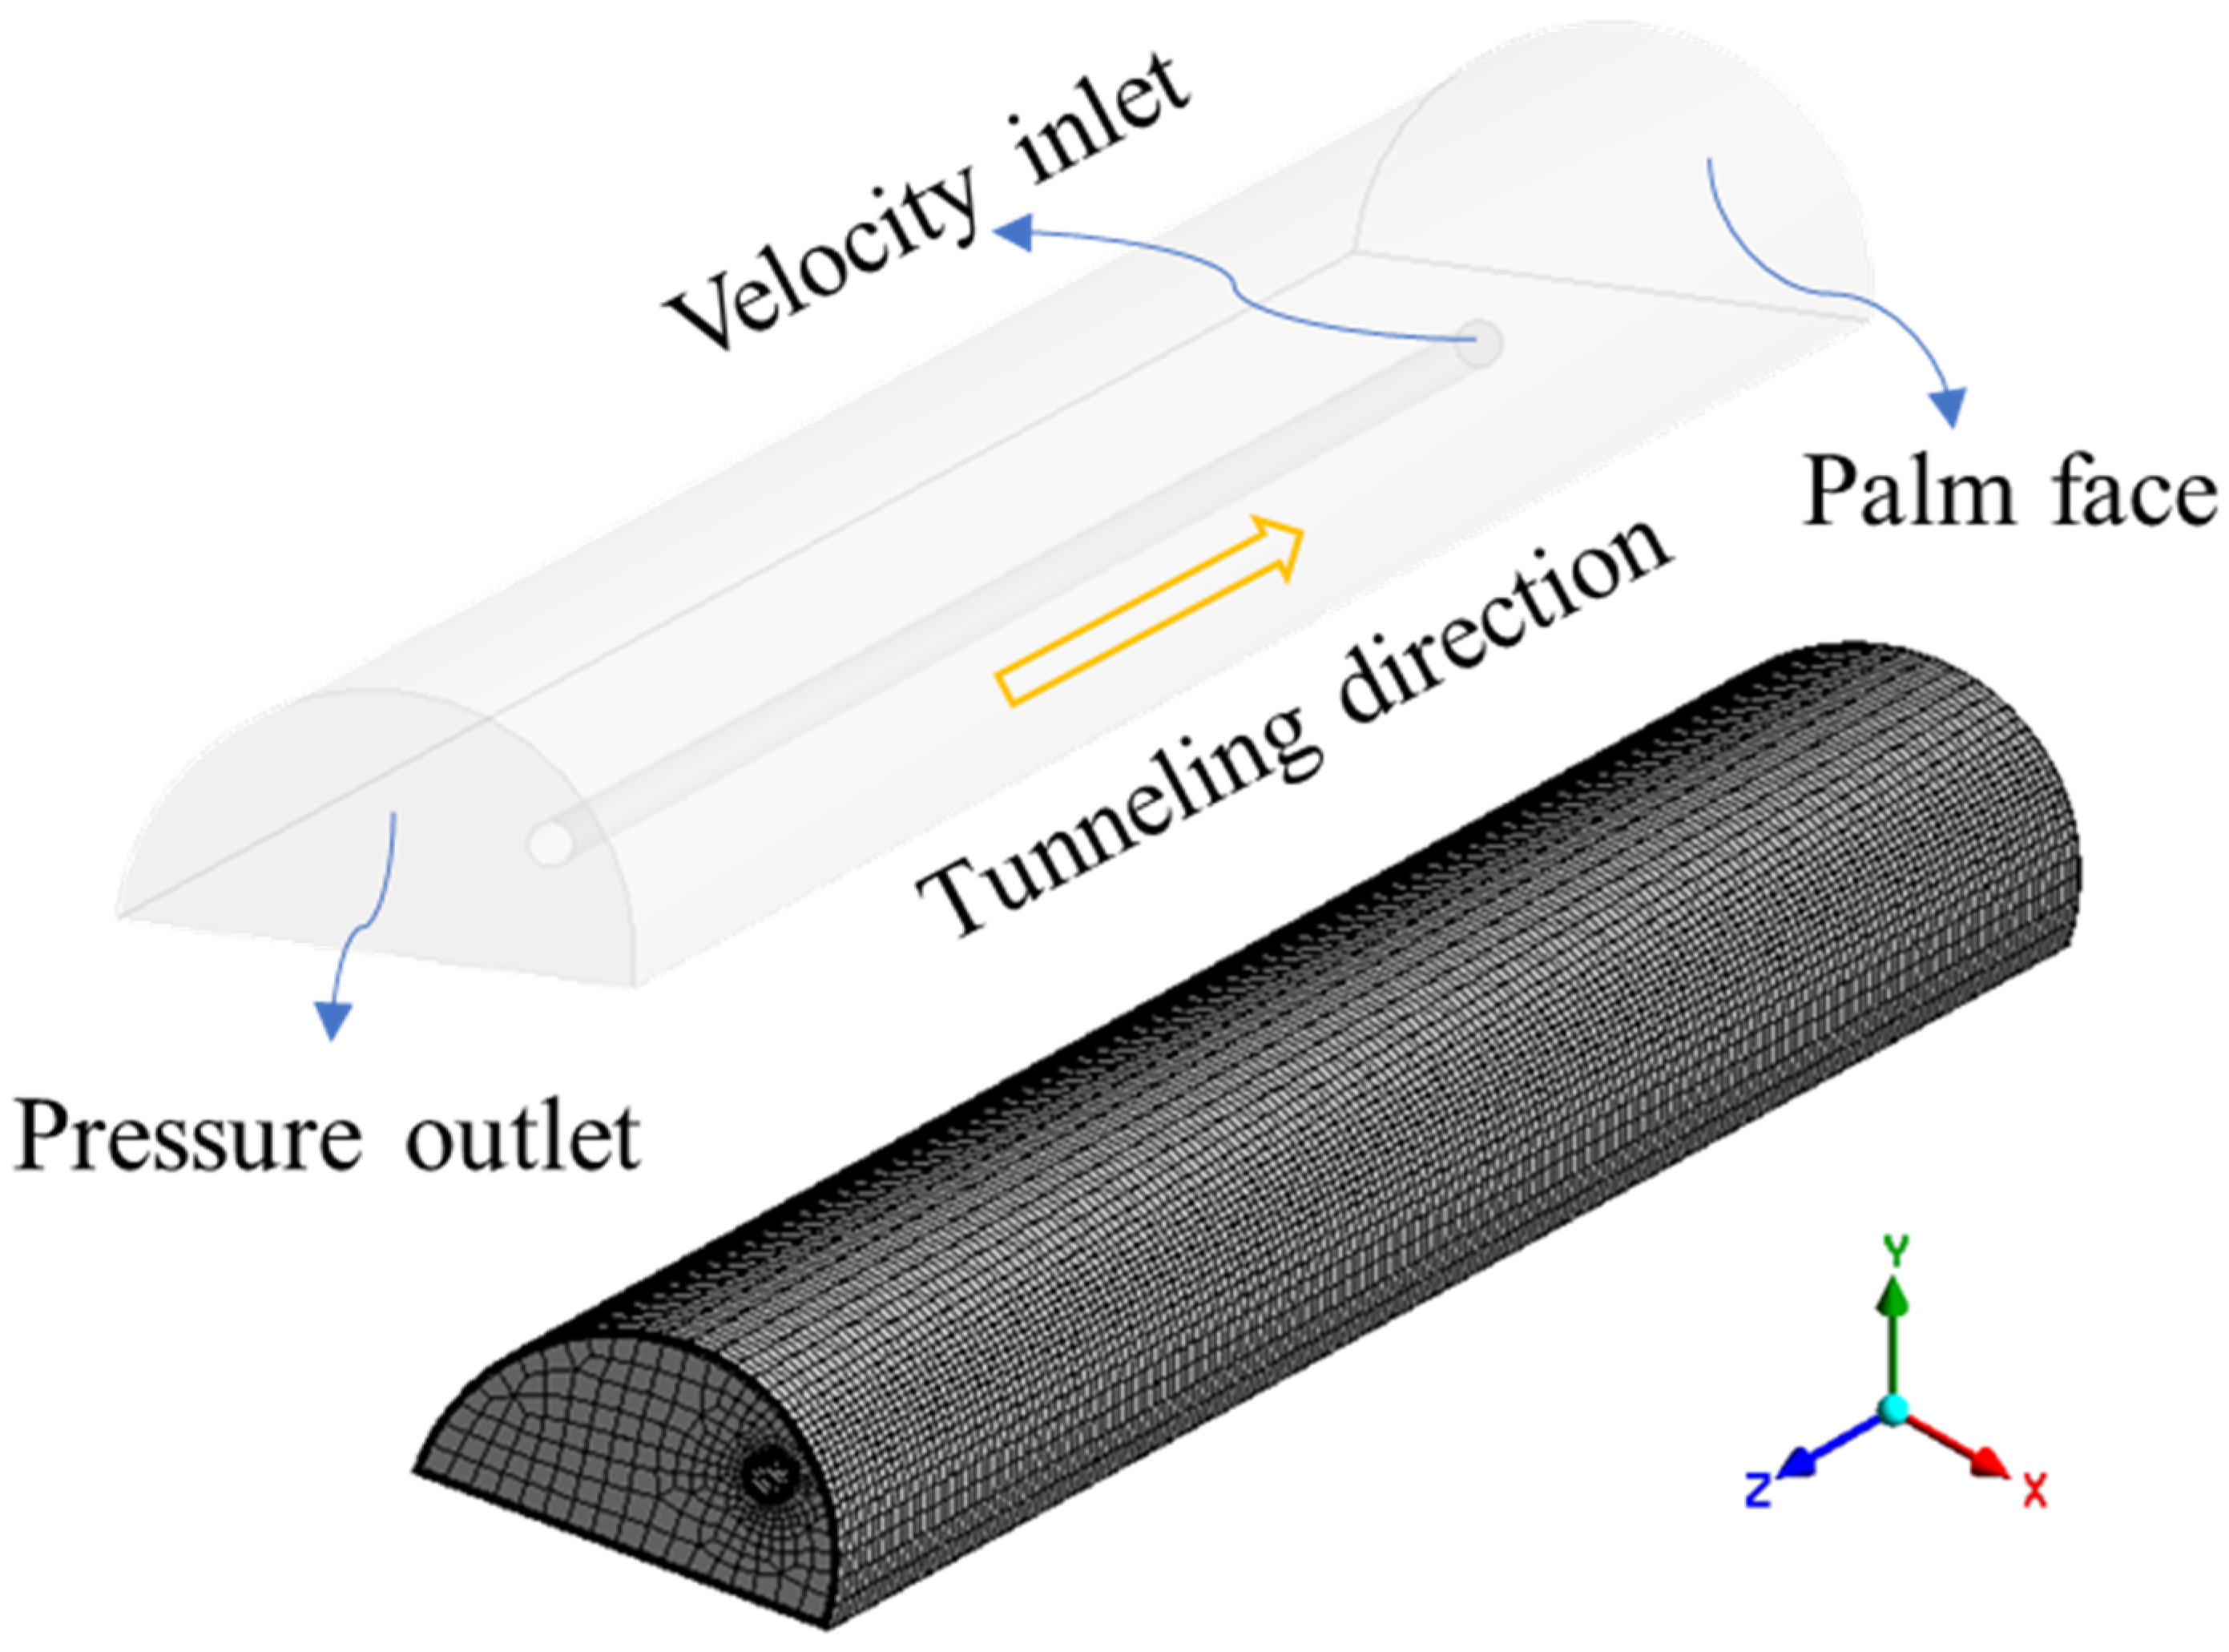
3.1. Geometric Modeling and Meshing

Due to the enclosed nature of the tunnel space, the variety of operating equipment, and the complexity of the environment, it is impossible to realistically and accurately reproduce the tunnel model. Therefore, with little influence on the numerical simulation results and for more convenient physical modeling, the dust transport space was appropriately simplified as follows: (1) The tunnel was simplified as a semi-circular arch space with a section radius of 8m and a length of 200 m. (2) Considering the effect of the air flow of the duct on the dust, the effect of other equipment in the tunnel was not considered. (3) The dust generated by other processes and the lifting of the bottom plate was not considered [12].
Based on the above simplifications and assumptions, a 3D geometric model was created using the DesginModeler software at 1:1 based on the actual tunnel blasting space. Among them, the tunnel duct was suspended on the upper right side of the tunnel, with a diameter of 1.4 m, a distance of 3 m from the bottom plate, and the distance from the outlet of the duct to the palm face was 50 m. Finally, the model was imported into the MESH software for meshing, and the number of divided mesh cells was 119,940. The results are shown in Figure 1.

3.2. The Setting of the Simulation Parameters and Boundary Conditions

By extensively reviewing the relevant literature on tunnel blasting dust transport characteristics and particle size distribution, combined with relevant studies in the field of coal mine roadways [29,30], the discrete phase model parameters, injection source parameters, and boundary conditions were taken according to the requirements of the discrete phase model setting in the FLUENT software. The numerical simulation parameters are listed in Table 1.

4. Numerical Simulation Results and Analysis

4.1. Analysis of the Distribution of the Air Flow Field in the Tunnel

The movement process of dust particles generated by blasting occurs in the continuous phase airflow field. In order to study the movement pattern of blasting dust in the tunnel space, the distribution of the flow field in the tunnel was firstly analyzed. The outlet of the duct was set as the velocity inlet, and the velocity of the inlet was 20 m/s. The distribution of the air flow field in the tunnel was obtained as shown in Figure 2 and Figure 3:
(1)
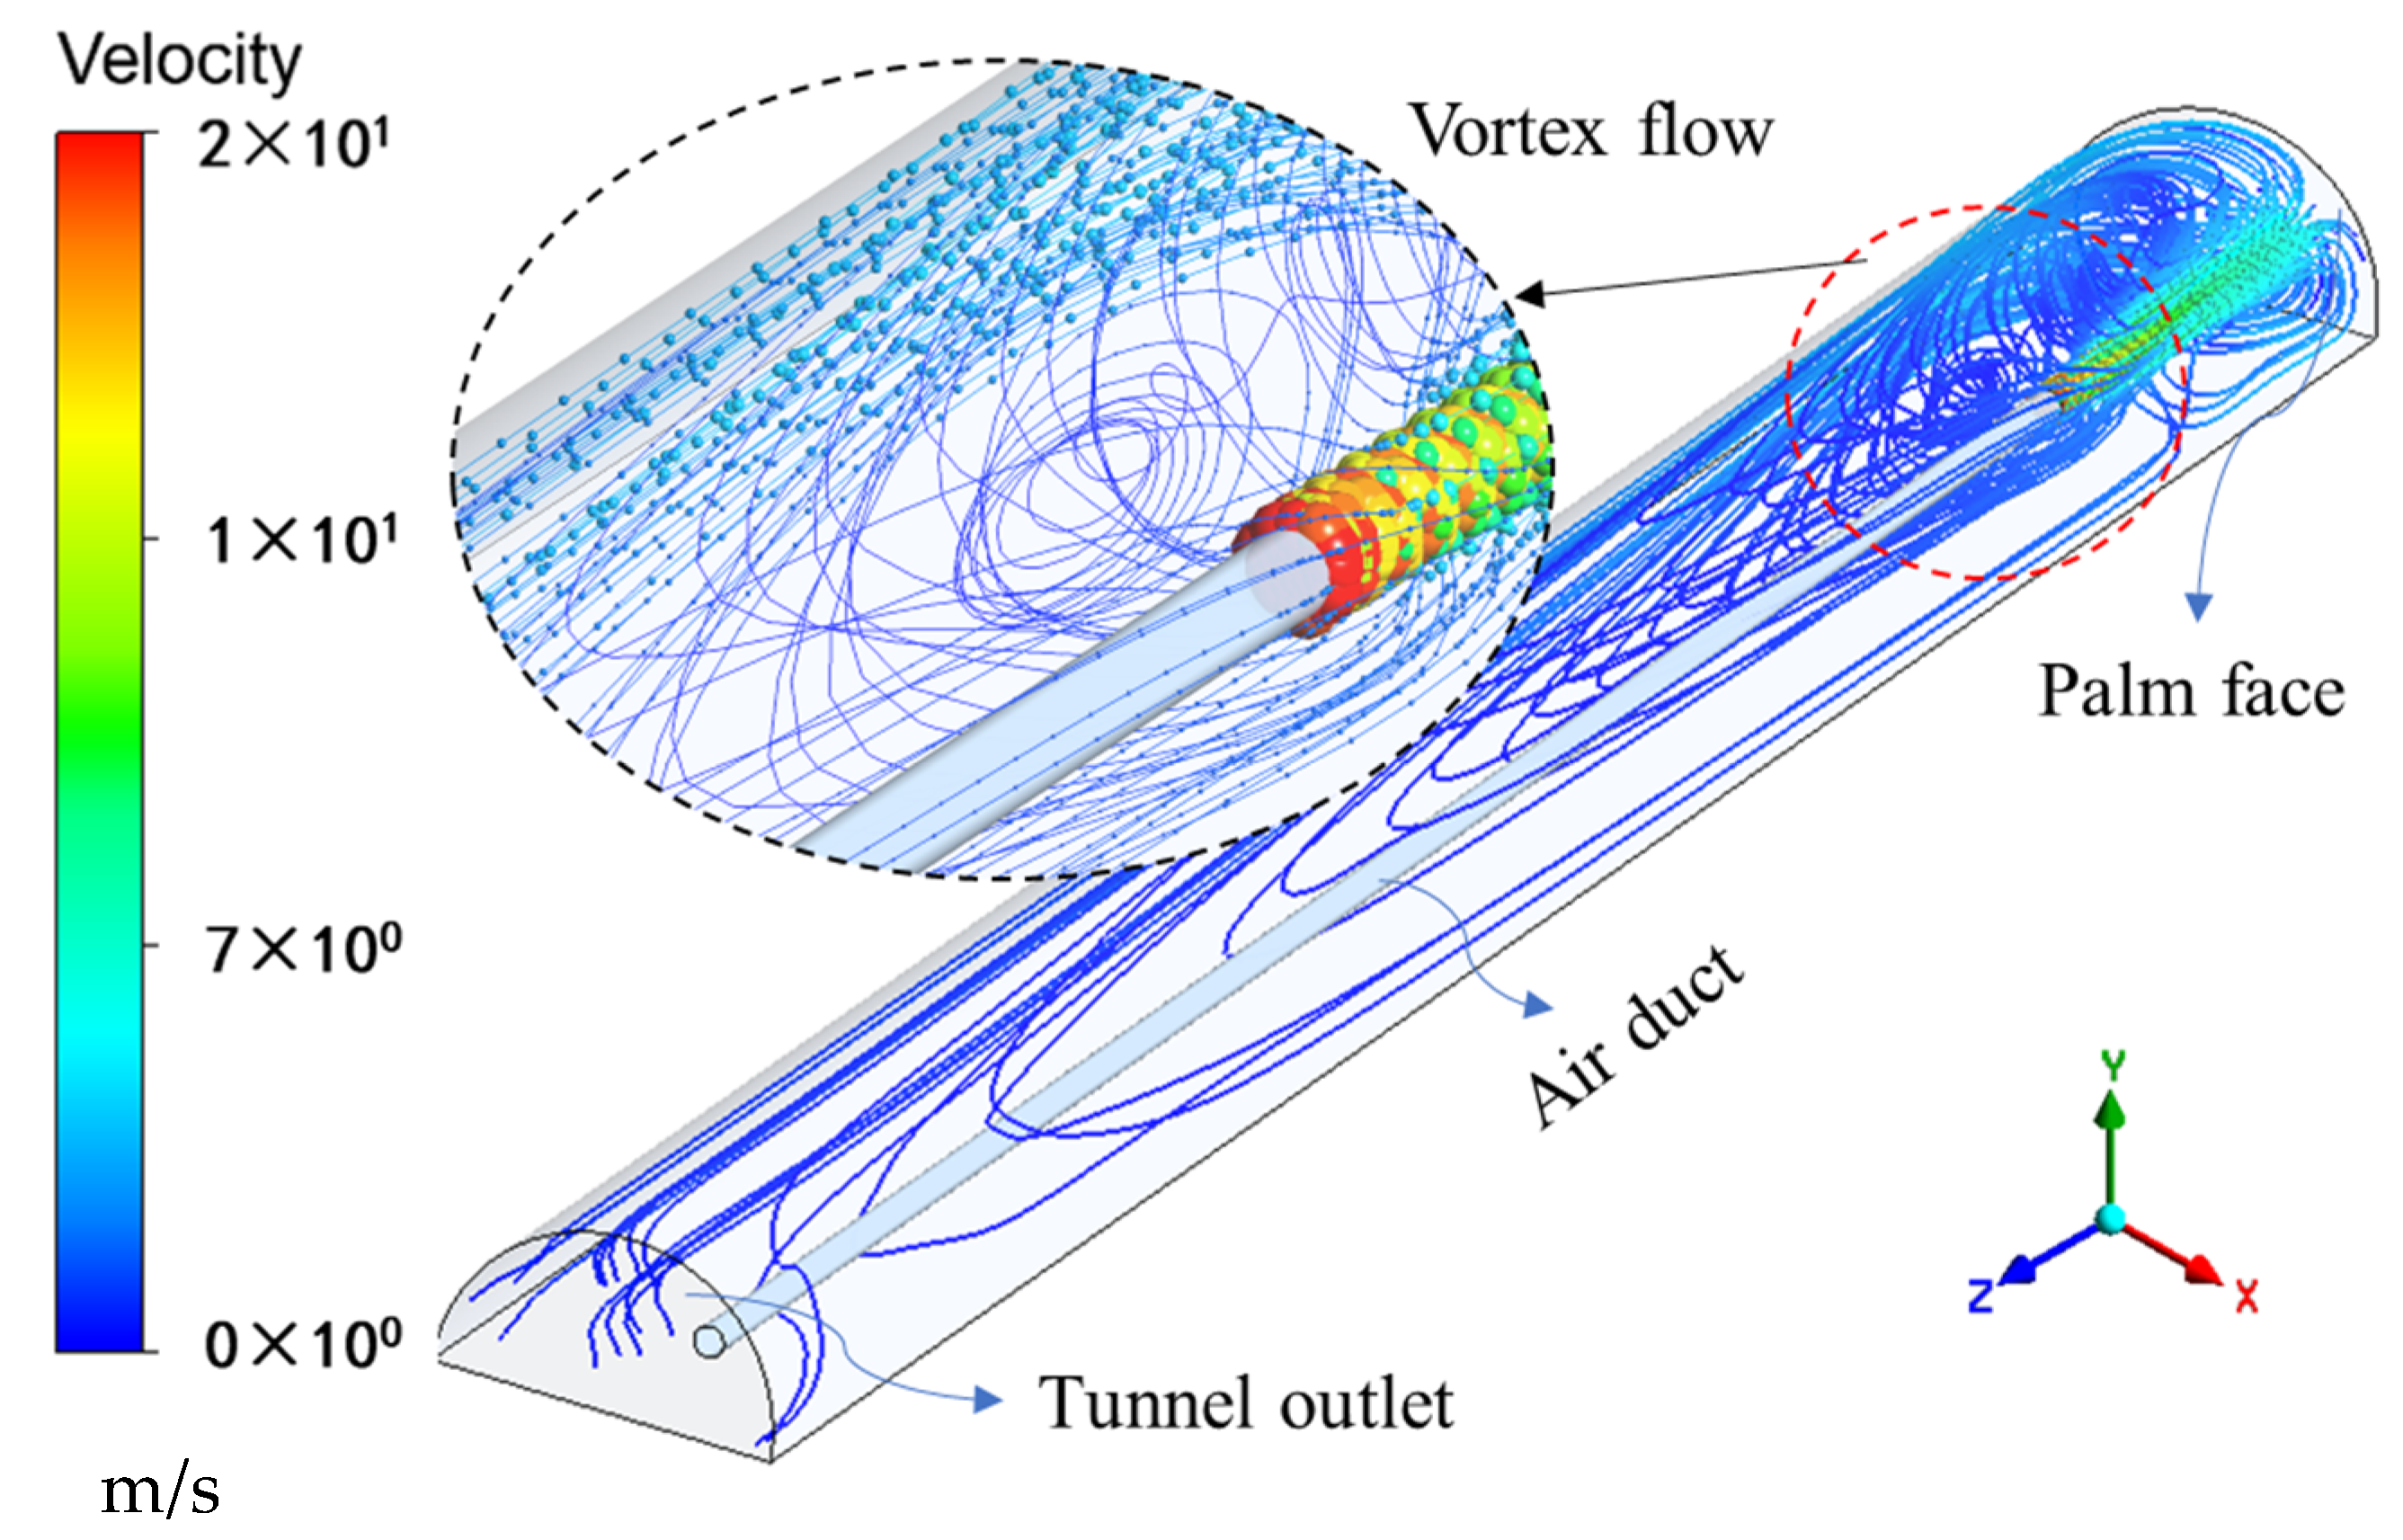
The wind flow was shot out from the air duct, along the right side of the tunnel towards the palm face, and then returned out along the left side after colliding with the palm face, forming a return flow area between the duct outlet and the palm face. In this area, part of the return wind flow will be impacted, mixed, and integrated with the outlet wind flow, and the original flow field is strongly disturbed, forming an extremely turbulent vortex area;
(2)
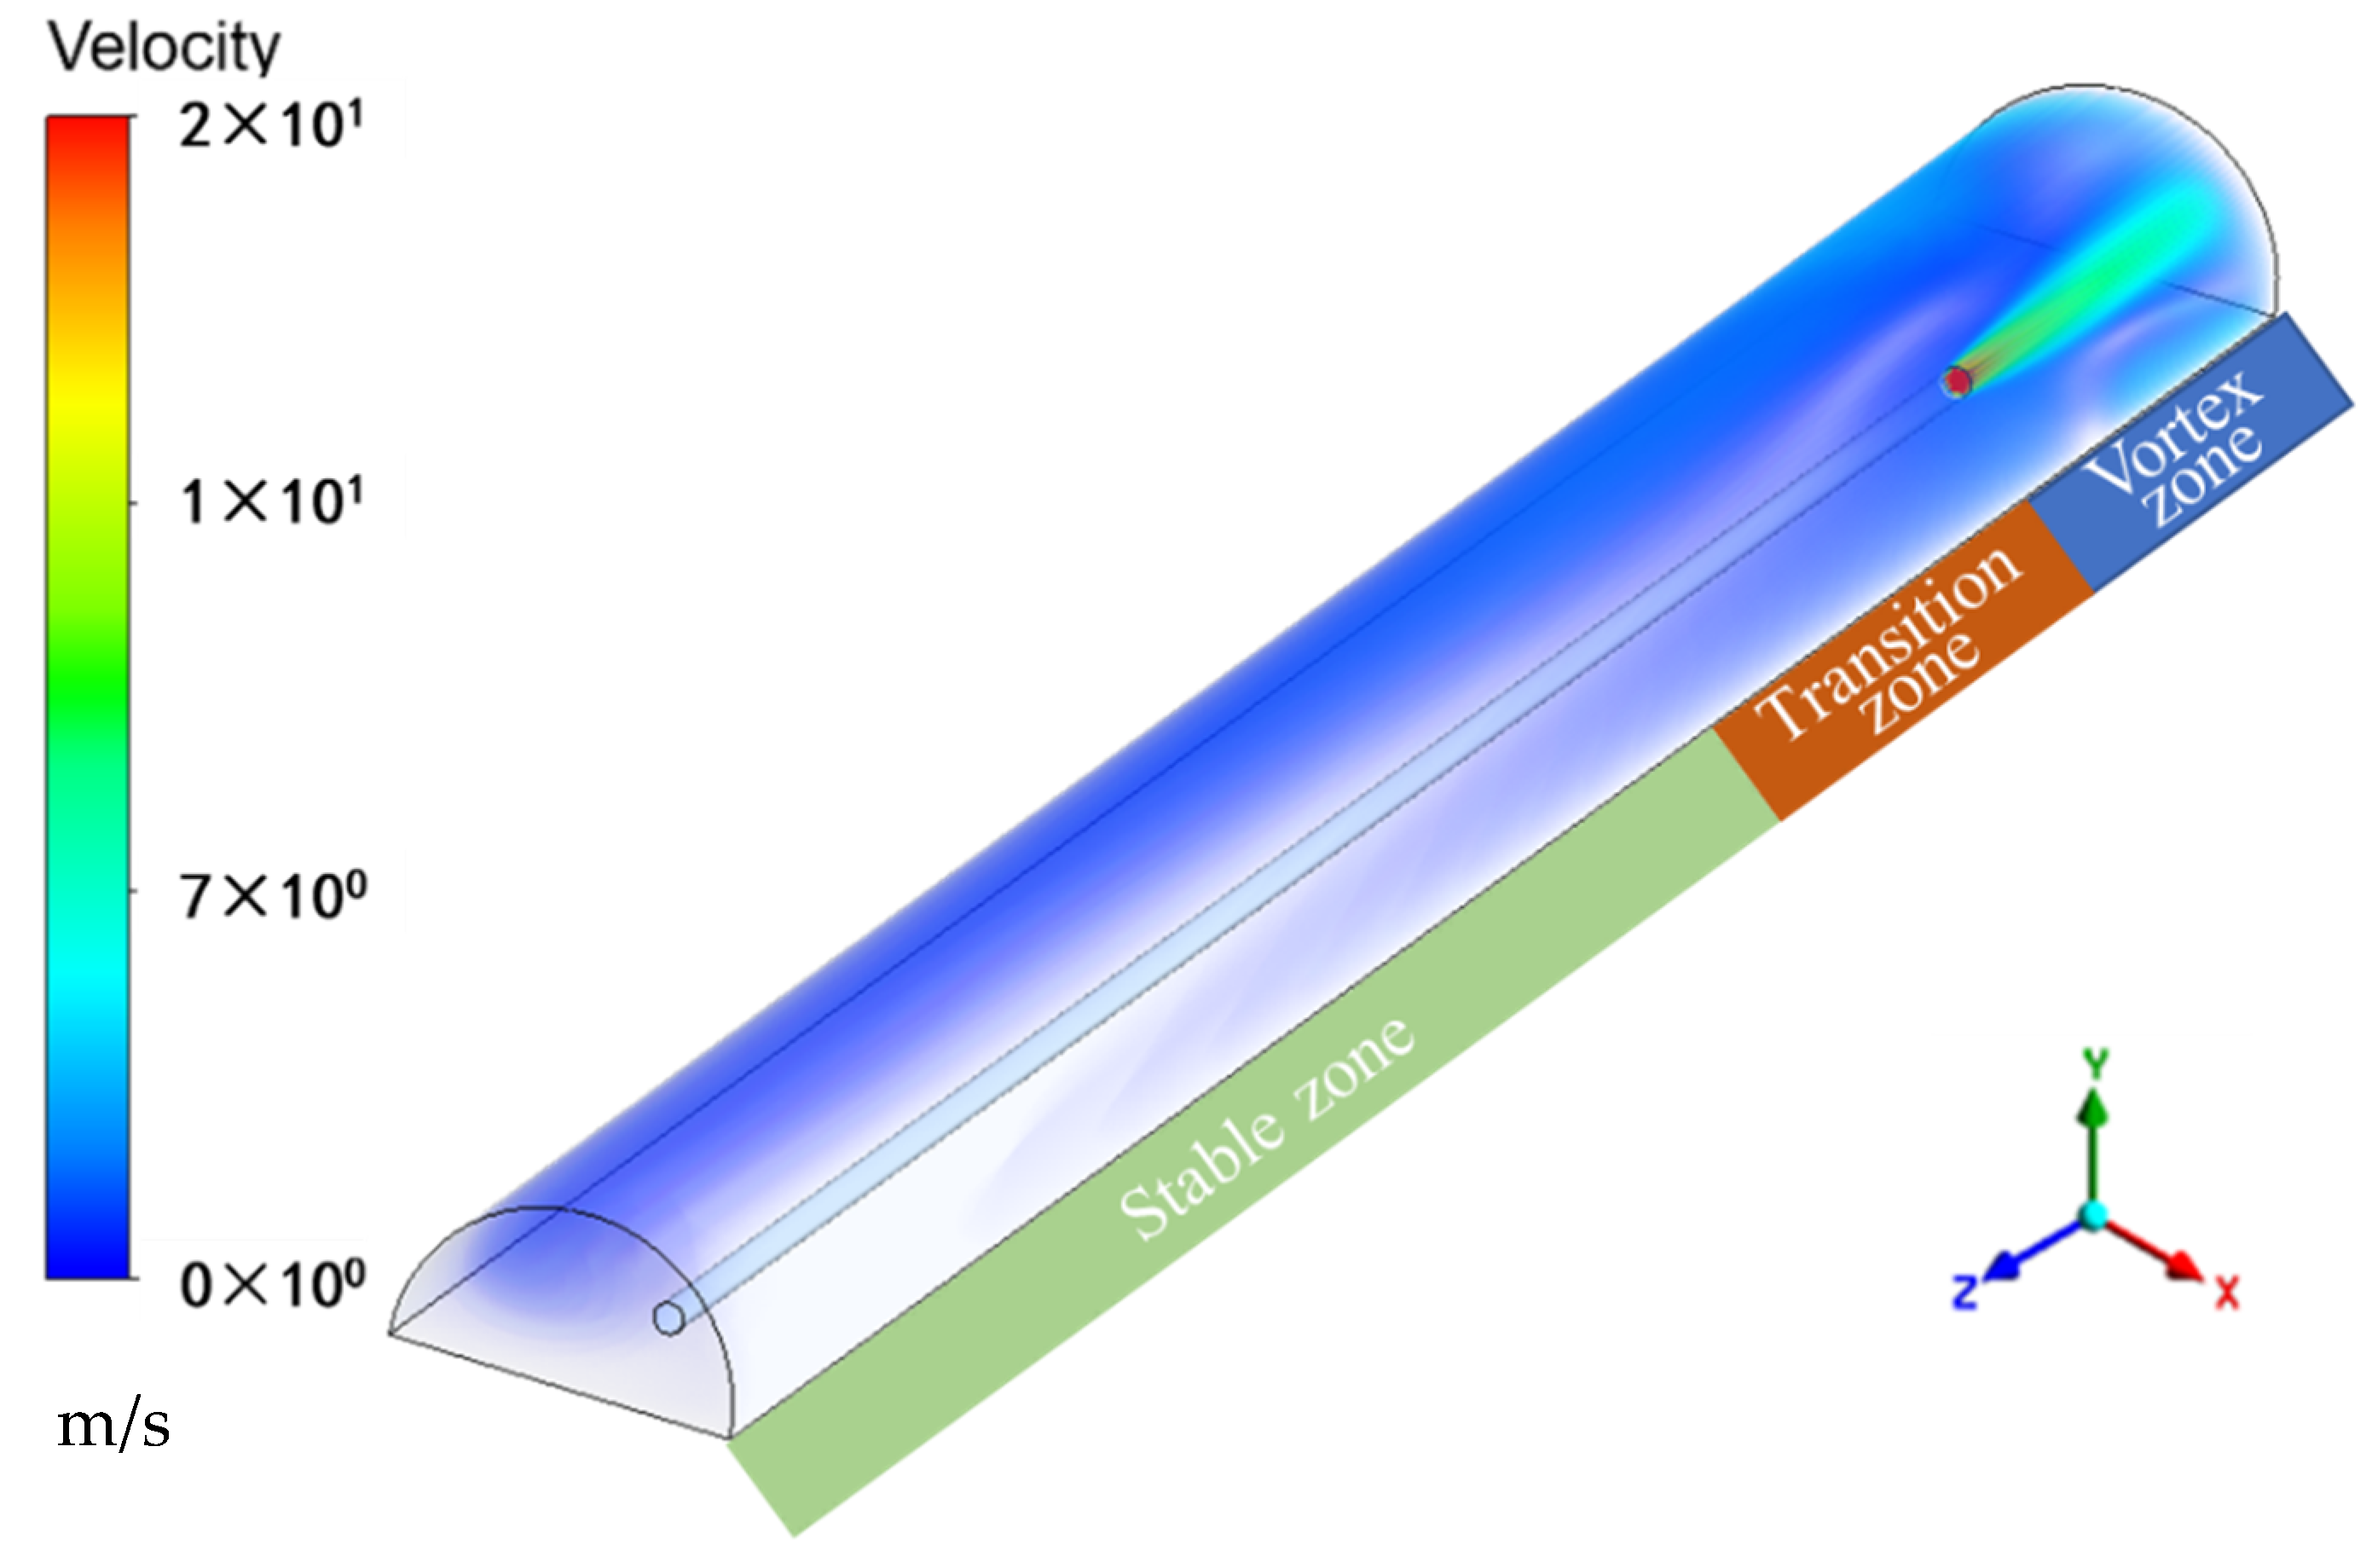
Most of the wind flows out of the vortex area after turning back from the palm surface and continues to flow forward. Behind 50 m from the palm surface, the flow velocity gradually decreases, and the flow field distribution tends to be stable and uniform. The wind speed is basically stable at about 0.5 m/s;
(3)
The initial velocity of the wind flow is 20 m/s. After the impulse and momentum exchange with the surrounding boundary layer, the wind velocity gradually decreases, and after returning back from the palm surface, the wind velocity decreases sharply again. The wind velocity of the flow field along the tunnel shows a trend of maximum wind velocity in the vortex area, followed by the transition area, and small and uniform wind velocity is in the stable area.

4.2. Dust Concentration Variation Law with Time
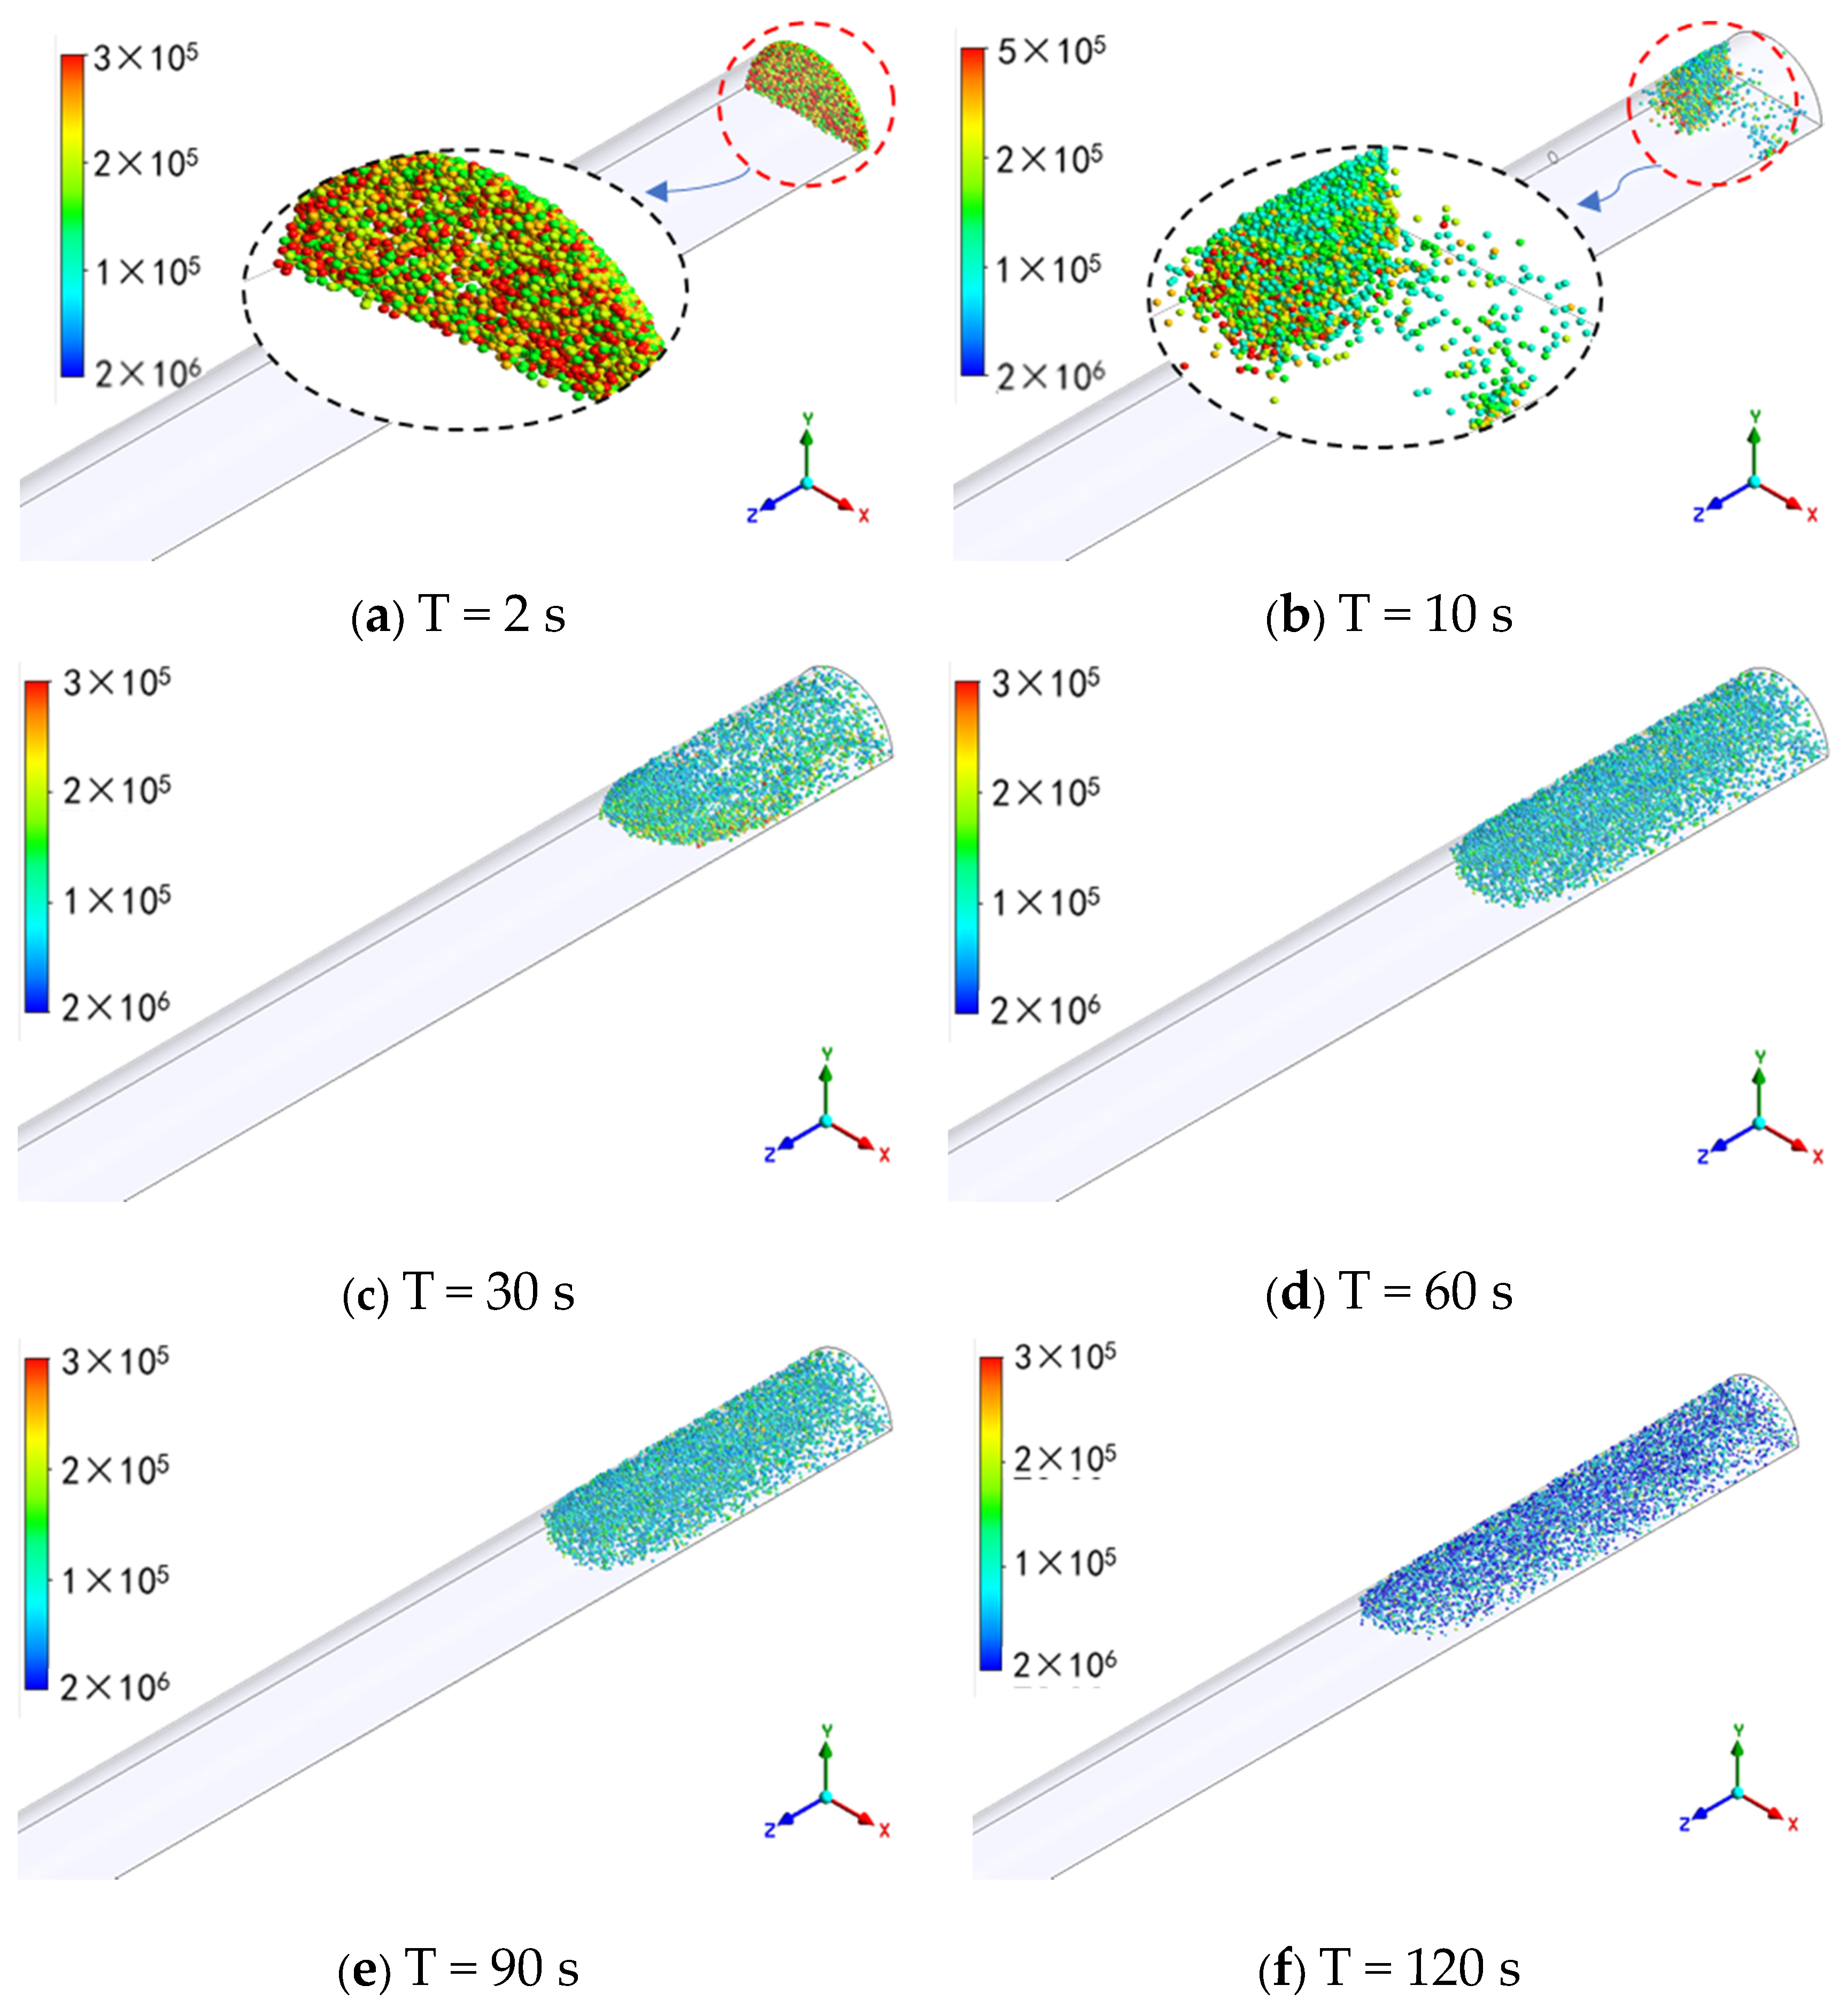
We set the palm face as the dust injection source and gave the dust a 2 s release time. The horizontal plane with a height of Y = 1.5 m (the height of respiratory zone) was cut as the concentration peak monitoring surface, and the distribution pattern of dust concentration peak at 10 s, 100 s, 300 s, 600 s, and 900 s on this plane was observed, as shown in Figure 4.
It can be seen from Figure 4 that:
(1)
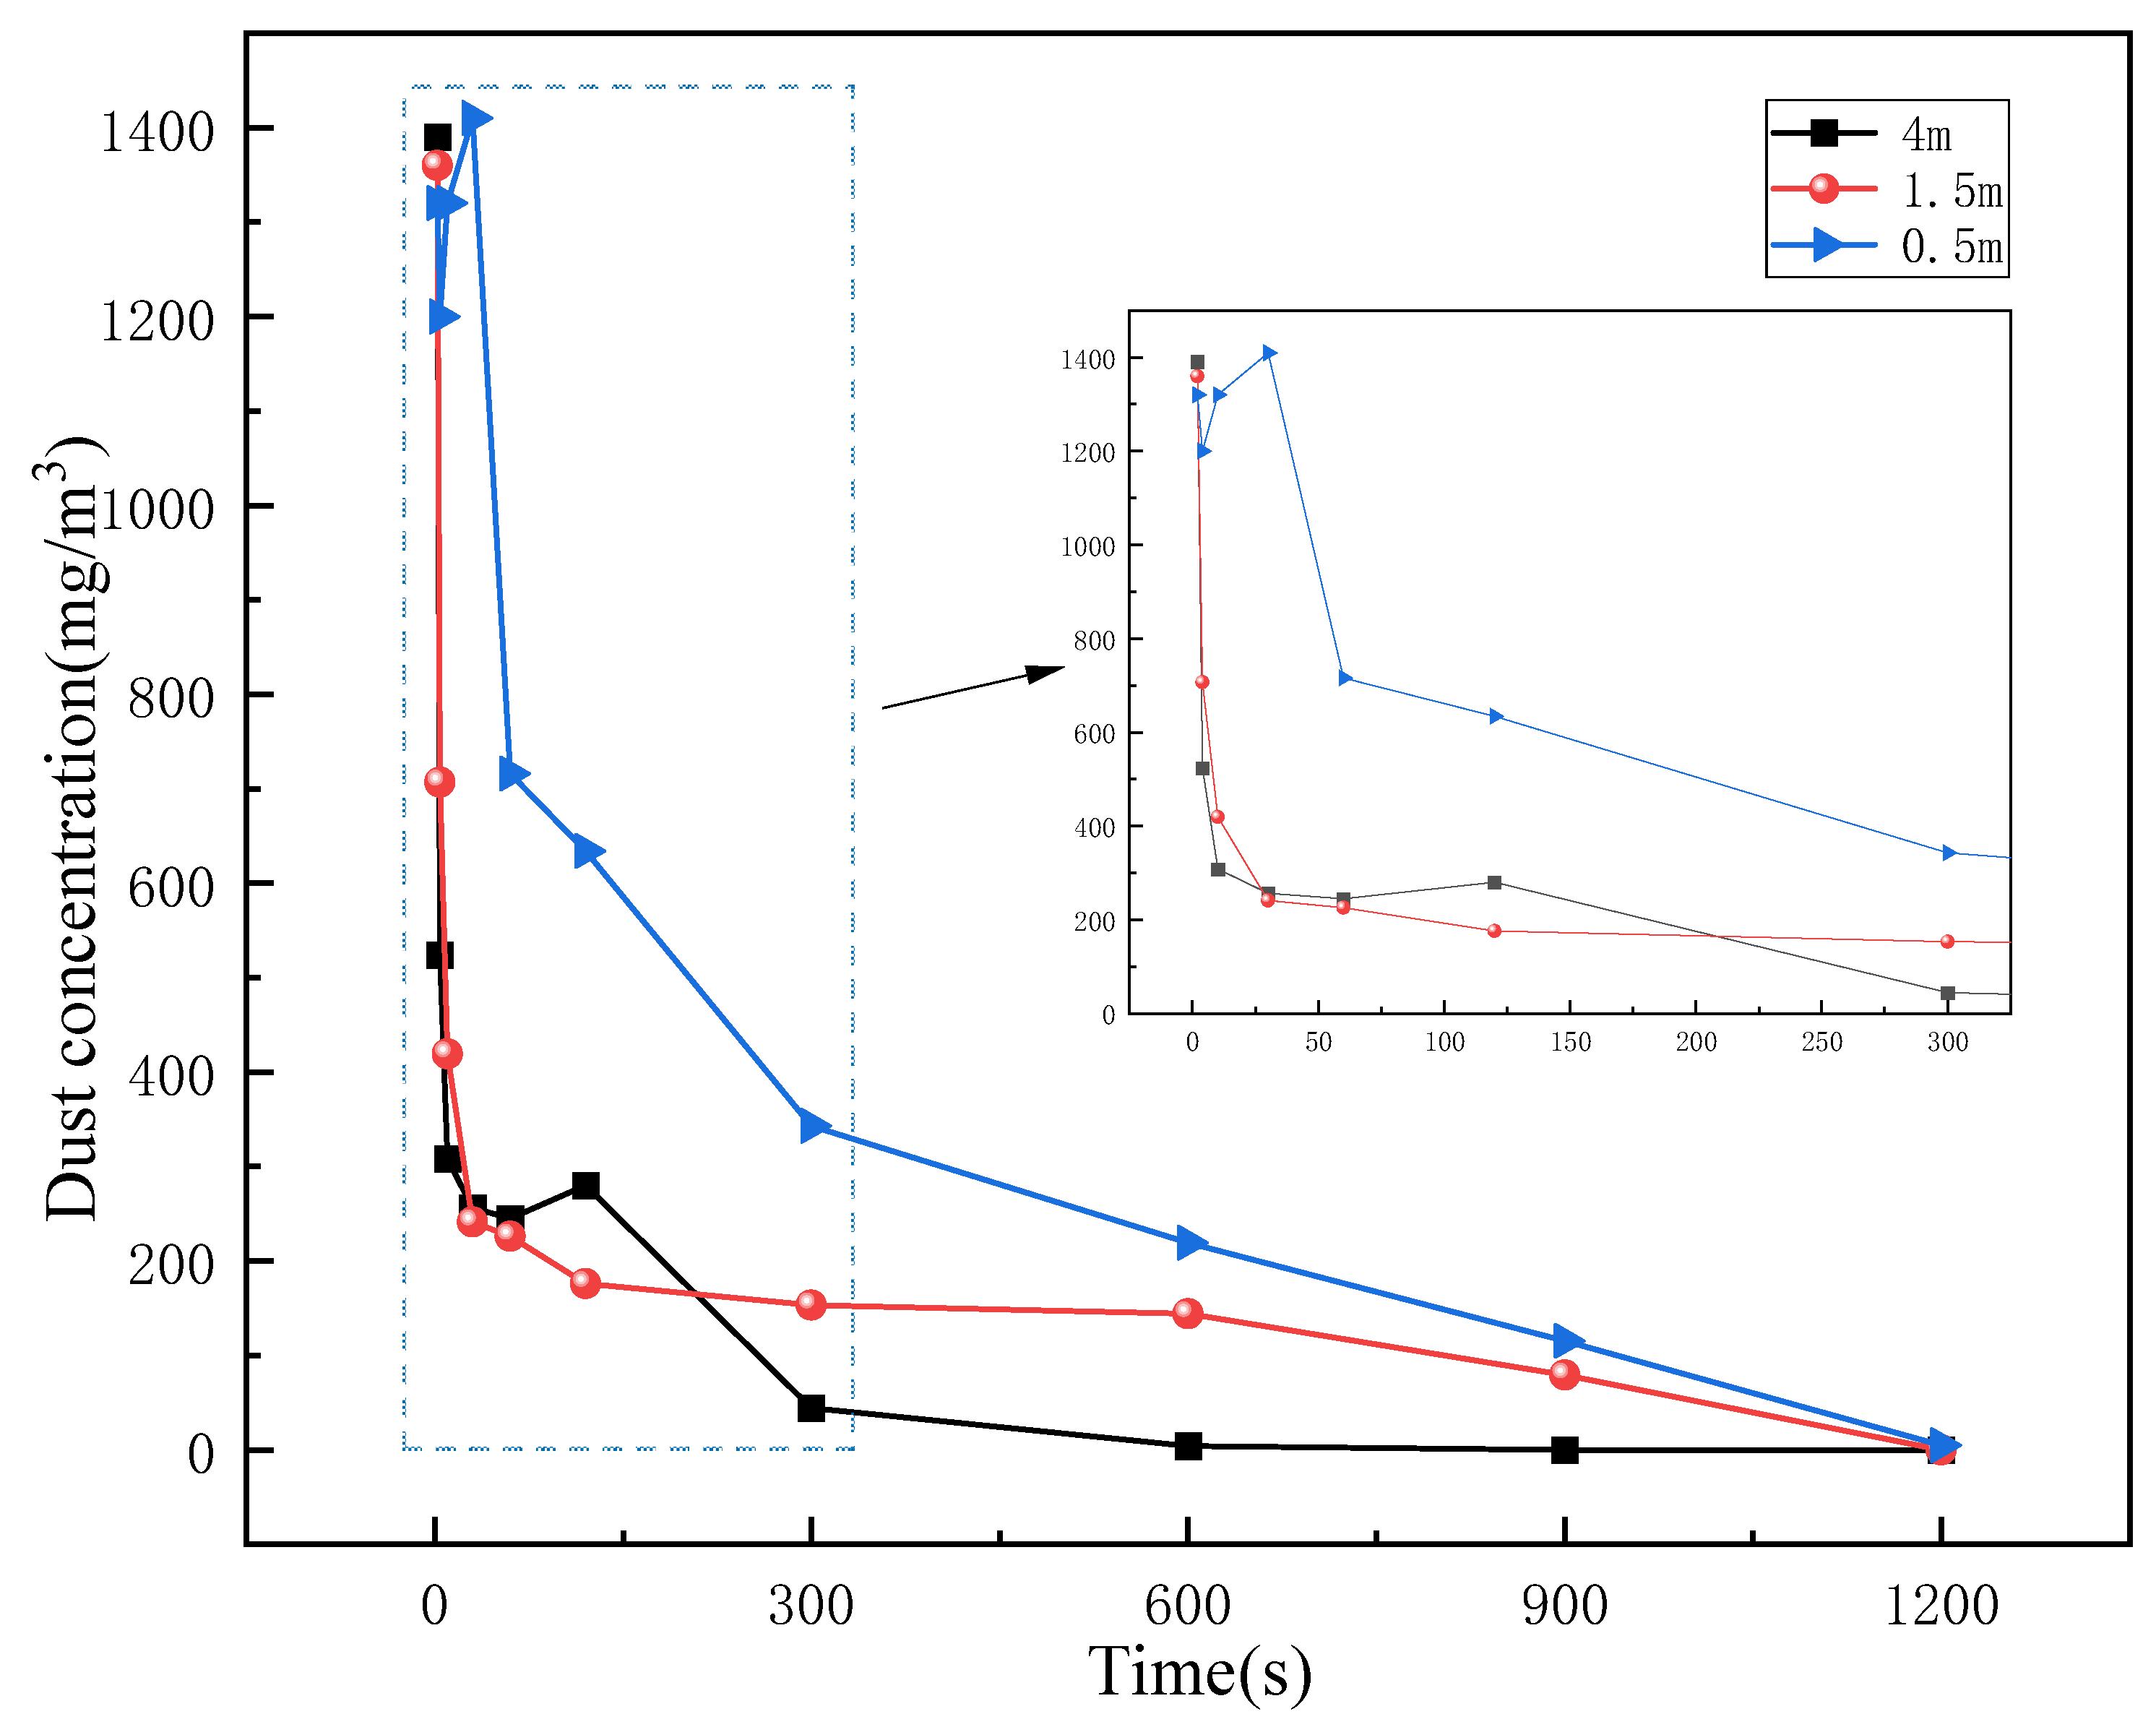
A large amount of dust generated by tunnel blasting was sprayed into the tunnel from the palm face at a high speed. At this time, the dust concentration was very high, up to 1400 mg/m3. Within 2 s~10 s, the blasting dust was very dense, forming a “cloud” and gathering near the palm face. Under the action of the initial velocity and air flow, the blasting dust diffused to the tunnel outlet and spreads as far as about 20 m;
(2)
Within 30 s~600 s of blasting, the dust “cloud” gradually diffused under the action of air flow and its own gravity. After that, the sedimentation occurred, and the dust was captured or discharged, leading to the dust concentration becoming sparse. The dust particles not captured and discharged were randomly distributed in the whole tunnel;
(3)
With the passage of time, about 900 s later, basically all dust was captured and discharged, and the dust concentration was lower than 8 mg/m3, which meet the standard concentration value allowed by the regulations [31,32]. Workers can enter the working surface for the operation.
The dust concentration cloud maps at T = 10 s, T = 30 s, T = 90 s, and T = 120 s were observed for three horizontal surfaces at heights of Y = 0.5 m, Y = 1.5 m, and Y = 4 m, as shown in Figure 5. In addition, the peak dust concentrations of these three horizontal surfaces were monitored separately, and the monitoring results are shown in Figure 6.
As seen in Figure 5 and Figure 6:
Within 5 min after blasting, dust with a large particle size rapidly settled or was captured under the influence of gravity, resulting in a rapid decline in the dust concentration. From the cloud plot of the dust concentration in the horizontal plane at three heights, it can be concluded that the dust concentration decreased with increasing height. The peak value of dust concentration at a 4 m-high horizontal plane decreased fastest with time, and the dust concentration decreased slowly with the decrease of height. This was because the dust in the upper part of the tunnel was constantly sinking under the influence of gravity, and the air flow near the bottom plate was subject to large resistance and low wind speed, so the dust was not easily diffused, leading to the slow decline of the dust concentration at the 0.5 m height.

4.3. Distribution Pattern of Dust of Different Particle Sizes along the Tunnel
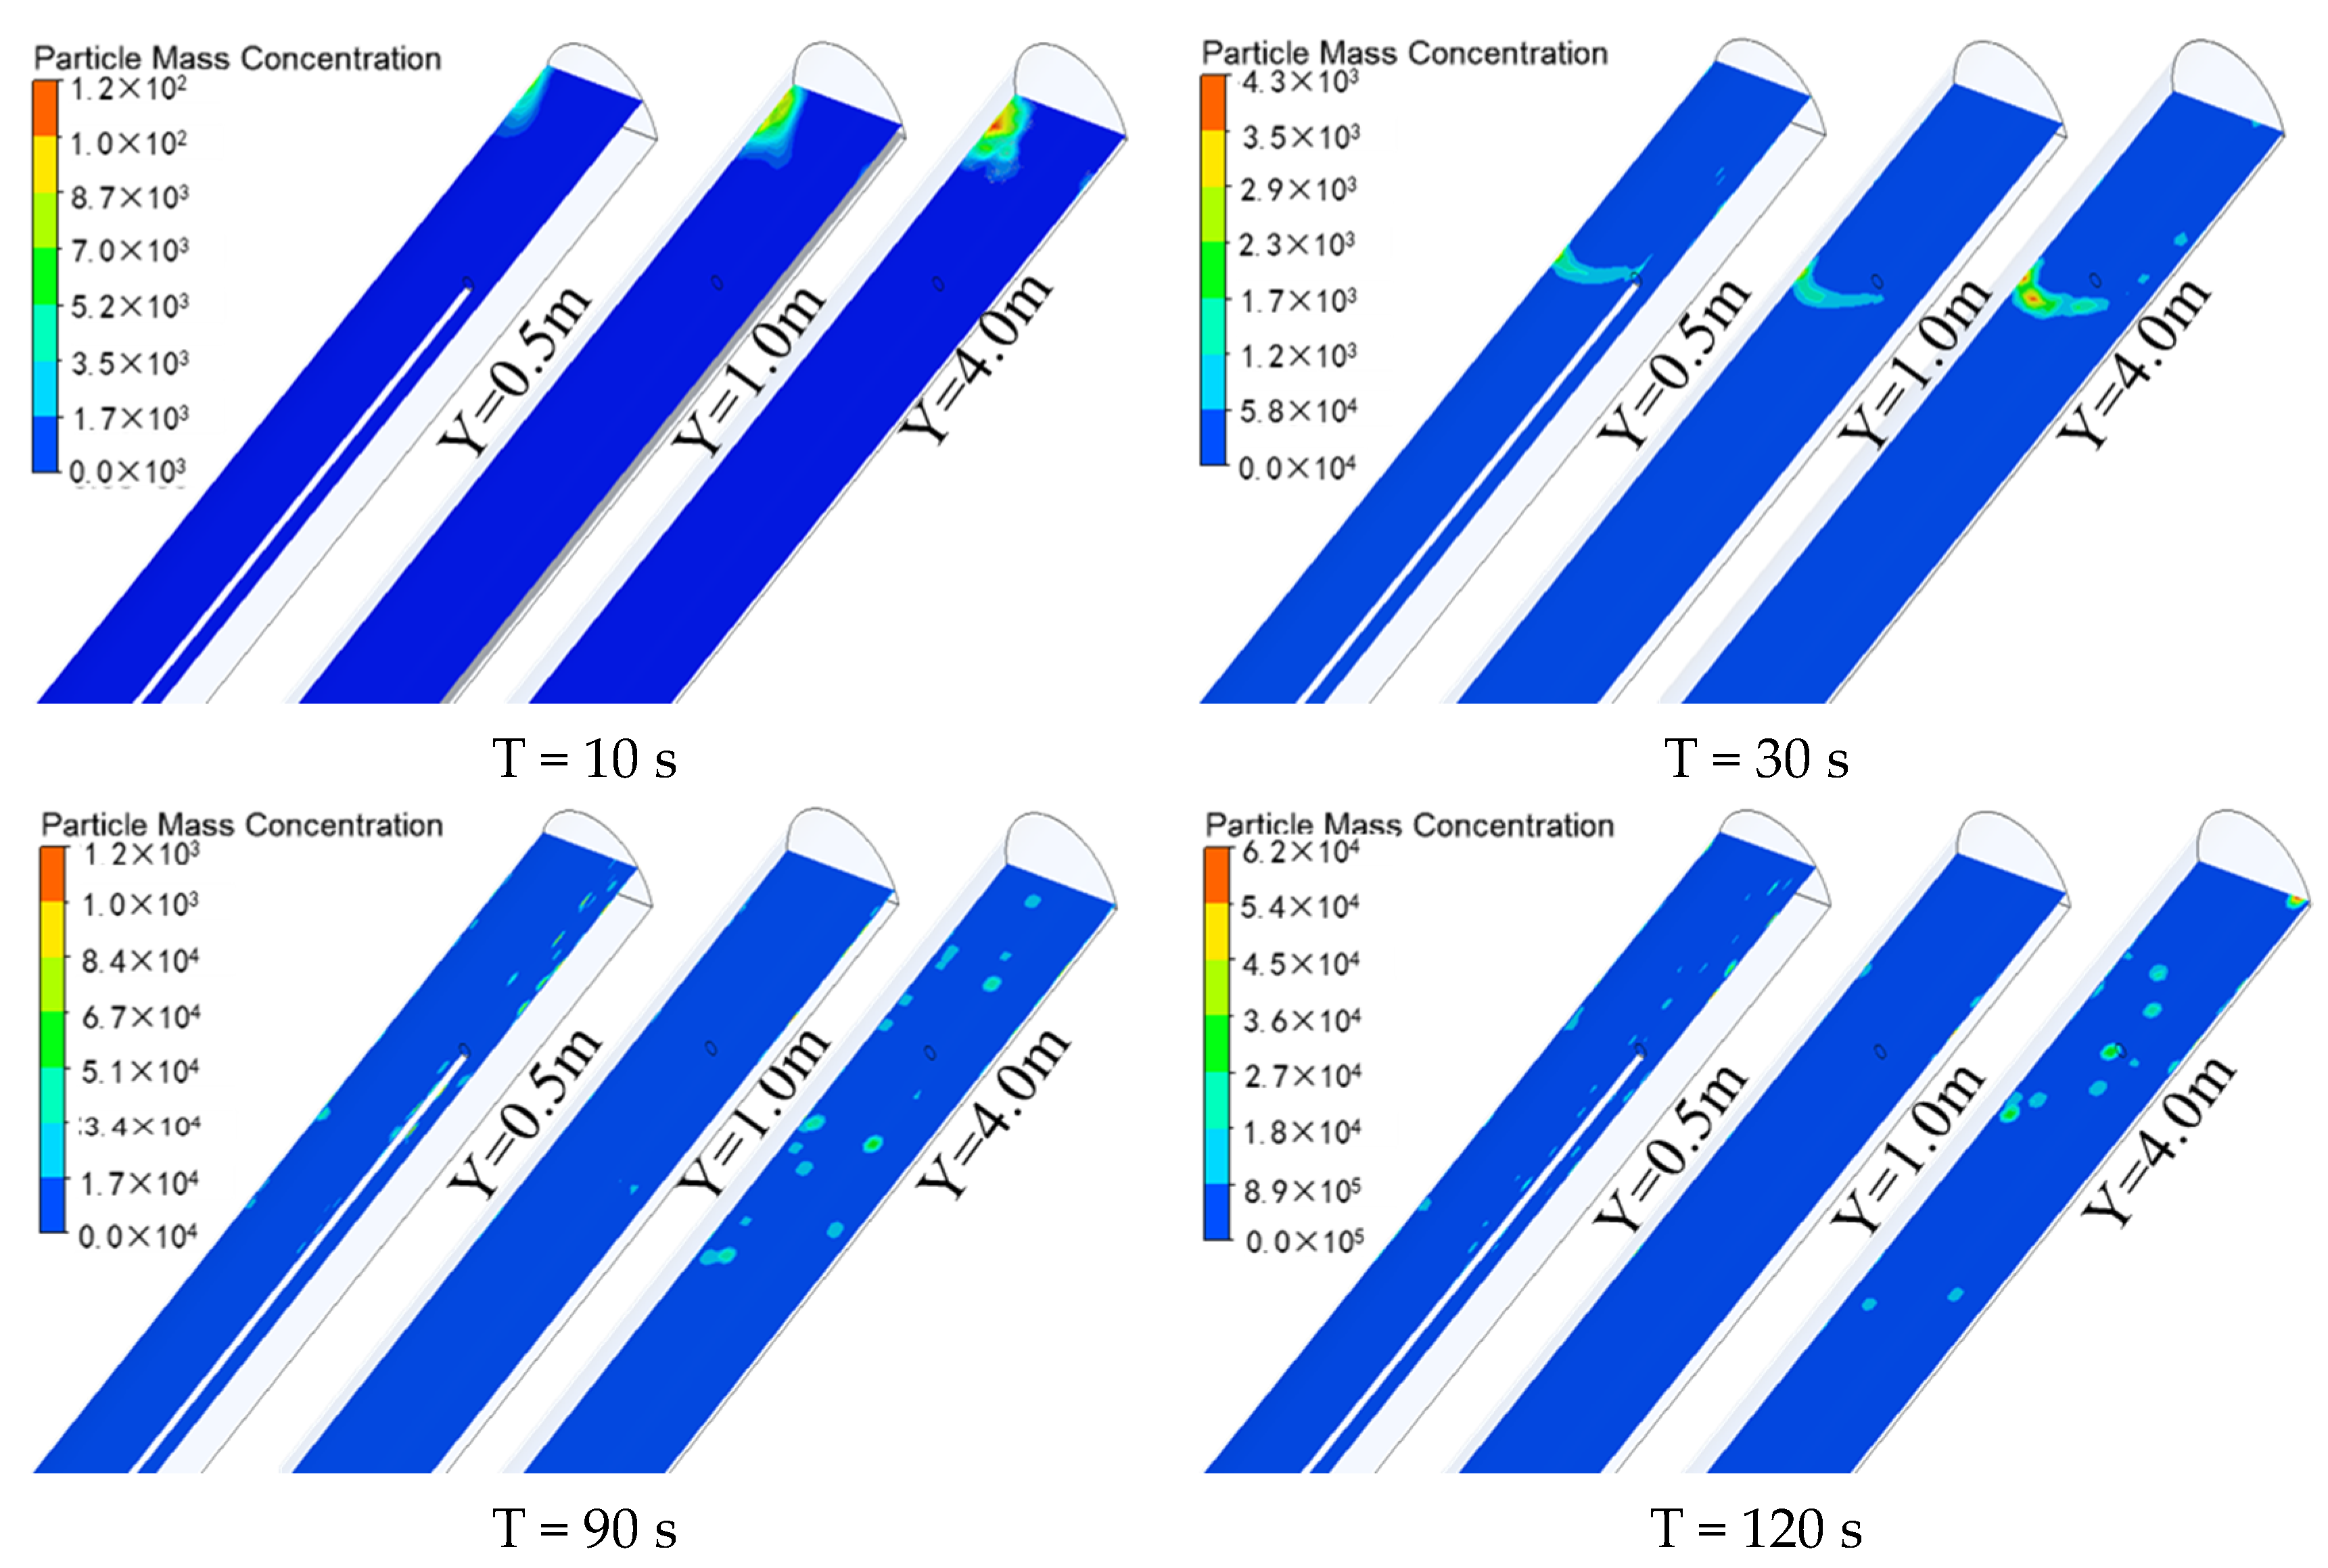
The Rosin–Rammler distribution function is the most authoritative model and method for describing the dust particle size distribution [33,34]. In this paper, the discrete phase model was used, and the particle size satisfied the R-R distribution, where the minimum particle size was 2 μm and the maximum particle size was 100 μm. Dust in the tunnel space within 300 s after blasting was selected for the particle size distribution analysis. At this time, the dust diffusion speed was fast and the particle size distribution range was wide, which is representative. The trajectories of particles with different particle sizes over time are shown in Figure 7. The following conclusions can be drawn from Figure 7:
(1)
Large particles of dust settled near the palm face under their own gravity, while small particles continued to be suspended in the tunnel air and had random pulsation. During stochastic diffusion, the particles underwent capture and terminated their motion when they came in contact with the tunnel floor;
(2)
The larger the particle size was, the faster the sedimentation velocity was, the shorter the horizontal movement distance was, and the shorter the sedimentation time was. Dust particles above 56 μm basically all settled within 25 m from the palm surface, a small portion of dust particles from 12–56 μm could settle, while most dust particles below 12 μm were suspended in the air due to their small particle size and randomly diffused outside the tunnel entrance;
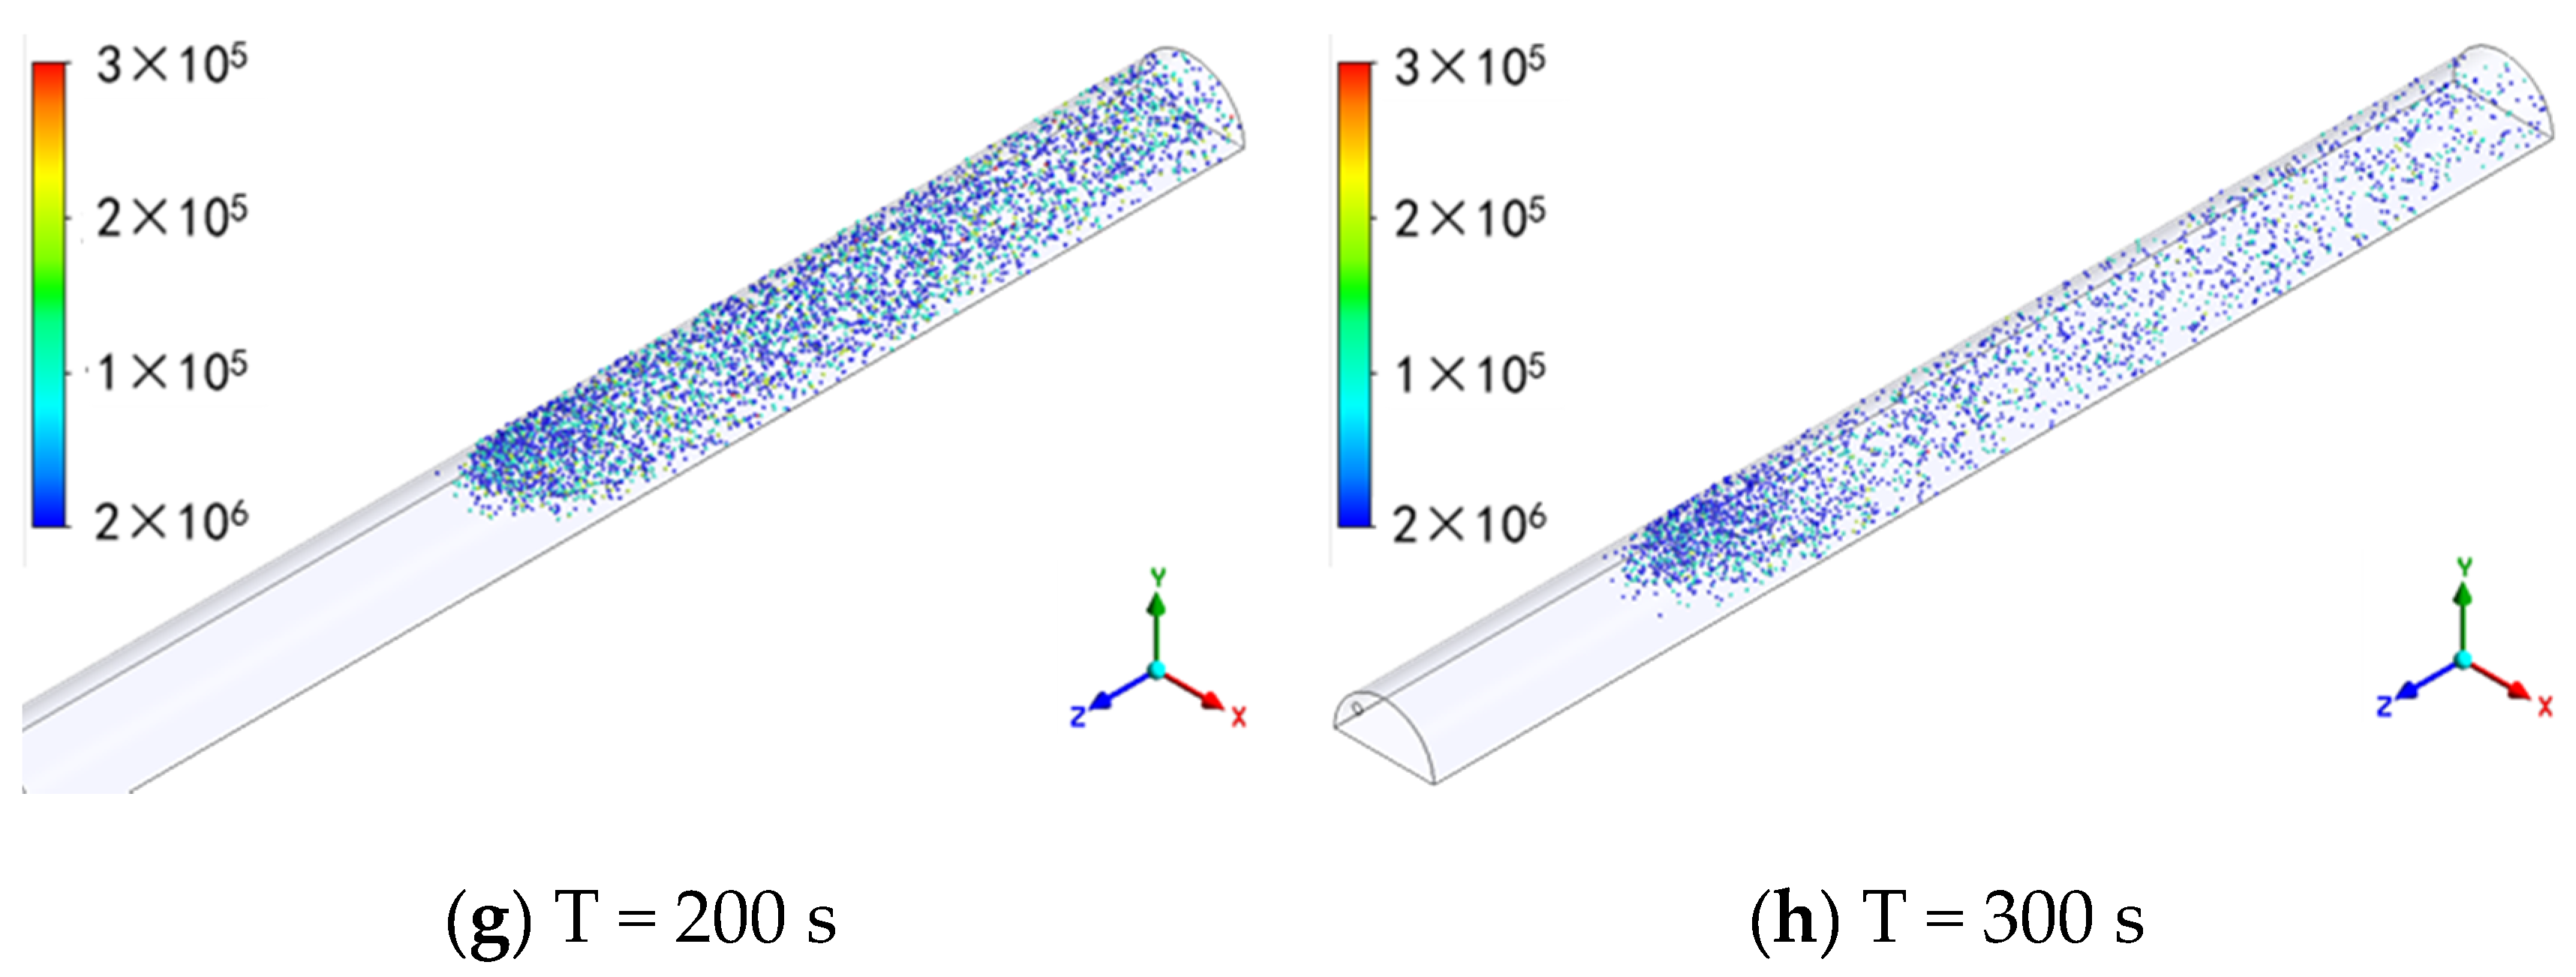
(3)
Over time, the large dust particles gradually settled, and the dust particles remaining in the tunnel space became smaller and smaller, while the overall quantity of dust particles gradually decreased. It took about 30 s, 120 s, and 300 s for the dust particles to diffuse to 50 m, 100 m, and 150 m, respectively.
In order to investigate the effect of different locations along the tunnel on the movement of particles of different sizes, the dust particle size distribution was statistically analyzed when the dust mass concentration had less variation. Six sections were taken for analysis at 10 m, 25 m, 50 m, 75 m, 100 m, and 150 m away from the palm surface. The distribution of the dust particle size in different sections during dust movement is shown in Figure 8.
It can be seen from Figure 8 that:
(1)
As the distance from the palm surface increased, the large dust particles basically settled out, and the proportion of small dust particles gradually became larger, with the majority of the particles smaller than 12 μm. The overall particle size became smaller; the dust particle size distribution range was reduced; the particle size distribution was more concentrated, resulting in the increase of the R-R distribution index;
(2)
The overall mass flow rate of the dust particles along the path decreased with increasing particle size. Within the first 25 m, the mass flow rate of dust from 2–12 μm accounted for 51.98% to 54.79%; the mass flow rate of dust less than 56 μm was as high as 90.45% to 96.25%; the mass flow rate of dust particle size above 75 μm was only 0.73% to 1.74%. The mass flow rate of large dust particles above 75 m from the palm face was almost 0.

4.4. Validation of the Numerical Simulation Results

In order to verify the accuracy of the numerical simulation results and optimize the setting of the simulation parameters, the simulation results of the dust concentration at the height of the tunnel breathing zone (Y = 1.5 m) were compared with the experimental data measured in [35], as shown in Figure 9.
As can be seen from Figure 9, the numerical simulation results of the dust concentration were generally consistent with the measured data in terms of the trend, and the error was within the controllable range. Meanwhile, the average absolute error between the measured data and simulation results was 4.63, indicating that the error between the measured data and the simulated results was small and the simulated results were credible. However, there were still some errors in the values of the two, which were mainly due to the differences between the simulation parameter settings and the actual engineering background conditions, and the field interference factors affected the authenticity of the measured data. The comparative analysis showed that the numerical simulation method used in this paper was accurate and credible.

5. Conclusions

In this study, based on the theoretical research of gas–solid two-phase flow and the simulation of the air flow field, the FLUENT software was used to simulate the concentration change and particle size distribution of blasting dust in tunnel construction by the drilling and blasting method. On the basis of the previously used methods, the settling pattern of dust of different particle sizes along the tunnel was further observed at the microscopic level. Moreover, the simulation results were compared and analyzed with the measured data in [35]. The following conclusions can be derived:
(1)
After the tunnel face blasting, the blasting dust was sprayed into the tunnel at a high speed under the action of shock wave and diffused with the wind to the portal. The dust concentration decreased gradually with the passage of time. The dust concentration decreased fastest within 2~120 s and then decreased slowly after 120 s. Then, 900 s after the blasting, the dust concentration in the tunnel decreased to less than 8 mg/m3, which reached the specified standard dust concentration value;
(2)
Dust particles will settle, be captured, or excluded along the tunnel under the wind flow. Large particles first settled rapidly under the action of gravity, while small particles pulse randomly in the tunnel and continued to diffuse forward with the wind flow. The size of suspended particles in the air gradually decreased; the particle size distribution range became concentrated; the R-R distribution index increased;
(3)
At the microscopic level, dust particles above 56 μm mainly settled within 25 m from the palm face; dust particles from 12–56 μm were mainly distributed within 100 m; dust particles less than 12 μm were more evenly distributed along the tunnel. It can be concluded that the farther away from the tunnel face, the lower the mass flow rate, and the smaller the dust particle size is; the proportion of small particle dust increased, but the overall amount of dust decreased;
(4)
The simulation results showed that the amount of blasting dust was large and difficult to reduce under natural conditions, and it took much time to reduce to the safety permission value. Therefore, reasonable and effective dust reduction measures need to be taken to improve construction efficiency and engineering benefits. At the same time, the simulation results were basically consistent with the measured data, which can be used to guide the layout of blasting water mist dust reduction measures in the tunnel. This conclusion can be used not only to explore a green and low-carbon mining technology, but also has important implications for improving the tunnel construction environment and enhancing the occupational safety of workers.

Author Contributions

Conceptualization, J.S.; methodology, H.A. and J.S.; writing—original draft preparation, W.Z., S.G. and H.A.; writing—review and editing, H.A.; supervision, J.S.; funding acquisition, H.A. All authors have read and agreed to the published version of the manuscript.

Funding

This research was partly funded by the Research Start-up Found for Talent of Kunming University of Science and Technology, Grant Number KKSY201867017, and the Fund from the Research Centre for Analysis and Measurement KUST (Analytic and Testing Research Centre of Yunnan), Grant Number 2020T20180040, and 2021M20202139010.

Institutional Review Board Statement

Not applicable.

Informed Consent Statement

Not applicable.

Data Availability Statement

The data used to support the findings of this study are available from the corresponding author upon request.

Conflicts of Interest

The authors declare no conflict of interest.

References

  1. Zhu, S.G.; Tao, T.; Tian, F. Analysis and Prevention of fugitive dust from mine tailings. J. Anhui Inst. Archit. 2014, 22, 82–85. [Google Scholar]
  2. Jiang, Z.A.; Li, T.; Zhang, Z. Numerical Simulation of the Airflow Field Rules in Tunnel Drill Blasting Construction. Ind. Saf. Environ. Prot. 2016, 42, 53–55. [Google Scholar]
  3. National Health Commission of the People’s Republic of China. National occupational disease report 2020. China Occup. Med. 2021, 48, 396. [Google Scholar]
  4. Dong, J.; Wang, R.S.; Yu, G.S.; Li, X.H. Numerical Simulation of Dust Migration Law at Fully Mechanized Excavation Face of Rock Roadway with Forced Ventilation Based on DPM. Saf. Coal Mines 2016, 47, 190–193. [Google Scholar]
  5. Lu, G.L.; Hu, H.; Xing, F.B. Numerical Simulation Study on the Movement Characteristics of Dust Flow in Mine Working Face. In Proceedings of the 2019 International Conference on Oil & Gas Engineering and Geological Sciences, Dalian, China, 28–29 September 2019; p. 012224. [Google Scholar]
  6. Li, Y.C.; Liu, T.Q.; Zhi, L.I.; Zhao, M. Research on unsteady migration law of dust in blasting tunnelling space. J. Saf. Sci. Technol. 2014, 10, 33–38. [Google Scholar]
  7. Zhang, G.L.; Jiang, Z.A.; Yang, B.; Yao, S.H.; Peng, Y.; Wang, Y.P. Numerical simulation of the minimum mine dust exhausting wind speed under high altitude environment. J. China Coal Soc. 2020, 46, 2294–2303. [Google Scholar]
  8. Zhang, L.C.; Zhou, G.; Ma, Y.; Jing, B.; Sun, B.; Han, F.W.; He, M.; Chen, X. Numerical analysis on spatial distribution for concentration and particle size of particulate pollutants in dust environment at fully mechanized coal mining face. Powder Technol. 2021, 383, 143–158. [Google Scholar] [CrossRef]
  9. Sa, Z.Y.; Li, F.; Qin, B.; Pan, X.H. Numerical simulation study of dust concentration distribution regularity in cavern stope. Saf. Sci. 2012, 50, 857–860. [Google Scholar] [CrossRef]
  10. Kanaoka, C.; Furuuchi, M.; Inaba, J.; Myojo, T. Flow and dust concentration near working face of a tunnel under construction. J. Aerosol. Sci. 2000, 31, 31–32. [Google Scholar] [CrossRef]
  11. Jiang, Z.A.; Wang, Y.P.; Men, L.G. Ventilation control of tunnel drilling dust based on numerical simulation. J. Cent. South Univ. 2021, 28, 1342–1356. [Google Scholar] [CrossRef]
  12. Sun, Z.Q. Study on Dust Migration Regularity and Control Technology in Drilling and Blasting Method of Highway Tunnel Construction. Ph.D. Thesis, Beijing University of Science Technology, Beijing, China, 2015. [Google Scholar]
  13. Quan, M.M. Study on Numerical Simulation of Blasting Fume Migration Law and Control in Tunnel with Drilling and Lasting Construction. Master’s Thesis, Anhui University of Technology, Anhui, China, 2020. [Google Scholar]
  14. Cao, Z.M.; Liu, X.; Niu, B.C. Migration Characteristics of Dust during Construction Stage in Highway Tunnels at High Altitude Areas. China J. Undergr. Space Eng. 2019, 15, 927–935. [Google Scholar]
  15. Bian, J.Q.; Bi, J.Y.; Wang, H.D. Numerical simulation study on unsteady distribution law of dust in blasting roadway of inclined ditch mine. China Min. Mag. 2019, 28, 269–274. [Google Scholar]
  16. Zhang, J.J. Gas-Solid Two-Phase Flow Simulation of Dust Migration and Deposition in Fully Mechanized Excavation Face. Master’s Thesis, University of Mining and Technology, Xuzhou, China, 2015. [Google Scholar]
  17. Hu, S.Y.; Feng, G.R.; Ren, X.Y.; Xu, G.; Chang, P.; Wang, Z.; Zhang, Y.T.; Li, Z.; Gao, Q. Numerical study of gas–solid two-phase flow in a coal roadway after blasting. Adv. Powder Technol. 2016, 27, 1607–1617. [Google Scholar] [CrossRef]
  18. Wang, Y.P.; Jiang, Z.A.; Chen, J.S.; Chen, J.H.; Wang, M. Study of high-pressure air curtain and combined dedusting of gas water spray in multilevel ore pass based on CFD-DEM. Adv. Powder Technol. 2019, 30, 1789–1804. [Google Scholar] [CrossRef]
  19. Zhou, G.; Zhang, Q.; Bai, R.; Xu, M.; Zhang, M. CFD simulation of air-respirable dust coupling migration law at fully mechanized mining face with large mining height. J. China Univ. Min. Technol. 2016, 45, 684–693. [Google Scholar]
  20. Jiang, Z.A.; Deng, Q.L.; Shi, X.X.; Chen, J.S. Numerical Simulation of Dust Mass Concentration Distribution in Screening Workshop of Asbestos Concentrator. J. Hunan Univ. 2017, 44, 135–141. [Google Scholar]
  21. Khaldi, N.; Marzouk, S.; Mhiri, H.; Bournot, P. Distribution characteristics of pollutant transport in a turbulent two-phase flow. Environ. Sci. Pollut. Res. 2015, 22, 6349–6358. [Google Scholar] [CrossRef]
  22. Candra, K.J.; Pulung, S.A.; Sadashiv, M.A. Dust dispersion and management in underground mining faces. Int. J. Min. Sci. Technol. 2014, 24, 39–44. [Google Scholar]
  23. Li, F.; Sa, Z.Y.; Wang, Y.; Zhang, H.N. Study on the dust concentration distribution and migration in flat-type chamber stope based on fluent software. Min. Res. Dev. 2010, 30, 77–80. [Google Scholar]
  24. He, G.H. Dust Distribution Law of Super-long Roadway in the Process of Digging and Blasting. Mod. Min. 2016, 32, 21–27. [Google Scholar]
  25. Jiang, Z.A.; Chen, M.L.; Chen, J.S. Numerical simulation of dust concentration distribution and changing regularities in roadway stope blasting. J. Cent. South Univ. 2013, 44, 1190–1196. [Google Scholar]
  26. Niu, W.; Jiang, Z.A.; Liu, Y. Numerical simulation on dust movement regularities at fully-mechanized coal faces and its utilization. J. Liaoning Tech. Univ. 2010, 29, 357–360. [Google Scholar]
  27. Dai, L.Y. Study on Function of Rosin-Rammler Particle size Distribution. Nonferr. Min. Metall. 2000, 16, 15–17. [Google Scholar]
  28. Zheng, G.B.; Kang, T.H.; Chai, Z.Y.; Yin, Z.H. Applied the Rosin-Rammler distribution function to study on the law of coal dust particle-size distribution. J. Taiyuan Univ. Technol. 2006, 37, 317. [Google Scholar]
  29. Pérez, K.; Toro, N.; Gálvez, E.; Robles, P.; Wilson, R.; Navarra, A. Environmental, economic and technological factors affecting Chilean copper smelters—A critical review. J. Mater. Res. Technol. 2021, 15, 213–225. [Google Scholar] [CrossRef]
  30. Jiang, Z.A.; Chen, J.H.; Wang, M.; Chen, J.S. Numerical simulation on influencing factors of dust concentration in ore unloading station. J. China Coal Soc. 2018, 43, 185–191. [Google Scholar]
  31. CCCC First Highway Engineering Group Co, Ltd. Technical Specifications for Construction of Highway Tunnel; JTG F60-2009; China Communications Press: Beijing, China, 2009. [Google Scholar]
  32. Xu, S.Q.; Ren, H.Y.; Wang, M.S.; Li, J. New method of dust removal by negative ions in construction tunnel. J. Transp. Eng. 2018, 18, 84–93. [Google Scholar]
  33. Hu, Z.W.; Bi, J.Y.; Wang, H.D. Study on the law of blasting dust migration in long distance tunneling face of Xiegou coal mine. China Min. Mag. 2019, 28, 340–345. [Google Scholar]
  34. Gong, X.Y.; Mo, J.M.; Xue, X.Y.; Xue, H.E. Analysis on influence of fractal characteristics on distribution and settlement of dust flow in heading face ventilation. Coal Technol. 2017, 36, 112–114. [Google Scholar]
  35. Ren, G.H. Research on Dust Migration and Dust Removal during Blasting of Long Inclined Tunnel under Complex Conditions. Master’s Thesis, Shandong University of Science and Technology, Shandong, China, 2020. [Google Scholar]
Figure 1. Tunnel geometry model and meshing.
Metals 12 00547 g001
Figure 2. Distribution of airflow streamlines in the tunnel.
Metals 12 00547 g002
Figure 3. Wind speed body of the tunnel space.
Metals 12 00547 g003
Figure 4. Distribution of blasting dust concentration at a 1.5 m height.
Metals 12 00547 g004
Figure 5. Dust concentration cloud map with time at three height levels.
Metals 12 00547 g005
Figure 6. Curves of the blasting dust concentration with time at three height levels.
Metals 12 00547 g006
Figure 7. Trajectory of blasting dust over time.
Metals 12 00547 g007aMetals 12 00547 g007b
Figure 8. Distribution of the dust particle size at different locations along the tunnel.
Metals 12 00547 g008aMetals 12 00547 g008b
Figure 9. Comparison between the simulated and measured values of the dust concentration.
Metals 12 00547 g009
Table 1. Calculation model parameters.
Parameter NameParameter Setting
SolverPressure-based solver
Viscous modelk-epsilon model
Inlet boundary typeVelocity inlet
Inlet velocity20 m/s
Outlet boundary typePressure outlet
Discrete phase modelOpen
MaterialDolomite
Particle size distribution typeR-R distribution
Min. particle diameter2 μm
Max. particle diameter100 μm
Median diameter12 μm
Distribution index1.93
Mass flow rate0.03 kg/s
Turbulent diffusion modeStochastic trajectory model
Publisher’s Note: MDPI stays neutral with regard to jurisdictional claims in published maps and institutional affiliations.

