Article

A Numerical Model for the Compressive Behavior of Granular Backfill Based on Experimental Data and Application in Surface Subsidence

Center for Rock Instability and Seismicity Research, Northeastern University, Shenyang 110819, China
*
Author to whom correspondence should be addressed.
Metals 2022, 12(2), 202; https://doi.org/10.3390/met12020202
Submission received: 21 November 2021 / Revised: 16 December 2021 / Accepted: 18 January 2022 / Published: 21 January 2022
(This article belongs to the Special Issue Green Low-Carbon Technology for Metalliferous Minerals)

Abstract

:
Granular backfill is generally confined in stopes to bear underground pressure in metal mines. Its mechanical behavior under lateral confinement is vital for controlling stope wall behavior and estimating surface subsidence in backfill mining operations. In this paper, an experimental apparatus has been developed to explore the bearing process of granular material. Pebbles were selected to model granular backfill. A series of compression experiments of pebble aggregation were performed under lateral confinement condition using the experimental apparatus. The bearing characteristics of the pebble aggregation with seven gradations were analyzed. Based on the experimental data, a constitutive model that takes the real physical characteristics of granular material into account was proposed with variable deformation modulus. The constitutive model was implemented into the FLAC3D software and verified basically by comparison with experimental results. The surface subsidence in backfilling mines was studied using the proposed model. The effects of the particle size of the granular backfill and the height and buried depth of mined-out stopes on surface subsidence have been clarified. The research results are of great significance for guiding backfill mining and evaluating surface subsidence and movement.

1. Introduction

Granular backfill mining has been widely used because filling body performance plays a significant role in supporting the surrounding rock, preventing surface subsidence, and utilizing solid wastes. However, ground subsidence occurred at a nickel mine even with cemented backfilling in China after 18 years [1,2]. If the backfill material was granular (non-cemented filling) for this nickel mine, the surface subsidence might be worse due to the mainly particularly compressive characteristics of granular materials. Therefore, the deformation characteristics and mechanical behavior of granular backfill have attracted great attention. El-Sohby and Andrawes [3] divided the total deformation of granular material into elastic and sliding components by a conventional triaxial test, and the deformation was unrecoverable. On this basis, the compaction process was divided into a rapid compression deformation stage, slow compaction deformation stage, and stable compaction stage [4]. Then, the stress–strain curve of granular material was separated into the initial compaction stage with low stress and elastic compaction stage with high stress [5]. As a result, it has been concluded that the nonlinear behavior of granular materials was displayed [6,7,8,9,10]. Meanwhile, the deformation resistance of granular materials is affected by the particle shape, stiffness, dimension, and granular gradation [11,12,13,14].
The deformation modulus is an essential mechanical property of granular materials. In general, the deformation modulus has been analyzed and usually obtained by the existing theoretical methods and stress–strain curves. For example, Kiran et al. [15] proposed a method to calculate the deformation modulus of a granular pile by an in-situ load test, and Sharma and Gupta [16] found that the granular pile has non-uniform settlement according to the non-linear deformation modulus. In the laboratory, the deformation modulus of granular materials is usually obtained by compression experiments. It increases with increasing compaction deformation [17,18]. An exponential relationship between the deformation modulus and axial strain was revealed [19].
For numerical modelling, the deformation modulus is a key input parameter to simulate the mechanical behavior of granular backfill in mining engineering. Yu et al. [20], Wang et al. [21], and Pu et al. [22] adapted the Mohr–Coulomb criterion to gangue backfill and assigned a constant value to the deformation modulus of it in FLAC3D. The simulation results showed that the filling body played a strong role in supporting roof strata, and the roof deformation decreased with increasing filling ratio. Li et al. [23] used the same model and reported that surface subsidence decreased by increasing the filling body’s deformation modulus. The double-yield criterion [24] was also introduced to simulate the mechanical behavior of granular backfill. Li et al. [25] matched a constant value to the deformation modulus of granular backfill using the double-yield criterion and revealed that backfill materials composed of finer particles are beneficial to inhibit surface deformation and subsidence. Moreover, Zhu et al. [26] found that reducing the compression ratio of granular backfill is conducive to restraining surface subsidence.
However, experimental studies showed that the bearing process of granular backfill is dynamic and nonlinear under the loading of overlying strata. The stress–strain relationship was described by an exponential function [9]. The deformation modulus of granular backfill is not constant. In particular, in deep mining, the granular backfill is often subject to a high-stress state, and the evolution of the deformation modulus is crucial for the surface subsidence. The previous studies from numerical modelling that considered the deformation modulus of granular material as a constant did not reflect the actual mechanical behavior of the granular backfill. If engineering was involved in a large volume of granular backfill, the numerical results might differ from the physical ones.
Therefore, the purposes of this paper are to propose a constitutive model for granular material based on a series of confinement compression experiments. The proposed constitutive model that takes the actual physical characteristics of granular material into account was implemented in FLAC3D and verified basically by comparison with experimental results. Then, the proposed model was applied to analyze surface subsidence in backfilling mines, and the effects of the particle size of the granular backfill and the height and depth of the mined-out stope on surface subsidence and movement were discussed.

2. Compression Experiment of Granular Backfill
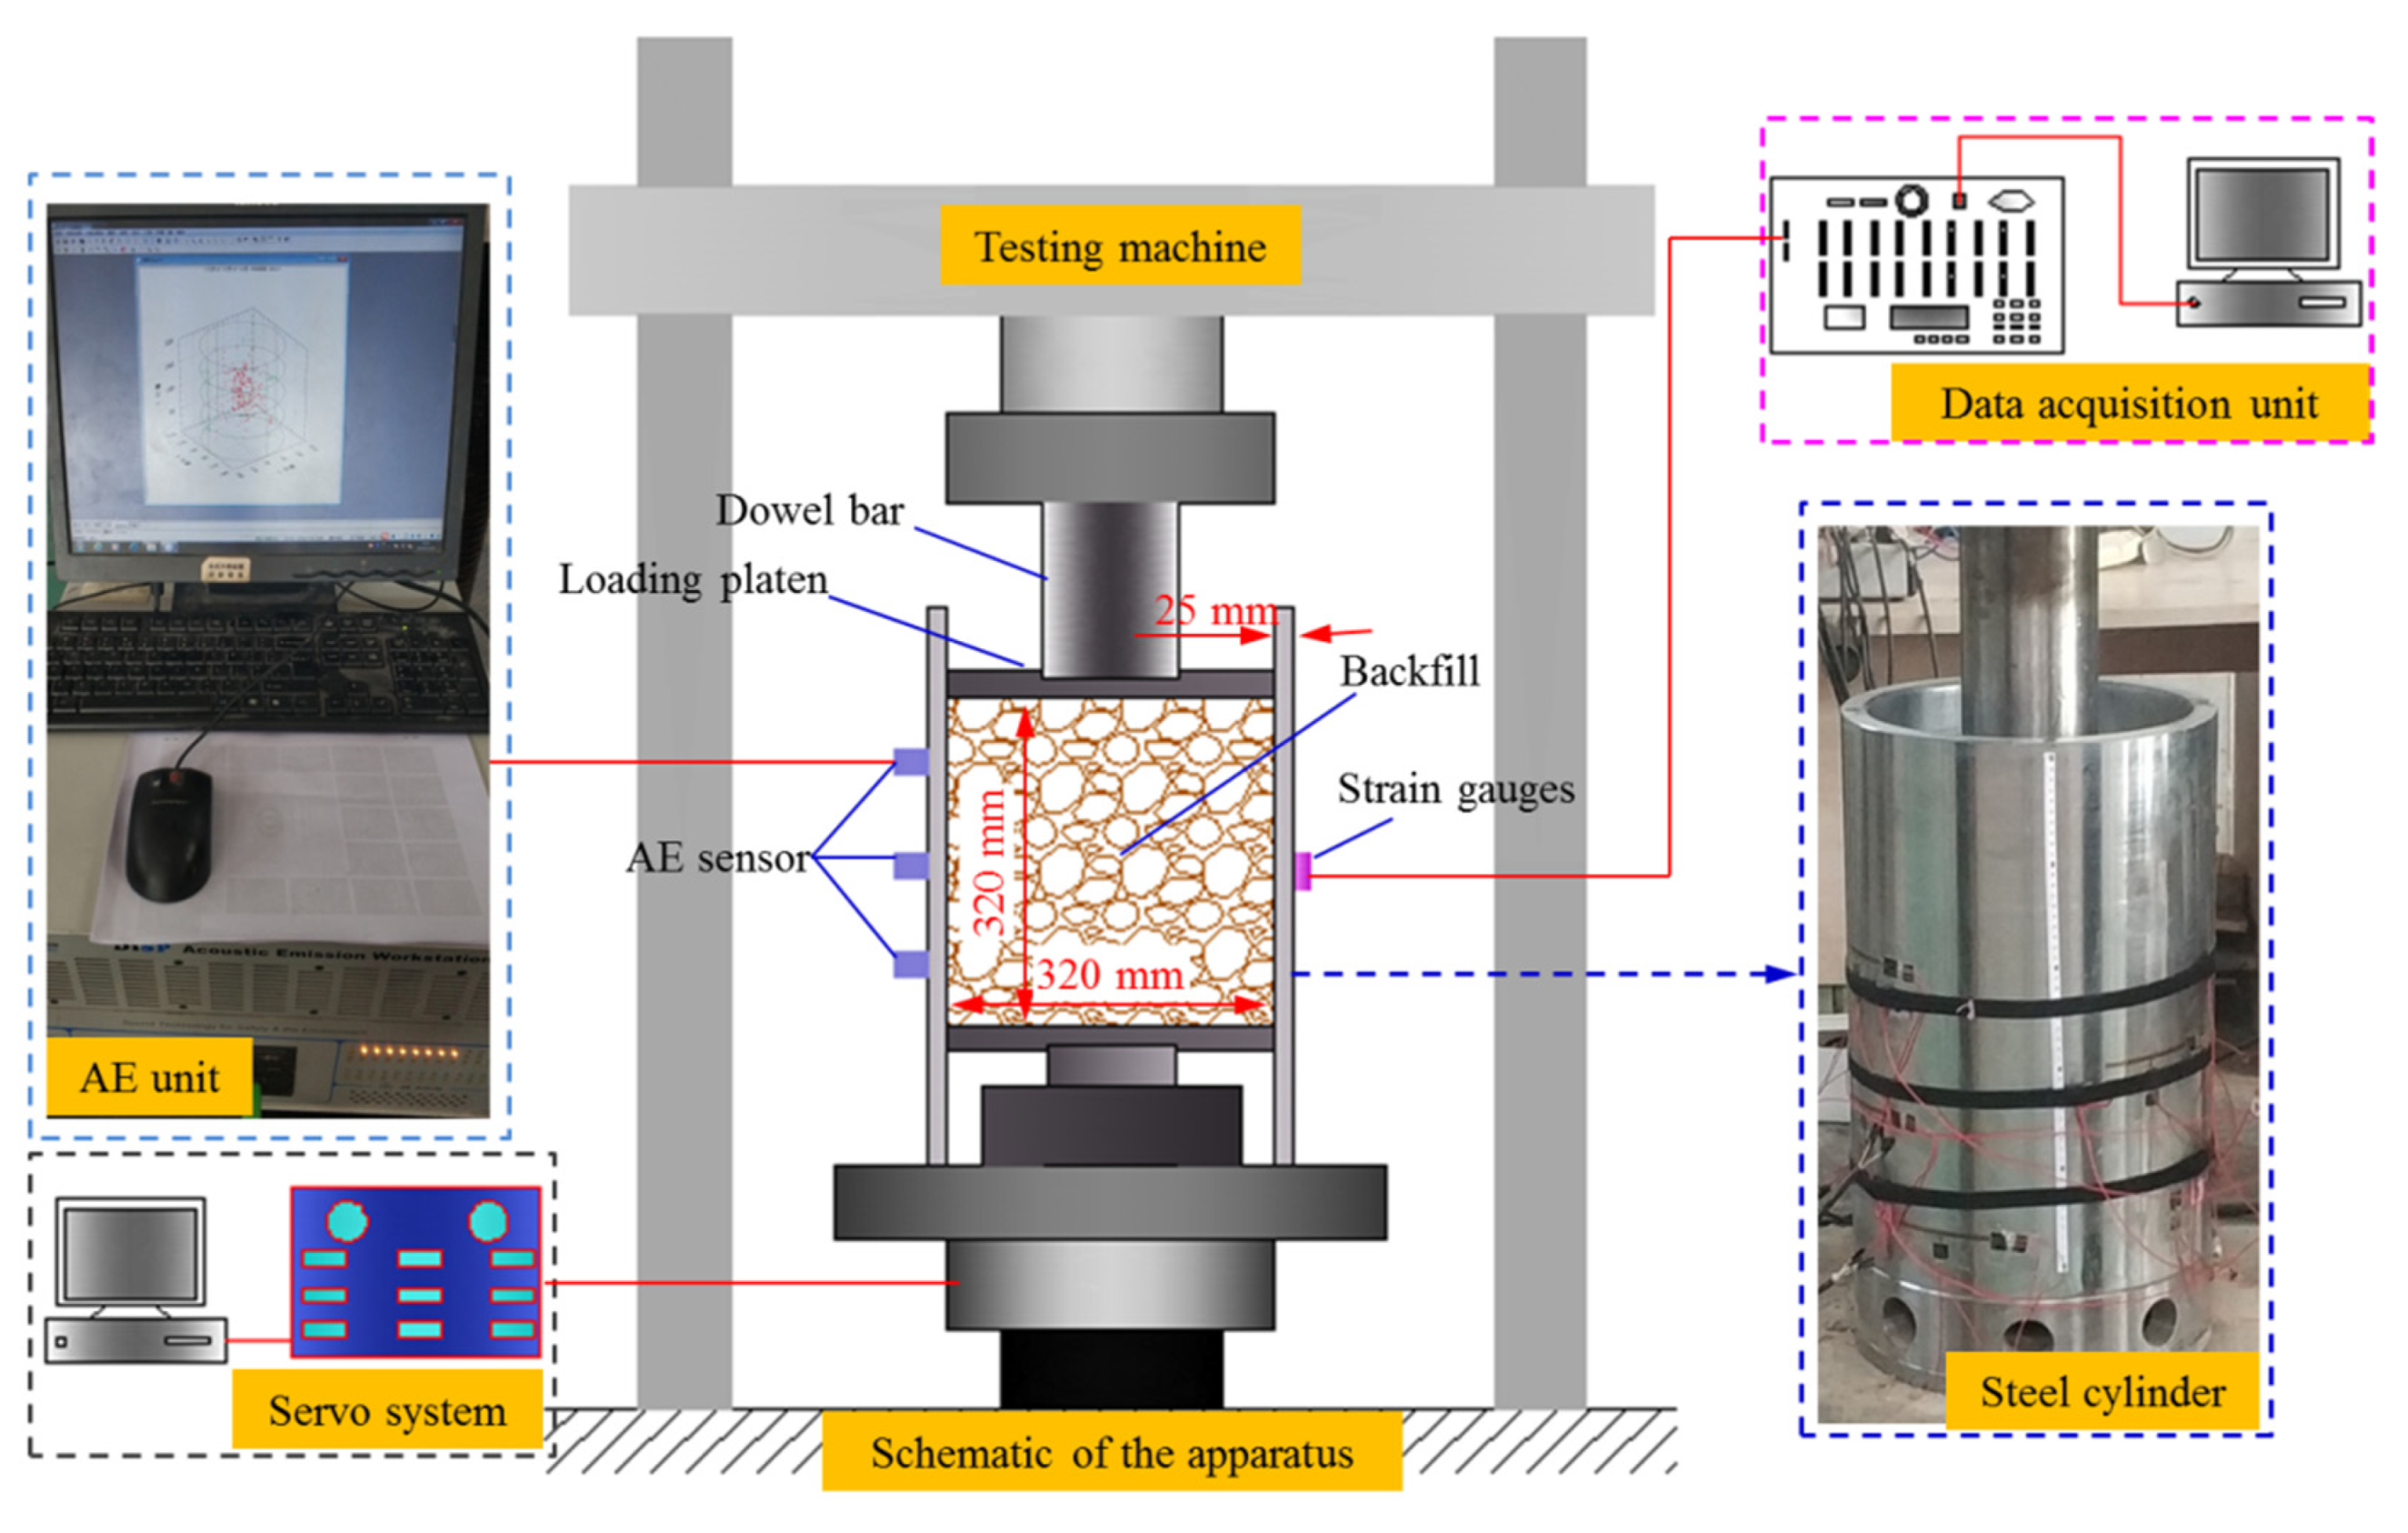
2.1. Testing System

The test system used for determining the compaction characteristics of granular materials is shown in Figure 1, and it consists of a compactor, loading control unit, data acquisition unit, and acoustic emission (AE) unit. The device and method for testing the compression performance of granular materials were granted a Chinese patent (ZL202010685632.1).
The compactor is a self-designed steel cylinder with an inside diameter of 320 mm, a thickness of 25 mm, and a maximum filling height of granular materials of 500 mm. The axial loading comes from the YAW-5000 electro-hydraulic servo machine, and the loading process was carried out by a dowel bar and a loading platen. The steel cylinder, loading platen, and dowel bar are made of 45# carbon steel, of which the elastic modulus and Poisson’s ratio are 207 GPa and 0.26, respectively. The strain gauges measured the lateral deformation transmitted to the cylinder wall, and the data acquisition automatically recorded the data. During the compression process of granular materials, the elastic wave caused by friction between particles and particle breakage is transmitted to the cylinder wall, and the AE sensor can convert the monitored surface displacement into an AE signal from which changes in the internal structure of granular materials are inferred. Therefore, the AE monitoring method was used to monitor the movement response and crushing of particles. Nine AE sensors were arranged in three layers and placed on the outer wall of the steel cylinder at equal intervals. The fixed threshold was set at 45 dB. The loading control, strain acquisition, and AE monitoring system work synchronously.

2.2. Sample Preparation

In this study, pebbles were selected to model the granular backfill, and they were sifted from the pebble formation of Yanshan Mine, Hebei Province, China. In the laboratory, the pebbles were further divided into seven gradations using standard test sieves. The gradations were 4.75–9.5 mm, 9.5–13.2 mm, 13.2–16 mm, 16–20 mm, 20–26.5 mm, 26.5–31.5 mm, and 31.5–37.5 mm, and a multi-function 3D scanner (EinScan-Pro) and image processing software were used to statistically analyze the shape of the pebbles of the seven gradations, as shown in Figure 2. According to statistical analysis, the pebble particles have the shapes of irregular convex polyhedrons with a relatively smooth surface, and the shapes of pebbles are also quite different in one gradation.

2.3. Experimental Methods and Procedures

This study carried out the compression experiments of pebbles with seven gradations. In order to ensure that the pebble particle placement was relatively uniform, the pebbles were filled into the compactor layer by layer. The filling height in each test was about 320 mm. The initial porosity of pebble backfill with seven gradations and the test scheme are shown in Table 1. Relatively low strain rate compression favors homogeneous crushing of particles and observation of the whole compression process of granular materials. We restricted the strain rates of the compression experiments near and within the quasi-static regime, i.e., the strain rate condition was always well below 10−3/s [27]. According to the filling height of granular backfill and in order to prolong the strain hardening time of granular materials as much as possible, the displacement-control loading model of the YAW-5000 electro-hydraulic servo machine was adopted, and the loading rate was 1 mm/min.
It should be noted that the mechanical behavior of granular materials is similar to the representative element volume (REV) of the rock mass. Investigations show that the ratio of compaction diameter to pebble particle size (D/d) should be at least 5 in order to represent granular material behavior [28,29,30]. In this experiment, the largest pebble grade was 31.5–37.5 mm, and the diameter of compaction was 320 mm. The minimum value of D/d ranged from 8.53 to 10.16 (Table 1) and therefore met the experimental requirements.

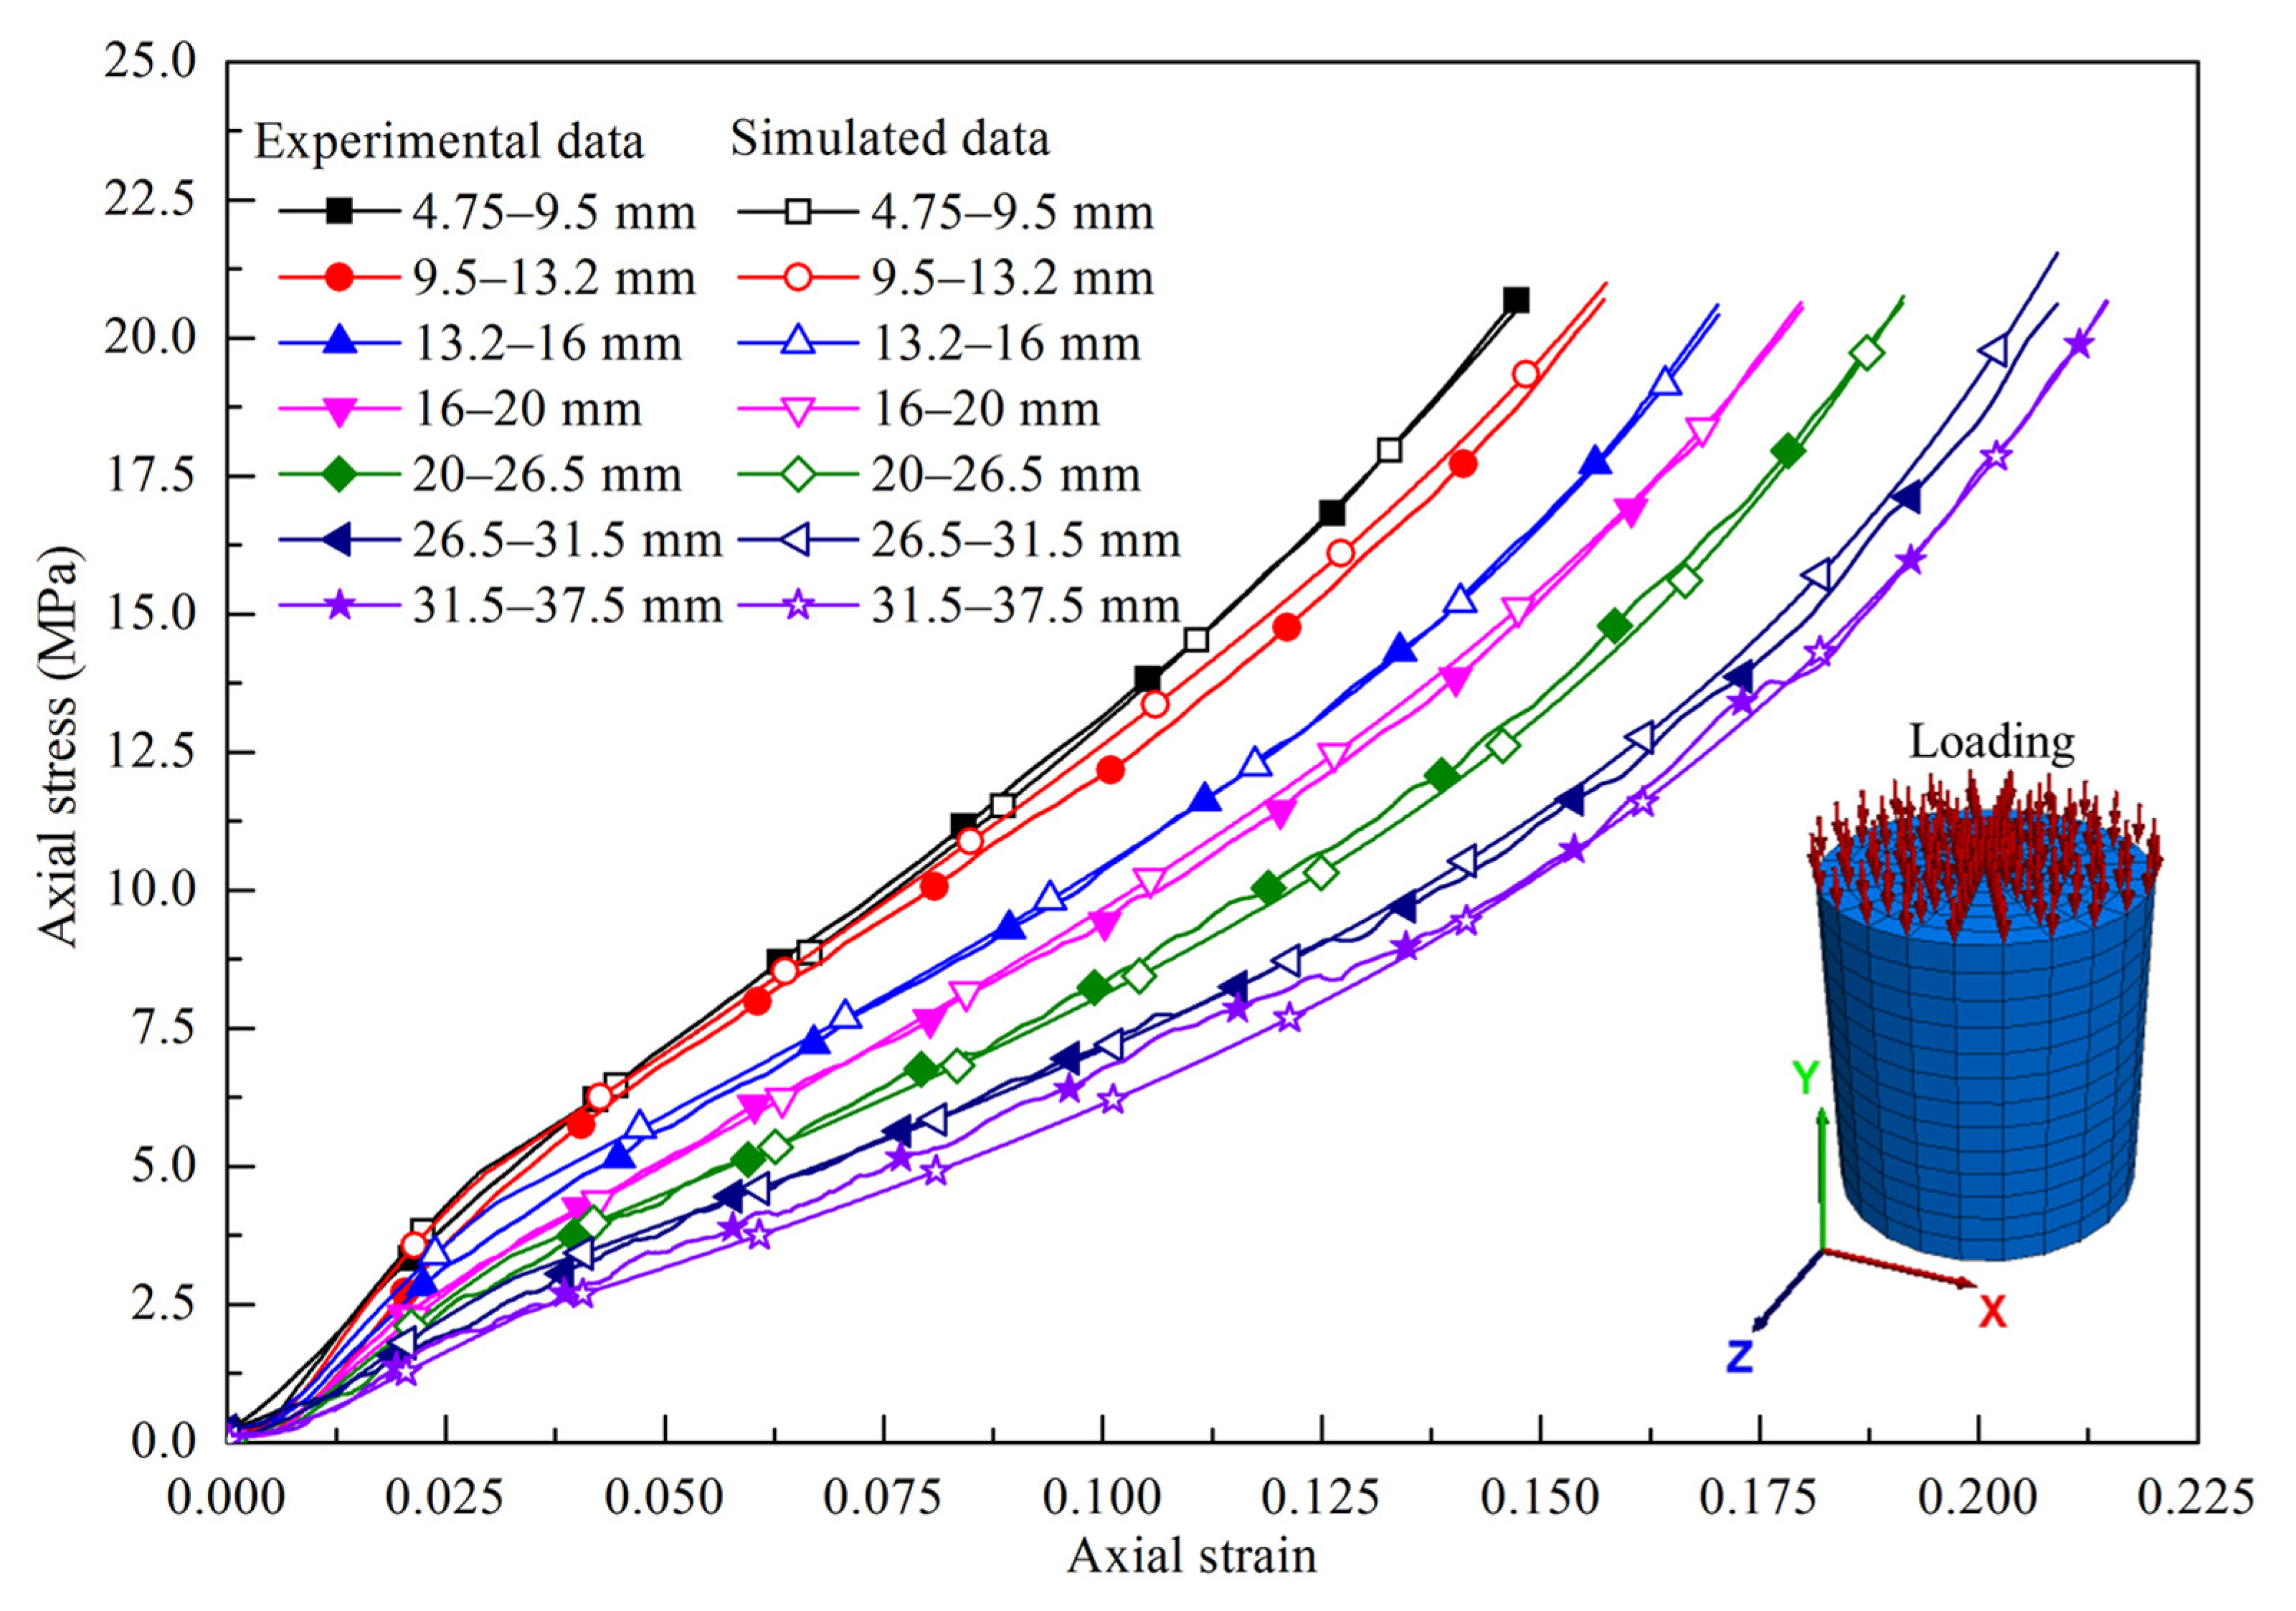
2.4. Experimental Results

2.4.1. Compaction Characteristics of Pebble Backfill

The essence of the compressive process of granular backfill under lateral confinement conditions is continuous reorganization of particles for granular material structure accompanied by friction and crushing between particles [31,32]. The stress–strain curves of pebble backfill with various gradations are shown in Figure 3, which exhibits certain volatility because of the movement and fragmentation of particles, showing a nonlinear growth trend similar to the coal gangue compression curve of different particle sizes [9]. Strain hardening occurs with increasing axial stress due to the compaction of pebble backfill. From the strain–stress curves of the pebble backfill with various gradations (Figure 3), it can be observed that a greater particle size indicated a greater strain value at the same stress level. The strain is caused by the shrinkage of gaps and the crushing between pebble particles during the compression of granular backfill. In the same volume, there are few contacts between larger particles. Intense stress concentration can be produced under the same loading, resulting in particle crushing, and then large deformation. Therefore, it can be concluded that the large particle size of granular material indicated large deformation and weak resistance to stress.

2.4.2. Non-Constant Deformation Modulus

According to the stress–strain curves in Figure 3, it can be preliminarily determined that the deformation modulus ( E t ) is a non-constant and changes with compression deformation. During the compression process of pebble backfill, the responses of particle crushing and moving were captured by the AE monitoring system and displayed in terms of released energy. The relationship between AE energy, deformation modulus ( E t ), and the axial strain of the seven grades of pebble backfill were consistent, and Figure 4 shows this relationship for the pebble backfills with 4.75–9.5 mm, 16–20 mm, and 31.5–37.5 mm gradations. Based on the changes in AE energy, the deformation modulus ( E t ) of the pebble backfills can be divided into the following three stages:
  • Rapid growth stage (Stage 1). The pebble backfill is initially in a loose and unstable state at lower axial stress, and AE energy is lower because particles have just rotated or moved. As axial stress increases, relatively stable contacts between particles within the pebble backfill are formed. The gaps between the particles shrink so rapidly that the deformation modulus ( E t ) increases rapidly.
  • Diminishing stage (Stage 2). With axial stress gradually increasing, the crushing of many particles occurs inevitably due to stress concentration in this stage. A large amount of AE energy is released, and there are many high AE energy records that correspond to the strain level. As a result, the deformation modulus ( E t ) decreases with increasing axial strain due to the crushing and softening of the pebbles [33].
  • Stable growth stage (Stage 3). With axial stress continuously increasing, the crushing and secondary crushing of particles are repeated and the gaps are filled by newly produced fine particles. Compared to the AE energy in stage 2, there is still a lot of AE energy released, but high AE energy records are reduced. This stage is primarily reflected by the strain hardening of the pebble backfill. Therefore, the deformation modulus ( E t ) increases steadily with increasing axial strain.

3. Numerical Model for Granular Material

3.1. Constitutive Model for Granular Backfill Based on Experimental Data

For the backfill mining, when granular backfill is filled into the mined-out area, the backfill is gradually compressed and shows strain hardening behavior due to the loading of overlying strata. The stress–strain curve of granular backfill is non-linear, and its deformation modulus is non-constant during the irreversible compaction (Figure 3). Therefore, this feature of the granular material should be considered in its constitutive model to describe the actual physical process of granular backfill. It is necessary for numerical simulations.
The deformation modulus ( E t ) of the granular material is related to its composing structure as well as the elastic modulus of particles. During the compaction process, the change in the deformation modulus ( E t ) of the granular material is strongly related to the density degree of the granular material. In this case, the volumetric strain ( ε v ) of the granular material is an indicator of this. Therefore, the volumetric strain ( ε v ) of the pebble backfill was selected as a variable to describe the deformation modulus ( E t ). The relationship between the deformation modulus ( E t ) and the volumetric strain ( ε v ) of the pebble backfill can be established based on experimental data. The relationship of E t ε v of the pebble backfill with 4.75–9.5 mm, 16–20 mm, and 31.5–37.5 mm gradations is presented in Figure 5, and it can be fitted by the piecewise function (linear and exponential equations) of Equation (1).
E t = { a + b ε v       ( ε v < m 1 ) c + d ε v     ( m 1 ε v m 2 ) e + k exp ( p ε v )    ( ε v > m 2 ) ,
where m 1 and m 2 represent the critical volumetric strain ( ε v ) of stage 1, stage 2, and stage 3; a, b, c, d, e, k, and p are the experimental fitting coefficients. These coefficients can be obtained by fitting experimental data.
As the volumetric strain ( ε v ) of the granular material increases when it is subject to external loading, the deformation modulus ( E t ) of the granular material increases firstly, then decreases, and increases again. Equation (1) is used to describe the constitutive relationship for granular material to consider the dynamic mechanical property in numerical simulations.

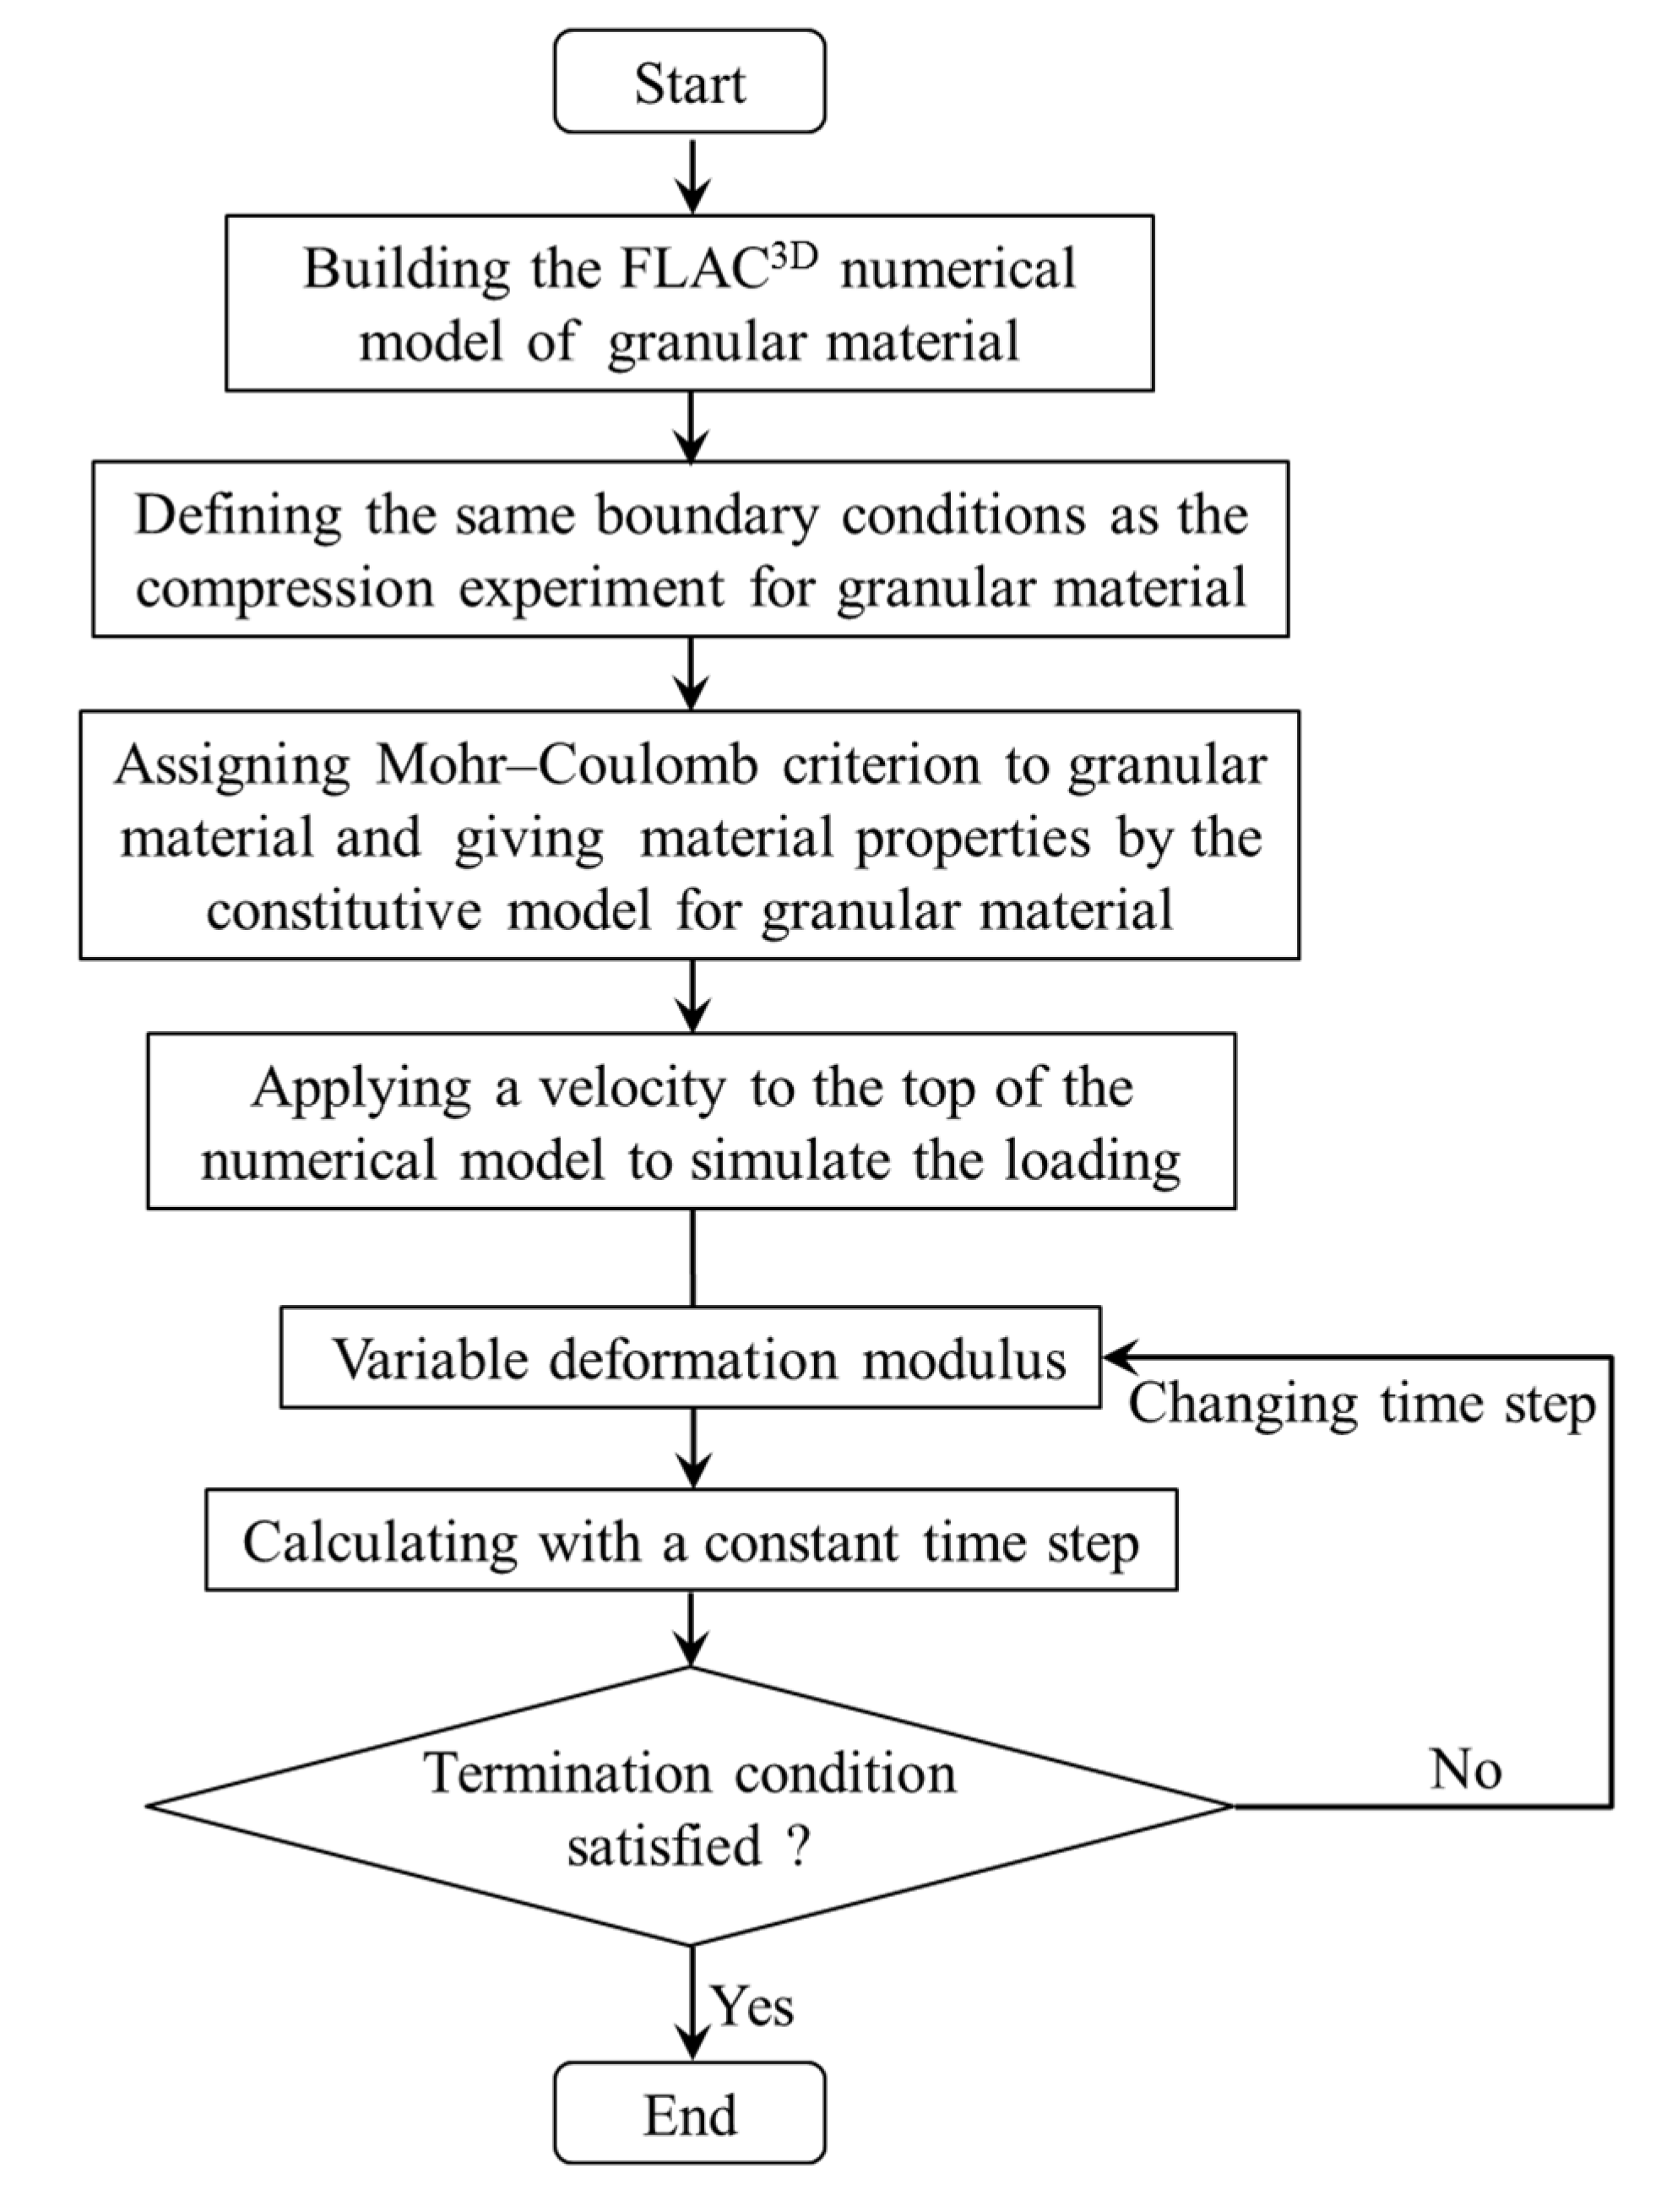
3.2. Model Implementation

FLAC3D is a three-dimensional explicit finite-difference program for engineering mechanics computation, and the explicit Lagrangian calculation scheme and the mixed-discretization zoning technique used in FLAC3D ensure that plastic collapse and flow are modeled very accurately [34]. Therefore, the proposed constitutive model for granular material has been implemented into the FLAC3D software using fish language to simulate the compressive behavior of the granular material. Its implementation in FLAC3D is as follows:
  • During the numerical calculations, the volume strain ( ε v ) of the granular material is monitored continuously, which usually increases gradually as granular material is compacted. According to the value of the volumetric strain ( ε v ), an appropriate formula of piecewise function Equation (1) is selected to calculate the deformation modulus ( E t ) of the granular material.
  • The deformation modulus ( E t ) of the granular material is in a continuous iteration state due to the variation of the volume strain ( ε v ). They are updated every ten time steps. The following calculation builds on the previous step in the numerical simulation of the granular material.
The numerical modeling procedure for granular material is demonstrated in Figure 6. Firstly, a numerical model of pebble backfill was built in FLAC3D, and the same boundary conditions as the experiment were applied, i.e., the sides and bottom boundary of the model were constrained by displacement. Afterwards, based on the adopted Mohr–Coulomb criterion, the deformation modulus was assigned by the constitutive model for granular material. Thirdly, a velocity was applied to the top of the model to simulate the loading. Finally, the calculation continued until the axial strain and volume strain matched the experimental results by changing the time step.

3.3. Verification

To verify the model, compression tests of pebble backfill with seven gradations were simulated, corresponding to the experimental design in Table 1. The loading rate was 1 mm/min, and the x and z directions of the numerical model were fixed. It should be noted that the fitting coefficients and critical volume strain in the proposed constitutive model for pebble backfill (a, b, c, d, e, k, p m 1 , and m 2 in Equation (1)) were determined by fitting experimental data, as shown in Table 2.
Figure 7 shows the comparison of the axial stress–strain curves between experimental and numerical data. In Figure 7, the solid dotted lines denote the experimental stress–strain curves, while the hollow dotted lines denote numerical ones. It is observed that they were well matched, which indicated that numerical model for pebble backfill is capable of capturing the compressive behavior of the granular material under lateral confined conditions.

4. Application of Backfill Mining for Surface Subsidence

In this section, the proposed numerical model was used to analyze the surface subsidence for a mining operation where the mined-out stopes were filled with granular backfill. The effects of the particle size of the granular backfill and the height and depth of the mined-out stope on surface subsidence and movement were further discussed.

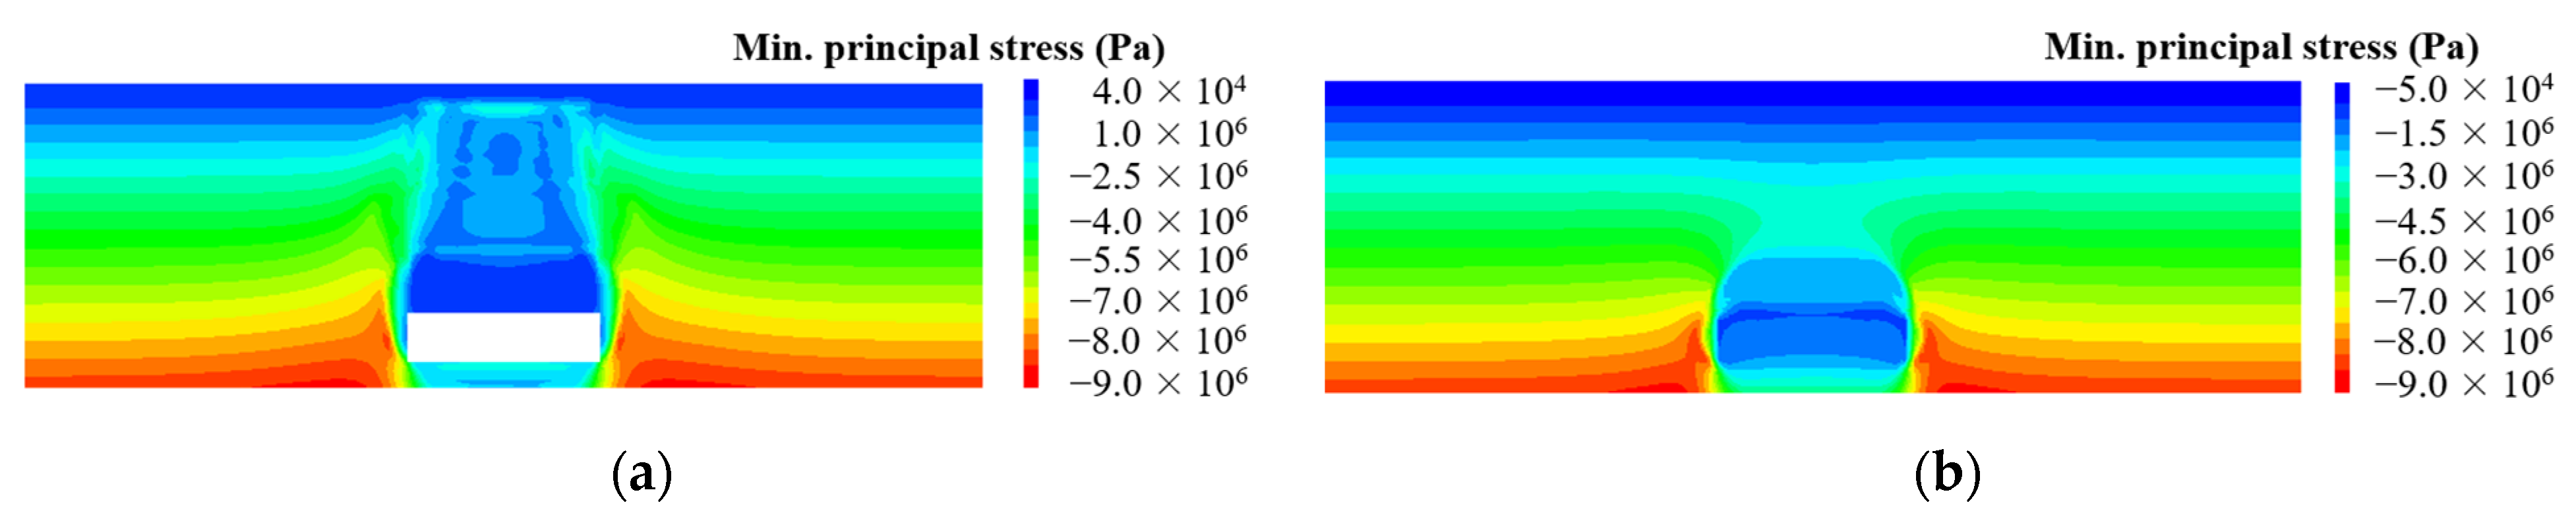
4.1. Numerical Simulation Model

The numerical model for surface subsidence analysis of backfill mining was set up as demonstrated in Figure 8. The dimensions are 1000 m × 450 m × 320 m (length × width × height). In light of the boundary effect, an orebody/stope with a 200 m × 50 m × 50 m (length × width × height) is located in the center of the model at a depth of 240 m. It consists of five groups of rock strata with different heights. There are 1,152,000 elements and 1,188,915 nodes for the numerical model, and the size of elements is about 5 m × 5 m × 5 m. The lateral and bottom boundaries of the model were fixed on the corresponding normal directions, and the top of the model was a free boundary. Mohr–Coulomb criterion was used for the rock strata, and the mechanical properties and thickness of the rock strata are listed in Table 3. They were assigned following the work of Cheng and Qiao [35].
The modeling procedure is as follows: the states of original rock stress in the model were first analyzed, and the initial displacement was cleared; then, the ore body was excavated, running 20 time steps. Afterwards, the mined-out area was filled with granular backfill, and the proposed constitutive model was applied for granular backfill. The values of the bulk modulus and shear modulus of the backfill were updated iteratively according to the volumetric strain of the granular backfill until the model reached equilibrium. For comparison, the double-yield model was also used for granular backfill to analyze surface subsidence.
Figure 9 shows the comparison of the surface subsidence and horizontal movement between the proposed model and double-yield model for granular backfill with particle sizes of 4.75–9.5 mm and 31.5–37.5 mm. The values of surface subsidence and horizontal movement obtained by the proposed model for granular material were greater than those obtained by the double-yield model after the mined-out stope was filled with granular backfill with particle sizes of 4.75–9.5 mm and 31.5–37.5 mm. This occurred because the constant deformation modulus of the granular backfill in the whole compaction process was assigned in the double-yield model and it cannot capture the large deformation of granular backfill in the initial compression stage [5]. However, the proposed model with variable deformation modulus overcomes this disadvantage and has the capability of describing the real physical characteristics of the granular material under compaction. Therefore, the results obtained by the proposed model for granular material should be more realistic.

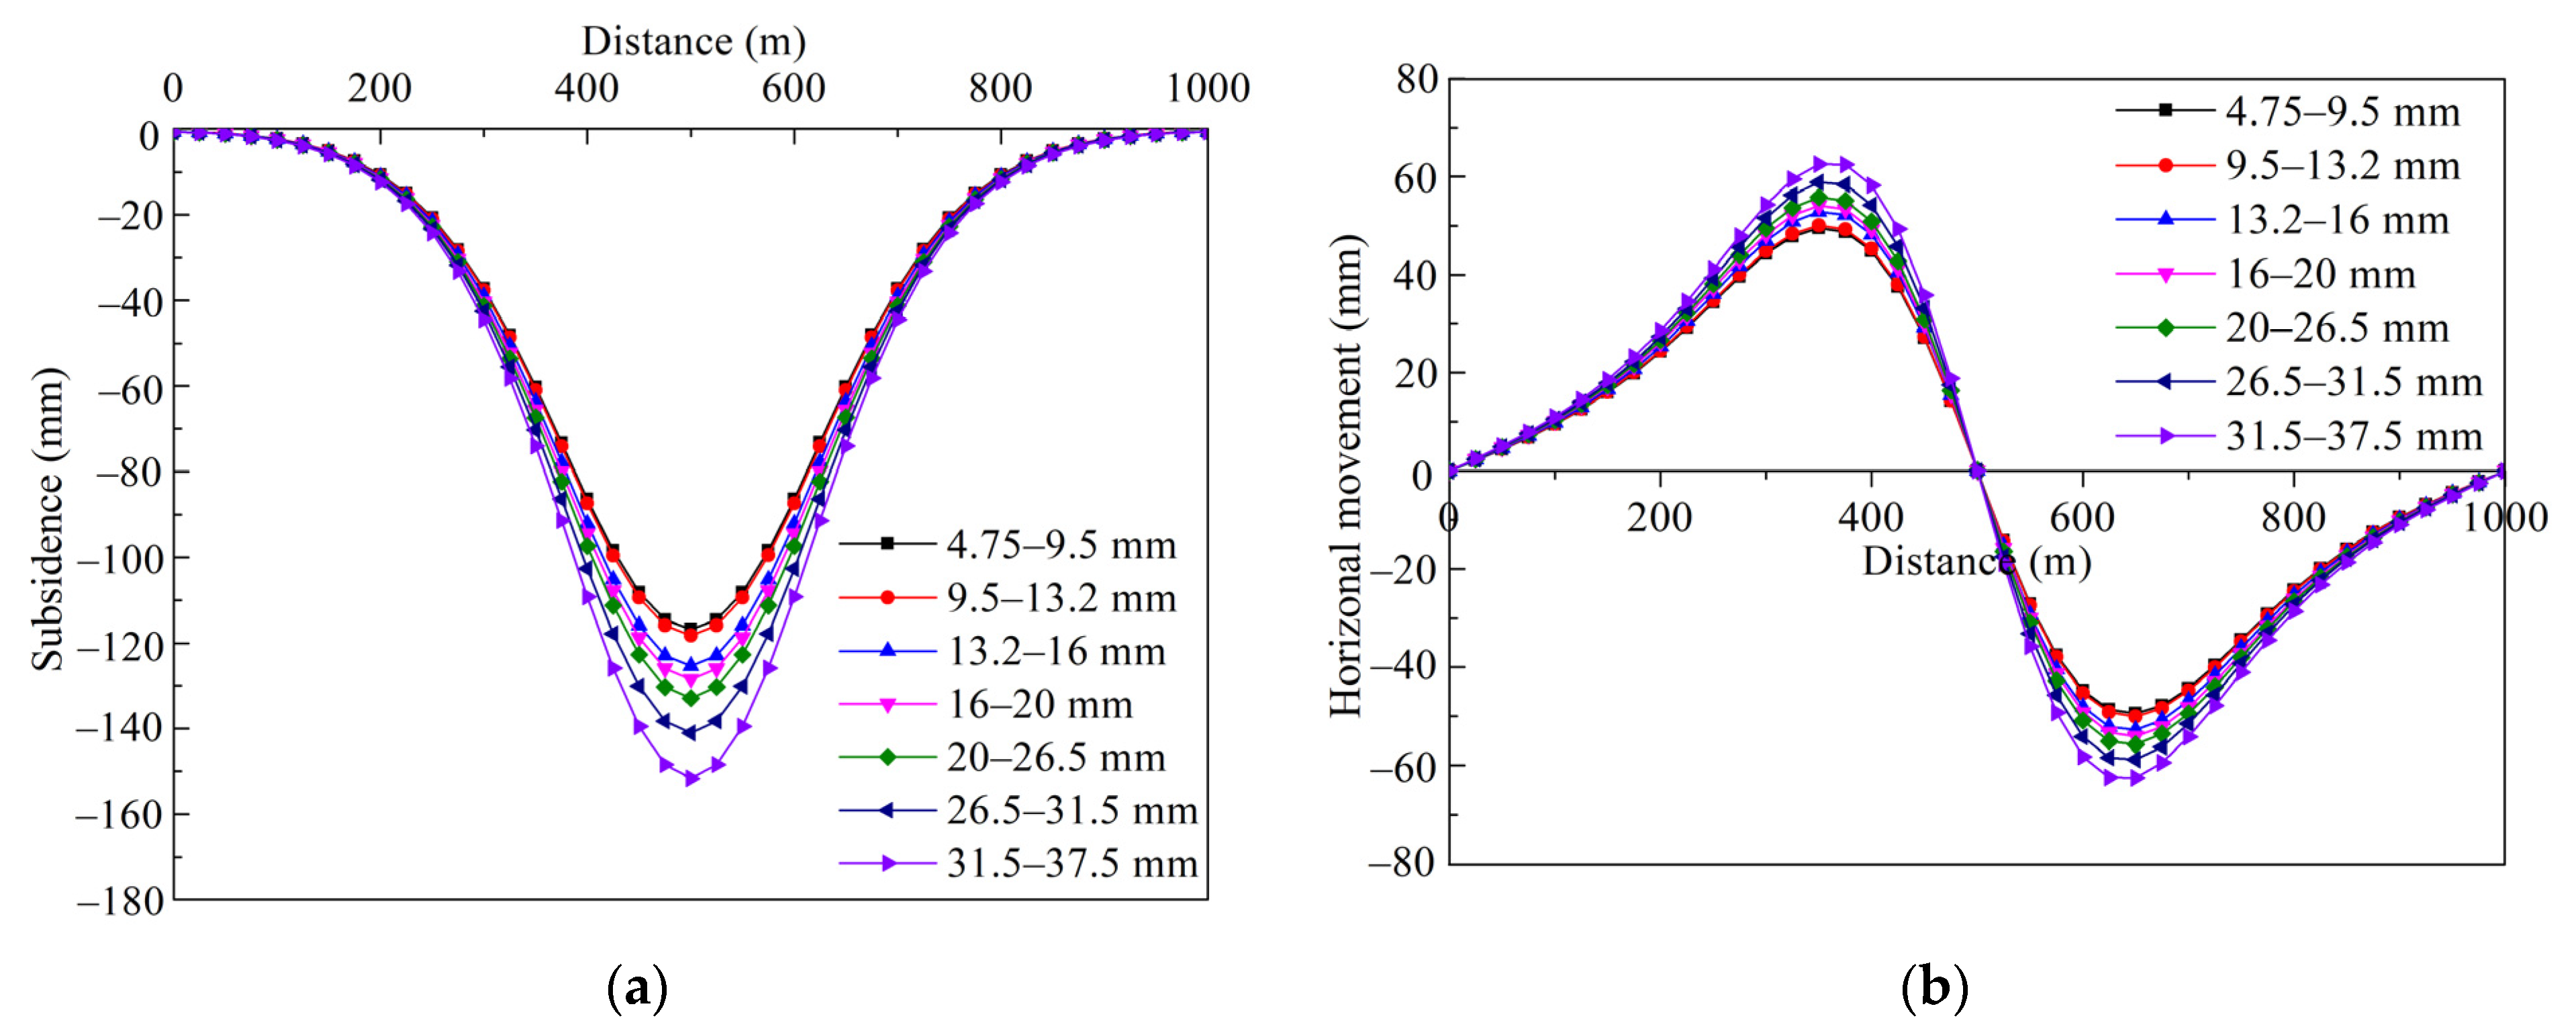
4.2. Effect of Particle Size of the Granular Backfill on Surface Subsidence and Movement

Excavation causes tensile stress concentration in the surrounding rock of the stope (Figure 10a). After backfilling, the stress field changed slightly and most of the tensile zones disappeared (Figure 10b). Figure 11 presents the subsidence of overlying strata in the cases that the mined-out stope was unfilled and filled with pebbles of 4.75–9.5 mm. The subsidence values at the levels of 80 m (stope roof), 150 m, 210 m, 260 m, 300 m, and 320 m (surface) in the model (Figure 8) were monitored. It was found that the subsidence of the rock strata was distributed uniformly from the stope roof to the surface, and backfilling played an important role in restraining the subsidence of the overlying strata and surface.
The curves of surface subsidence and horizontal movement were depicted after the mined-out stope was filled with the granular backfill with various particle sizes, as shown in Figure 12. As the particle size of the granular backfill increased, the values of surface subsidence and horizontal movement increased, which corresponds to the experimental result that the larger the particle size, the weaker the resistance to deformation (Figure 3).
The indicators reflecting the characteristics of surface subsidence and movement include inclination, curvature, and horizontal deformation. Based on the values of surface subsidence and horizontal movement (Figure 12), they can be obtained from Equations (2)–(4), respectively [36].
Surface inclination deformation:
i n ~ n 1 = W n W n 1 L n ~ n 1 ,
where i n ~ n 1 is the surface inclined deformation between points n and n 1 ; W n and W n 1 are the surface subsidence of points n and n 1 , respectively; L n ~ n 1 is the horizontal distance between points n and n 1 .
Surface curvature deformation:
K n + 1 ~ n ~ n 1 = i n + 1 ~ n i n ~ n 1 L n + 1 ~ n + L n ~ n 1 2 ,
where K n + 1 ~ n ~ n 1 is the surface curvature deformation between points n , n 1 and n + 1 .
Surface horizontal deformation:
ε n = U n U n 1 L n ~ n 1 ,
where ε n is the surface horizontal deformation between points n and n 1 ; U n and U n 1 are the surface horizontal movement of points n and n 1 , respectively.
Consequently, the surface inclination, curvature, and horizontal deformation in the cases that the mined-out stope was filled with seven gradations of granular backfill were calculated, and the corresponding curves are shown in Figure 13. The values of surface inclination, curvature, and horizontal deformation also increased with increasing particle size of the granular backfill. This was determined by the compressive performance of the granular backfill with various particle sizes under the loads imposed by the overlying strata.
In the numerical calculation, the value of the deformation modulus of the granular backfill is in a continuous iteration state and varies with Equation (1). The deformation modulus has an important influence on surface subsidence, especially for deeper workings. Figure 14 presents the correlation between the maximal surface subsidence and final deformation modulus of the granular backfill with seven gradations. It can be concluded that the surface subsidence decreases with increasing deformation modulus, and this can be described by linear equations; the correlation coefficient was 0.8885.

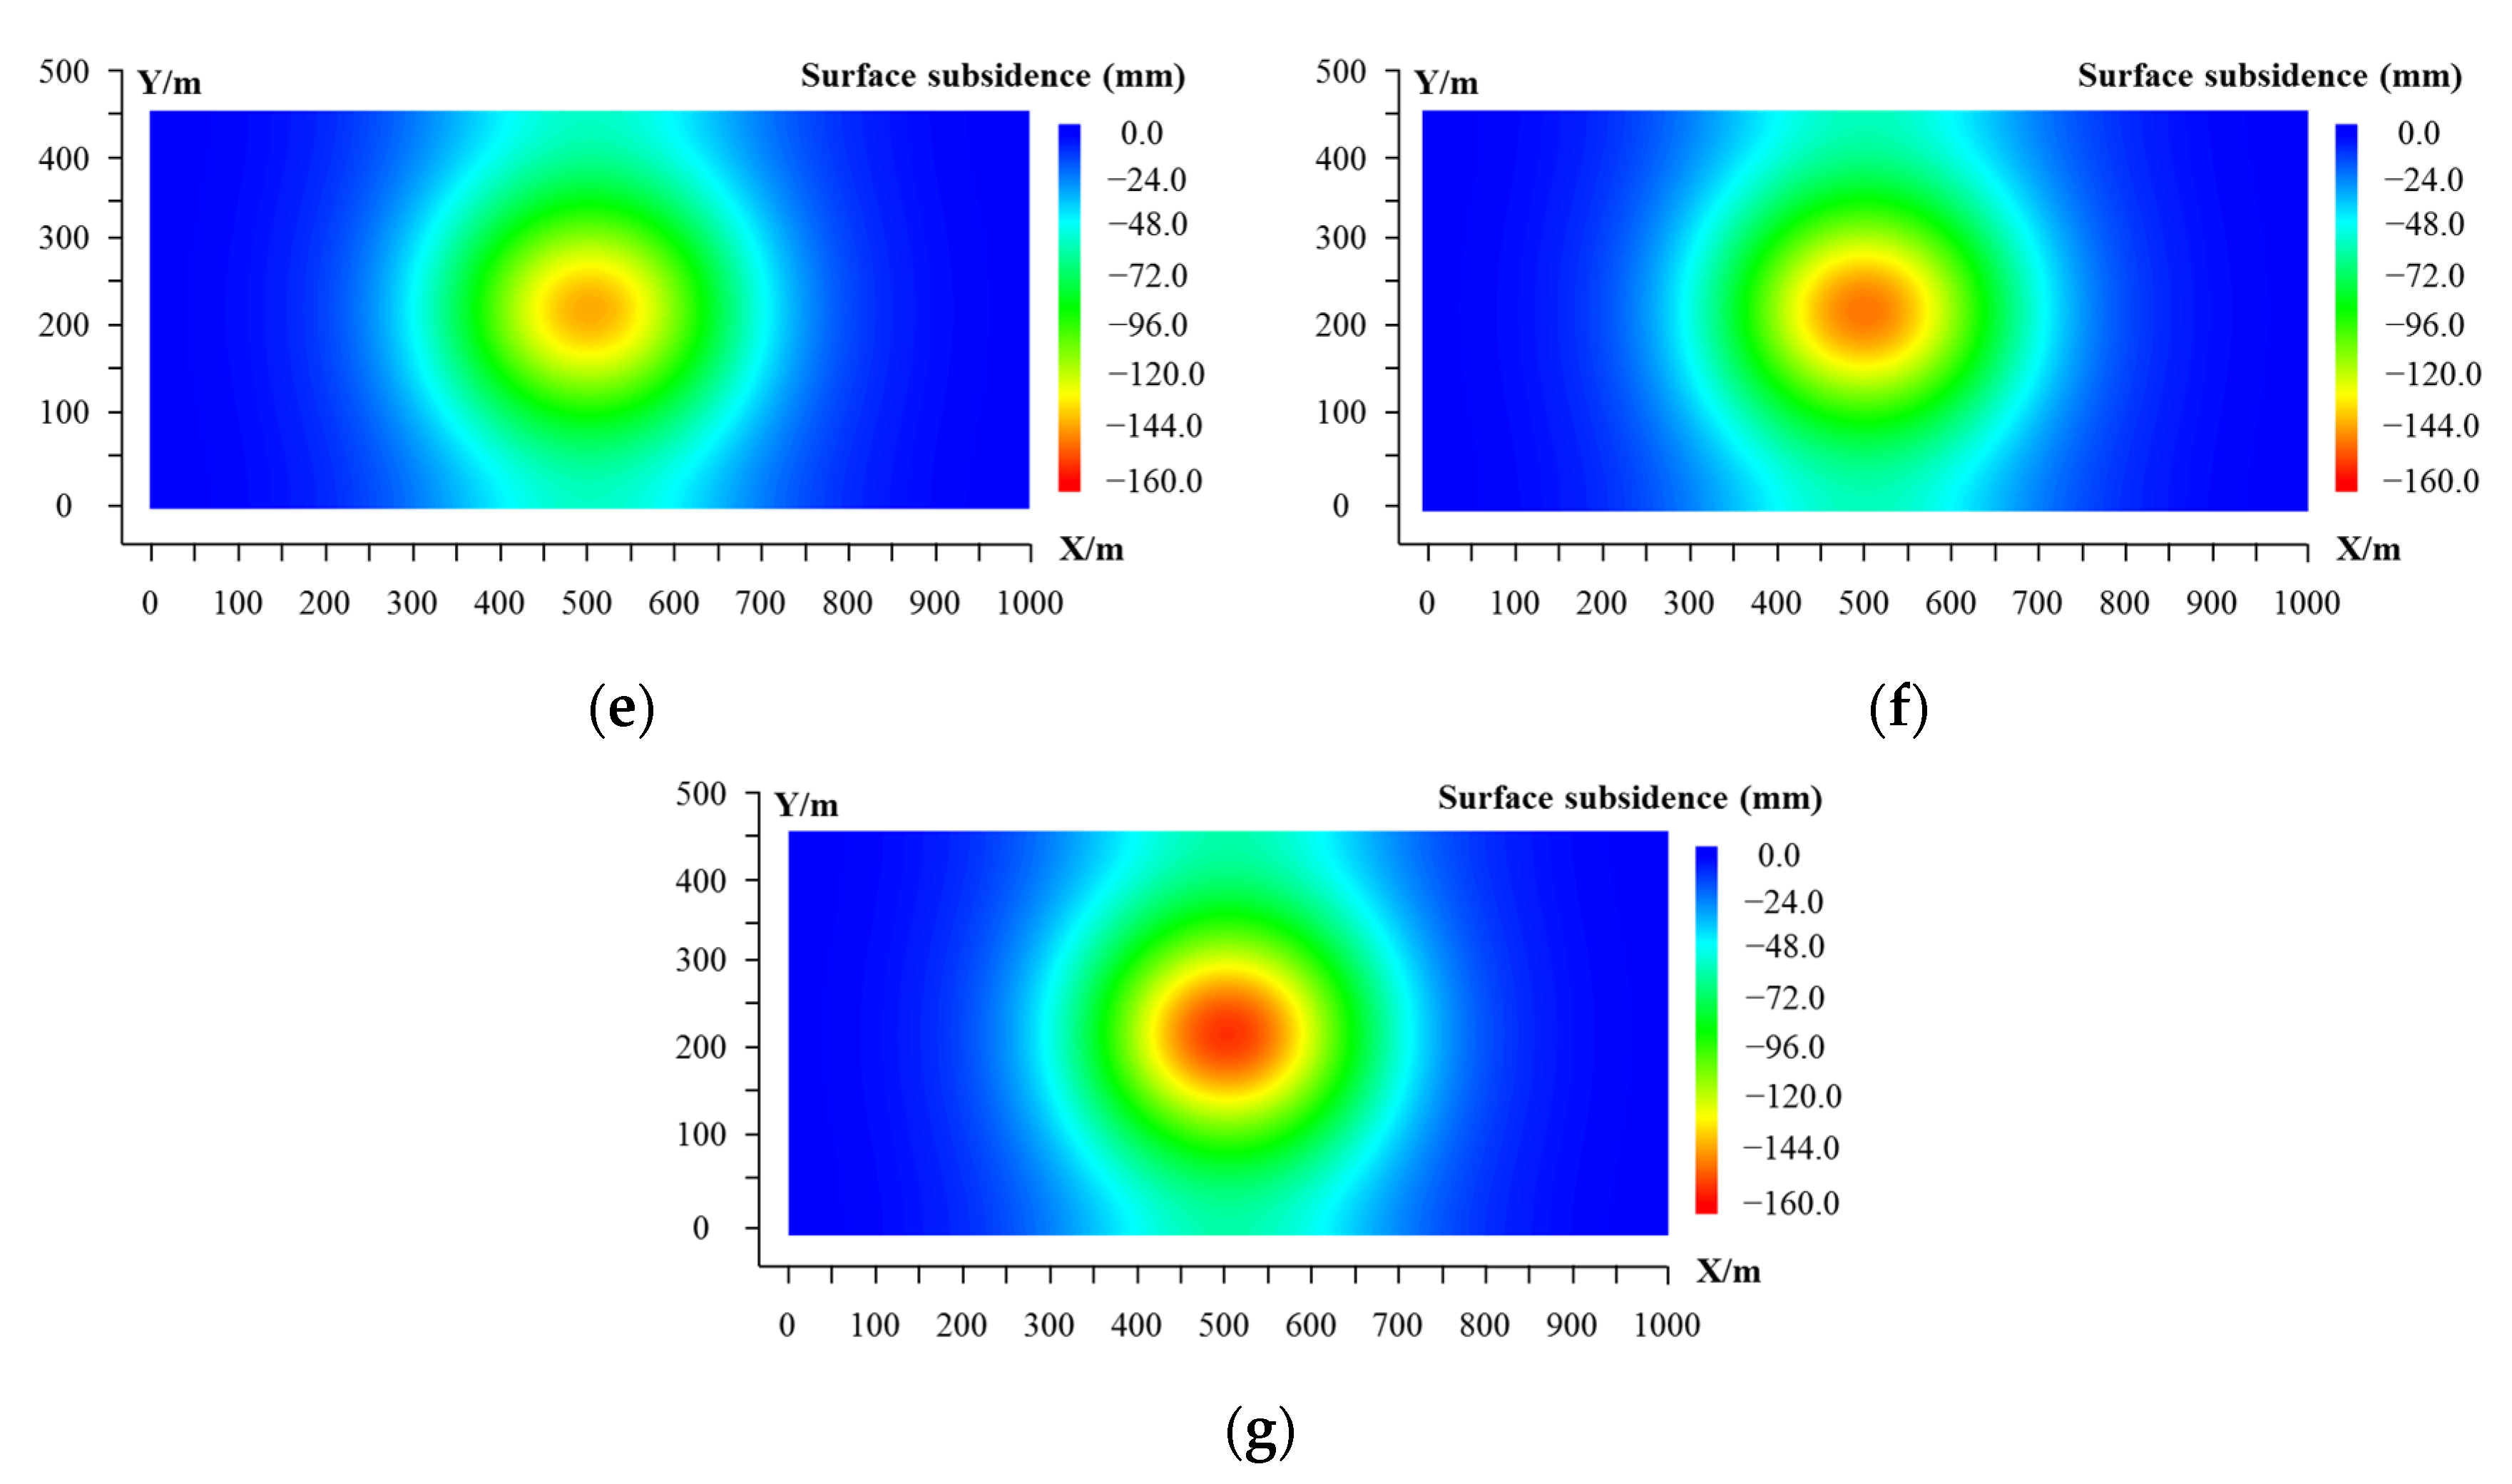
4.3. Effect of the Particle Size of the Granular Backfill on the Surface Subsidence Basin

In the mining operation, the surface subsidence basin has an important influence on the layout and stability of surface buildings. The surface subsidence basin was analyzed to determine the accurate influence range of surface subsidence after the mined-out stope was filled with granular backfill. Figure 15 shows the distribution of the surface subsidence for the granular backfill with various particle sizes. The influence area with various particle sizes was almost identical in the plane with a size of 1000 m × 450 m, while the extreme value of the surface subsidence basin increased with increasing particle size. Based on the criteria of the surface inclination, curvature, and horizontal deformation of surface buildings as shown in Table 4 [37], the maximum surface inclination, curvature, and horizontal deformation were less than the destruction extrema of damage level I of surface buildings. Therefore, the stability of surface buildings was not affected by filling mining in this case.

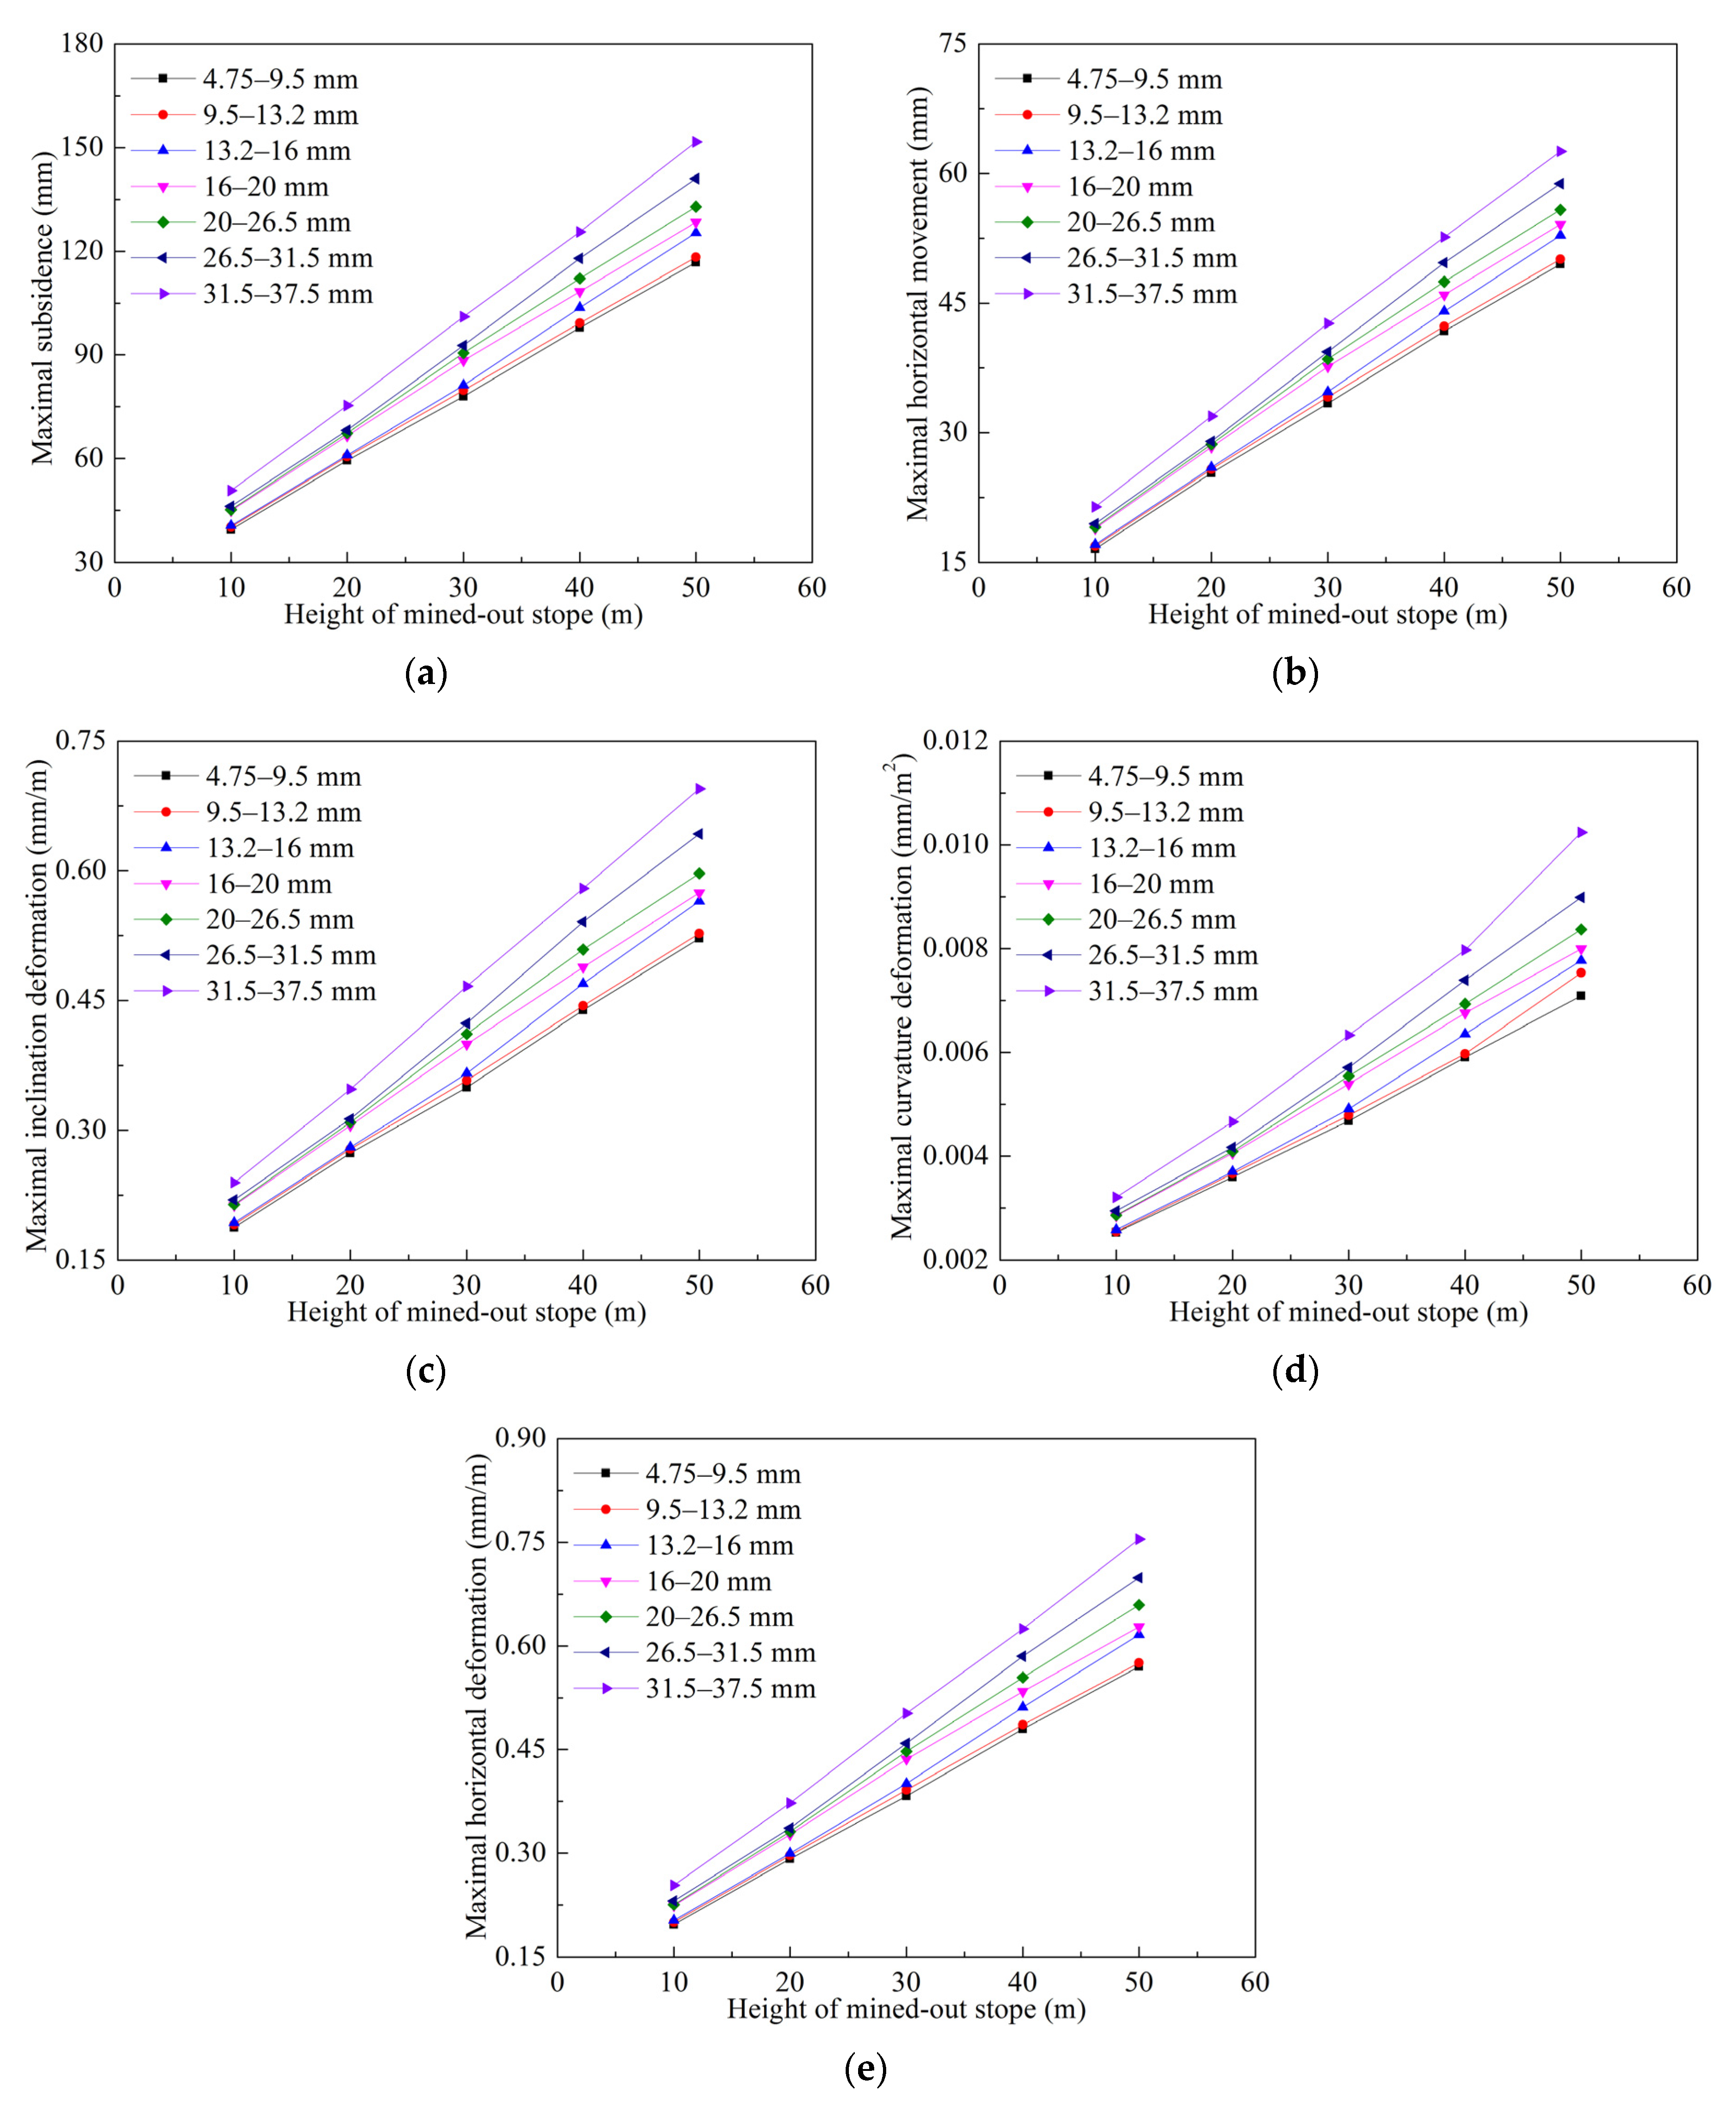
4.4. Effect of the Height of the Mined-Out Stope on Surface Subsidence and Movement

In this section, the effect of the height of mined-out stope on surface subsidence and movement in the backfilling case is discussed using the proposed model. Based on the numerical model in Figure 8, the heights of the stope were set to be 40 m, 30 m, 20 m, and 10 m. The baseline for the heights was the stope roof, i.e., the buried depth of the stope being 240 m.
Figure 16 presents the maximal value of surface subsidence and movement in the backfilling cases with different particle sizes. With increasing height of the stope, the range of the fracture zone, crack zone, and bending zone of overlying strata increased, and the maximal values of the surface subsidence, horizontal movement, inclination, curvature, and horizontal deformation also increased. For the optimum gradation with 4.75–9.5 mm, as the height of the stope increased from 10 m to 50 m, the maximal inclination (Figure 16c), curvature (Figure 16d), and horizontal deformation (Figure 16e) increased by 177.9%, 180.2%, and 189.4%, respectively. For the case of the stope height of 50 m, as the particle size of the backfill increased from 4.75–9.5 mm to 31.5–37.5 mm, the maximal inclination, curvature, and horizontal deformation increased by 33.2%, 44.4%, and 39.3%, respectively, and the effect of the particle size of the granular backfill on surface subsidence increased with an increase in the stope height.

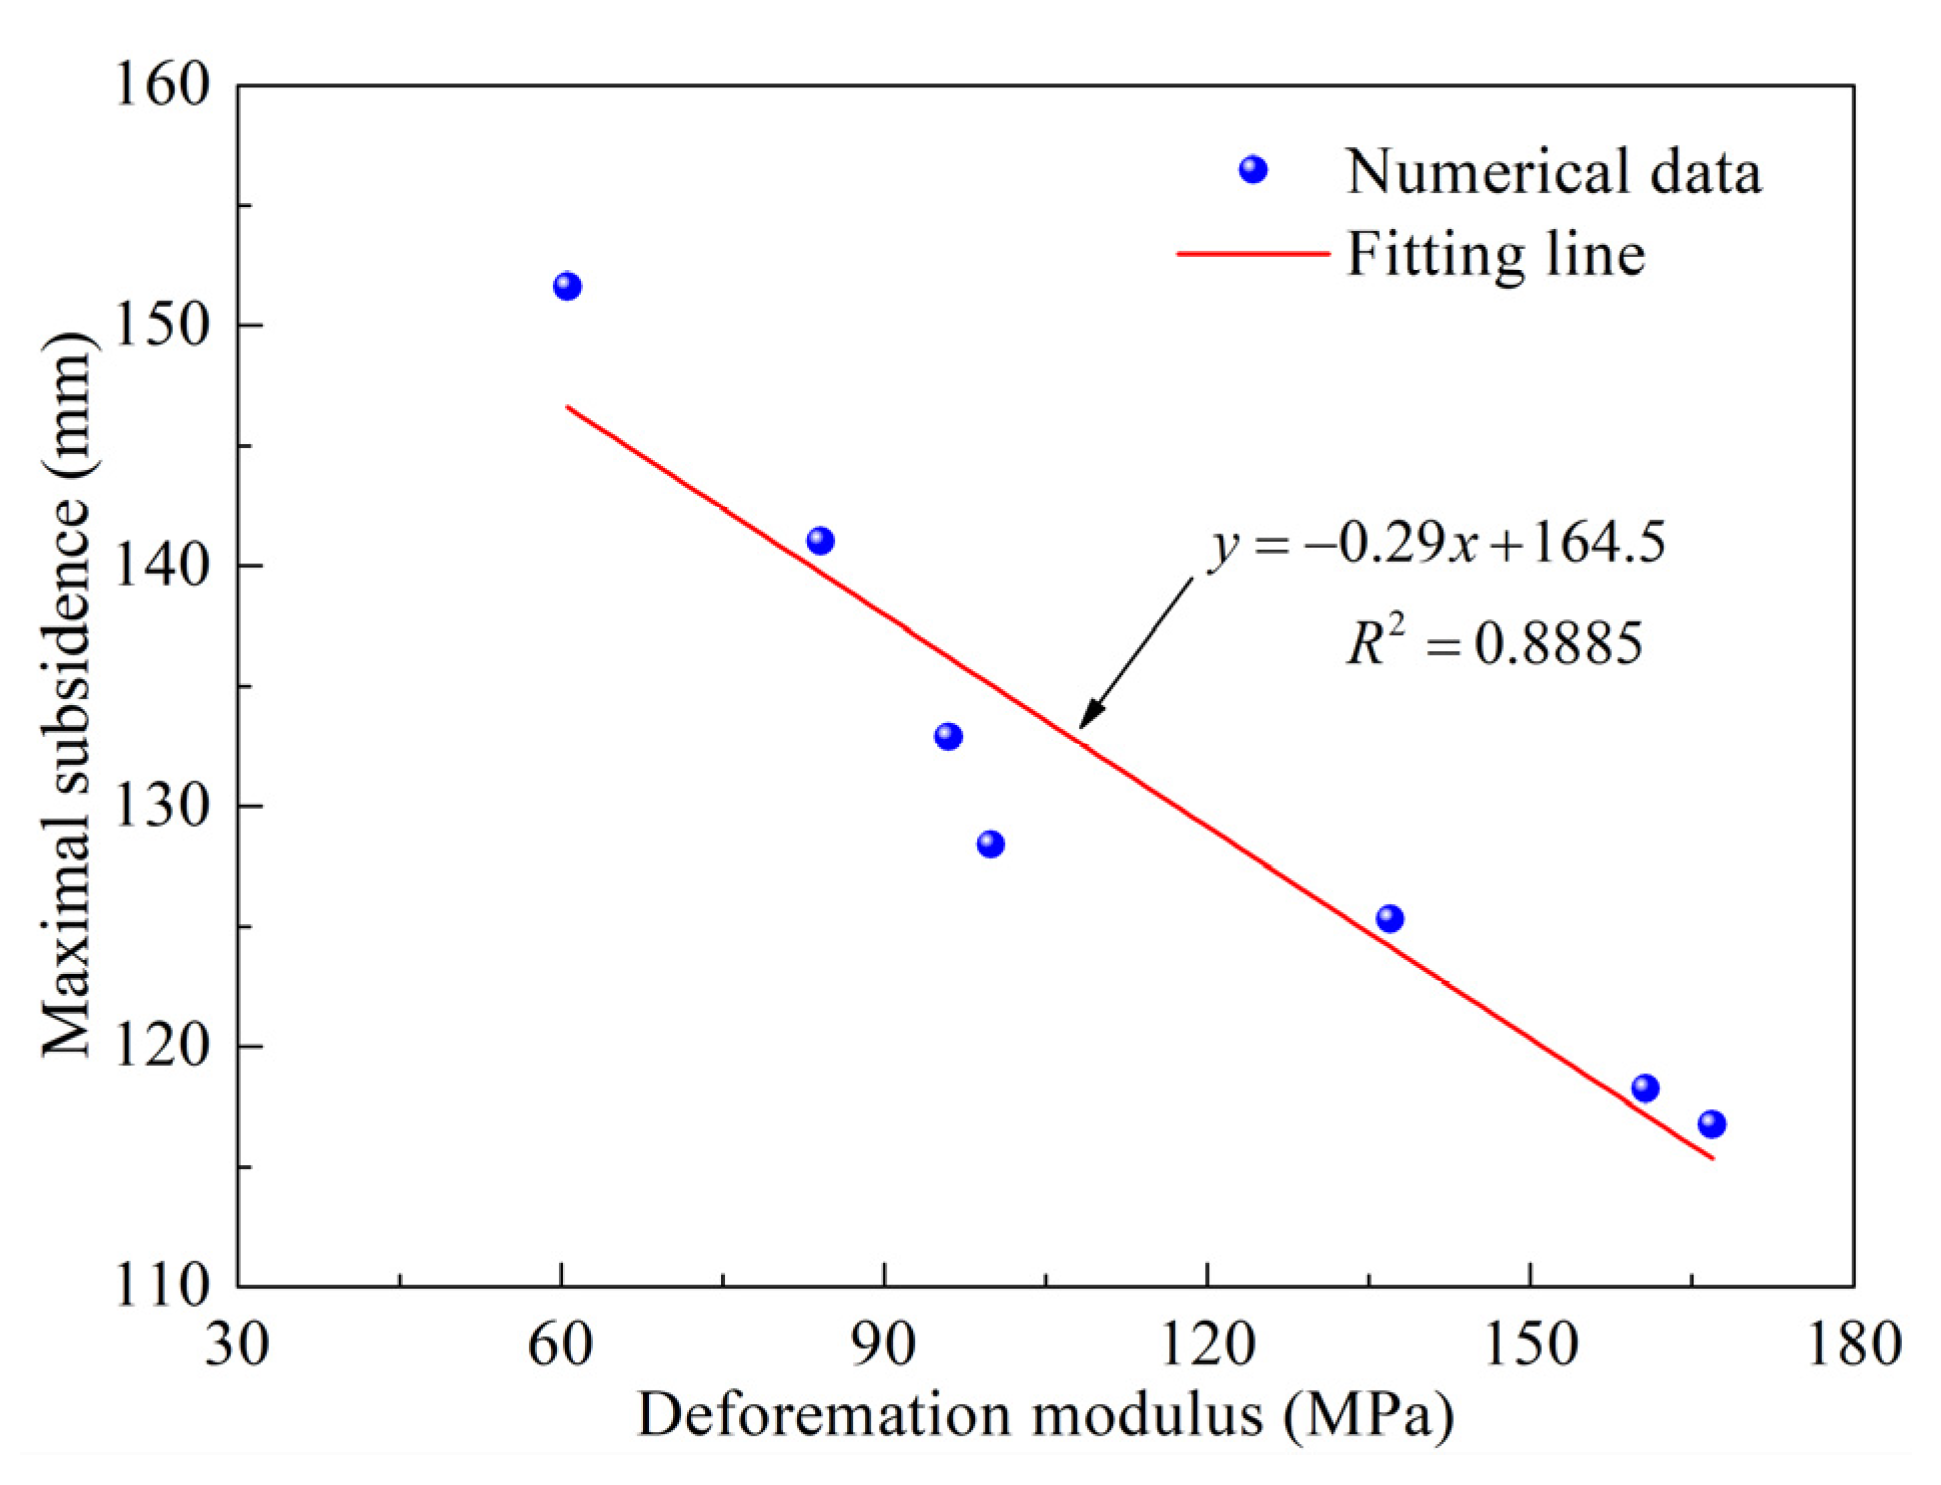
4.5. Effect of the Depth of the Mined-Out Stope on Surface Subsidence and Movement

Based on the numerical model in Figure 8, the depth of the stope was set to be 270 m, 300 m, 330 m, and 360 m. The effect of the depth of the mined-out stope on surface subsidence and movement in the backfilling case was discussed using the proposed model. The simulation results for the cases with various grades of granular backfill are shown in Figure 17. Consequently, the maximal values of surface subsidence, horizontal movement, inclination, curvature, and horizontal deformation decreased with increases in the depth of the stope. For the optimum gradation with 4.75–9.5 mm, as the depth of the stope increased from 240 m to 360 m, the maximal inclination (Figure 17c), curvature (Figure 17d), and horizontal deformation (Figure 17e) decreased by 41.0%, 52.2%, and 37.7%, respectively. For the stope depth of 360 m, as the particle size of the backfill decreased from 31.5–37.5 mm to 4.75–9.5 mm, the maximal inclination, curvature, and horizontal deformation decreased by 17.0%, 17.1%, and 18.1%, respectively, and the effect of the particle size of the granular backfill on surface subsidence was reduced by increasing the buried depth of the stope.
Admittedly, the above application is an ideal case, similar to coal mines with horizontal seams. Therefore, the analysis for surface subsidence may not be difficult. However, metal mines are often designed by multiple level mining, and the underground workings are complex. For example, a metal mine with a thick and steep orebody is designed by cut-and-fill mining. In this case, the proposed model that can capture the actual bearing process of the granular backfill may provide reliable results for the analysis for surface subsidence. The proposed model is likely to be applied widely for metal mines.

5. Conclusions

In this study, the bearing characteristics of pebbles with various gradations were investigated by a self-designed experimental apparatus. A constitutive model with variable deformation modulus was proposed for granular material and implemented into FLAC3D software based on the experimental data. The proposed model was preliminarily applied to analyze the surface subsidence in backfilling mines. The influential factors of the surface subsidence and movement were discussed. The following conclusions can be drawn:
  • The change in the deformation modulus is the main feature of granular backfill during the compaction process. The deformation modulus of the granular backfill firstly increases with compaction, then decreases along with some large or sharp particles being fragmented due to contact stress concentration between them, and again increases along with the adequately composed backfill being compacted again.
  • The proposed constitutive model with variable deformation modulus can capture the physical characteristics of the granular material during the compaction process. It was implemented into the FLAC3D software, which effectively explores the surface subsidence in backfilling mines.
  • The effect of the particle size of the granular backfill, stope height, and stope buried depth on surface subsidence was revealed using the proposed model for backfilling mines. The effect of the particle size of the granular backfill on surface subsidence can be enlarged by increasing the stope height and can be reduced by increasing the buried depth of the stope. This study provides references for the design of granular backfilling mines.

Author Contributions

Funding acquisition, Q.-L.Y.; Methodology, Q.-L.Y. and Z.-H.L.; Formal analysis, Z.-H.L.; Software, Z.-H.L. and J.-Y.P.; Writing—original draft preparation, Z.-H.L.; Investigation, Z.-H.L., J.-Y.P., Y.-S.C., K.L.; Writing—review and editing, Q.-L.Y. and J.-Y.P. All authors have read and agreed to the published version of the manuscript.

Funding

This research was funded by the Joint Funds of the National Natural Science Foundation of China (Grant No. U21A20106) and the Fundamental Research Funds for the Central Universities (Grant No. N2101036 and No. N2101045). The APC was funded by the National Science Foundation of China (Grant No. 52074060).

Institutional Review Board Statement

Not applicable.

Informed Consent Statement

Not applicable.

Data Availability Statement

All data and models of this study are available from the corresponding author upon reasonable request.

Conflicts of Interest

The authors declare no conflict of interest.

References

  1. Li, X.; Wang, S.J.; Liu, T.Y.; Ma, F.S. Engineering geology, ground surface movement and fissures induced by underground mining in the Jinchuan Nickel Mine. Eng. Geol. 2004, 76, 93–107. [Google Scholar] [CrossRef]
  2. Ma, F.S.; Zhao, H.J.; Yuan, R.M.; Guo, J. Ground movement resulting from underground backfill mining in a nickel mine (Gansu Province, China). Nat. Hazards 2015, 77, 1475–1490. [Google Scholar] [CrossRef]
  3. El-Sohby, M.A.; Andrawes, K.Z. Deformation characteristics of granular materials under hydrostatic compression. Can. Geotech. J. 1972, 9, 338–350. [Google Scholar] [CrossRef]
  4. Su, C.D.; Gu, M.; Tang, X.; Guo, W.B. Experiment study of compaction characteristics of crushed stones from coal seam roof. Chin. J. Rock Mech. Eng. 2012, 31, 18–26. (In Chinese) [Google Scholar]
  5. Liu, A.; Liu, S.M.; Wang, G.; Elsworth, D. Continuous compaction and permeability evolution in longwall gob materials. Rock Mech. Rock Eng. 2020, 53, 5489–5510. [Google Scholar] [CrossRef]
  6. Eslami, A.; Ahmadnezhad, M.; Amaneh, E.K.; Rezazadeh, S. Experimental study on stiffness properties of non-engineered clay and granular fills. Arab. J. Geosci. 2014, 8, 3065–3075. [Google Scholar] [CrossRef]
  7. Zhang, B.Y.; Chen, T.; Peng, C.; Qian, X.X.; Jie, Y.X. Experimental study on loading-creep coupling effect in rockfill material. Int. J. Geomech. 2017, 17, 04017059. [Google Scholar] [CrossRef]
  8. Li, M.; Zhang, J.X.; Wu, Z.Y.; Liu, Y.; Li, A.L. An experimental study of the influence of lithology on compaction behaviour of broken waste rock in coal mine backfill. R. Soc. Open Sci. 2019, 6, 182205. [Google Scholar] [CrossRef] [PubMed] [Green Version]
  9. Zhou, N.; Han, X.L.; Zhang, J.X.; Li, M. Compressive deformation and energy dissipation of crushed coal gangue. Powder Technol. 2016, 297, 220–228. [Google Scholar] [CrossRef]
  10. Meng, G.H.; Zhang, J.X.; Li, M.; Zhu, C.L.; Zhang, Q. Prediction of compression and deformation behaviours of gangue backfill materials under multi-factor coupling effects for strata control and pollution reduction. Environ. Sci. Pollut. Res. Int. 2020, 27, 36528–36540. [Google Scholar] [CrossRef]
  11. Aminzadeh, A.; Hosseininia, E.S. A study on the effect of particle shape and fragmentation on the mechanical behavior of granular materials using discrete element method. Powders Grains 2013, 1542, 915–918. [Google Scholar]
  12. Peng, H.H.; Lin, C.K.; Chung, Y.C. Effects of particle stiffness on mechanical response of granular solid under confined compression. Procedia Eng. 2014, 79, 143–152. [Google Scholar] [CrossRef] [Green Version]
  13. Zhang, J.X.; Li, M.; Liu, Z.; Zhou, N. Fractal characteristics of crushed particles of coal gangue under compaction. Powder Technol. 2017, 305, 12–18. [Google Scholar] [CrossRef]
  14. Li, M.; Li, A.L.; Zhang, J.X.; Huang, Y.L.; Li, J.M. Effects of particle sizes on compressive deformation and particle breakage of gangue used for coal mine goaf backfill. Powder Technol. 2020, 360, 493–502. [Google Scholar] [CrossRef]
  15. Kiran, K.V.; Madhav, M.R.; Wissmann, K.J. Method for estimation of deformation modulus of granular pile from settlements at different depths. In Proceedings of the Sixth Indian Young Geotechnical Engineers Conference, NIT, Trichy, India, 10–11 March 2017; pp. 1–7. [Google Scholar]
  16. Sharma, J.K.; Gupta, P. Analysis and settlement evaluation of an end-bearing granular pile with non-linear deformation modulus. Studia Geotech. Et Mech. 2018, 40, 188–201. [Google Scholar] [CrossRef] [Green Version]
  17. Gui, Y.; Tao, H.; Zhu, P.N.; Yang, H.H.; Deng, T.F. Contrastive studies of the testing method for the bearing capacity and deformation modulus of dynamic consolidation backfill foundation. Adv. Mat. Res. 2012, 446-449, 1606–1614. [Google Scholar]
  18. Li, M.; Zhang, J.X.; Gao, R. Compression characteristics of solid wastes as backfill materials. Adv. Mater. Sci. Eng. 2016, 2016, 2496194. [Google Scholar] [CrossRef] [Green Version]
  19. Zhang, P.F.; Zhang, Y.B.; Zhao, T.B.; Tan, Y.L.; Yu, F.H. Experimental research on deformation characteristics of waste-rock material in ynderground backfill mining. Minerals 2019, 9, 102. [Google Scholar] [CrossRef] [Green Version]
  20. Yu, W.J.; Feng, T.; Chen, X.Y. Law of ground subsidence and strata movement caused by backfill mining of “under three” coal. Adv. Mater. Res. 2013, 807–809, 2304–2308. [Google Scholar] [CrossRef]
  21. Wang, H.W.; Wu, Y.P.; Liu, M.F.; Jiao, J.Q.; Luo, S.H. Roof-breaking mechanism and stress-evolution characteristics in partial backfill mining of steeply inclined seams. Geomat. Nat. Haz. Risk. 2020, 11, 2006–2035. [Google Scholar] [CrossRef]
  22. Pu, H.; Zhang, J. Research on protecting the safety of buildings by using backfill mining with solid. Procedia Environ. Sci. 2012, 12, 191–198. [Google Scholar]
  23. Li, J.; Zhang, J.X.; Huang, Y.L.; Zhang, Q.; Xu, J.M. An investigation of surface deformation after fully mechanized, solid back fill mining. Int. J. Min. Sci. Techno. 2012, 22, 453–457. [Google Scholar] [CrossRef]
  24. Yavuz, H. An estimation method for cover pressure re-establishment distance and pressure distribution in the goaf of longwall coal mines. Int. J. Rock Mech. Min. Sci. 2004, 41, 193–205. [Google Scholar] [CrossRef]
  25. Li, M.; Zhang, J.X.; Huang, Y.L.; Zhou, N. Effects of particle size of crushed gangue backfill materials on surface subsidence and its application under buildings. Environ. Earth Sci. 2017, 76, 603. [Google Scholar] [CrossRef]
  26. Zhu, X.J.; Guo, G.L.; Wang, J.; Fang, Q.; Chen, T. Analysis of strata and ground subsidence in fully mechanized solid backfilling mining: A case study of Huayuan coal mine. Min. Technol. 2016, 125, 233–241. [Google Scholar] [CrossRef]
  27. Das, S.K.; Das, A. Influence of quasi-static loading rates on crushable granular materials: A DEM analysis—ScienceDirect. Powder Technol. 2019, 344, 393–403. [Google Scholar] [CrossRef]
  28. Hu, B.N.; Guo, A.G. Testing study on coal waste back filling material compression simulation. J. China Coal Soc. 2009, 34, 1076–1080. (In Chinese) [Google Scholar]
  29. Wang, W.; Li, H.M.; Xiong, Z.Q.; Su, Y.S.; Zhang, P. Research on the influence of diameter gradation on compressive deformation characteristics of gangues. China J. Undergr. Space Eng. 2016, 12, 1553–1558. (In Chinese) [Google Scholar]
  30. Yu, B.Y.; Chen, Z.Q.; Wu, J.Y. Experimental study on compaction and fractal characteristics of saturated broken rocks with different initial gradations. J. Min. Saf. Eng. 2016, 33, 342–347. (In Chinese) [Google Scholar]
  31. Li, J.M.; Huang, Y.L.; Chen, Z.W.; Li, M.; Qiao, M.; Kizil, M. Particle-Crushing characteristics and acoustic-emission patterns of crushing gangue backfilling material under cyclic loading. Minerals 2018, 8, 244. [Google Scholar] [CrossRef] [Green Version]
  32. Sitharam, T.G.; Nimbkar, M.S. Micromechanical modelling of granular materials: Effect of particle size and gradation. Geotech. Geol. Eng. 2000, 18, 91–117. [Google Scholar] [CrossRef]
  33. Soroush, A.; Jannatiaghdam, R. Behavior of rockfill materials in triaxial compression testing. Int. J. Civ. Eng. 2012, 10, 153–161. [Google Scholar]
  34. Itasca Consulting Group, Inc. Fast Language Analysis of Continua in 3 Dimensions, Version 3.0, User Manual; Itasca Consulting Group, Inc.: Minneapolis, MN, USA, 2005. [Google Scholar]
  35. Cheng, H.Y.; Qiao, D.P. Discussion on filling mining of Longshou Mine in Jinchuan and the laws of surface subsidence. Metal Mine 2012, 11, 32–35. (In Chinese) [Google Scholar]
  36. Li, H.Z.; Guo, G.L.; Zhai, S.C. Mining scheme design for super-high water backfill strip mining under buildings: A Chinese case study. Environ. Earth Sci. 2016, 75, 1017. [Google Scholar] [CrossRef]
  37. Yao, W.H.; Song, X.M. Study on impact of mining subsidence on ground buildings. China Coal. 2013, 39, 57–59. (In Chinese) [Google Scholar]
Figure 1. Testing system.
Metals 12 00202 g001
Figure 2. Seven gradations of pebbles and 3D scan image of particles.
Metals 12 00202 g002
Figure 3. Stress–strain curves of pebbles with seven gradations.
Metals 12 00202 g003
Figure 4. Deformation modulus ( E t ) and AE energy of the pebbles in response to the axial strain: (a) 4.75–9.5 mm; (b) 16–20 mm; (c) 31.5–37.5 mm.
Metals 12 00202 g004
Figure 5. Relationship between E t and ε v . (a) 4.75–9.5 mm; (b) 16–20 mm; (c) 31.5–37.5 mm.
Metals 12 00202 g005
Figure 6. Numerical modeling procedure for granular material.
Metals 12 00202 g006
Figure 7. Comparison of the axial stress-axial strain curves obtained by experiment and simulation.
Metals 12 00202 g007
Figure 8. Numerical model in FLAC3D.
Metals 12 00202 g008
Figure 9. Comparison of the surface subsidence and horizontal movement obtained by the proposed model and the double-yield model: (a) Surface subsidence; (b) Surface horizontal movement.
Metals 12 00202 g009
Figure 10. Stress nephogram along the length: (a) Mined-out stope unfilled; (b) Mined-out stope filled with pebbles of 4.75–9.5 mm.
Metals 12 00202 g010
Figure 11. Subsidence of overlying strata: (a) Mined-out stope unfilled; (b) Mined-out stope filled with pebbles of 4.75–9.5 mm.
Metals 12 00202 g011
Figure 12. Surface subsidence and horizontal movement with different particle sizes: (a) Subsidence; (b) Horizontal movement.
Metals 12 00202 g012
Figure 13. Characteristics of surface subsidence and movement with different particle sizes: (a) Inclination deformation; (b) Curvature deformation; (c) Horizontal deformation.
Metals 12 00202 g013
Figure 14. Relationship between maximal surface subsidence and deformation modulus of the granular backfill.
Metals 12 00202 g014
Figure 15. Surface subsidence basins for the granular backfill with various particle sizes: (a) 4.75–9.5 mm, (b) 9.5–13.2 mm, (c) 13.2–16 mm, (d) 16–20 mm, (e) 20–26.5 mm, (f) 26.5–31.5 mm, (g) 31.5–37.5 mm.
Metals 12 00202 g015aMetals 12 00202 g015b
Figure 16. Maximal value of surface subsidence and movement in the backfilling cases (height of the stope) with different particle sizes: (a) Surface subsidence; (b) Horizontal movement; (c) Inclination deformation; (d) Curvature deformation; (e) Horizontal deformation.
Metals 12 00202 g016
Figure 17. Maximal value of surface subsidence and movement in the backfilling cases (depth of the stope) with different particle sizes: (a) Surface subsidence; (b) Horizontal movement; (c) Inclination deformation; (d) Curvature deformation; (e) Horizontal deformation.
Metals 12 00202 g017
Table 1. Experimental design.
Pebble Gradations (mm)Filling Heights (mm)Initial PorosityD/d
4.75–9.53170.39133.68–67.37
9.5–13.23310.39224.24–33.68
13.2–162990.39420–24.24
16–203330.416–20
20–26.53370.40412.08–16
26.5–31.53470.40610.16–12.08
31.5–37.53470.4158.53–10.16
Table 2. Values of fitting coefficients and critical volume strain of seven gradations of granular backfill.
Pebble Gradations
(mm)
Values of the Fitting Parameters and Critical Volume Strain
abcdekp m 1 m 2
4.75–9.520.497836.44191.13−1352.77107.181.0129.830.018570.05787
9.5–13.214.886861.07207.98−1790.1898.970.4833.490.022320.05896
13.2–1636.234554.79167.02−1239.9584.431.1128.450.022570.06146
16–2018.853634.87115.87−601.6566.712.7222.770.02290.06281
20–26.524.262798.12110.68−525.9369.581.4324.960.0260.06454
26.5–31.532.561796.91102.38−612.3255.691.3123.930.028980.06589
31.5–37.523.241232.0962.64−59.9545.253.8618.390.030490.06745
Table 3. Properties of materials in the ideal numerical model.
LithologyBulk Modulus
(GPa)
Shear Modulus
(GPa)
Tensile Strength
(MPa)
Cohesion
(MPa)
Internal Friction
angle (°)
Thickness
(m)
Topsoil0.080.020.00030.0072020
Peridotite0.250.120.0380.1023890
Slate0.550.370.0430.1123260
Migmatite0.660.390.0520.13149120
Marble0.810.410.0910.2825530
Granular backfillIteratingIterating0018-
Table 4. Damage levels of surface buildings [37].
Damage LevelsInclination Deformation
(mm/m)
Curvature Deformation
(mm/m2)
Horizontal Deformation
(mm/m)
Damage Classification
I≤3.0≤0.2≤2.0Very slight damage
II≤6.0≤0.4≤4.0Slight damage
III≤10.0≤0.6≤6.0Moderate damage
IV>10.0>0.6>6.0Heavy damage
Publisher’s Note: MDPI stays neutral with regard to jurisdictional claims in published maps and institutional affiliations.

