
Study of Comminution Kinetics in an Electrofragmentation Lab-Scale Device


 and
and
Abstract
:1. Introduction
2. Experimental
2.1. Materials
2.2. Methods
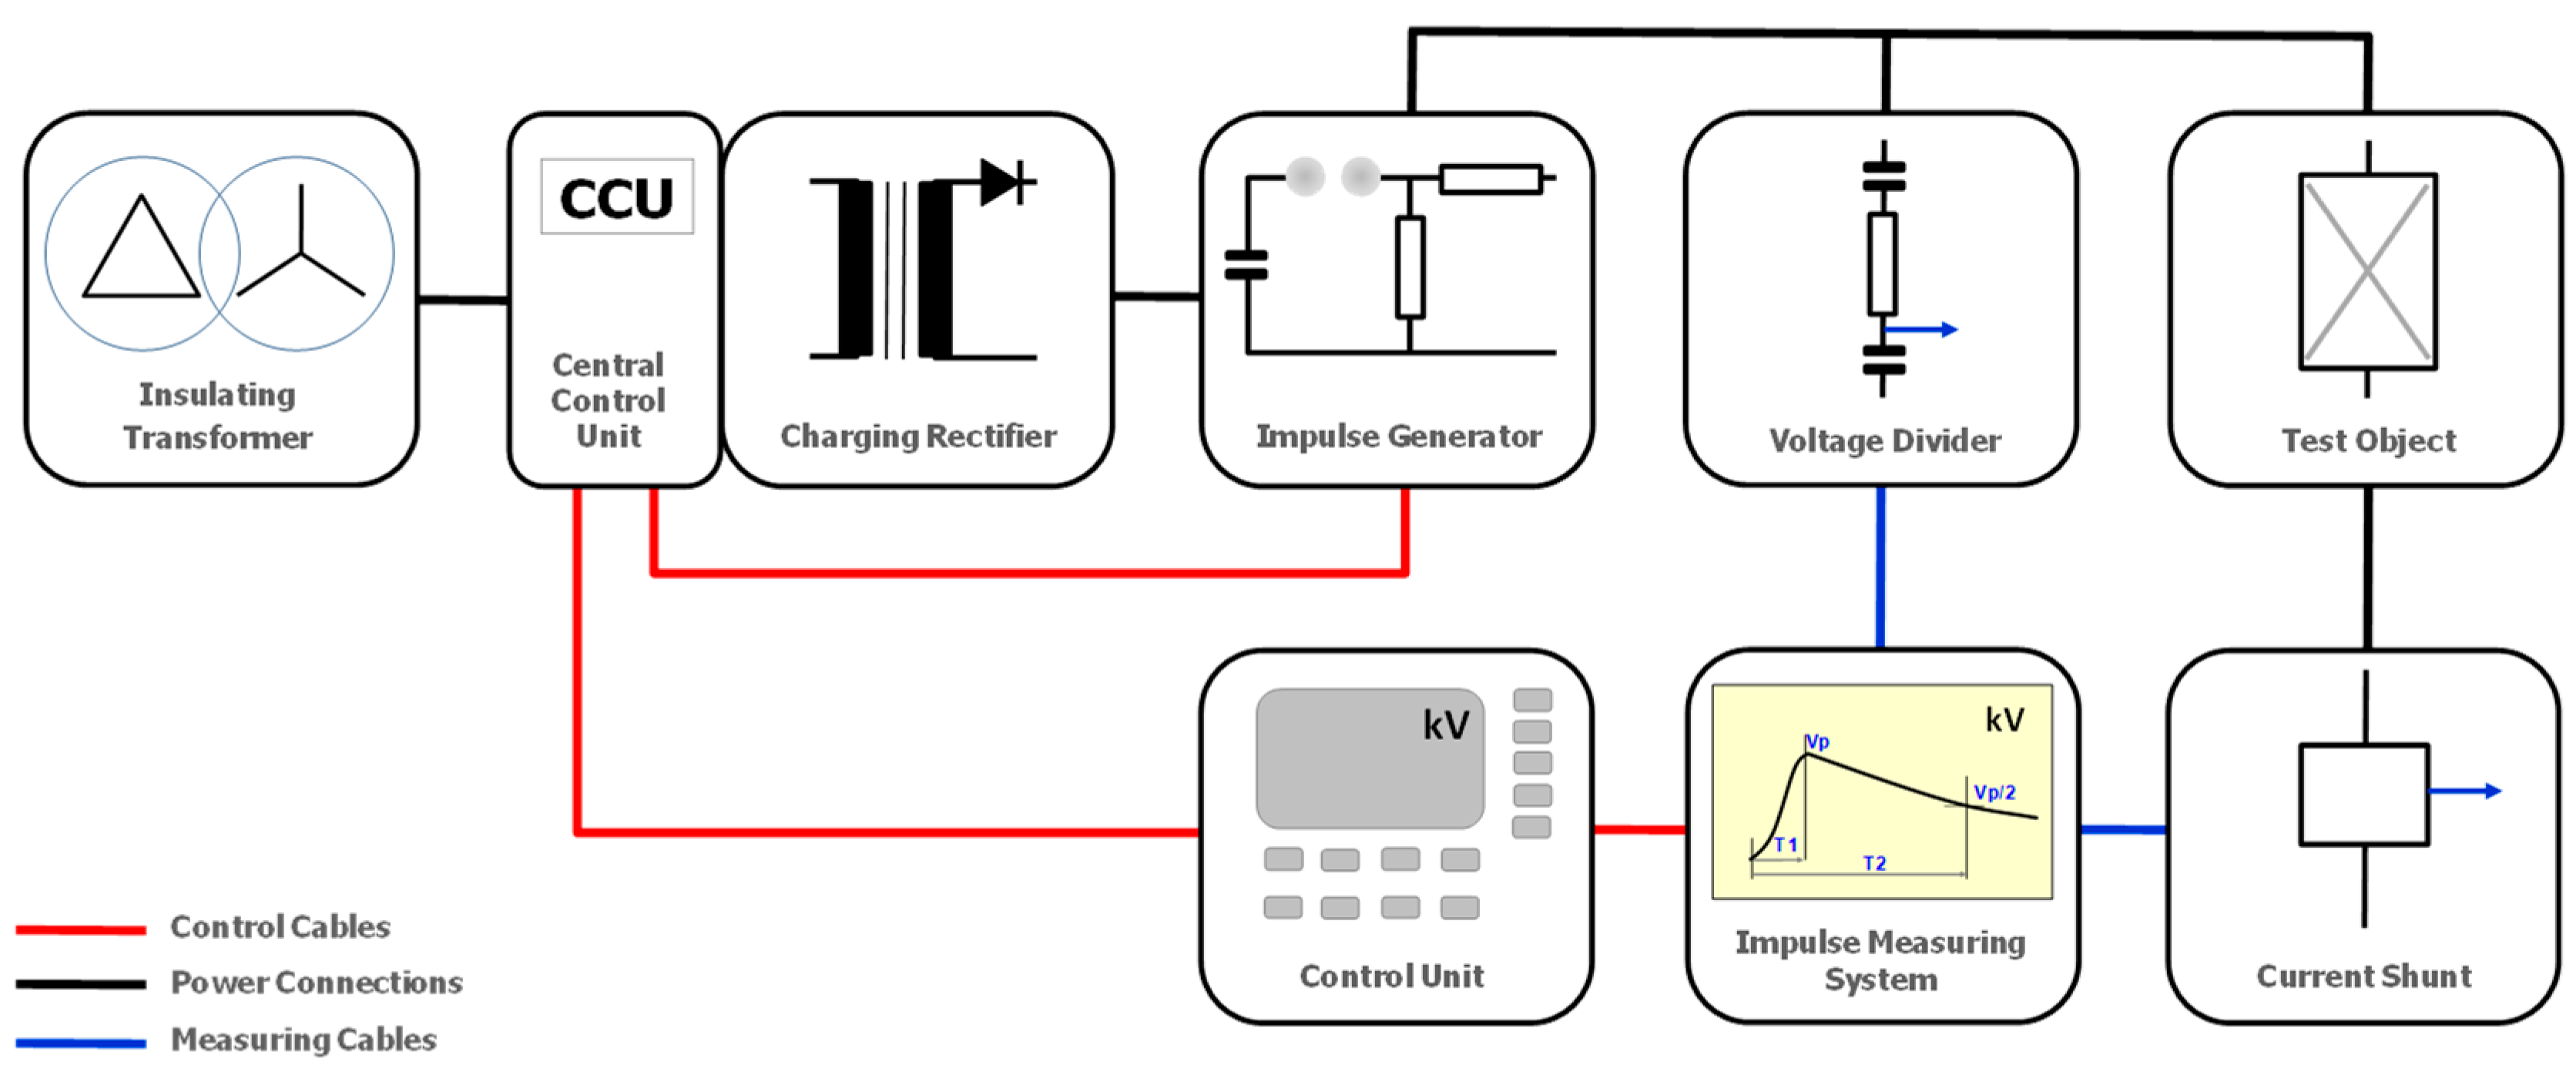
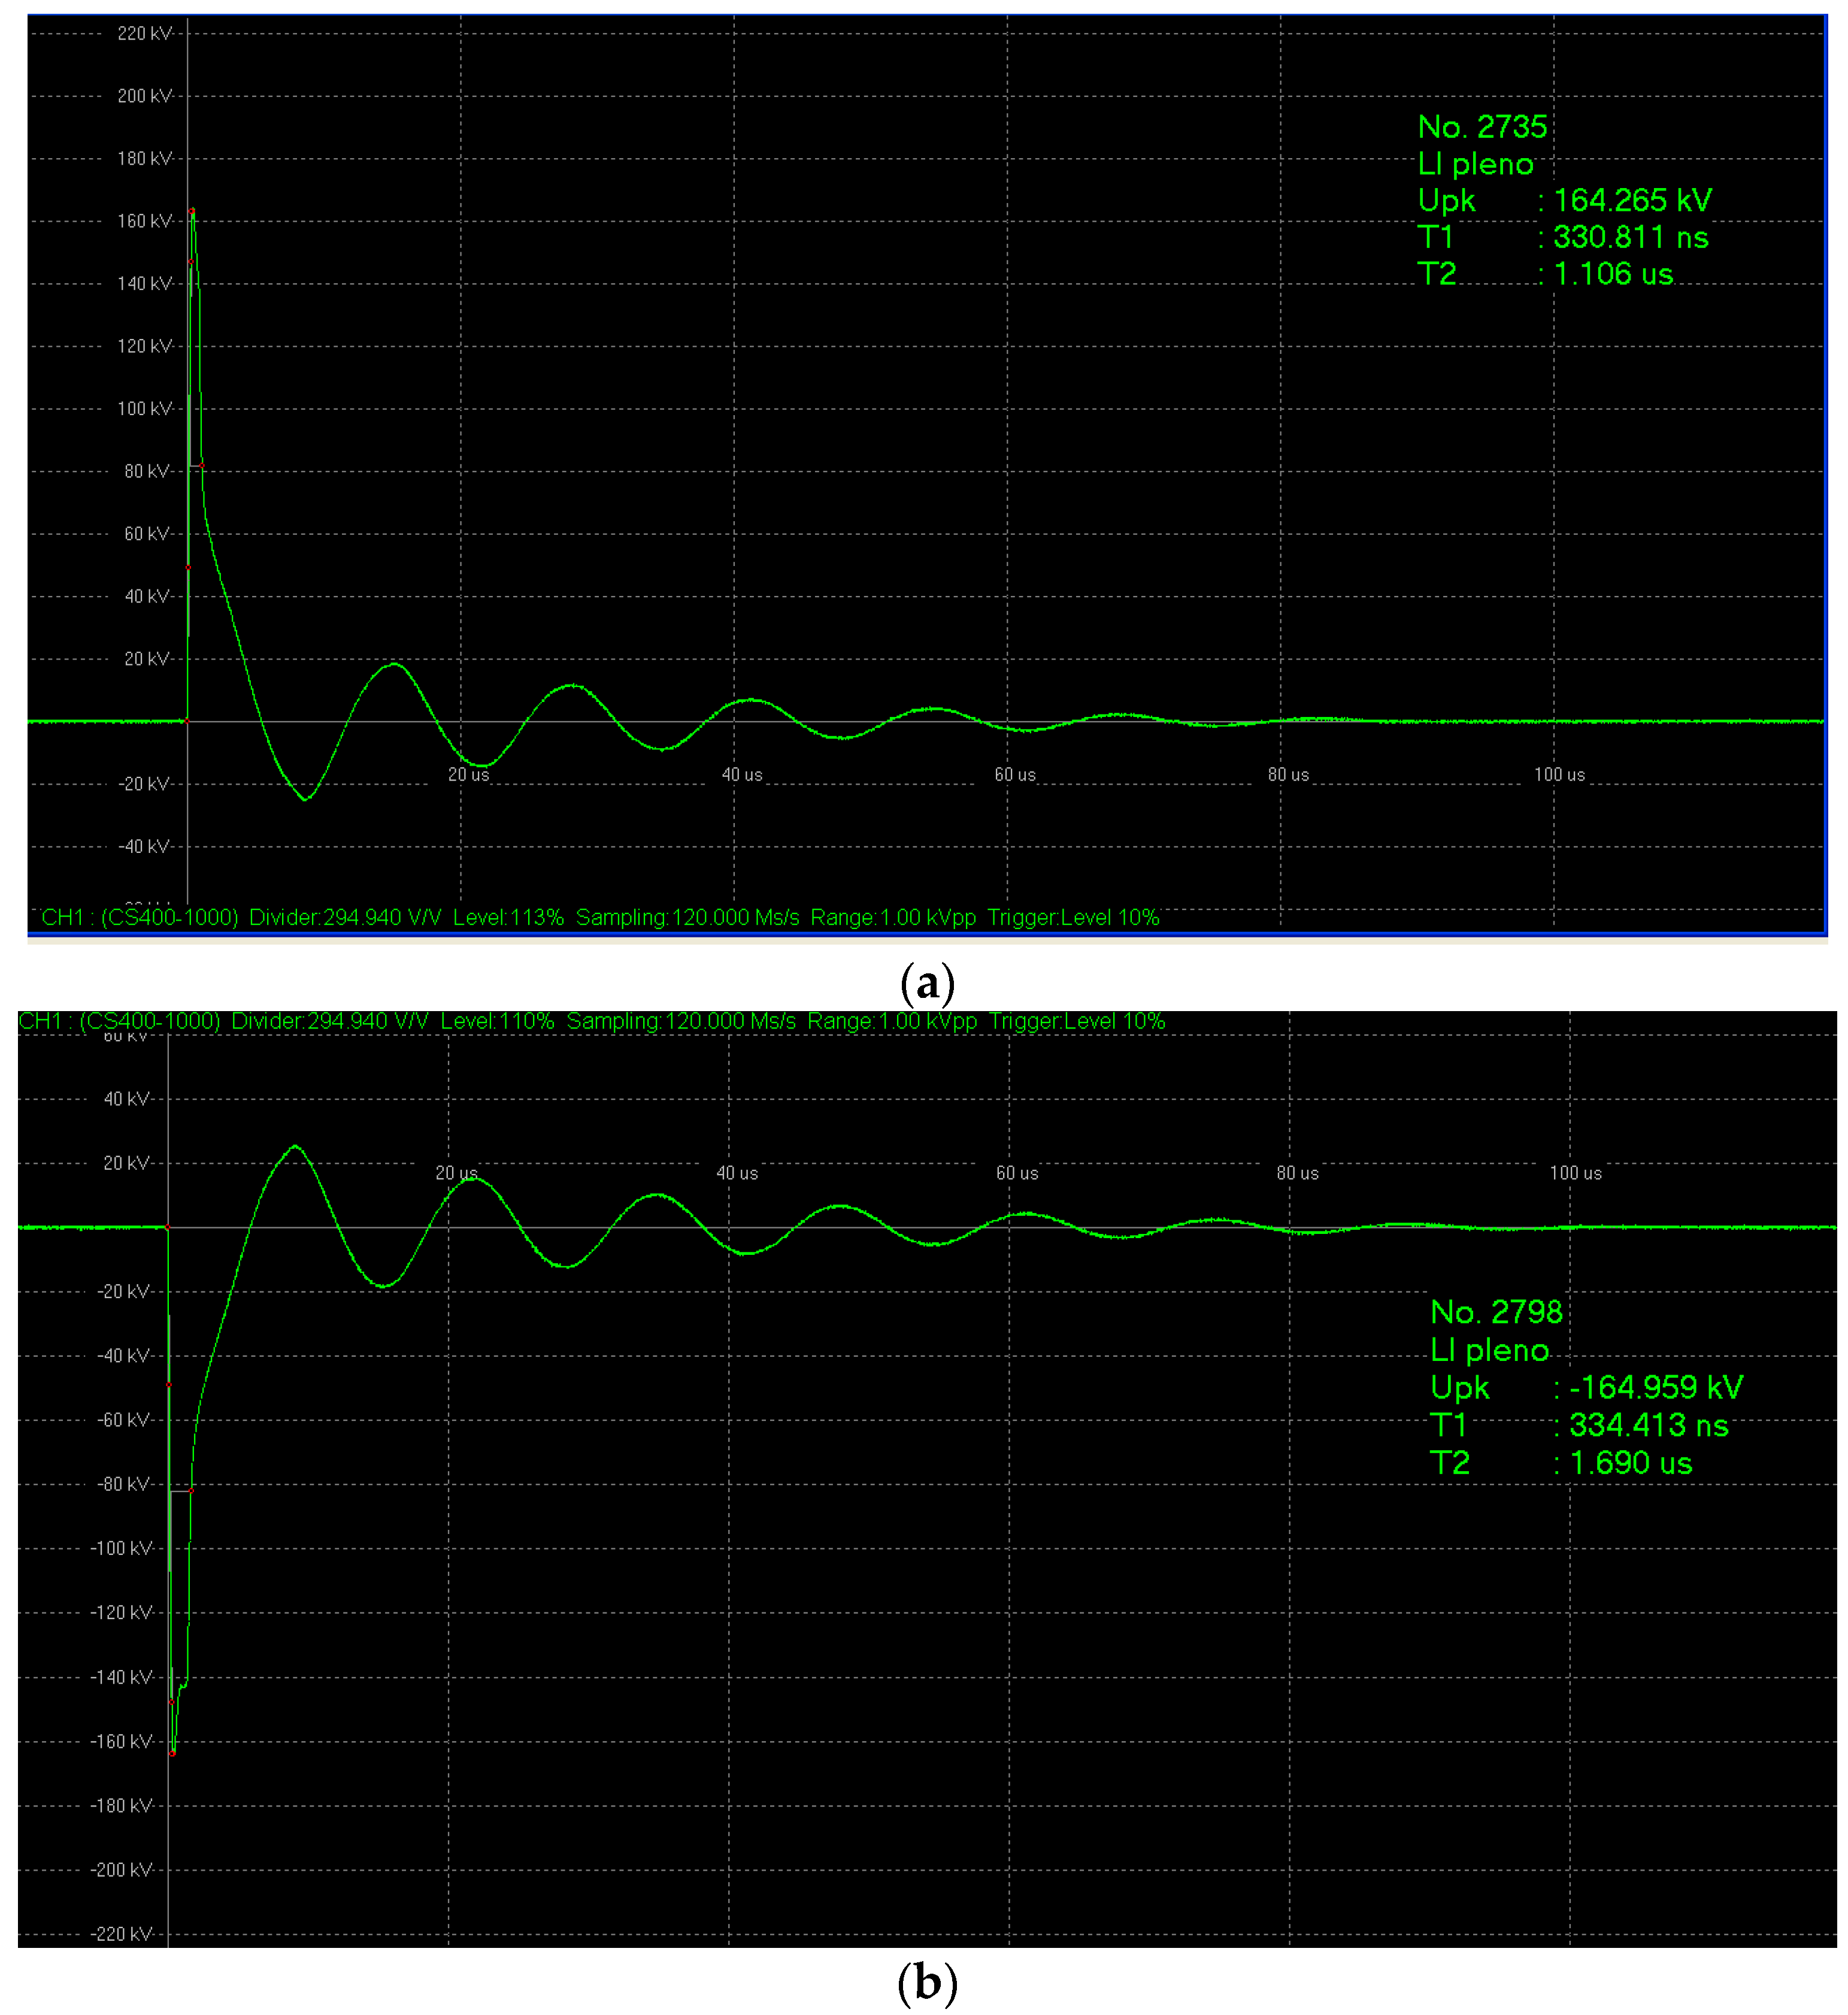
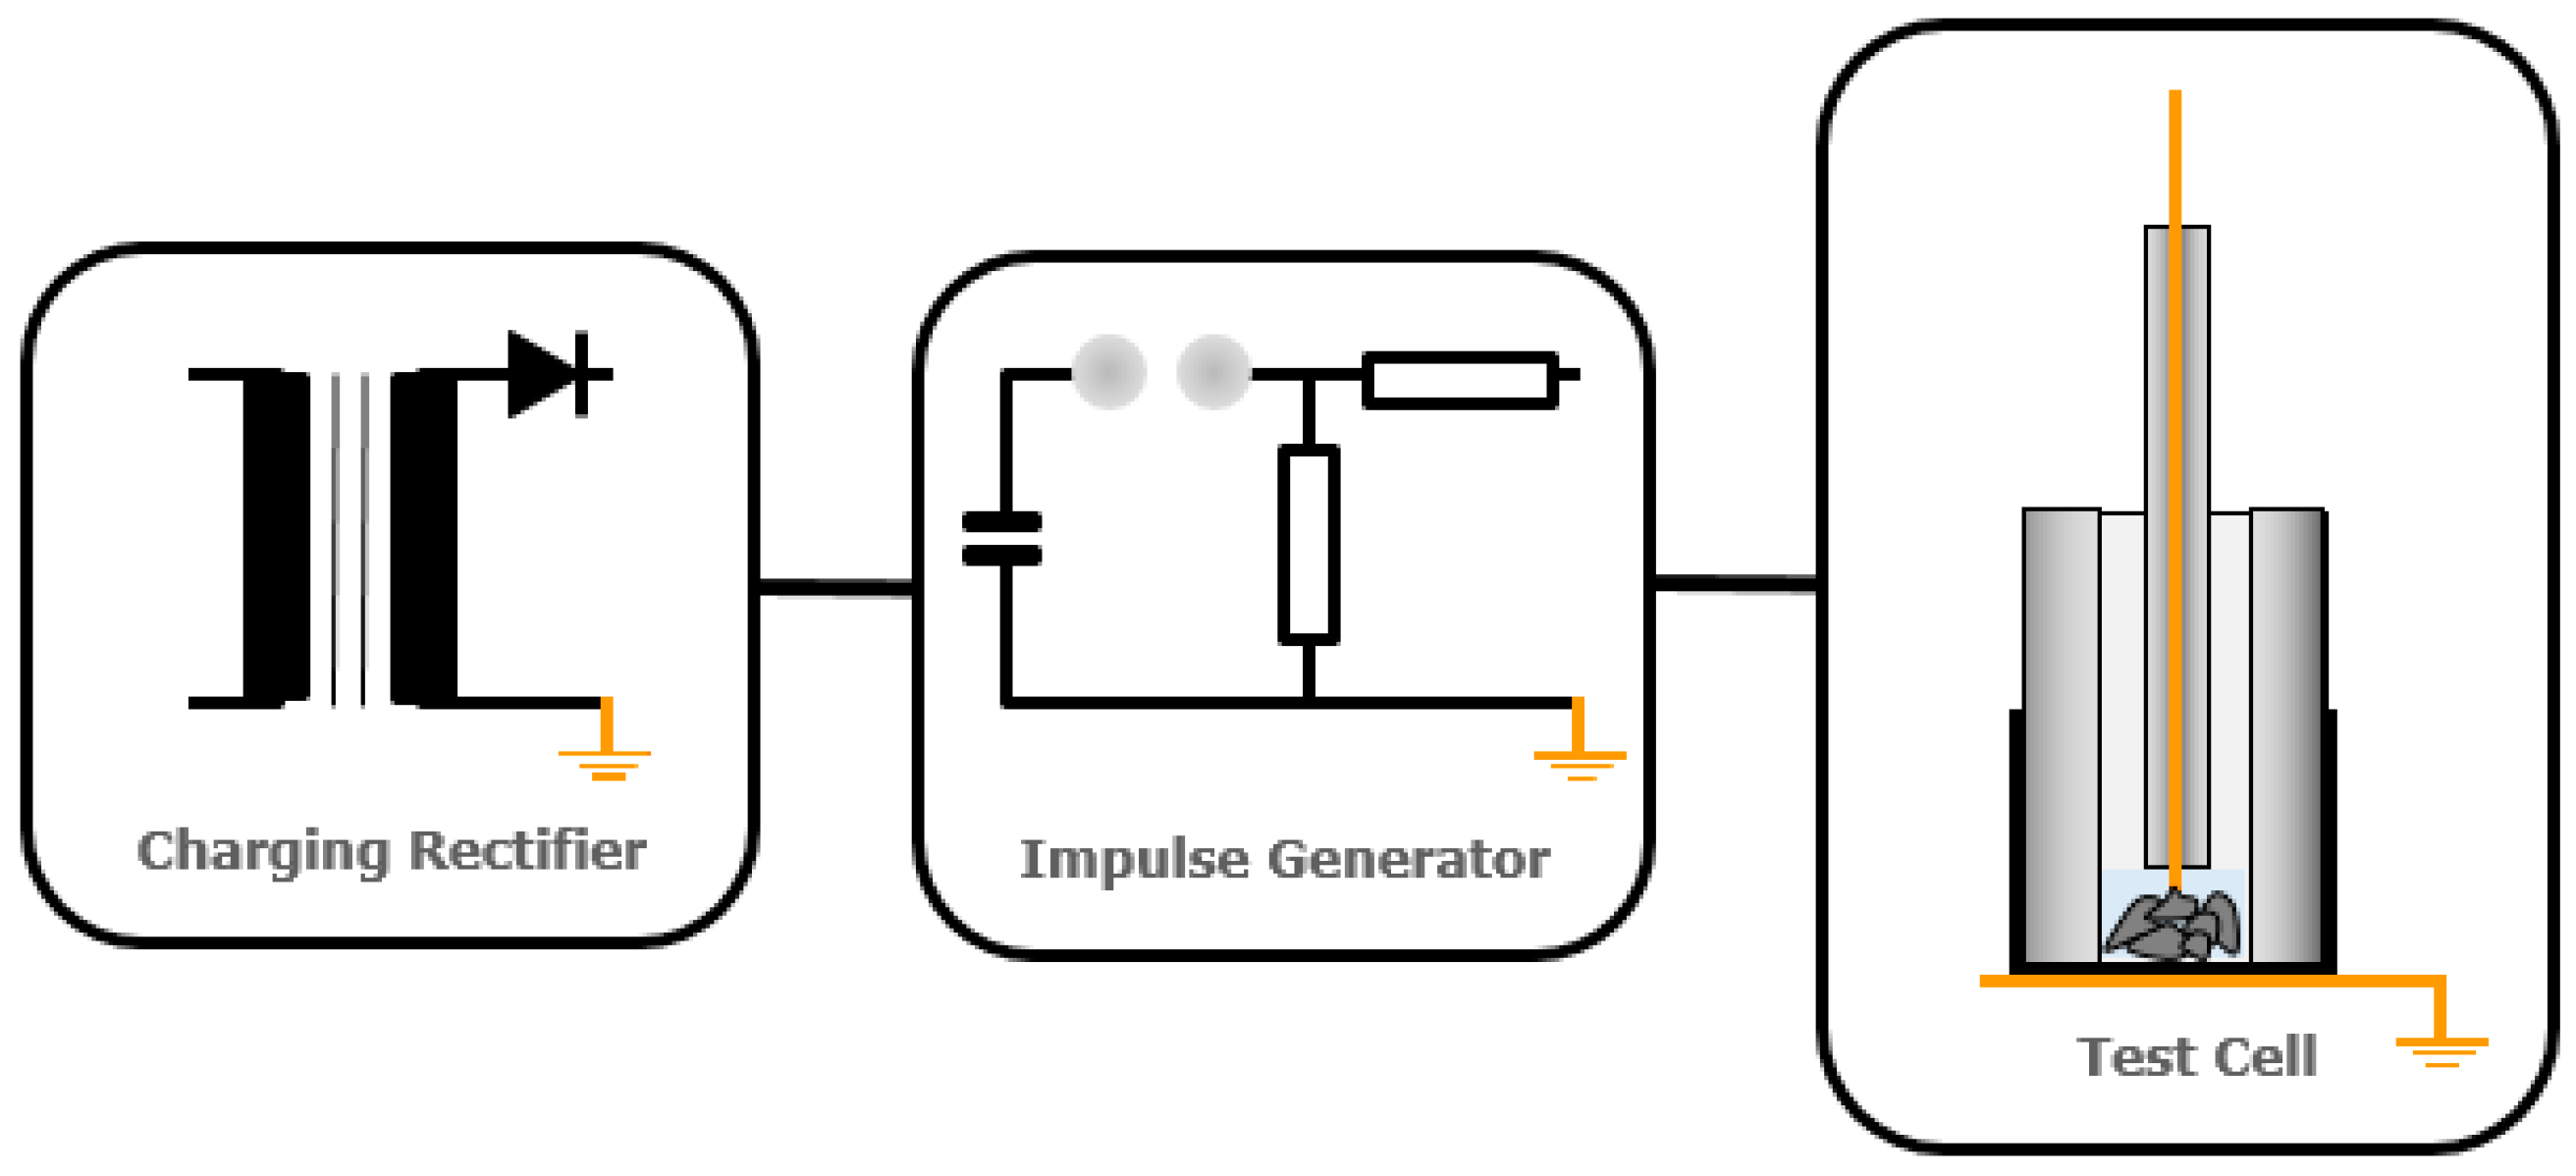
2.2.1. HVEP Test Rig
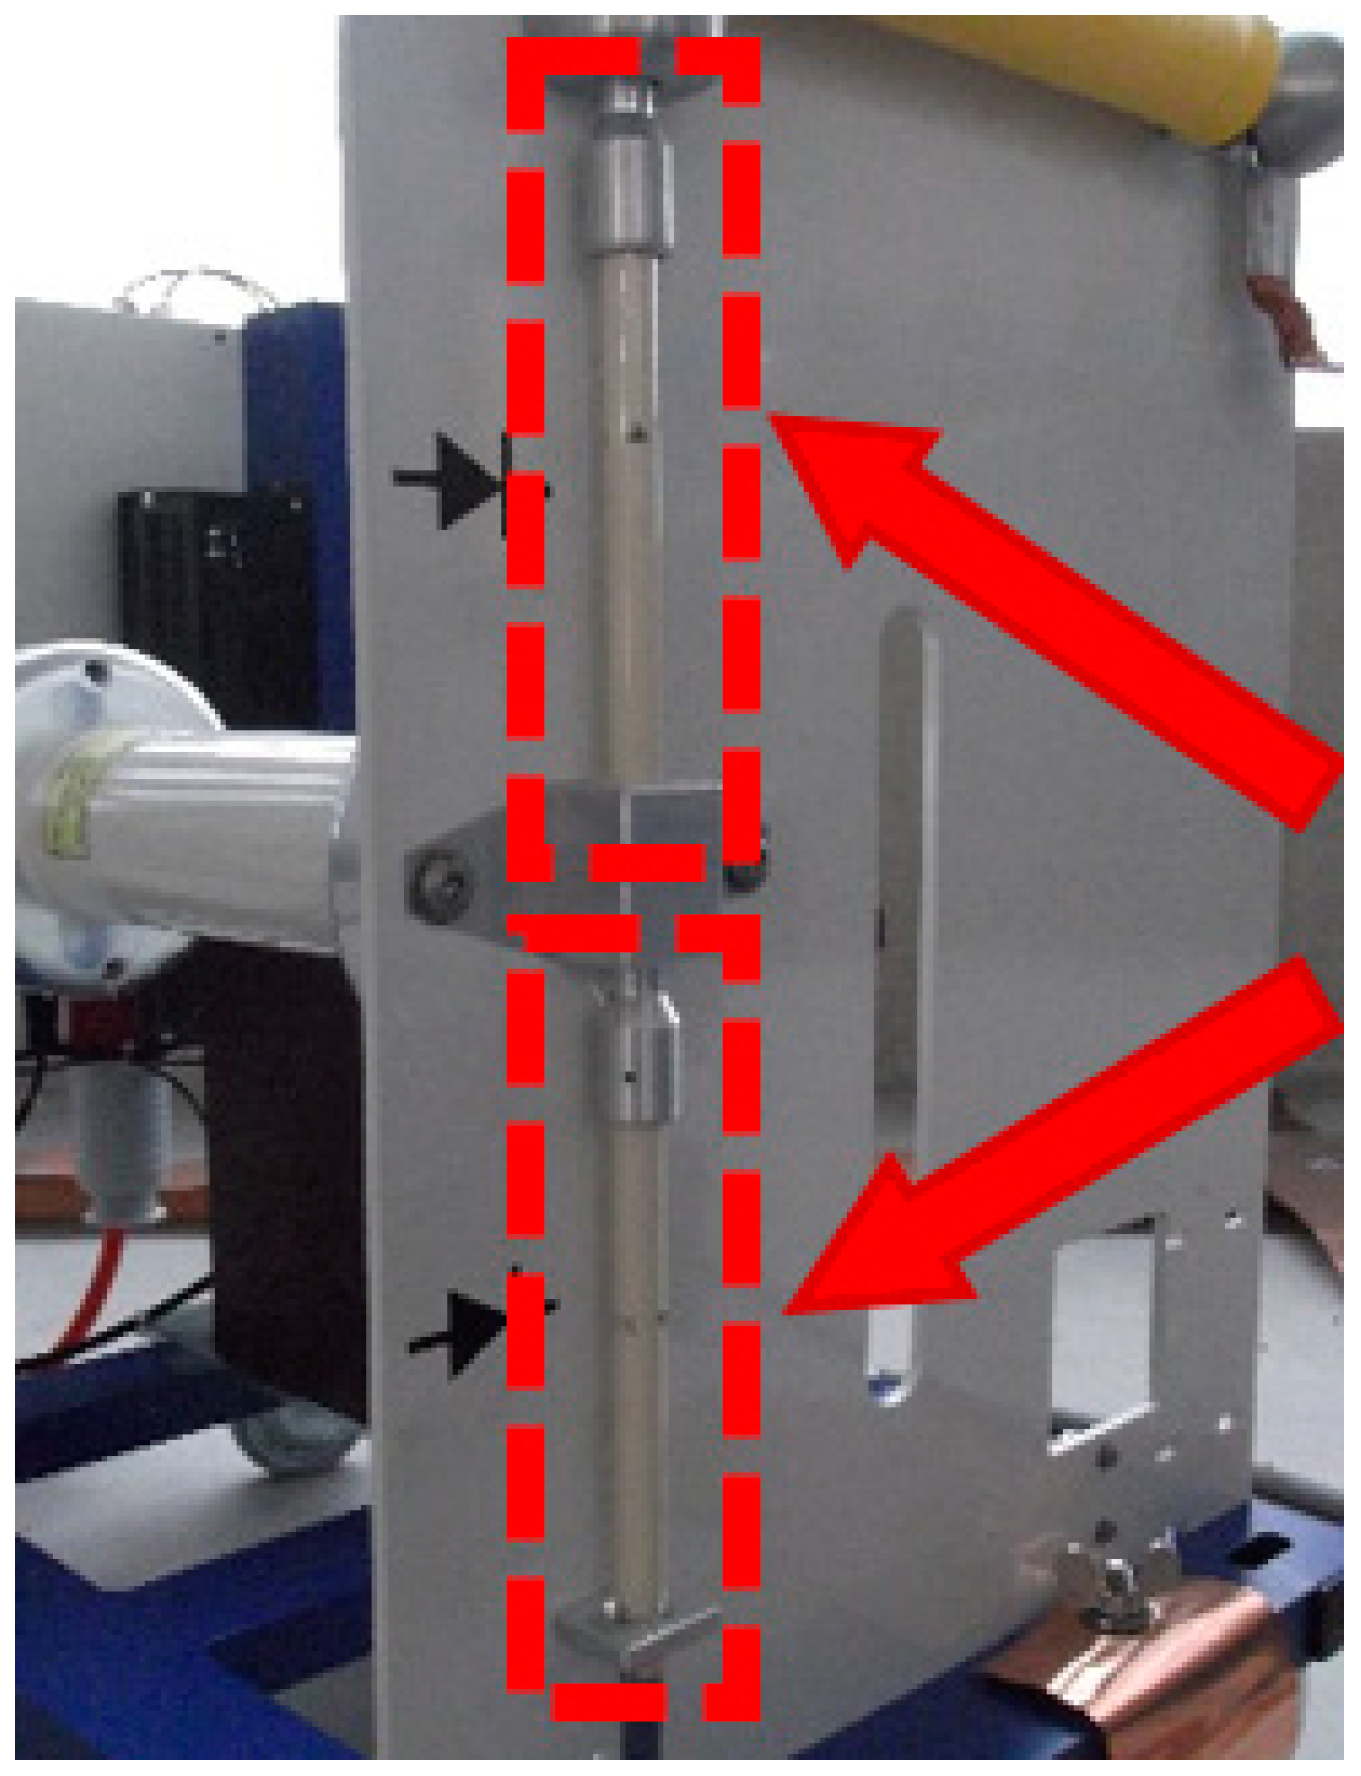
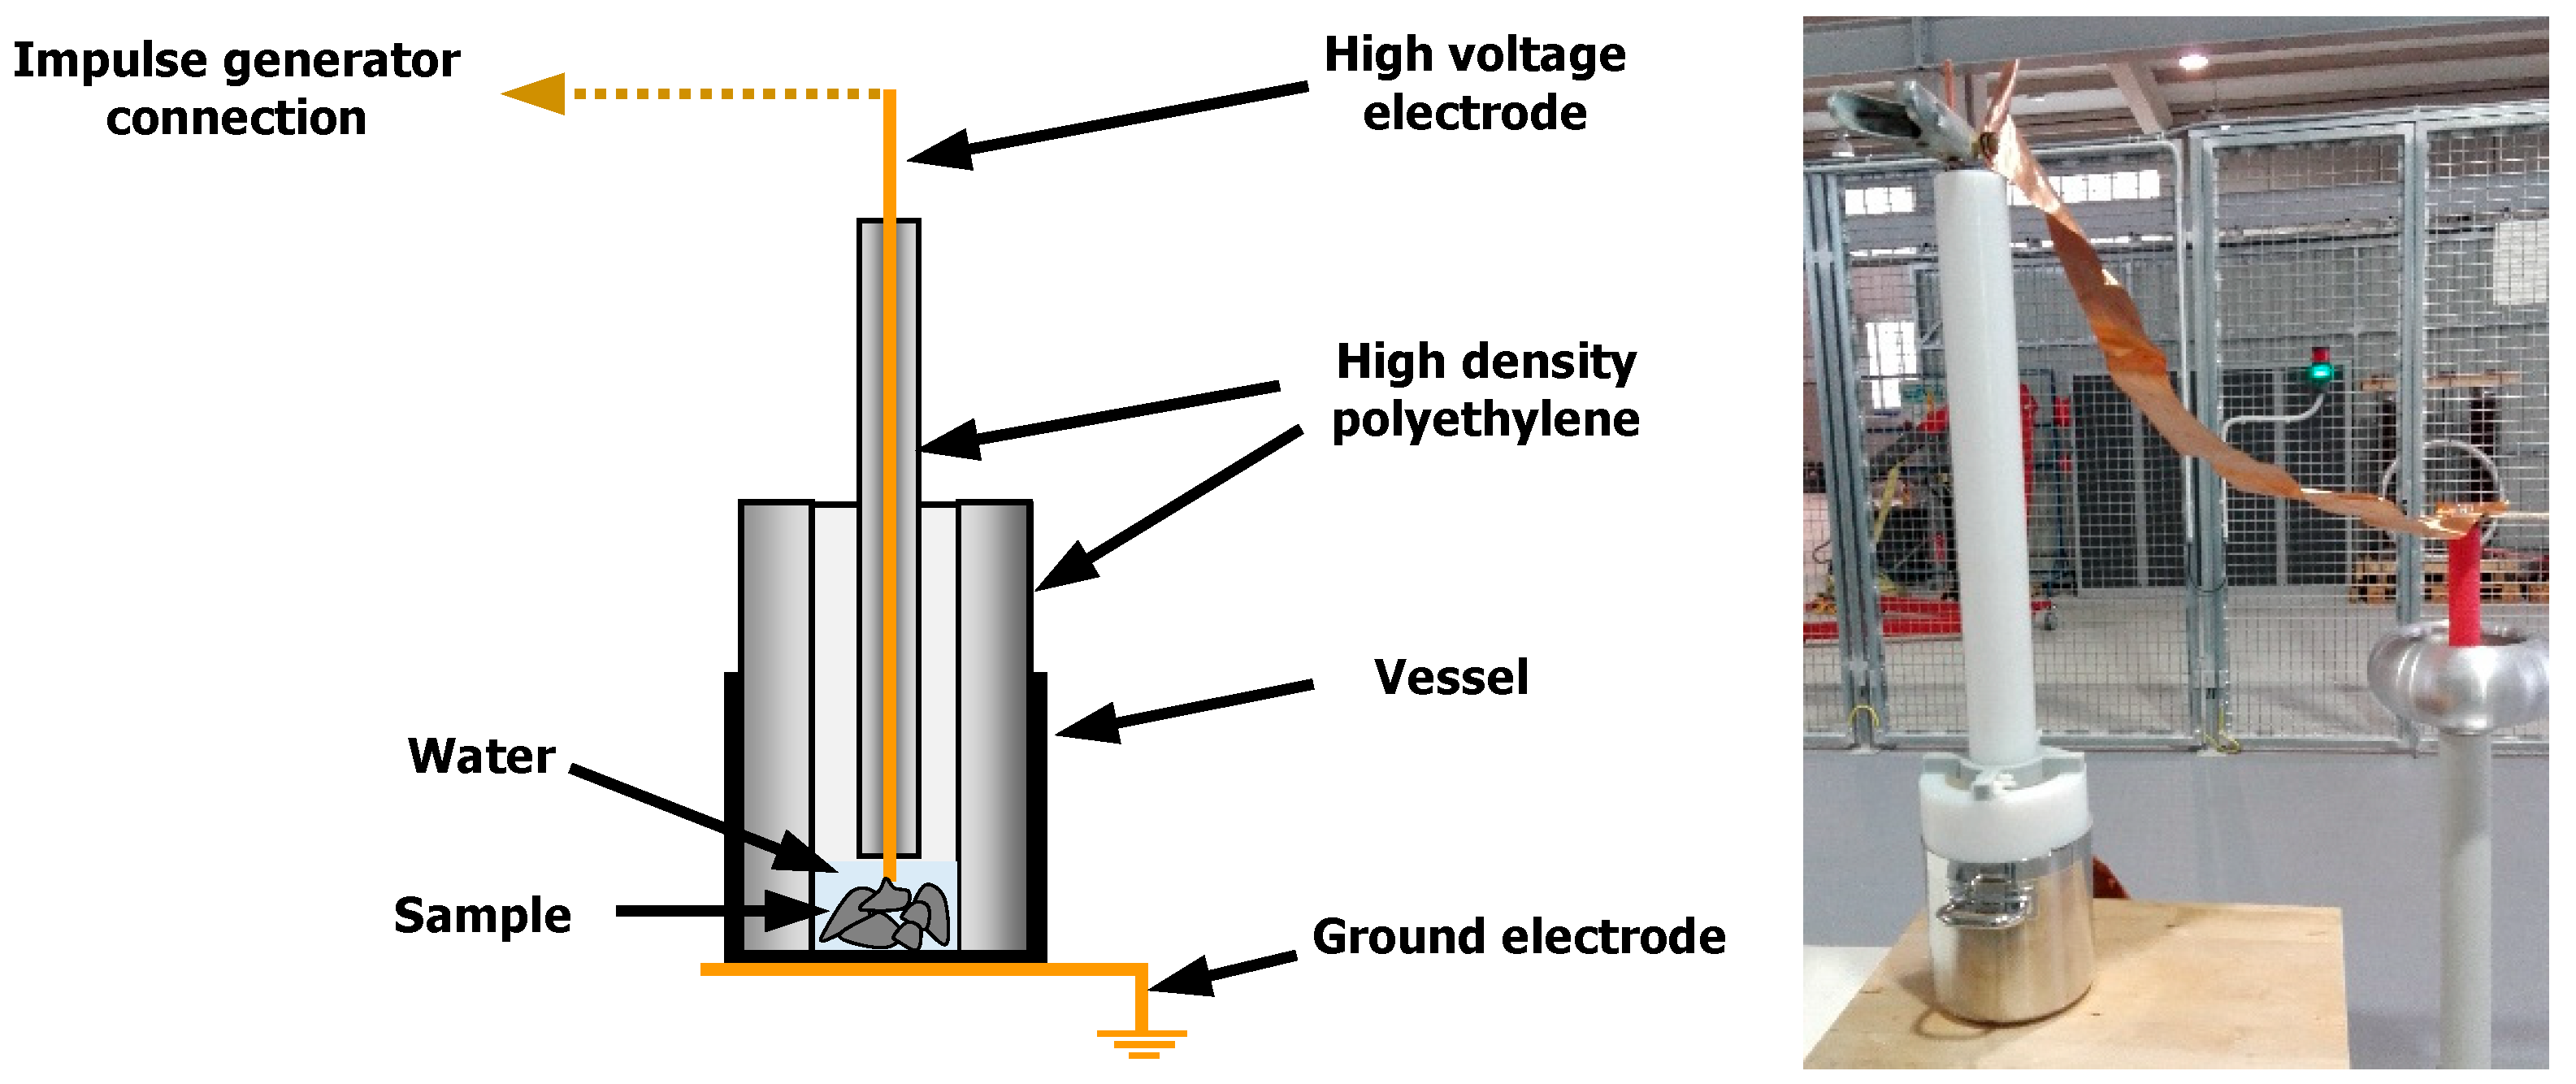
2.2.2. HVEP Test Cell
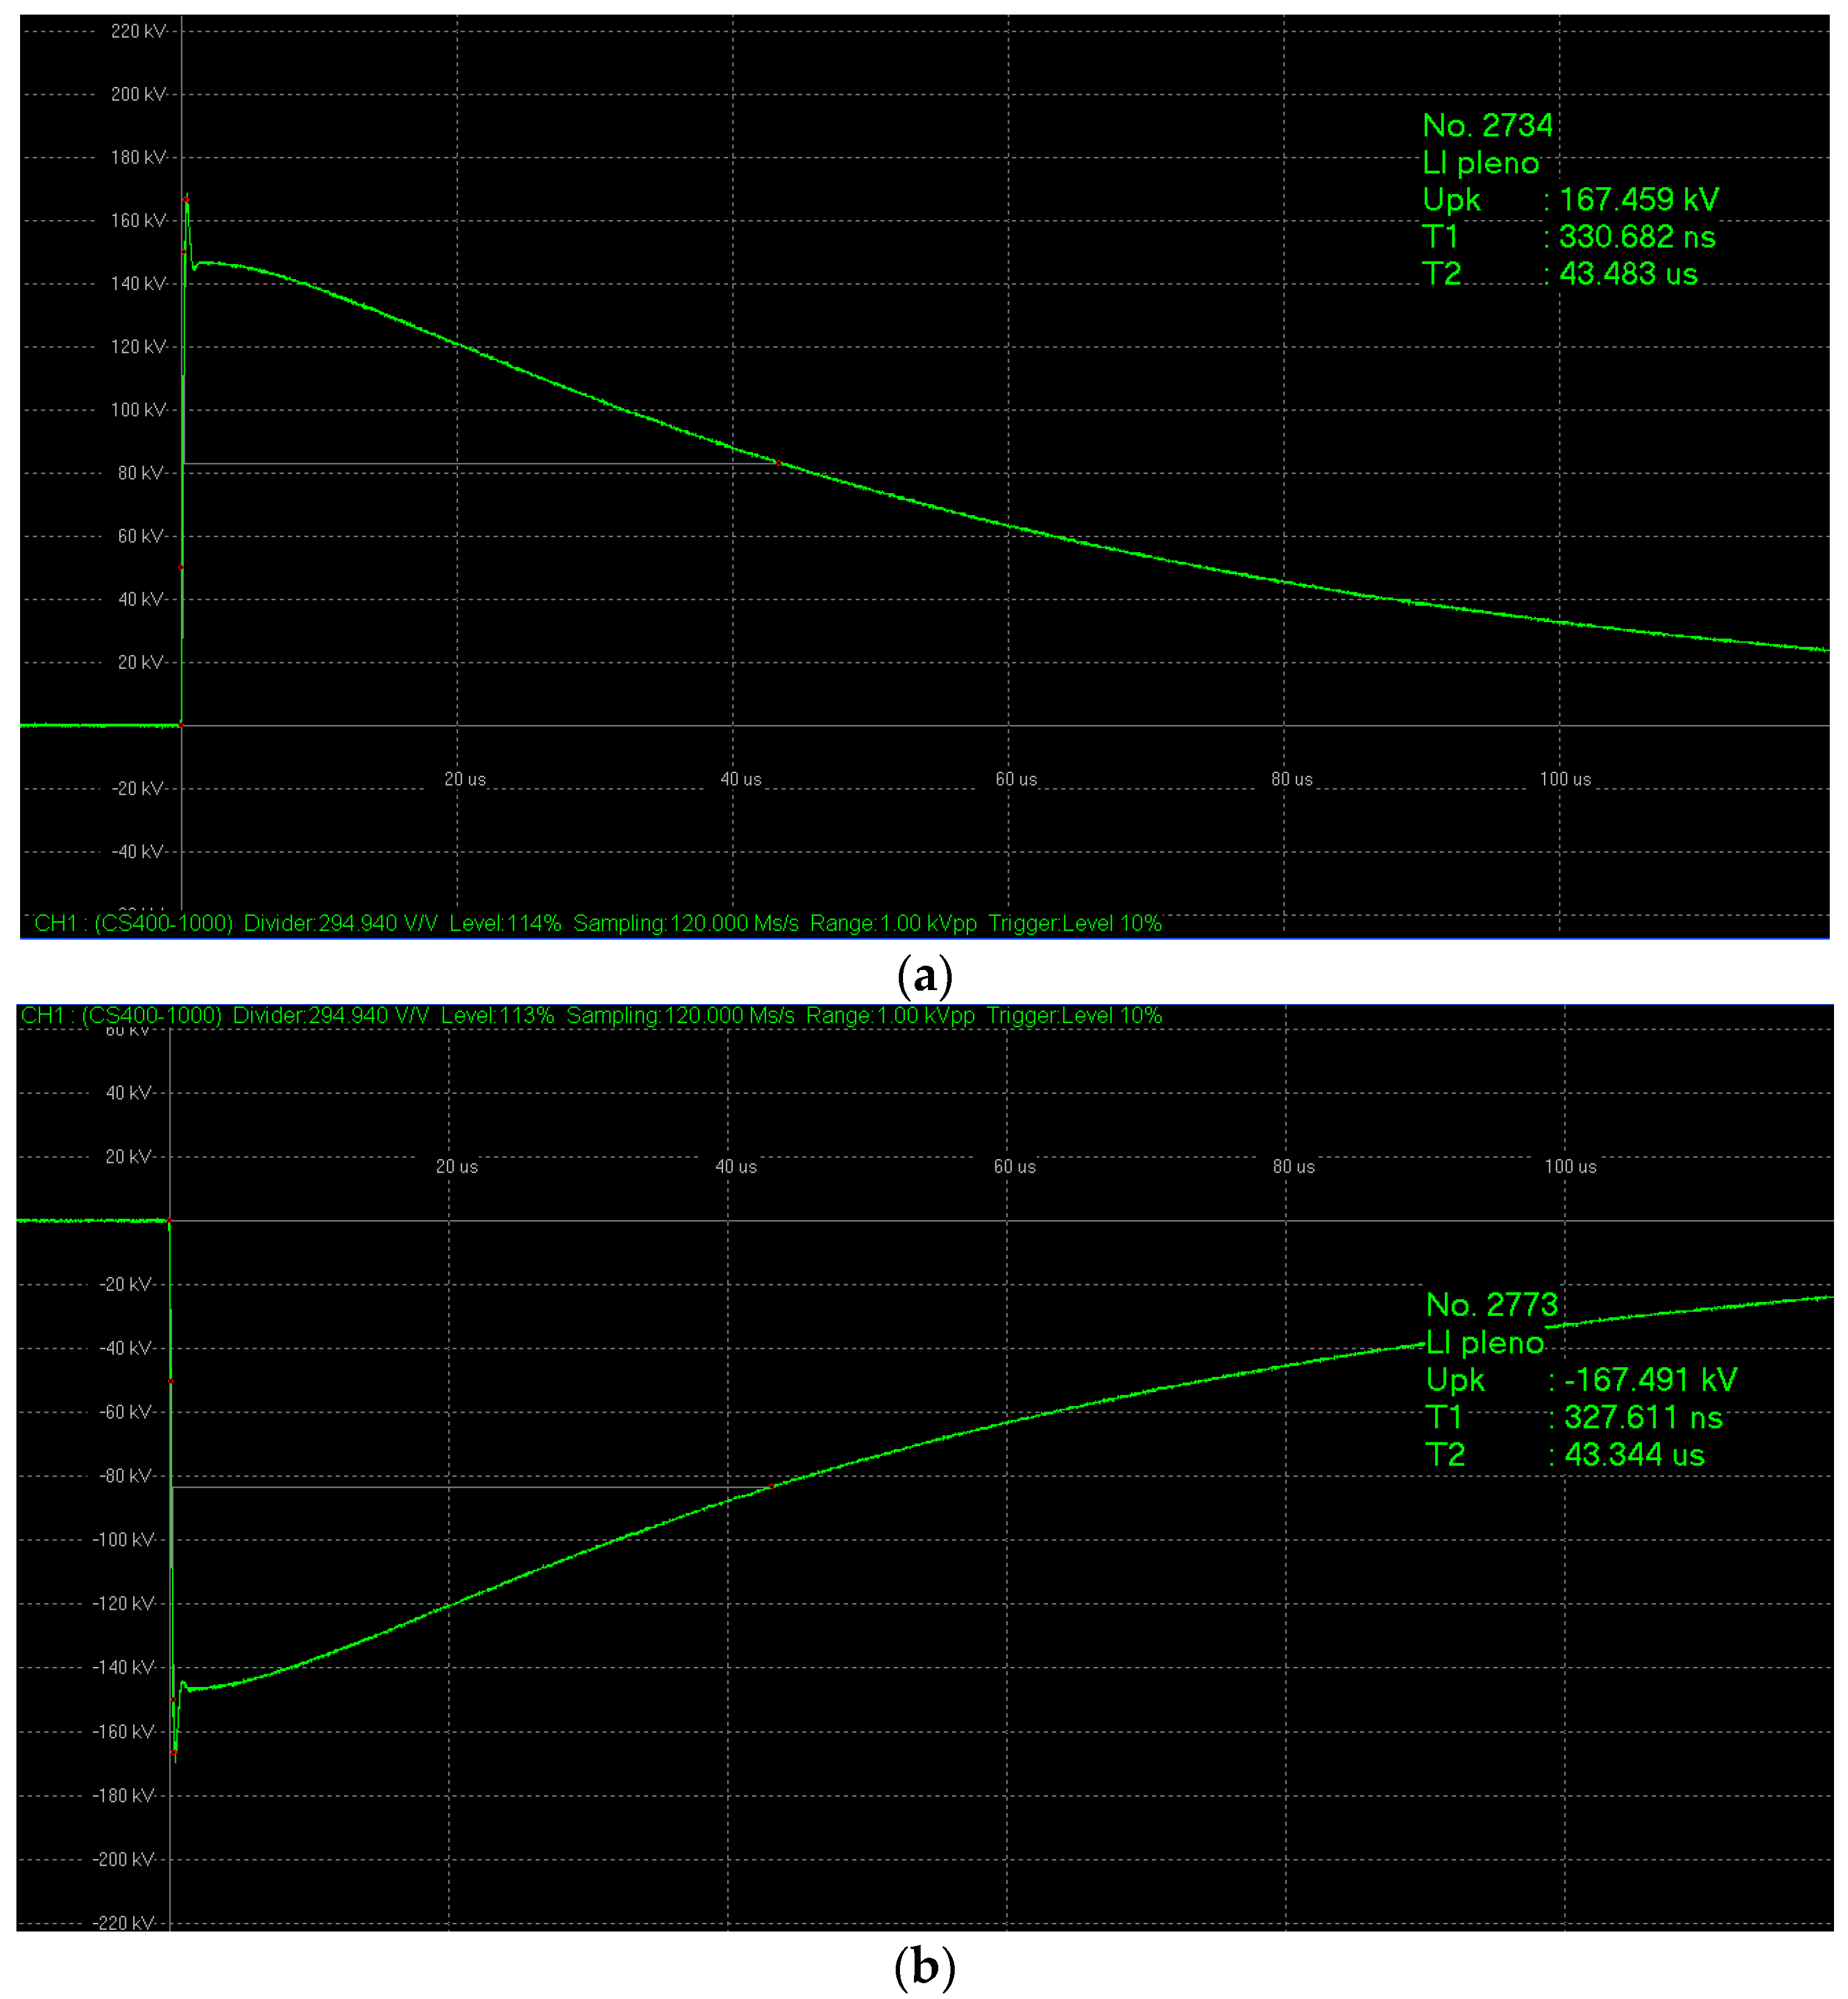
2.2.3. HVEP Test Procedure
2.2.4. Mathematical Model
3. Results and Discussion
4. Conclusions
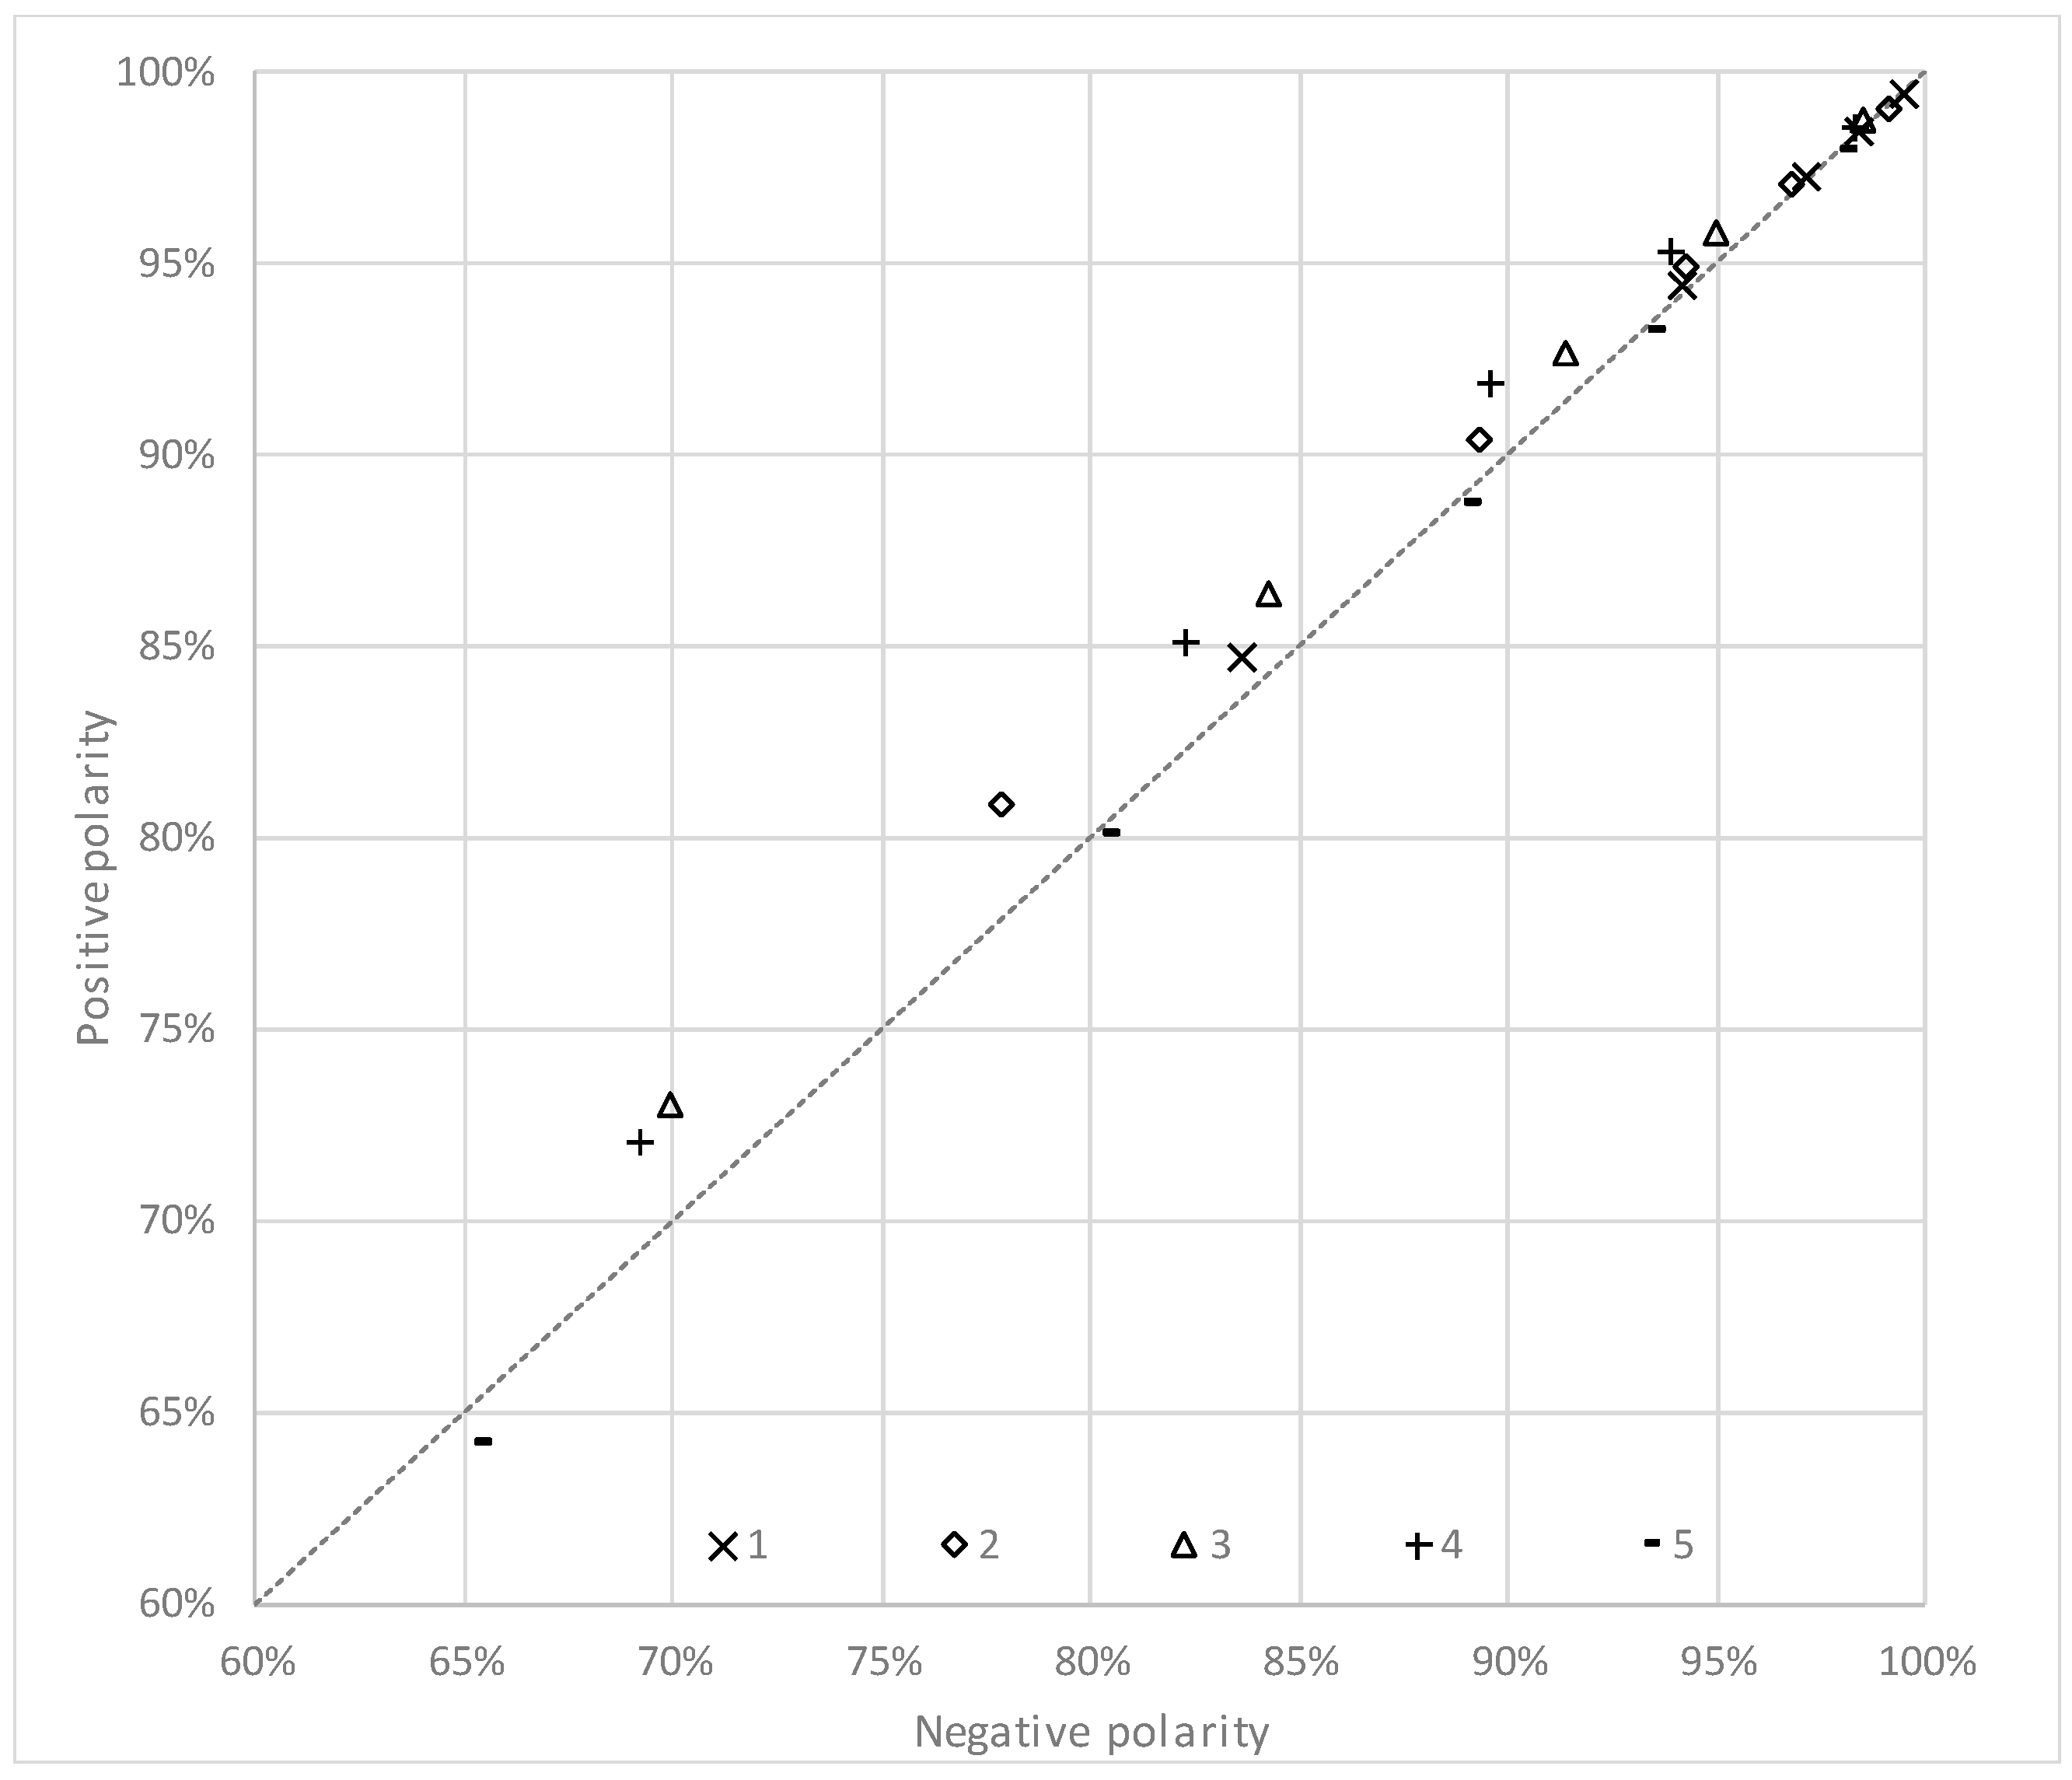
- With a monosize 5000/3500 µm, a negative polarity achieved a better comminution effect, while with the monosize 3350/2000 µm, a positive polarity achieved better performance. In finer monosizes, the polarity effect was not conclusive. Accordingly, the influence of the polarity on the electrofragmentation effect cannot be concluded, and further studies should be performed;
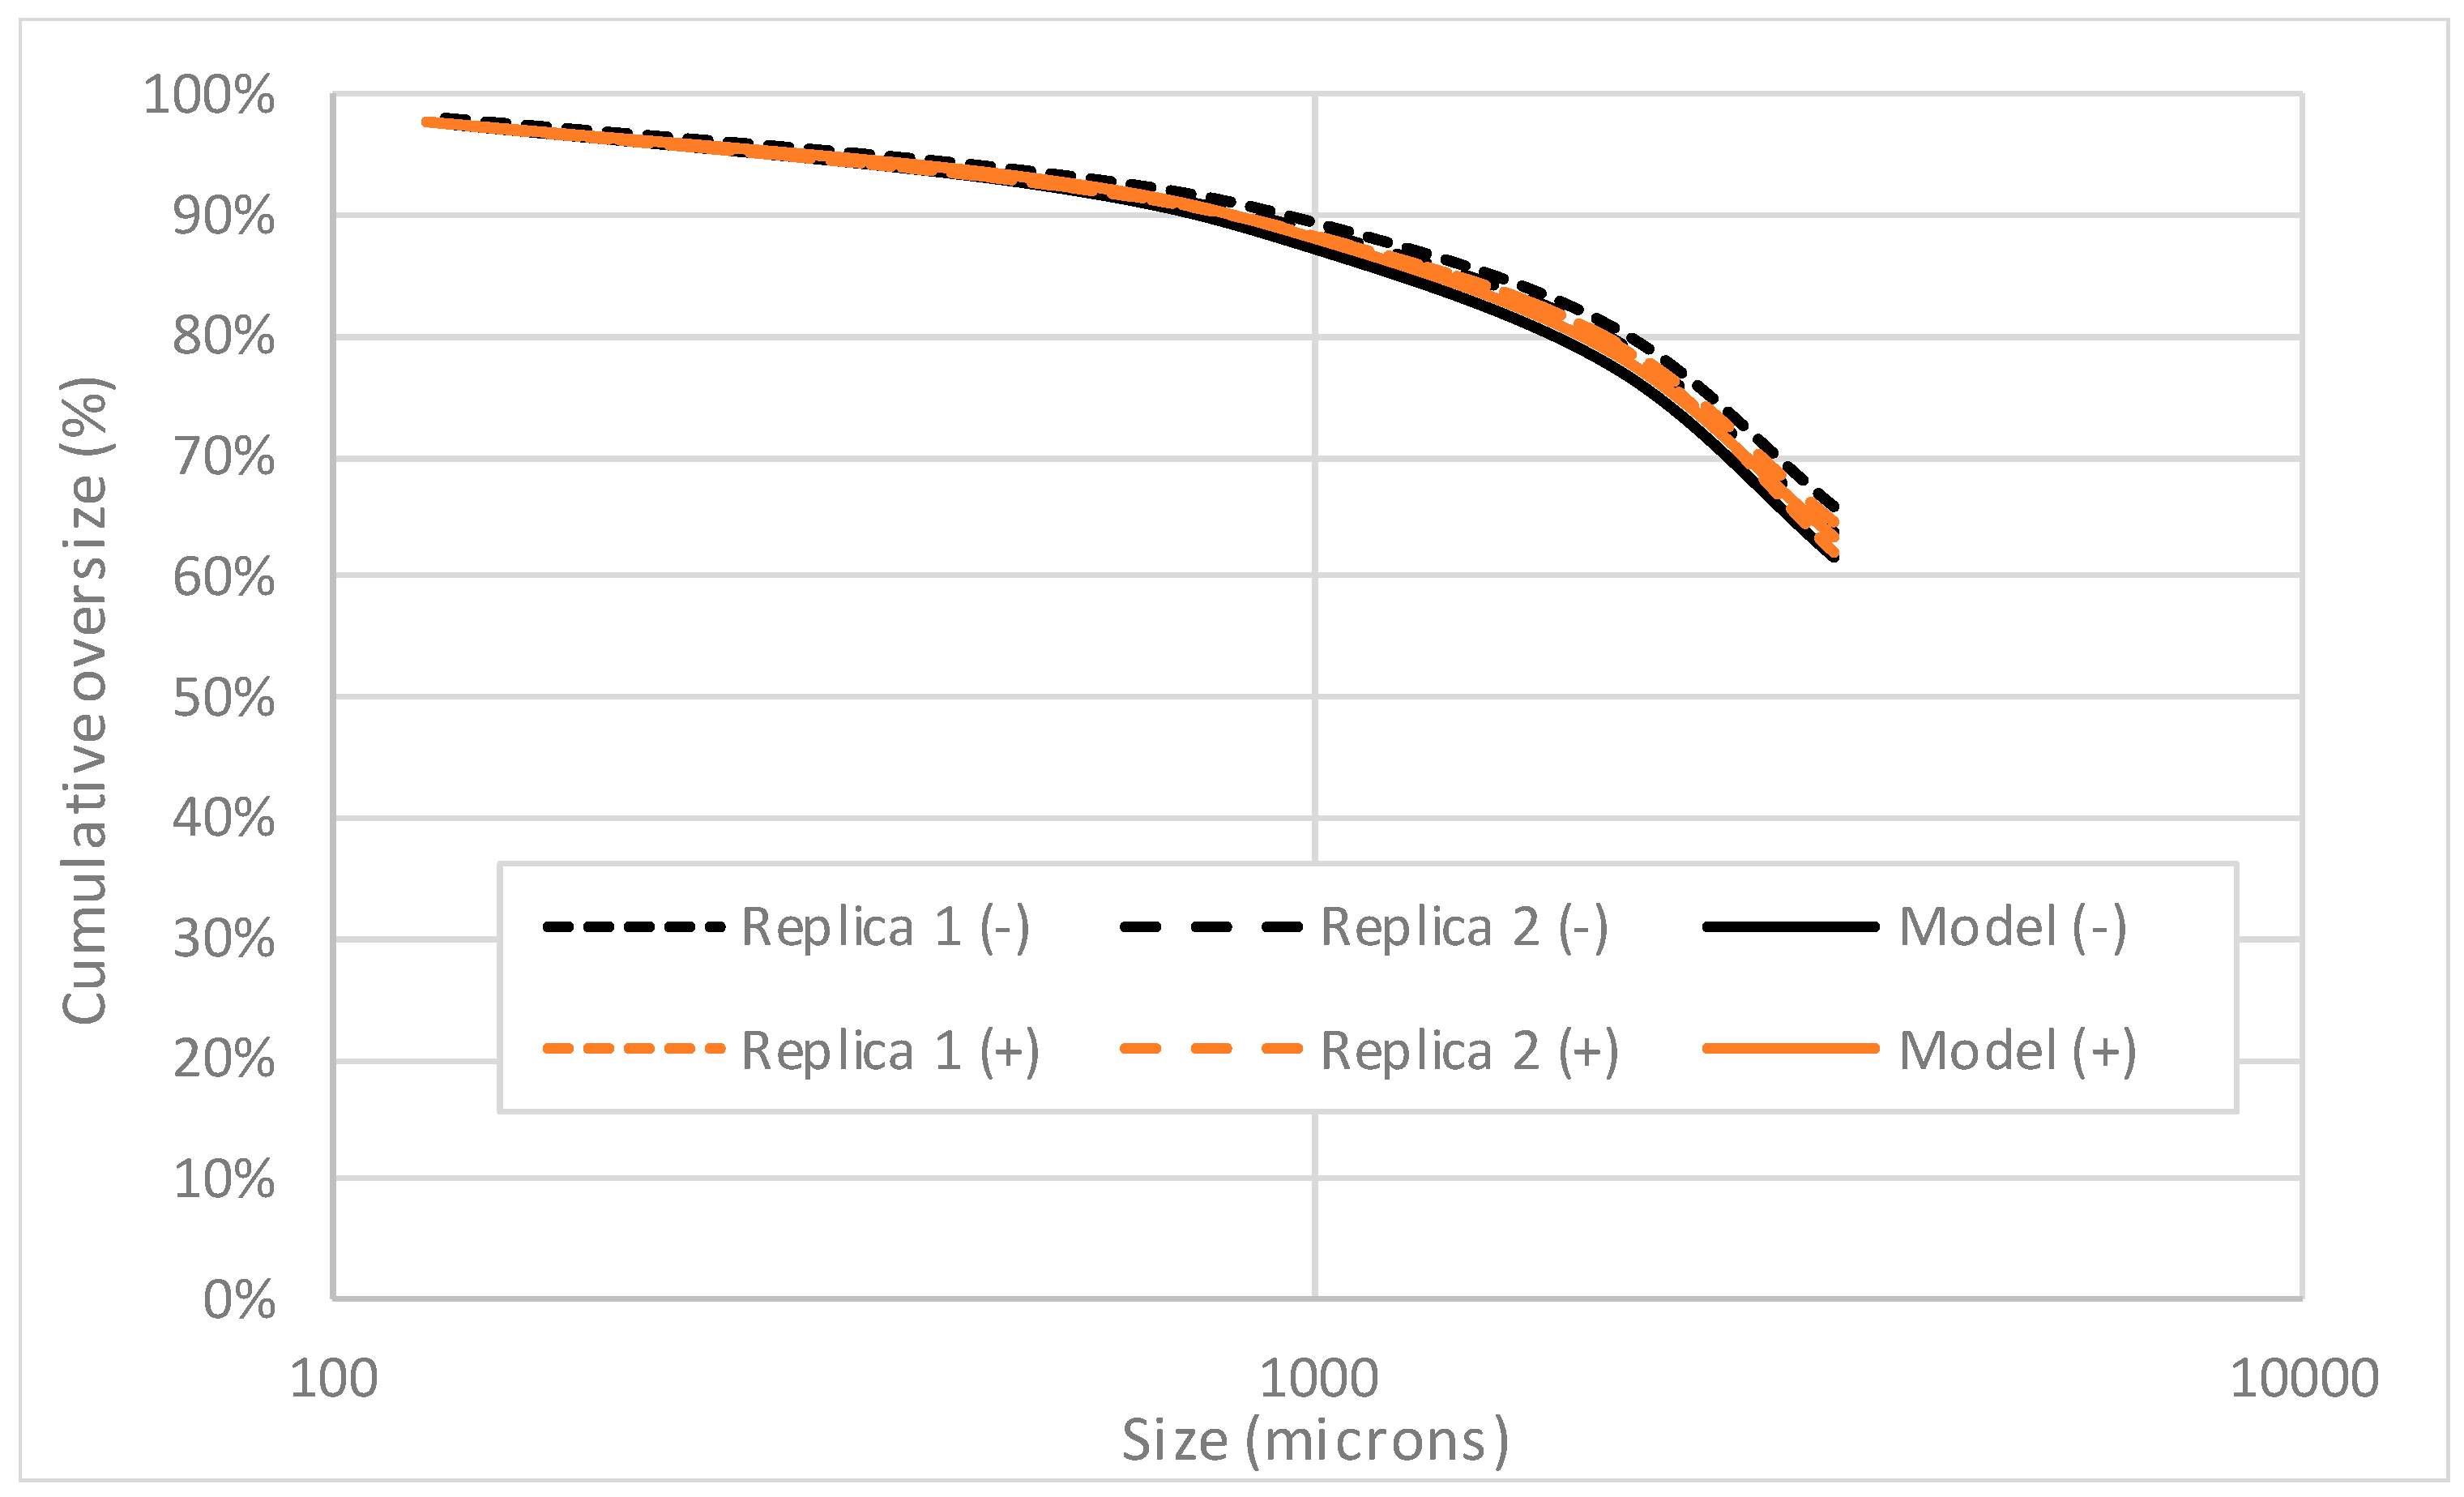
- The proposed model can achieve a good prediction of the electrofragmentation product PSD, after a given number of impulses. The results for both polarities were similar, with a slightly better result in the case of positive polarity.
Supplementary Materials
Author Contributions
Funding
Institutional Review Board Statement
Informed Consent Statement
Data Availability Statement
Conflicts of Interest
References
- Fuerstenau, D.W.; Phatak, P.B.; Kapur, P.C.; Abouzeid, A.-Z.M. Simulation of the grinding of coarse/fine (heterogeneous) systems in a ball mill. Int. J. Miner. Processing 2011, 99, 32–38. [Google Scholar] [CrossRef]
- Schönert, K. Aspects of the physics of breakage relevant to comminution. In Proceedings of the 4th Tewksbury Symposium Fracture, Melbourne, Australia, 12–14 February 1979; pp. 3:1–3:30. [Google Scholar]
- Austin, L.G.; Klimpel, R.R. The Theory of Grinding Operations. Ind. Eng. Chem. 1964, 56, 18–29. [Google Scholar] [CrossRef]
- Deniz, V.; Ozdag, H. A new approach to bond grindability and work index: Dynamic elastic parameters. Miner. Eng. 2003, 16, 211–217. [Google Scholar] [CrossRef]
- Usov, A.F.; Tsukerman, V.A. New innovative technologies of processing of mineral raw materials on a basis electric pulse disintegration. In XXVIII International Mineral Processing Congress; Science Press: Beijing, China, 2008; pp. 325–328. [Google Scholar]
- Shi, F.; Weh, A.; Manlapig, E.; Wang, E. Recent Developments in high voltage electrical comminution research and its potential applications in the mineral industry. In XXVI Internation Mineral Processing Conference; Technowrites: New Delhi, India, 2012; pp. 4950–4962. [Google Scholar]
- Shi, F.; Zuo, W.; Manlapig, E. Characterisation of pre-weakening effect on ores by high voltage electrical pulses based on single-particle tests. Miner. Eng. 2013, 50–51, 69–76. [Google Scholar] [CrossRef]
- Shi, F.; Zuo, W.; Manlapig, E. Pre-concentration of copper ores by high voltage pulses. Part 2: Opportunities and challenges. Miner. Eng. 2015, 79, 315–323. [Google Scholar] [CrossRef]
- Huang, W.; Shi, F. Improving high voltage pulse selective breakage for ore-preconcentration using a multiple particle treatment method. Miner. Eng. 2018, 128, 195–201. [Google Scholar] [CrossRef]
- Usov, A.F.; Tsukerman, V.A. Innovation processes and device for processing of industrial minerals, mica, diamonds based electric pulse disintegration: Design and testing. In Abstract of the XXII International Mineral Processing Congress; South African Institute of Mining & Metallurgy: Cape Town, Africa, 2003. [Google Scholar]
- Wang, E.; Shi, F.; Manlapig, E. Mineral liberation by high voltage pulses and conventional comminution with same specific energy levels. Miner. Eng. 2012, 27–28, 28–36. [Google Scholar] [CrossRef]
- Andres, U. Electrical disintegration of rock. Miner. Processing Extr. Metall. Rev. 1994, 14, 87–110. [Google Scholar] [CrossRef]
- Chernet, T. High Voltage Selective Fragmentation for Detailed Mineralogical and Analytical Information, Case Study: Oiva’s Gold-Quartz-Dyke in the Lapland Granulite Belt, Laanila, Northern Finland. In Proceedings of the 10th International Congress for Applied Mineralogy (ICAM); Broekmans, M., Ed.; Springer: Berlin/Heidelberg, Germany, 2012. [Google Scholar]
- Finkelstein, G.A.; Shuloyakov, A.D. On prospects of electric pulse disintegration from energy balance standpoint. Miner. Processing Extr. Metall. Rev. 1996, 16, 167–174. [Google Scholar] [CrossRef]
- Zuo, W.; Shi, F.; Manlapig, E. Modelling of high voltage pulse breakage of ores. Miner. Eng. 2015, 83, 168–174. [Google Scholar] [CrossRef]
- Baragaño, D.; Forján, R.; Menéndez Aguado, J.M.; Covián Martino, M.; Díaz García, P.; Martínez Rubio, J.; Álvarez Rueda, J.J.; Gallego, J.L.R. Reuse of Dunite Mining Waste and Subproducts for the Stabilization of Metal(oid)s in Polluted Soils. Minerals 2019, 9, 481. [Google Scholar] [CrossRef] [Green Version]
- Touzé, S.; Bru, K.; Ménard, Y.; Weh, A.; Von der Weid, F. Electrical fragmentation applied to the recycling of concrete waste—Effect on aggregate liberation. Int. J. Miner. Processing 2017, 158, 68–75. [Google Scholar] [CrossRef]
- Wang, E.; Shi, F.; Manlapig, E. Pre-weakening of mineral ores by high voltage pulses. Miner. Eng. 2011, 24, 455–462. [Google Scholar] [CrossRef]
- Wang, E.; Shi, F.; Manlapig, E. Factors affecting electrical comminution performance. Miner. Eng. 2012, 34, 48–54. [Google Scholar] [CrossRef]
- Van der Wielen, K.P.; Pascoe, R.; Weh, A.; Wall, F.; Rollinson, G. The influence of equipment settings and rock properties on high voltage breakage. Miner. Eng. 2013, 46–47, 100–111. [Google Scholar] [CrossRef]
- Bluhm, H.; Frey, W.; Giese, H.; Hoppé, P.; Schultheiss, C.; Strässner, R. Application of Pulsed HV Discharges to Material Fragmentation and Recycling. IEEE Trans. Dielectr. Electr. Insul. 2000, 7, 625–636. [Google Scholar] [CrossRef]
- Voigt, M.; Anders, E.; Lehmann, F.; Mezzetti, M.; Will, F. “Electric Impulse Technology—Breaking Rock”. In Proceedings of the 22nd European Conference on Power Electronics and Applications EPE′20 ECCE Europe, Lyon, France, 7–11 September 2020. [Google Scholar]
- Ersayin, S.; Sönmez, B.; Ergün, L.; Aksani, B.; Erkal, F. Simulation of the Grinding Circuit at Gümüsköy Silver Plant, Turkey. Trans. Inst. Min. Metall. Sect. C (UK) 1993, 102, C32–C38. [Google Scholar]
- Ciribeni, V.; Menéndez-Aguado, J.M.; Bertero, R.; Tello, A.; Avellá, E.; Paez, M.; Coello-Velázquez, A.L. Unveiling the Link between the Third Law of Comminution and the Grinding Kinetics Behaviour of Several Ores. Metals 2021, 11, 1079. [Google Scholar] [CrossRef]


| SiO2 | Al2O3 | Fe2O3 | MgO | CaO | K2O | Others | L.O.I. |
|---|---|---|---|---|---|---|---|
| 39.86 | 3.00 | 7.62 | 35.34 | 1.73 | 0.07 | 0.35 | 11.91 |
| Monosize (μm) | Weight (kg) |
|---|---|
| 125/0 | 15.2 |
| 500/125 | 23.12 |
| 1000/500 | 18.34 |
| 2000/1000 | 24.46 |
| 3350/2000 | 12.34 |
| 5000/3350 | 18.30 |
| Parameter (unit) | Value |
|---|---|
| Maximum voltage (kV) | 400 |
| Maximum energy discharge (kJ) | 20 |
| Number of stages | 4 |
| Capacity/stage (µF) | 1 |
| Monosize | Negative Polarity | Positive Polarity | ||||
|---|---|---|---|---|---|---|
| (µm) | a | b | R2 | a | b | R2 |
| 5000/3350 | 0.00006 | 0.85365 | 0.99730 | 0.00004 | 0.90009 | 0.99940 |
| 3350/2000 | 0.00014 | 0.78421 | 0.97140 | 0.00017 | 0.77116 | 0.97210 |
| 2000/1000 | 0.00019 | 0.63905 | 0.88830 | 0.00010 | 0.72087 | 0.88710 |
| 1000/500 | 0.00076 | 0.41263 | 0.68810 | 0.00057 | 0.46036 | 0.68810 |
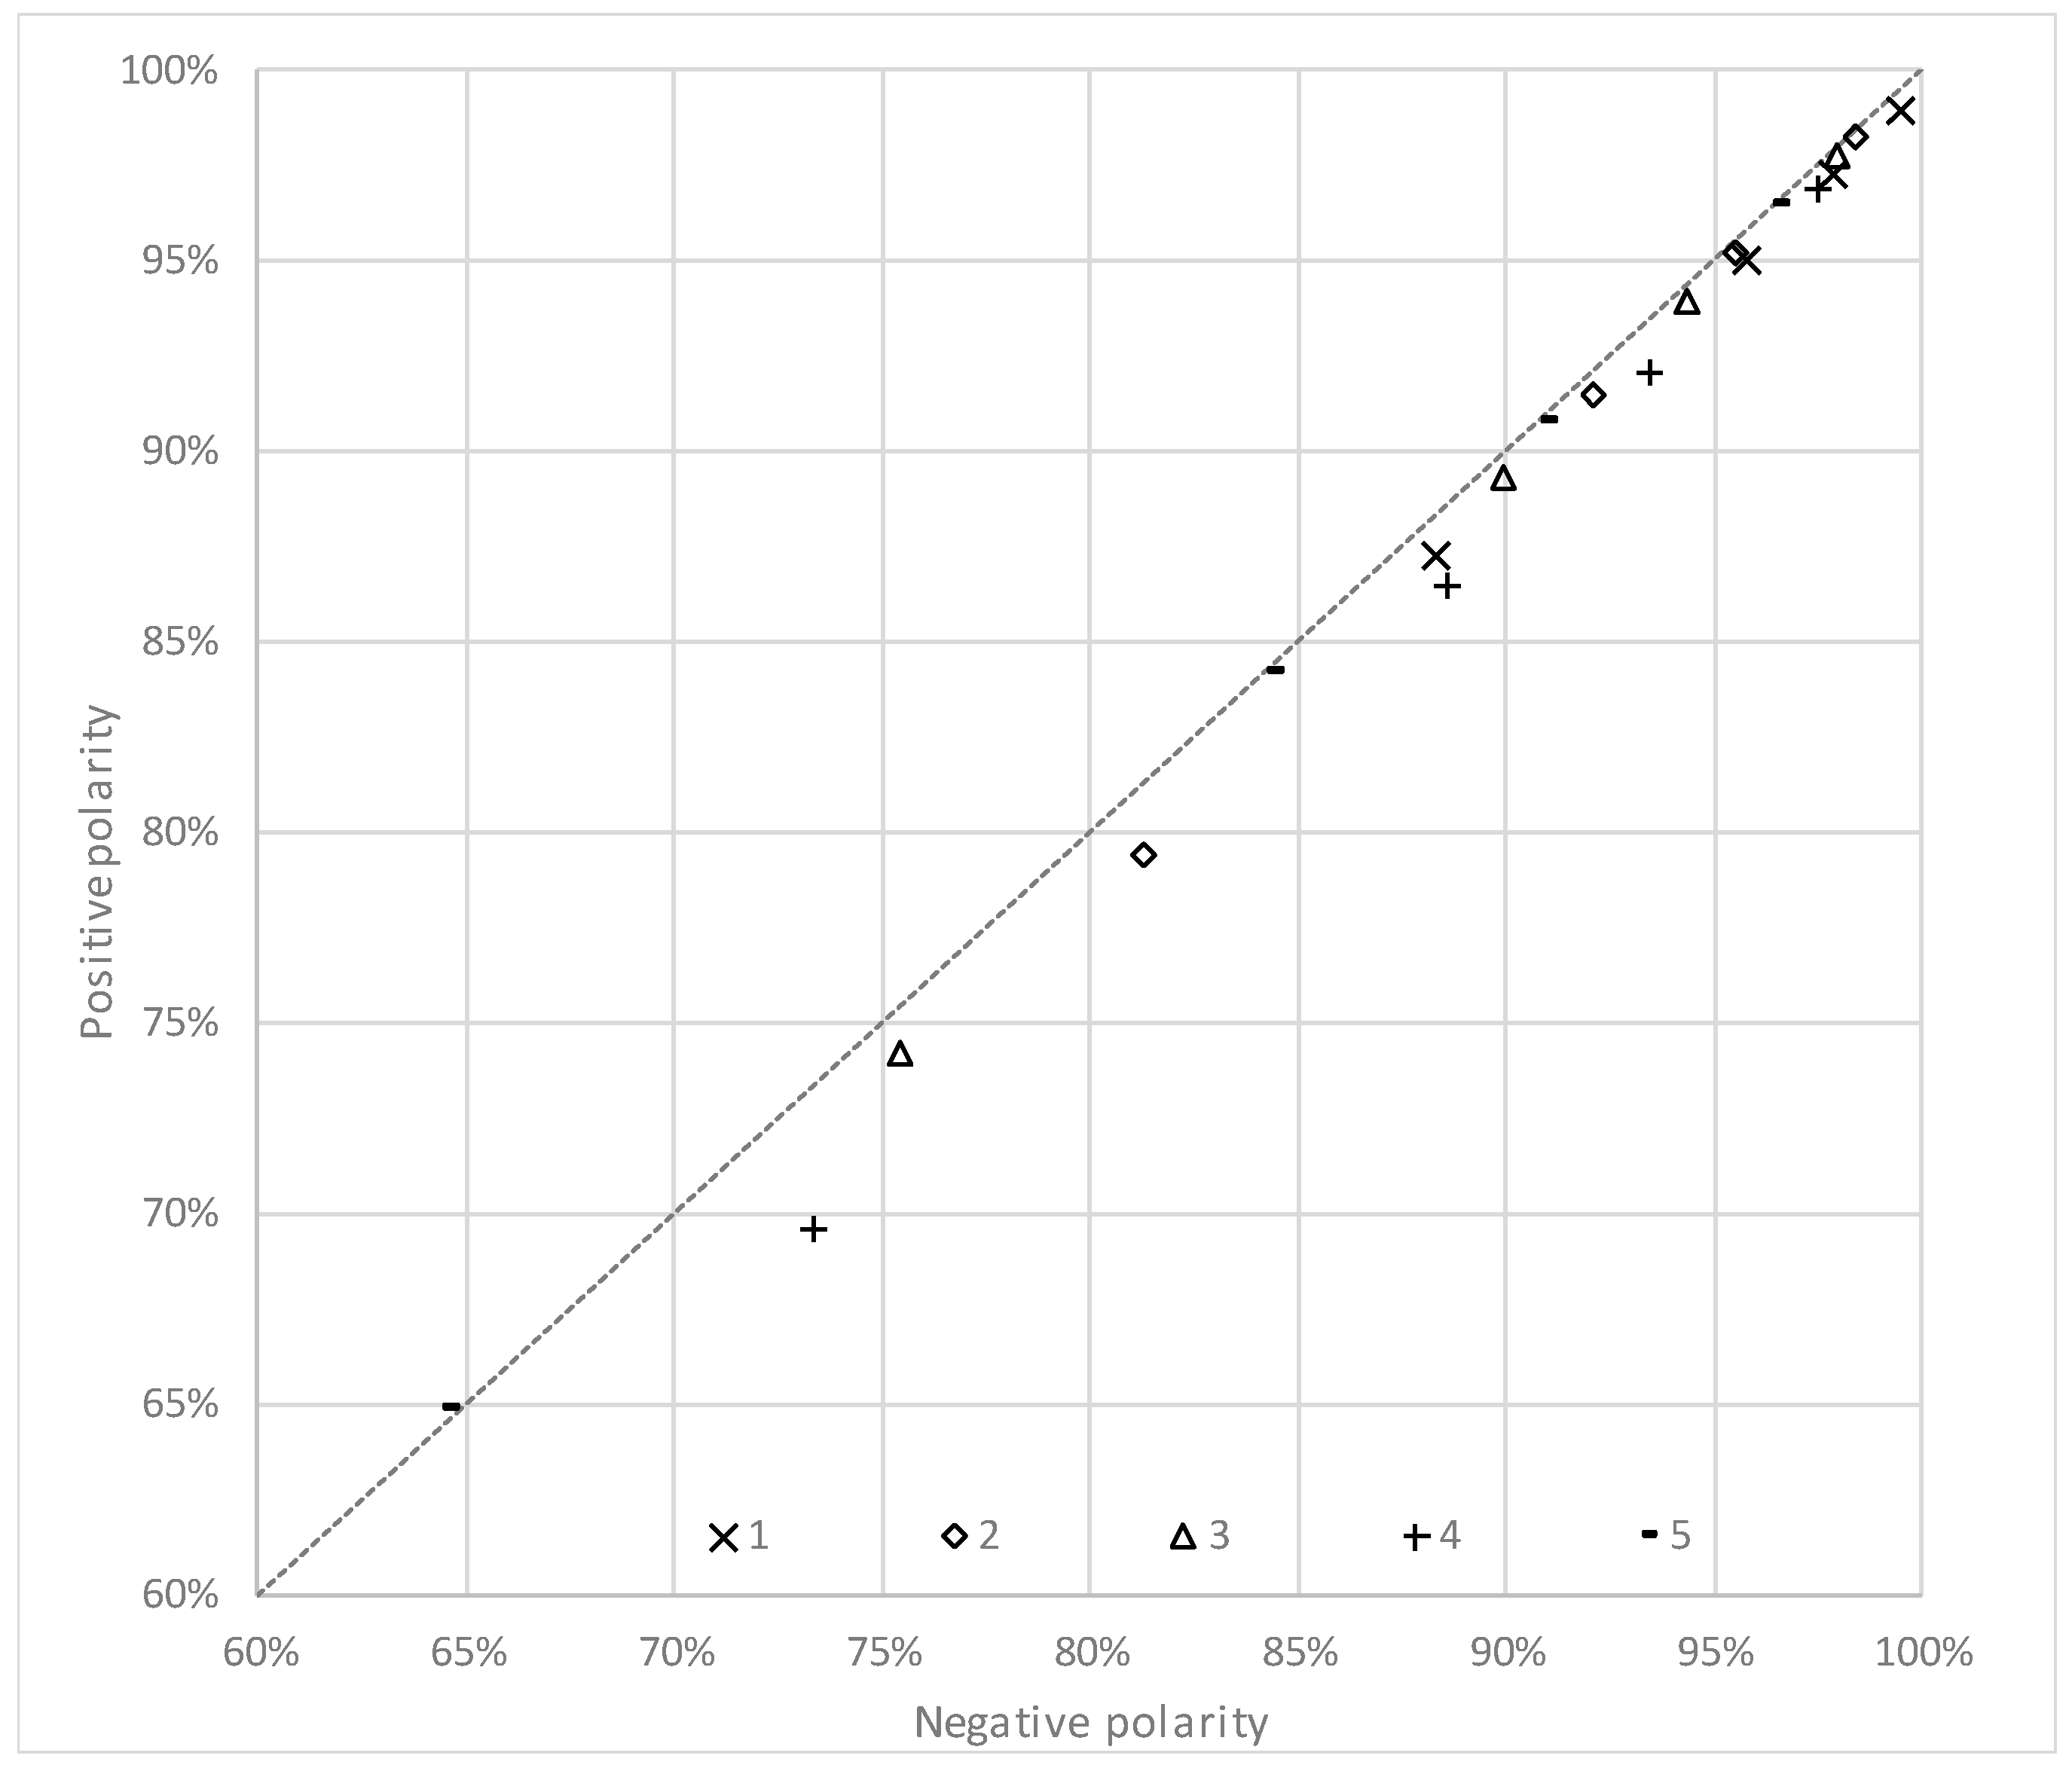
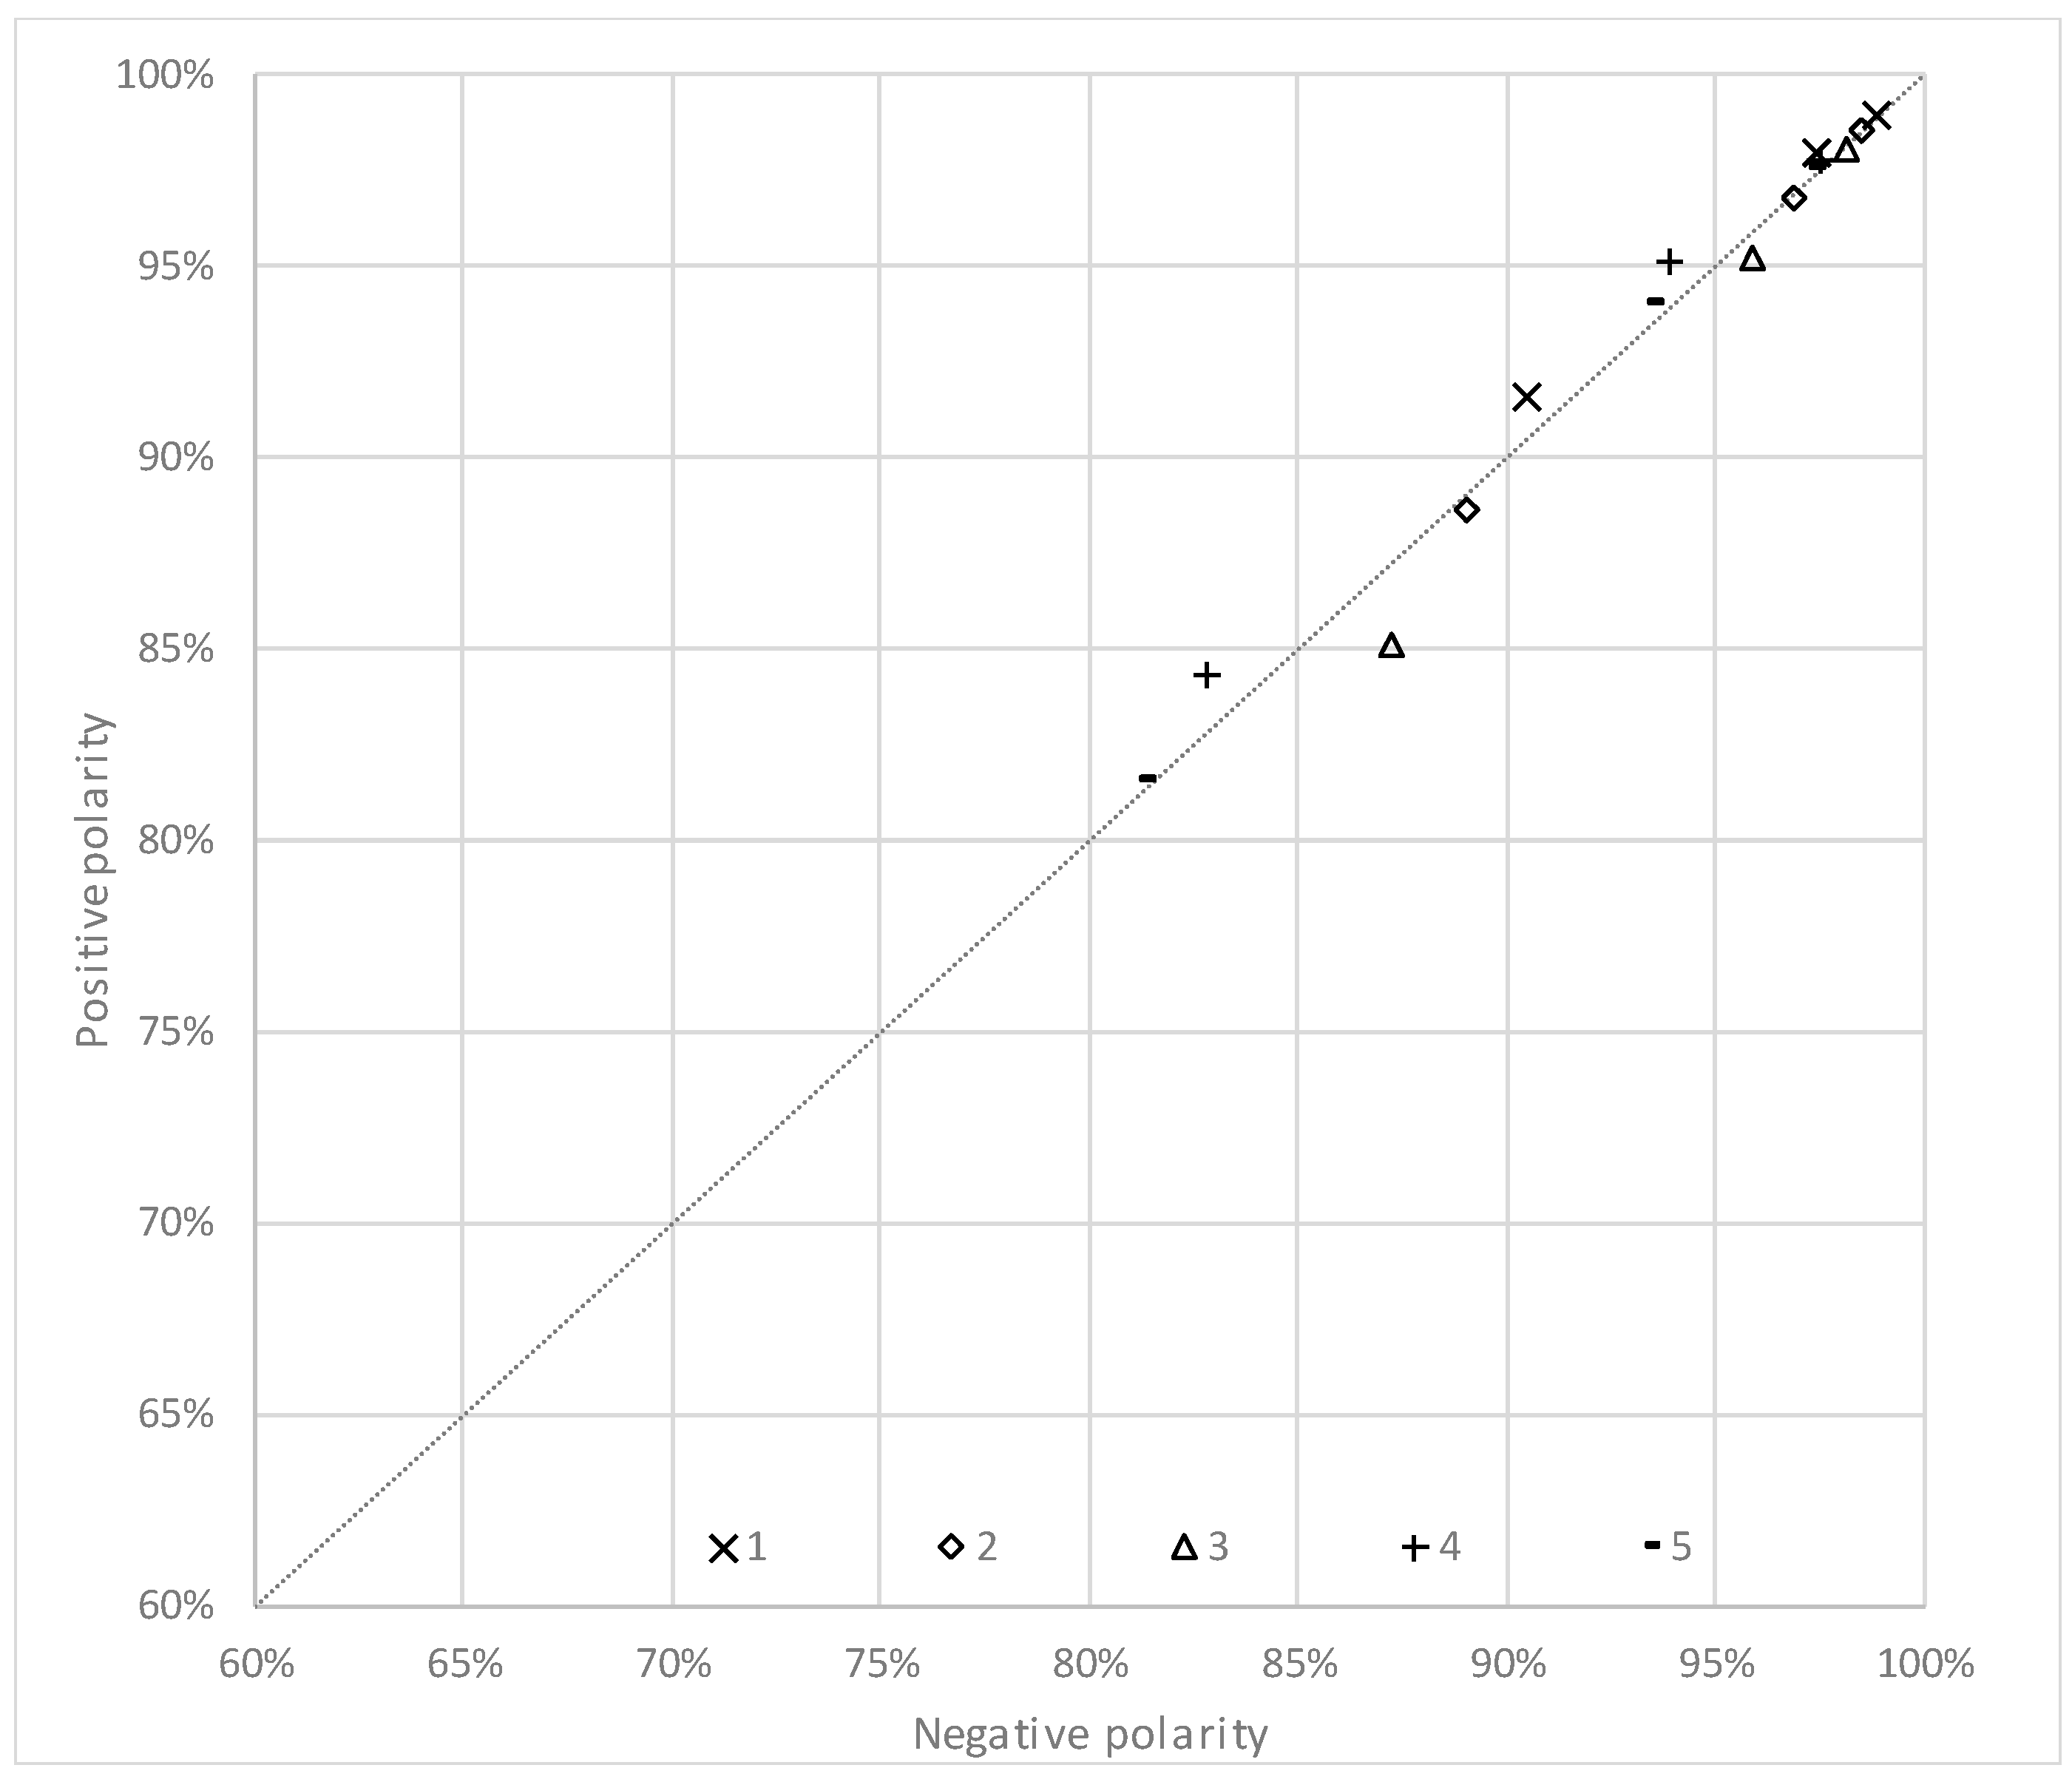
| Size | Negative Polarity | Positive Polarity | ||||
|---|---|---|---|---|---|---|
| (µm) | Model | Replica 2 | Replica 3 | Model | Replica 2 | Replica 3 |
| 3350 | 61.54% | 65.94% | 63.61% | 63.24% | 61.95% | 64.68% |
| 2000 | 77.29% | 80.73% | 79.70% | 78.62% | 79.42% | 79.74% |
| 1000 | 87.03% | 89.31% | 88.67% | 88.17% | 88.20% | 88.42% |
| 500 | 92.59% | 93.69% | 93.12% | 93.39% | 92.88% | 93.04% |
| 125 | 97.62% | 98.09% | 97.85% | 97.97% | 97.81% | 97.92% |
| Monosize | Negative Polarity | Positive Polarity | ||
|---|---|---|---|---|
| (µm) | Among Replicas | Model/Real | Among Replicas | Model/Real |
| 5000/3350 | 0.9088 | 0.8724 | 0.8876 | 0.9777 |
| 3350/2000 | 0.9974 | 0.9789 | 0.9995 | 0.9561 |
| 2000/1000 | 0.9833 | 0.9802 | 0.9943 | 0.9825 |
| 1000/500 | 0.9928 | 0.9919 | 0.9920 | 0.9836 |
| 500/125 | 0.9891 | 0.8543 | 0.9218 | 0.9868 |
Publisher’s Note: MDPI stays neutral with regard to jurisdictional claims in published maps and institutional affiliations. |
© 2022 by the authors. Licensee MDPI, Basel, Switzerland. This article is an open access article distributed under the terms and conditions of the Creative Commons Attribution (CC BY) license (https://creativecommons.org/licenses/by/4.0/).
Share and Cite
Llera, A.R.; Díaz, A.; Pedrayes, F.J.; Menéndez-Aguado, J.M.; Melero, M.G. Study of Comminution Kinetics in an Electrofragmentation Lab-Scale Device. Metals 2022, 12, 494. https://doi.org/10.3390/met12030494
Llera AR, Díaz A, Pedrayes FJ, Menéndez-Aguado JM, Melero MG. Study of Comminution Kinetics in an Electrofragmentation Lab-Scale Device. Metals. 2022; 12(3):494. https://doi.org/10.3390/met12030494
Chicago/Turabian StyleLlera, Angel R., Ana Díaz, Francisco J. Pedrayes, Juan M. Menéndez-Aguado, and Manuel G. Melero. 2022. "Study of Comminution Kinetics in an Electrofragmentation Lab-Scale Device" Metals 12, no. 3: 494. https://doi.org/10.3390/met12030494
APA StyleLlera, A. R., Díaz, A., Pedrayes, F. J., Menéndez-Aguado, J. M., & Melero, M. G. (2022). Study of Comminution Kinetics in an Electrofragmentation Lab-Scale Device. Metals, 12(3), 494. https://doi.org/10.3390/met12030494