Article

Contour Maps for Simultaneous Increase in Yield Strength and Elongation of Hot Extruded Aluminum Alloy 6082

1
Department for Materials and Metallurgy, Faculty for Natural Sciences and Engineering, University of Ljubljana, Aškerčeva 12, SI-1000 Ljubljana, Slovenia
2
Faculty of Civil Engineering, Transportation Engineering and Architecture, University of Maribor, Smetanova 17, SI-2000 Maribor, Slovenia
3
Department for Physics and Chemistry of Materials, The Institute of Metals and Technology, Lepi pot 11, SI-1000 Ljubljana, Slovenia
*
Author to whom correspondence should be addressed.
Metals 2022, 12(3), 461; https://doi.org/10.3390/met12030461
Submission received: 28 January 2022 / Revised: 3 March 2022 / Accepted: 7 March 2022 / Published: 9 March 2022
(This article belongs to the Special Issue Application of Neural Networks in Processing of Metallic Materials)

Abstract

:
In this paper, the Conditional Average Estimator artificial neural network (CAE ANN) was used to analyze the influence of chemical composition in conjunction with selected process parameters on the yield strength and elongation of an extruded 6082 aluminum alloy (AA6082) profile. Analysis focused on the optimization of mechanical properties as a function of casting temperature, casting speed, addition rate of alloy wire, ram speed, extrusion ratio, and number of extrusion strands on one side, and different contents of chemical elements, i.e., Si, Mn, Mg, and Fe, on the other side. The obtained results revealed very complex non-linear relationships between all of these parameters. Using the proposed approach, it was possible to identify the combinations of chemical composition and process parameters as well as their values for a simultaneous increase of yield strength and elongation of extruded profiles. These results are a contribution of the presented study in comparison with published research results of similar studies in this field. Application of the proposed approach, either in the research and/or in industrial aluminum production, suggests a further increase in the relevant mechanical properties.

1. Introduction

AA6082 aluminum alloy is used for highly stressed structural elements’ applications in structures, such as trusses, bridges, cranes, and as other elements in the automotive industry. Especially in the automotive industry, more and more lightweight components are required to produce lighter vehicles with lower fuel consumption and emissions. Therefore, the simultaneous improvement of the relevant mechanical properties, i.e., yield strength and ductility (elongation), is very important [1,2].
The 6XXX series aluminum alloys contain Si and Mg as the main alloying elements. Other elements such as Fe, Mn, Cu, Cr, Ti, and B are also present in these alloys, either as additives or as impurities [3]. These elements have a great influence on strength by solid solution strengthening or forming intermetallic phases. The mechanical properties of aluminum alloys are closely related to the formation of intermetallic phases. Intermetallic phases form various complex eutectics, precipitates, and inclusions with specific crystallography, compositional morphology, size, shape, fraction, and distribution, all of which depend on both chemical composition and processing parameters [4,5,6,7,8,9]. Intermetallic compounds may dissolve, precipitate, or change their morphology and size during thermomechanical processing of these alloys at various steps, e.g., melt preparation, casting, solidification, homogenization, extrusion, aging, etc. [10,11]. Therefore, the process parameters and chemical composition have a complex influence on the final properties. In general, several mechanical properties, such as yield strength and elongation, are important in any alloy. Moreover, the increase of one property leads to the decrease of the other, and vice versa [12,13,14,15,16]. This means that improvement of mechanical properties such as yield strength and elongation can be achieved by revealing the spatial influences of chemical composition in relation to process parameters on mechanical properties. It is particularly important to show the relationships and conditions under which a simultaneous increase in yield strength and elongation can be achieved, which is not common in published research.
Large amounts of data are collected in the industry during the production of hot extruded AA alloys. These data can be analyzed using artificial intelligence methods, which are now widely used in many fields [17,18]. For the analysis of complex influences of chemical composition and process parameters on mechanical properties, where a sufficiently large database can be collected, the artificial neural network-based methods are particularly suitable [19,20,21,22,23]. In the present work, the Conditional Average Estimator artificial neural network (CAE ANN), which belongs to the probabilistic types of neural networks, was used for the analysis.

2. Materials and Methods

2.1. Description of AA6082

In the present study, the aluminum alloy (AA) 6082 was used for the analysis. The chemical composition and its allowable range of variation are presented in Table 1. During solidification, intermetallic compounds such as Al-Fe, Al-Fe-Si, Al-Fe-Mn-Si, and Mg-Si are formed via a series of eutectic and complex ternary and quaternary eutectic reactions, e.g., L→α-Al + β-Al_5 FeSi + Mg2Si [24]. The literature review shows that the most common intermetallic phases are β-Al5FeSi, α-Al(FeMn)Si, and Mg2Si. However, other phases such as Al9Mn3Si, α-Al12Fe3Si, α-Al15(FeMn)3Si, and π-Al8Si6Mg3Fe can also be found, as reported in [25]. The following step of alloy preparation, i.e., the process of homogenization, dissolves the Mg2Si phase and transforms the insoluble iron-based intermetallic into sphere-like particles that are less detrimental to the plastic properties of AAs [24,25]. AA6082 is precipitation hardened by β^’’ (Mg2Si) phase precipitation. The β^’’ phase is one of the metastable phases formed from supersaturated solid solution (SSSS) during the aging process and is the most effective hardening phase [26,27]. Metallographic examination of the deformed microstructure in Figure 1 shows a band of intermetallic phases oriented in the extrusion direction. Wavelength dispersive X-ray spectroscopy (WDS) analysis showed that the particles are mainly based on Mg-Si and Al-Fe-Si-Mn.

2.2. Conditional Average Estimator Artificial Neural Network (CAE ANN)

The statistical model presented in this paper is typically derived from the observed and/or measured data and represents a special class of mathematical models. Since it is non-deterministic, some or all of its variables do not have specific values, but instead have probability distributions (i.e., some or all of the variables are of a random nature). Basically, all of the phenomena in aluminum production are of a random nature, but due to the complexity, they are often treated as simplistic by applying the deterministic approach. The influence of chemical composition and process parameters during production on the final mechanical parameters of aluminum alloy can be determined by measuring N samples during the production process. The mathematical description of the observation of one sample is then called a model vector. As a result, the whole phenomenon (e.g., production of aluminum alloy) can be described by a finite set of model vectors [28]:
{ Z 1 ,   ,       Z n ,   ,   Z N }
It is assumed that the observation of one particular sample can be described by a number of variables, which are treated as components of a model vector:
Z n = { x n 1 ,   ,   x n l ,   ,   x n D ; y n 1 ,   ,   y n k ,   , y n M }
The vector Z n can be further composed of two truncated vectors, Xn and Yn:
X n = { x n 1 ,   ,   x n l ,   ,   x n D }   and   Y n = { y n 1 ,   ,   y n k ,   , y n M }
X n is complementary to vector Y n and therefore their concatenation yields the complete data model, vector Z n . The prediction vector, too, is composed of two truncated vectors, i.e., the given truncated vector and the unknown complementary vector:
X = { x 1 ,   ,   x l ,   ,   x D }   and   Y ^ = { y ^ 1 ,   ,   y ^ k ,   , y ^ M }
The problem now is how an unknown complementary vector Y ^ can be estimated from a given truncated vector X and the model vectors { Z 1 ,   ,   Z n ,   ,   Z N } . For example, how the yield strength ( y ^ 1 ) and/or elongation ( y ^ 2 ) can be estimated from known input parameters (process parameters, i.e., extrusion ratio ( x 1 ) and/or casting speed ( x 2 ), and chemical composition, i.e., wt.% Mn ( x 3 ) and/or wt.% Si ( x 4 )). It turns out that the optimal estimation of Y ^ can be determined by using the Gaussian function as a weight function [29]:
a n = e x p ( l = 1 D ( x l x n l ) 2 2 w 2 ) ( 2 π ) D 2   w D
which is centered at each n-th model vector, to obtain the influence of the n-th model vector at the point of the prediction vector. Components of the unknown complementary vector Y ^ are finally obtained by the expression:
y ^ k = n = 1 N A n · y n k
where A n is determined as:
A n = a n i = 1 N a i
In the presented application of CAE ANN, a non-constant value of w yields more reasonable results than a constant value [29]. The width, w, varies with the input parameters (dimensions). For this case, Equation (5) can be rewritten as:
a n = e x p ( l = 1 D ( x l x n l ) 2 2 w n l 2 ) ( 2 π ) D 2   π l = 1 D w n l
where different values of w n l correspond to the l-th input parameter for each model vector ( Z n ) from the database. The values wmin = 0.15 and wmax = 0.25 were used in the analyses in this article. In this case, wmin and wmax refer to values that change linearly along sections of the problem space in the directions of each (l-th) input parameter, and are described in detail in the appendix of [29].
Equation (9) calculates the intermediate result in the computational process and describes the influence of all samples and how well they are spread over the problem space:
ρ ^ = 1 N i = 1 N a i
Consequently, it can be reasonably assumed that this result describes the accuracy of the prediction. The higher the number, the more reliable the prediction, and vice versa.
The results in this study are based entirely on the presented approach, which involves the use of the final Equations (5)–(9). They are presented graphically as contour maps, usually, unless otherwise specified, with a first variable representing the process parameter on the horizontal x-axis and a second variable representing the content of the chemical element in wt.% on the vertical y-axis. There are two types of values in any contour map, namely the yield strength or elongation and the corresponding probability density function, ρ ^ . The reliability of prediction usually has values in the range of 0.5 to 5 or more. The lower the value of ρ ^ , the grayer the area becomes, and consequently the predictions in the shaded areas are less reliable. The values for yield strength and elongation, where the reliability is less than 0.5, are generally less accurate.
CAE ANN is a special type of probabilistic neural network [28,30]. Its structure and functioning can be formulated and represented similarly to any other back-propagation neural network: Each model vector represents one CAE ANN neuron. CAE ANN has one hidden layer. The weights are calculated according to Equation (7). The training corresponds to the learning process, which in the proposed application corresponds to the determination of the smoothness parameter (wmin and wmax) that minimizes the error between the predicted and the actual output value for yield strength and/or elongation. Note that the so-called “leave-one-out” approach was used. In this case, it is not necessary to split the data between training and verification sets. The value of the smoothing parameter was intentionally chosen to be (slightly) larger than the mathematically optimal value. This leads to much smoother solutions, which are therefore much easier to explain, but it comes at the cost of a slightly higher learning error than minimal (up to about 3%).

2.3. Formation of the Database

The database was collected at Impol company in different stages of production, which includes continuous casting, homogenization, extrusion, and finally, ageing. The collected database consists of 3968 model vectors containing data on process parameters (e.g., casting speed, addition rate of AlTi5B1 wire, etc.) and the chemical composition of selected elements (e.g., Fe, Si, etc.) as input parameters. As output parameters, yield strength and elongation were used. Process parameters considered in the analyses are ram speed, extrusion ratio, number of strands during extrusion, casting speed, addition rate of AlTi5B1 wire, and casting temperature (Table 2). The minimum, maximum, and average values of chemical content for Fe, Si, Mn, and Mg are shown in Table 3, while Table 4 shows the minimum, maximum, and average values of yield strength and elongation.

3. Results of Multidimensional Analysis by CAE NN

The results of up to 113 different spatial (multidimensional) analyses differ from each other in complexity. However, the majority of the results on the influences of different contents of chemical elements and process parameters on yield strength and elongation are very complex. The obtained results, i.e., the relationships between input and output parameters, can be divided into two groups, as follows. The first group includes the results of relationships where, by changing the values of the input parameters, it is possible to simultaneously increase one property (e.g., yield strength) and decrease the other property (e.g., elongation). This type of relationship between yield strength and elongation has been found in various analyses in the literature [19,21]. The second group includes results of analyses in which the change in the values of the input parameters leads to a simultaneous increase in yield strength and elongation.
The results of the analyses of the different relations are summarized in Table 5 for the first group and in Table 6 for the second group. The latter corresponds to the simultaneous increase of the two relevant mechanical properties.
Due to the large number of analyses, not all results are included in these two tables. It is mainly above-average output properties (see Table 4) in the area of high predictive reliability that are presented and discussed. There are different markings in the tables—the up arrow means the increase of the input parameter, the down arrow means the decrease of the input parameter, and the const. mark means a constant value of the input parameter. Most of the results discussed in this article are presented graphically as contour maps. Different regions/areas of interest in each contour map are marked with rounded rectangles, which are also marked with arrows indicating an increase or decrease in the observed mechanical property.
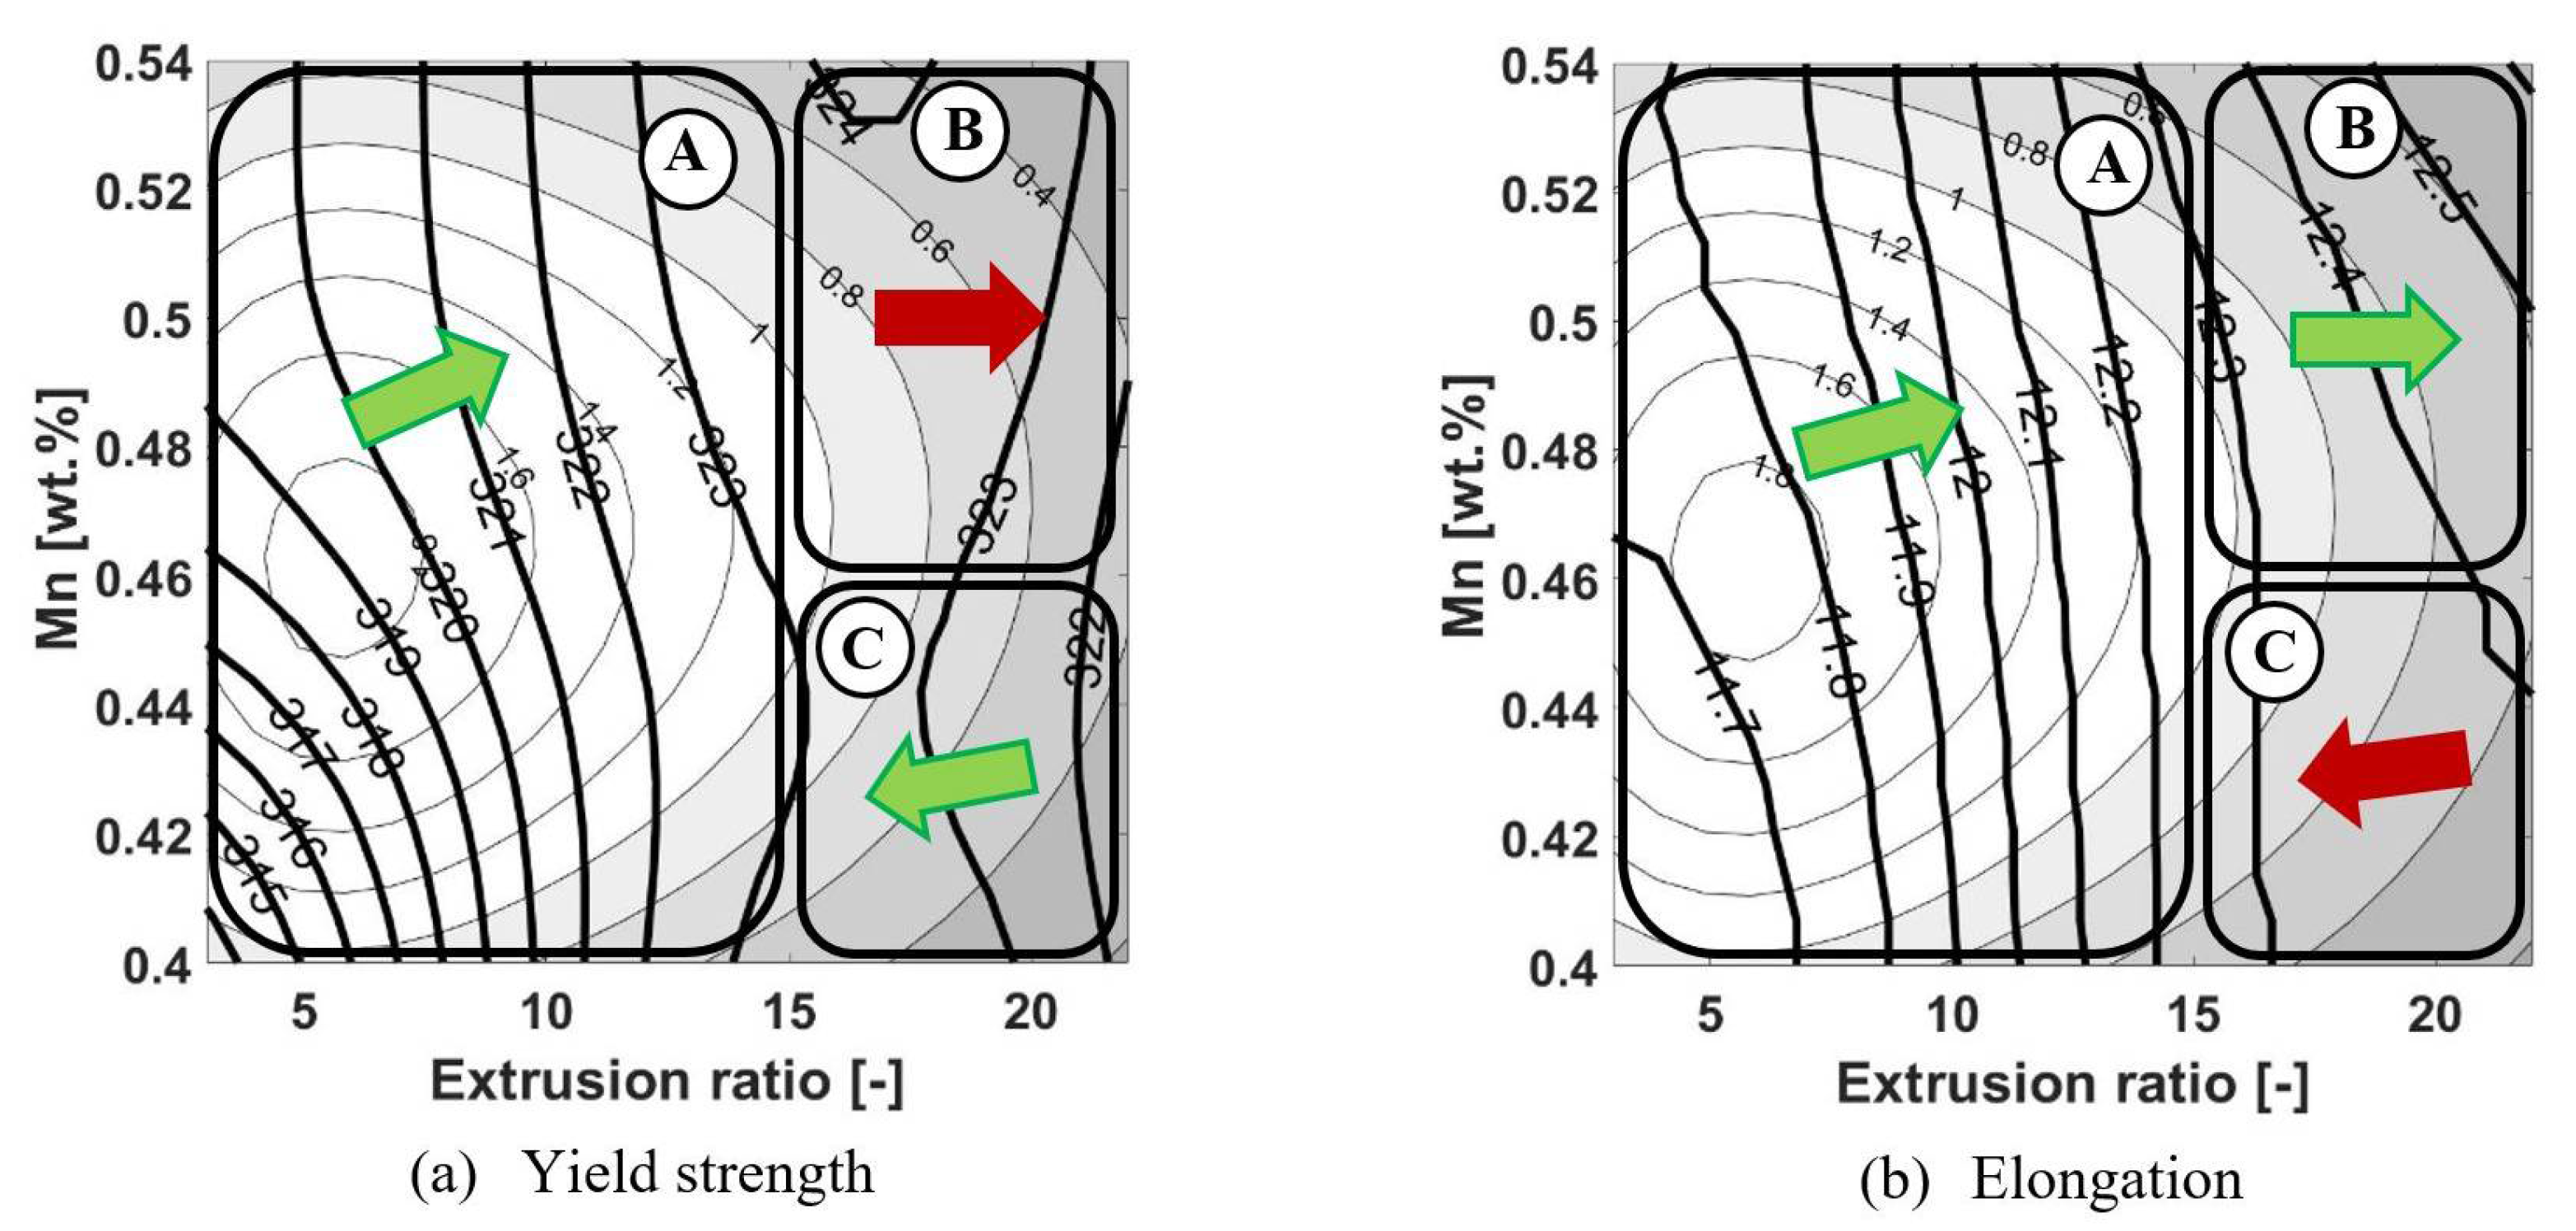
Based on the results of the analyses, each contour map often contains both groups of relationships, as can be seen in Figure 2. Area A in Figure 2 shows the second group of relationships, in which increasing the value of the extrusion ratio at constant Mn content led to a simultaneous increase in the values of yield strength (Figure 2a) and elongation (Figure 2b).
Area B in Figure 2 shows the first group of relationships—as values for extrusion ratio and Mn content increase, values for yield strength decrease (Figure 2a) and values for elongation increase (Figure 2b). The simultaneous increase in yield strength (Figure 2a) and elongation (Figure 2b) with decreasing values for extrusion ratio and constant Mn content can be seen in the C region. However, an important aspect of the analysis is also the prediction reliability: it can be seen from Figure 2 that areas B and C have low prediction reliability at higher values for the extrusion ratio.

3.1. Relationships in Which One Property Predominantly Increases and the Other Decreases

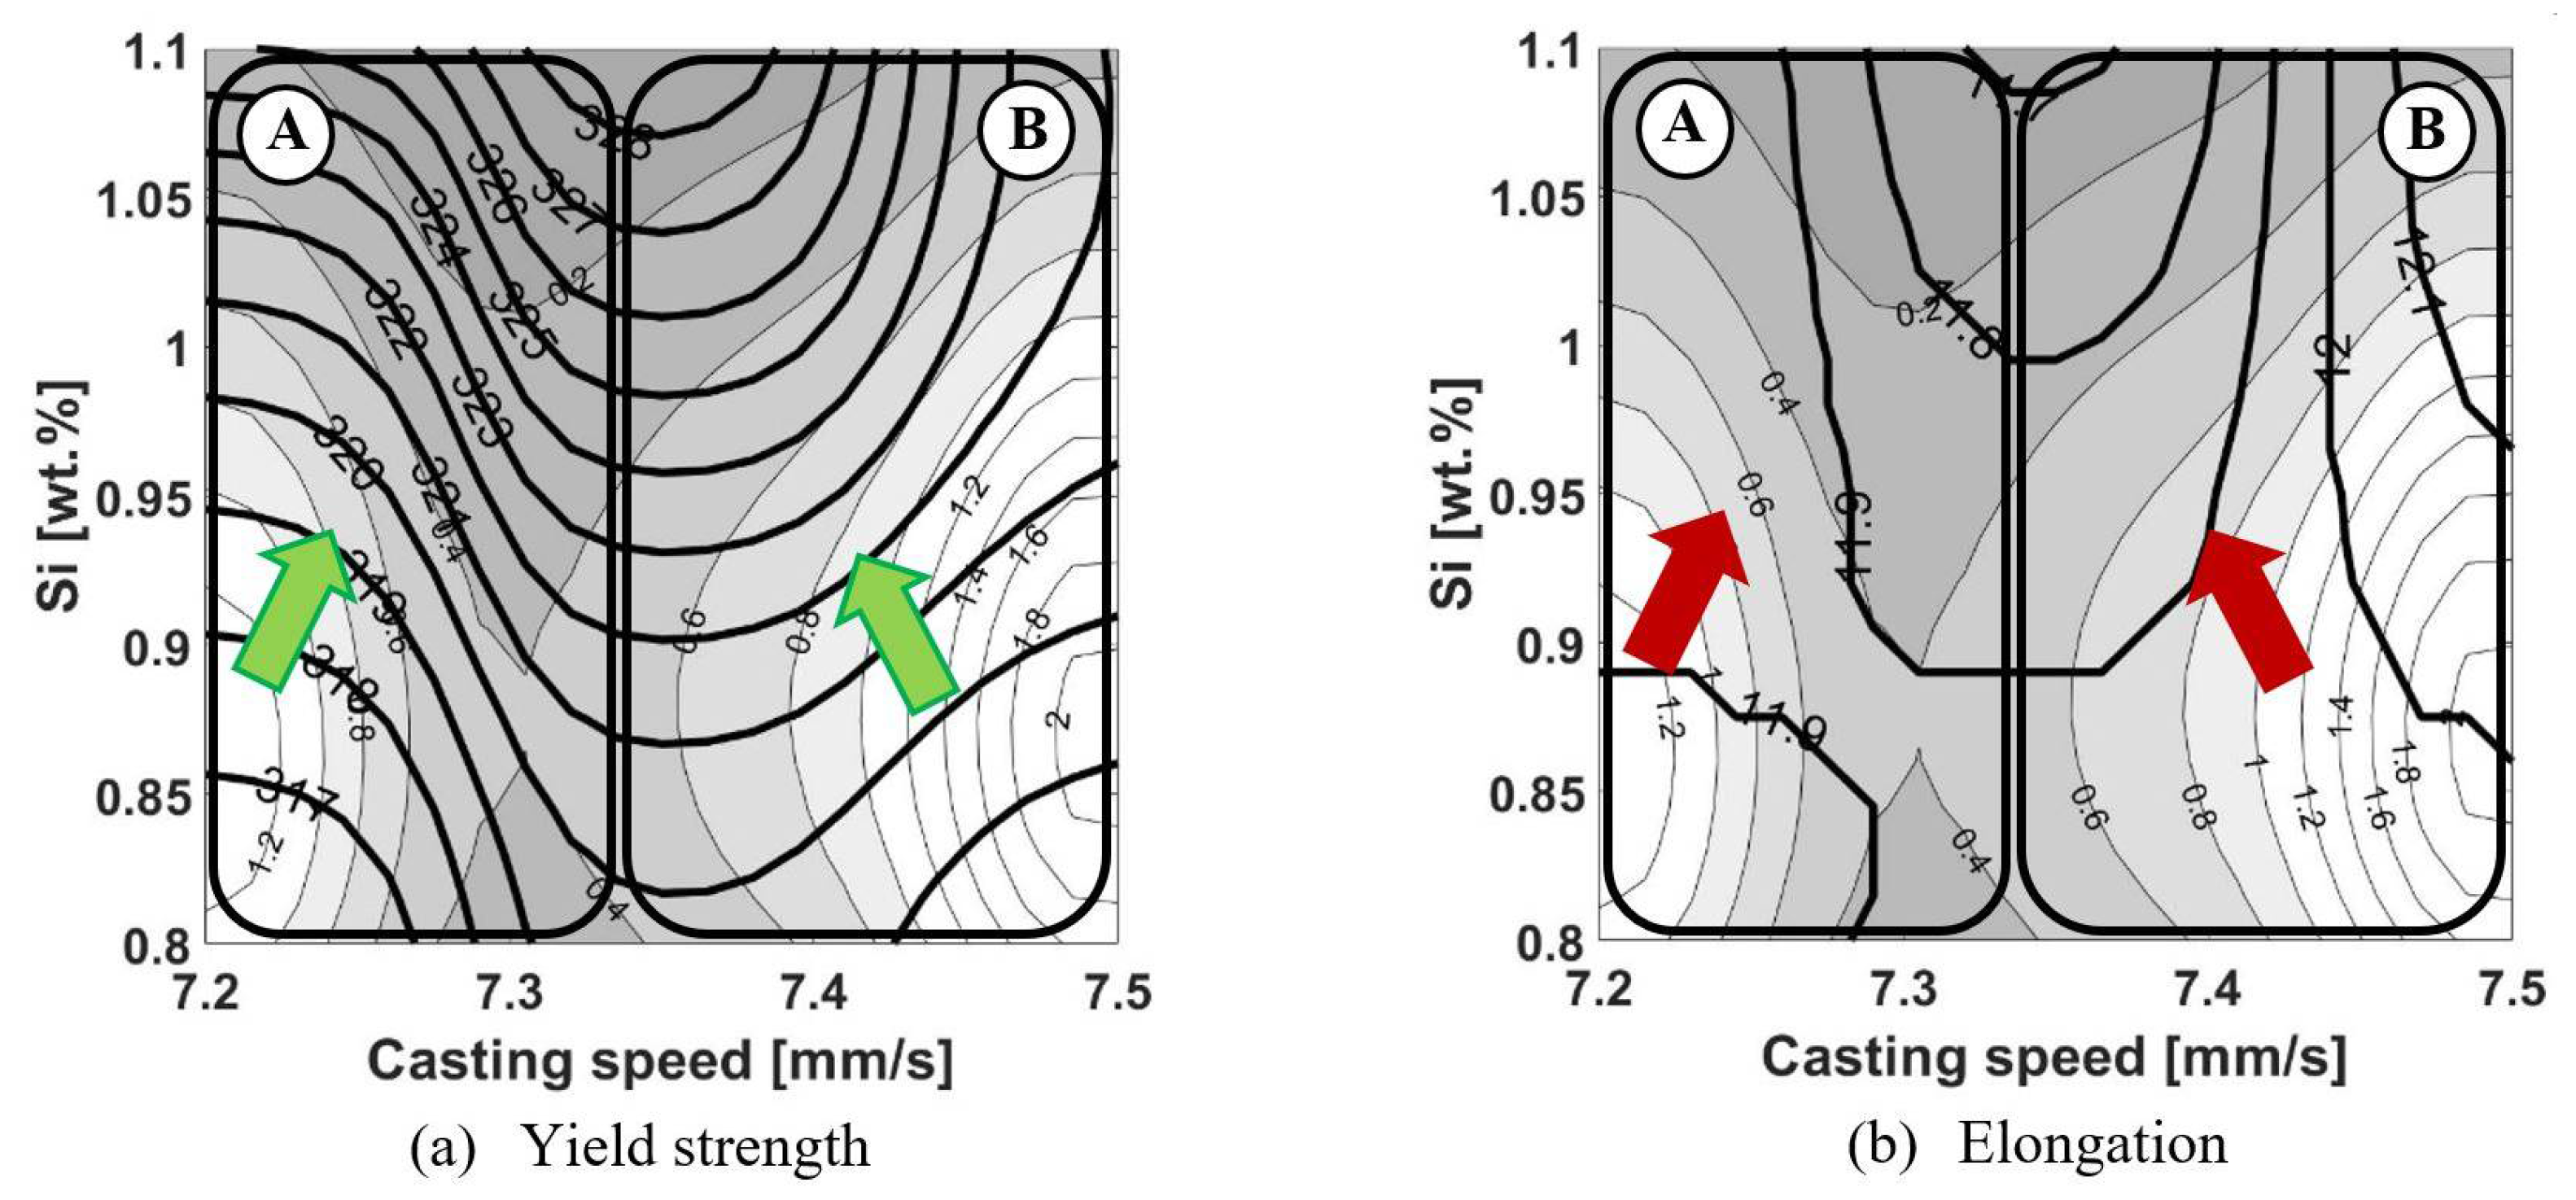
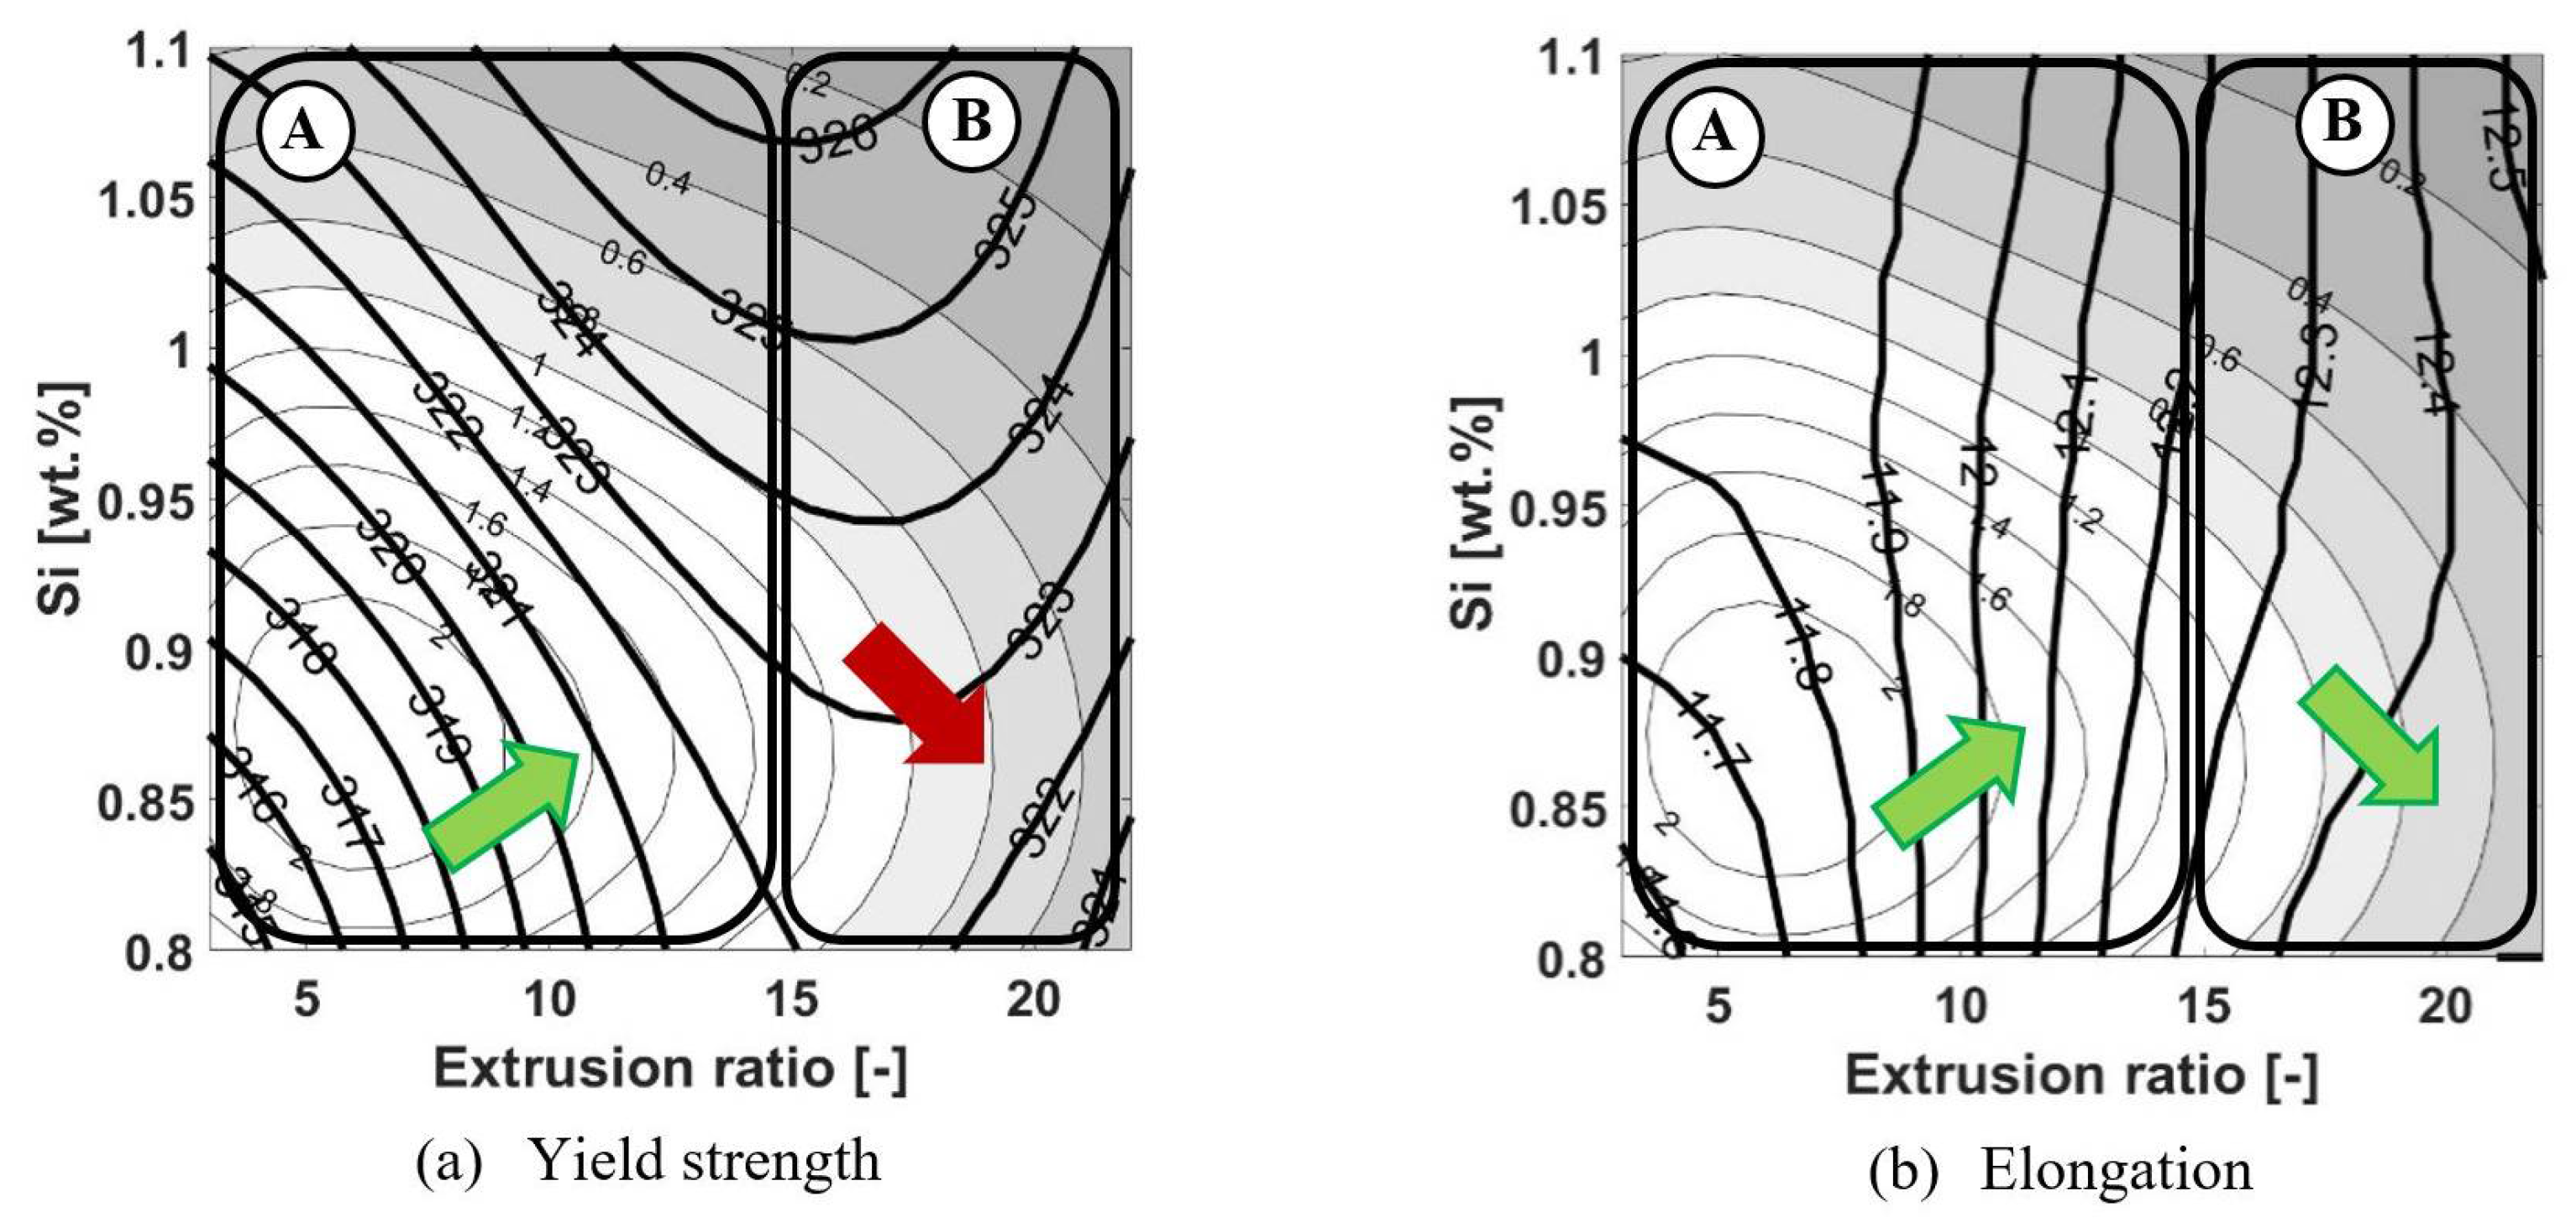
The first group of relationships are areas where, as the parameters change, one mechanical property (e.g., yield strength) decreases while the other (e.g., elongation) increases, or vice versa. Examples of such relationships can be found in Figure 2 in areas B and C, and in Figure 3 in areas A and B.
The values for yield strength (Figure 3a) generally increase (from 317 to 328 MPa) with the increasing Si content and increasing the value of casting speed from 7.2 to 7.33 mm/s (area A). For the same values of the influencing parameters, the elongation decreases from 11.9% to 11.7%. In area B, the values of yield strength generally increase (from 319 to 328 MPa) when the Si content increases and the value of casting speed decreases from 7.5 to 7.33 mm/s. For the same influencing parameters, elongation decreases from 12.1% to 11.7%. According to the reliability of the prediction, the stronger influence of elongation decrease in area B can be attributed to the lower casting speed.
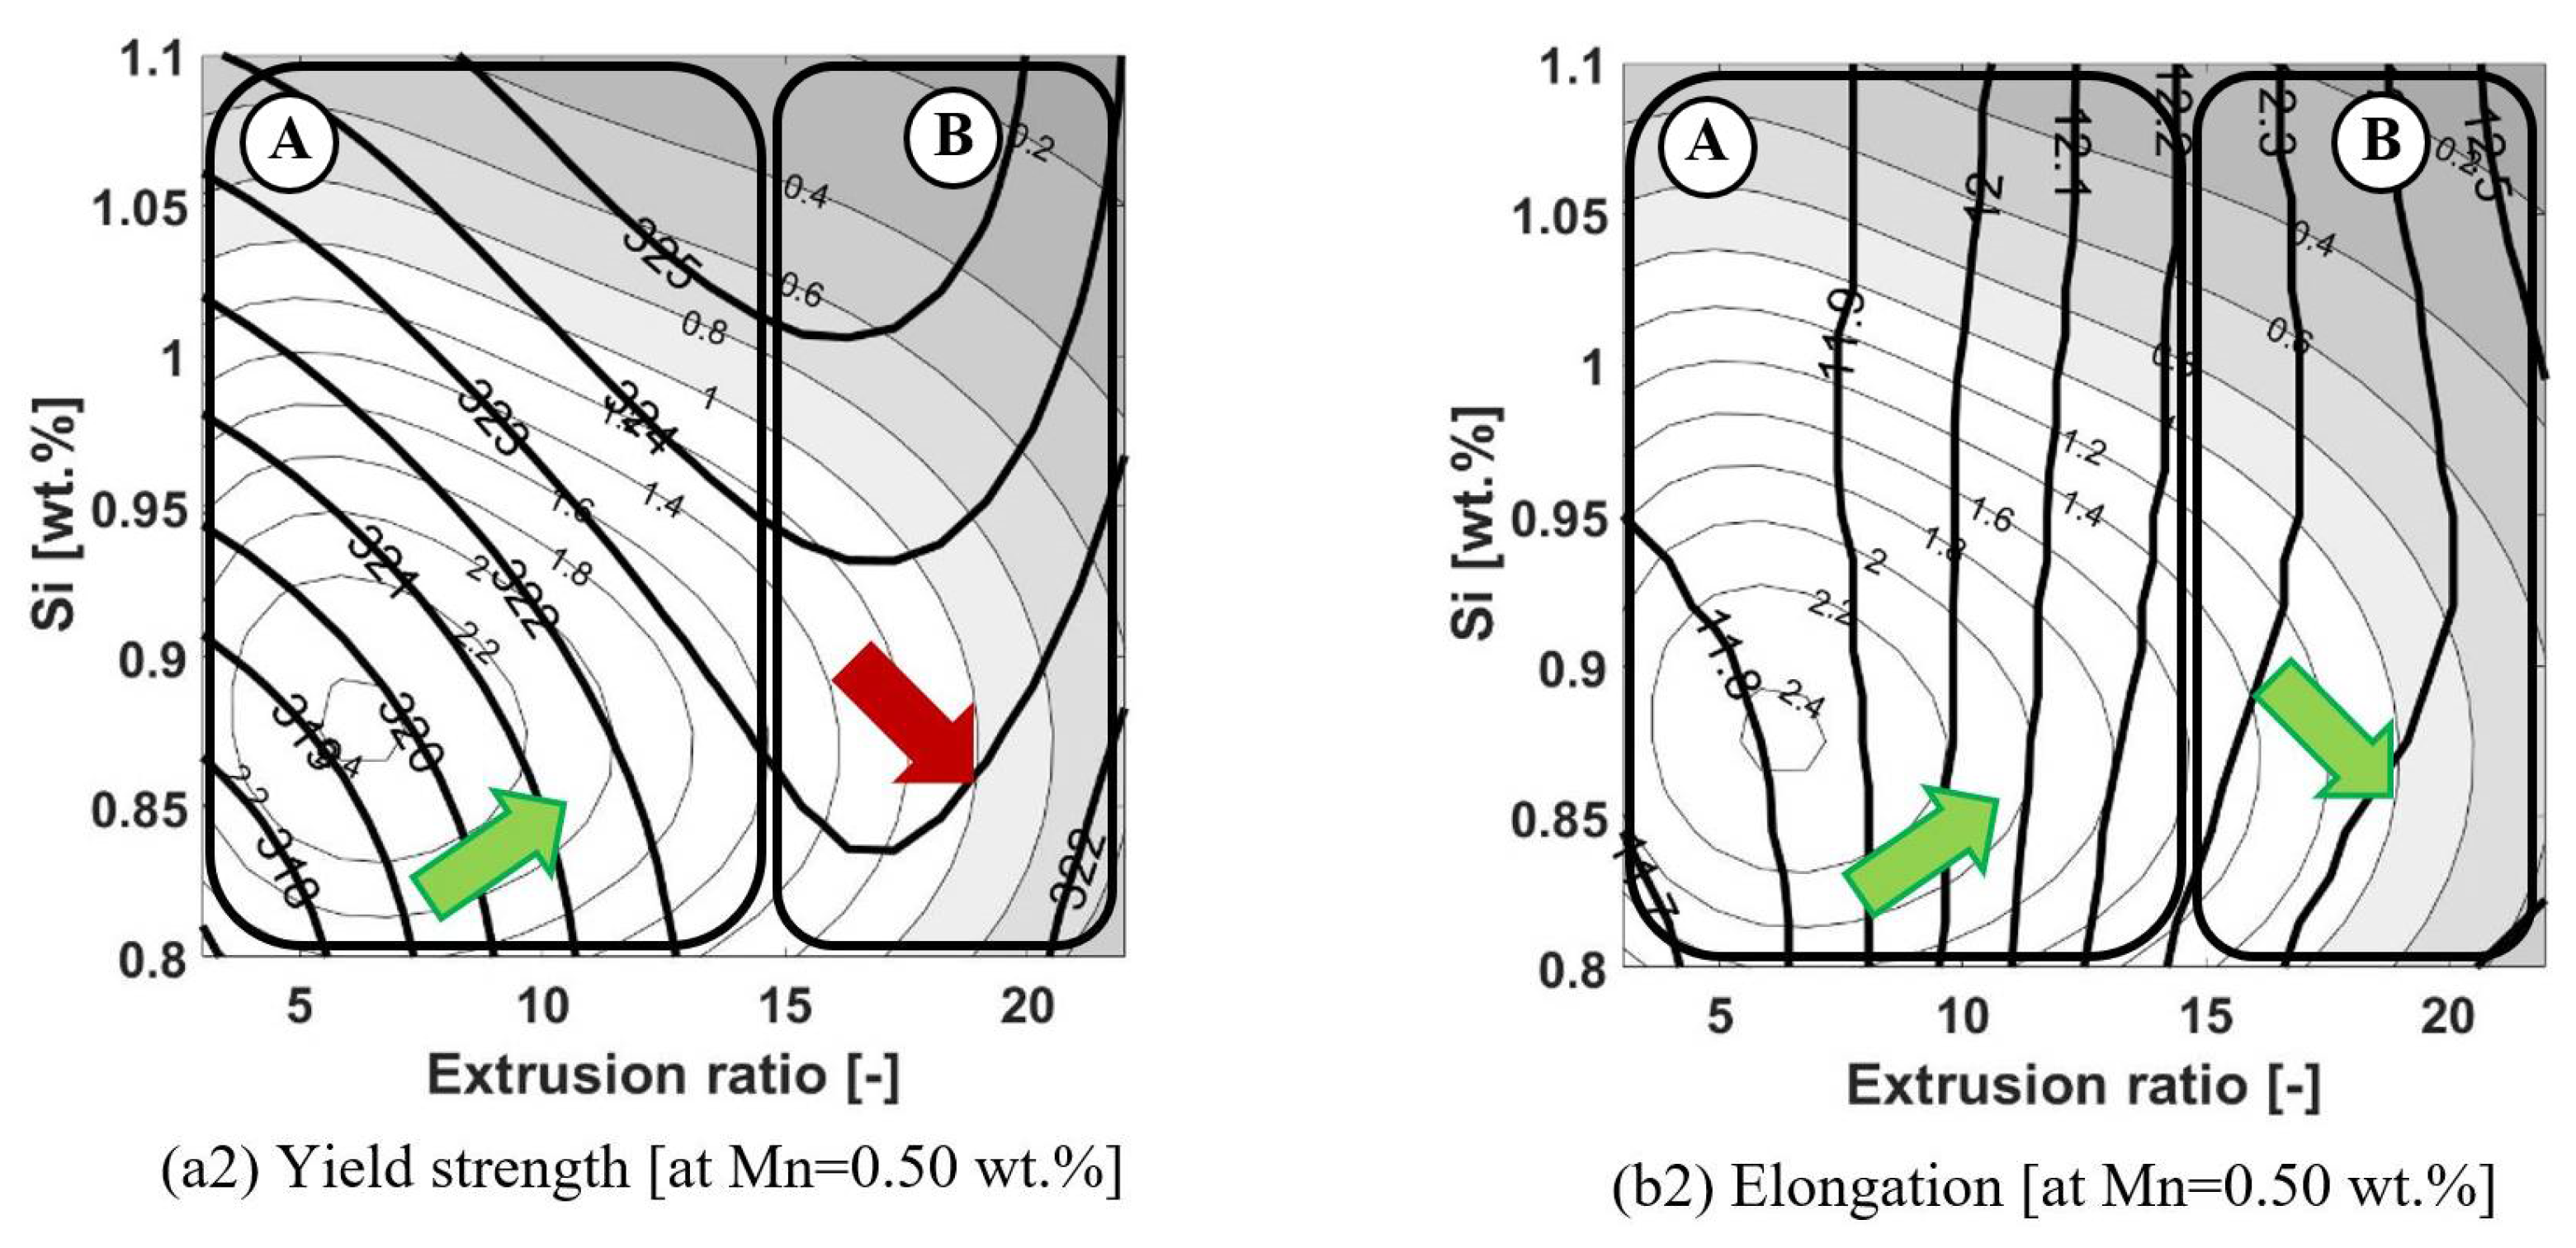
Another example of the first group can be seen in area B in Figure 4. In this area, the values for yield strength decrease from 326 to 321 MPa and the values for elongation increase from 12.2% to 12.5% for an extrusion ratio of 15 to 22 and a Si content of 0.8 to 1.0 wt.%. This result and the other results for the first set of relationships are summarized in Table 5, which shows the main influences between different chemical contents and selected process parameters.

3.2. Relationships with a Predominately Simultaneous Increase of Both Properties

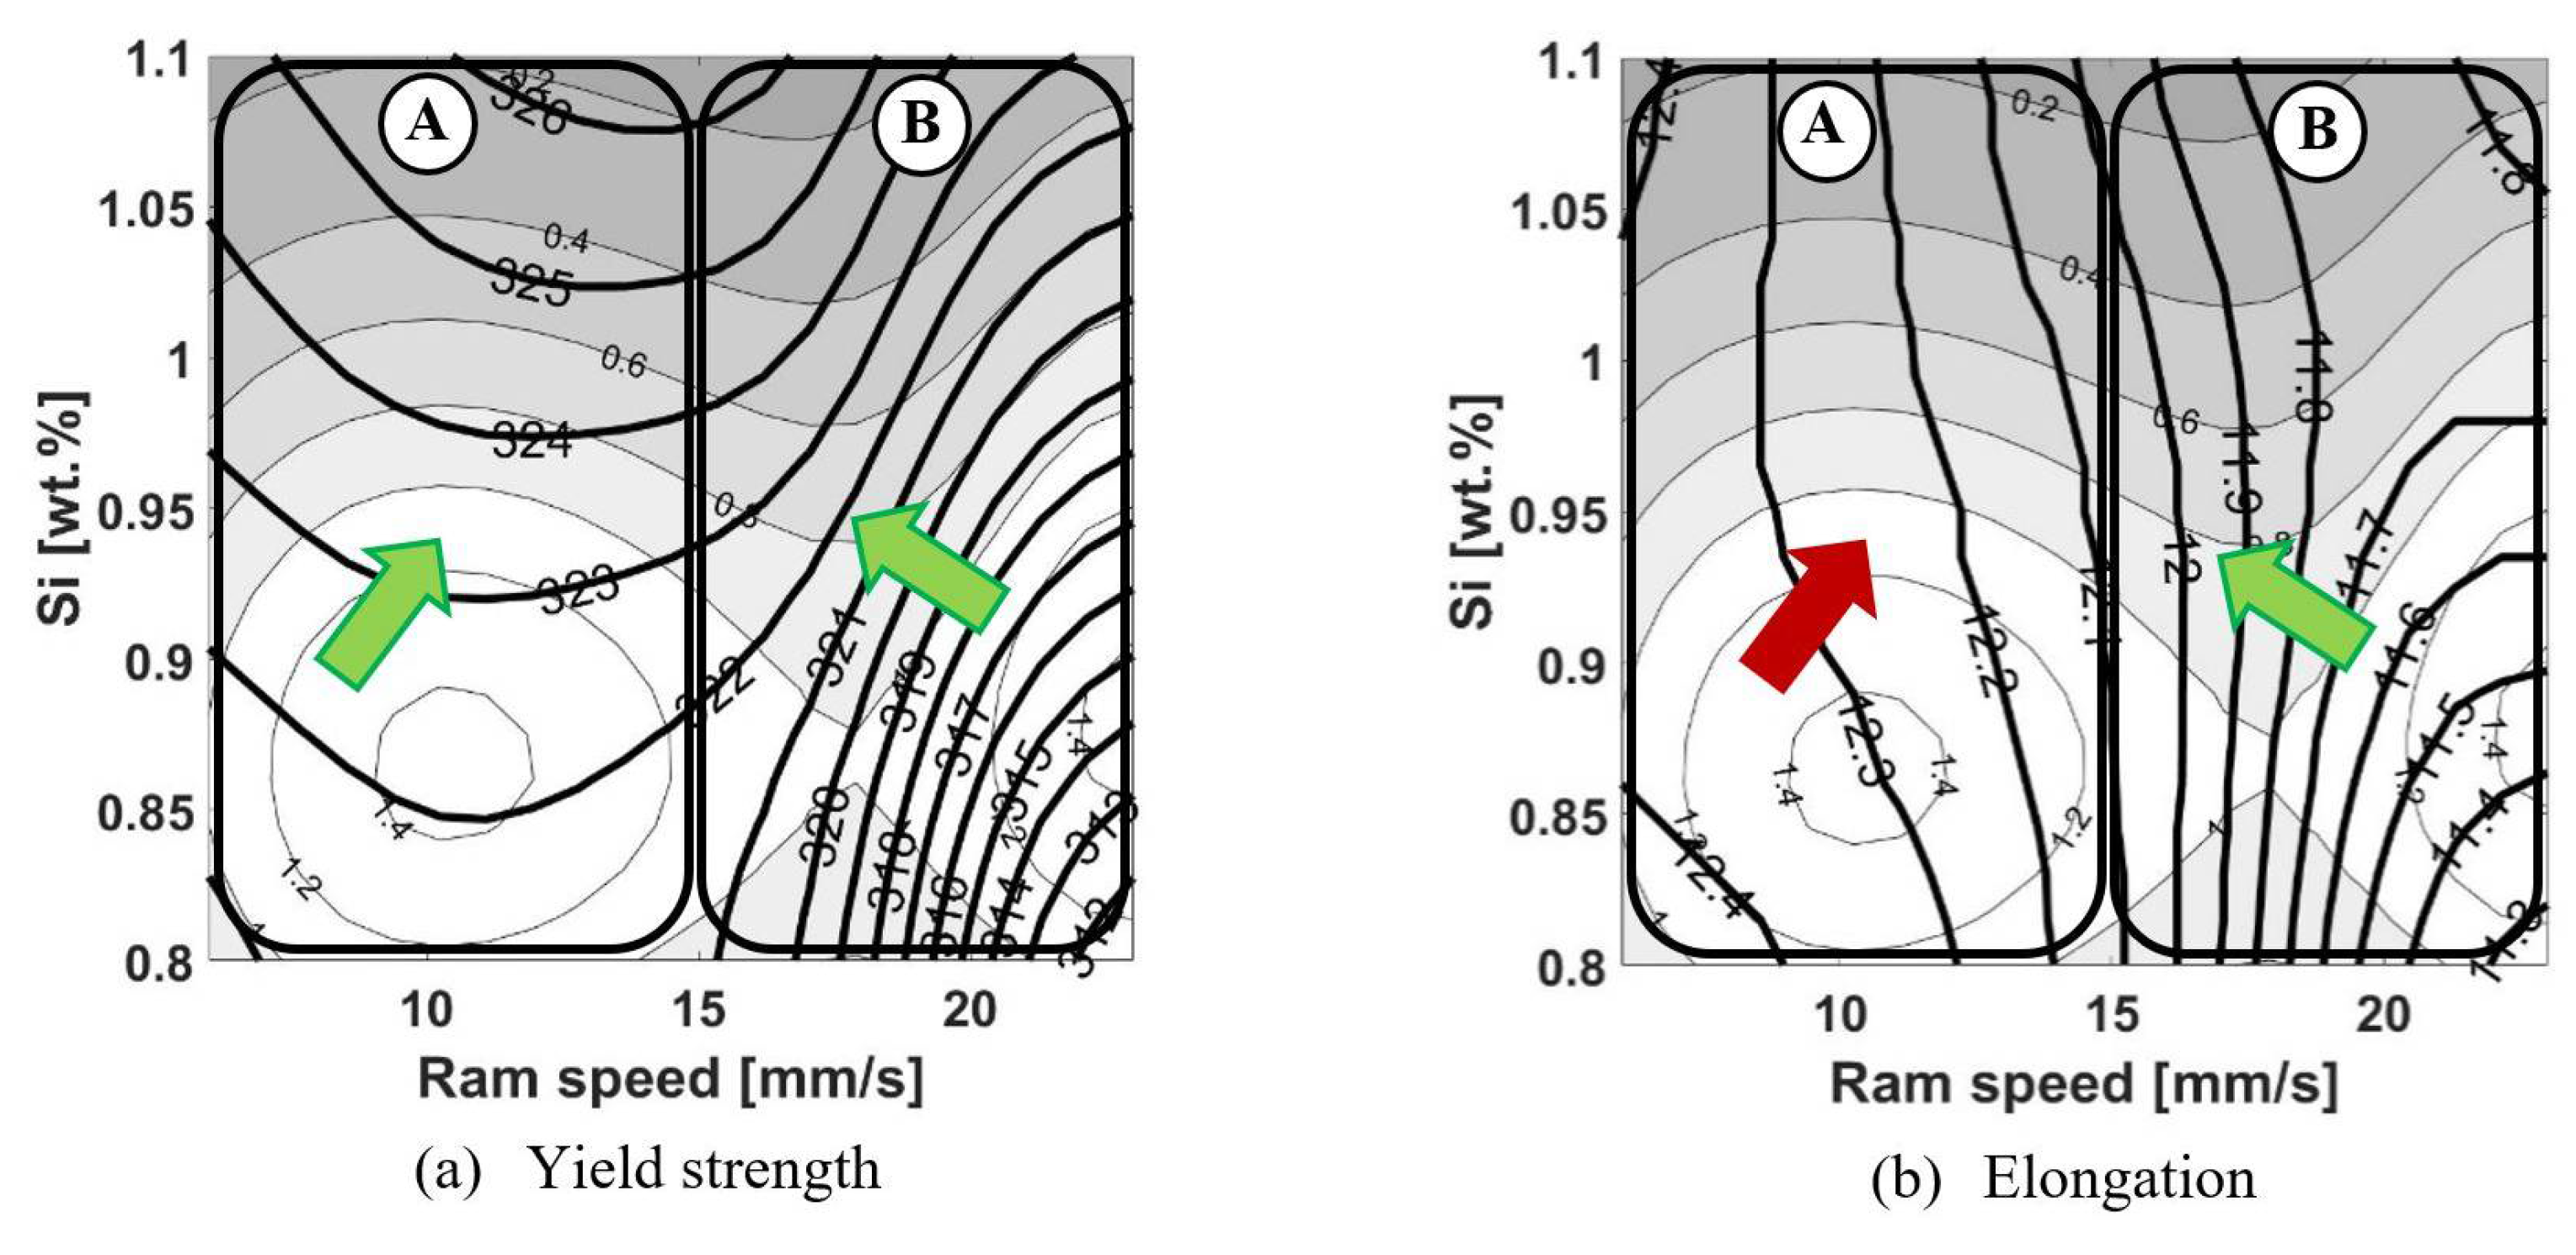
Analysis of complex influences reveals that there are (relatively) rare examples where both yield strength and elongation increase simultaneously with changes in input parameters. Such an example can be seen in area B of Figure 5—when the ram speed value decreases from 23 to 15 mm/s and as the Si content increases from 0.8 to 1.1 wt.%, both the yield strength and elongation values increase. At a ram speed of 15 mm/s and a Si content of 1.1 wt.%, the values for yield strength and elongation reach 326 MPa and 12.0%, respectively.
The second example of the aforementioned relationship can be seen in Figure 6.
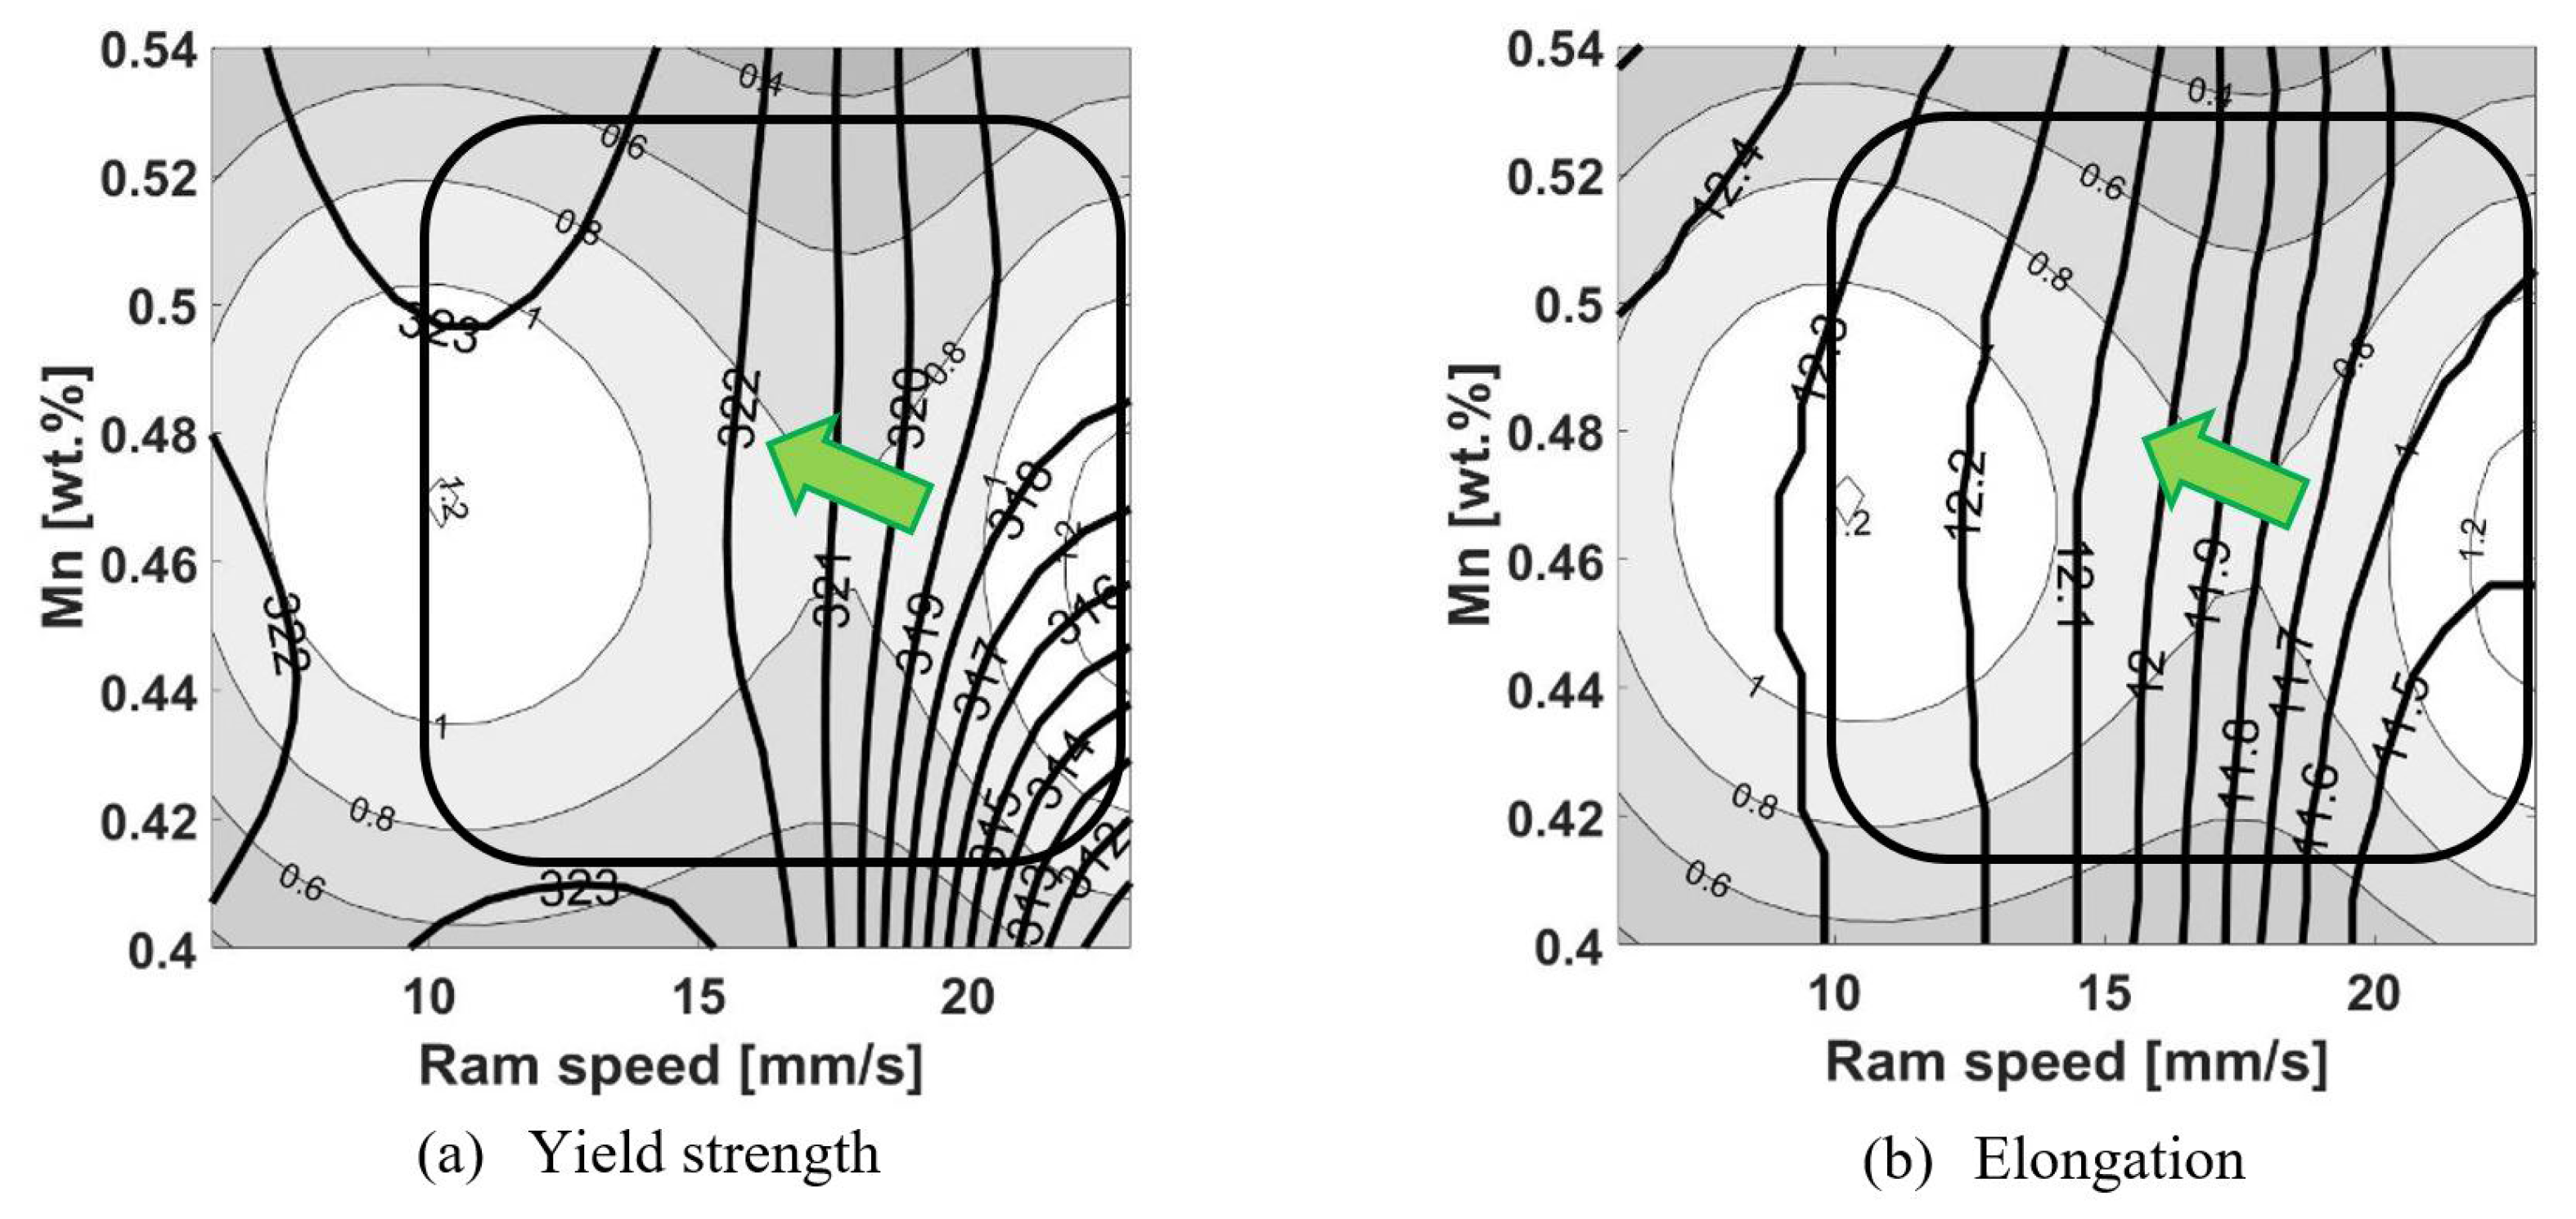
In the range defined by an Mn content of 0.42 to 0.53 wt.% and a ram speed of 10 to 23 mm/s, both the yield strength (Figure 6a) and elongation (Figure 6b) values increase with a slight increase in Mn content and a decrease in ram speed. The highest values are observed at a ram speed of 10 mm/s and a Mn content of 0.53 wt.%, amounting to about 323 MPa and 12.3% for the yield strength and elongation, respectively.
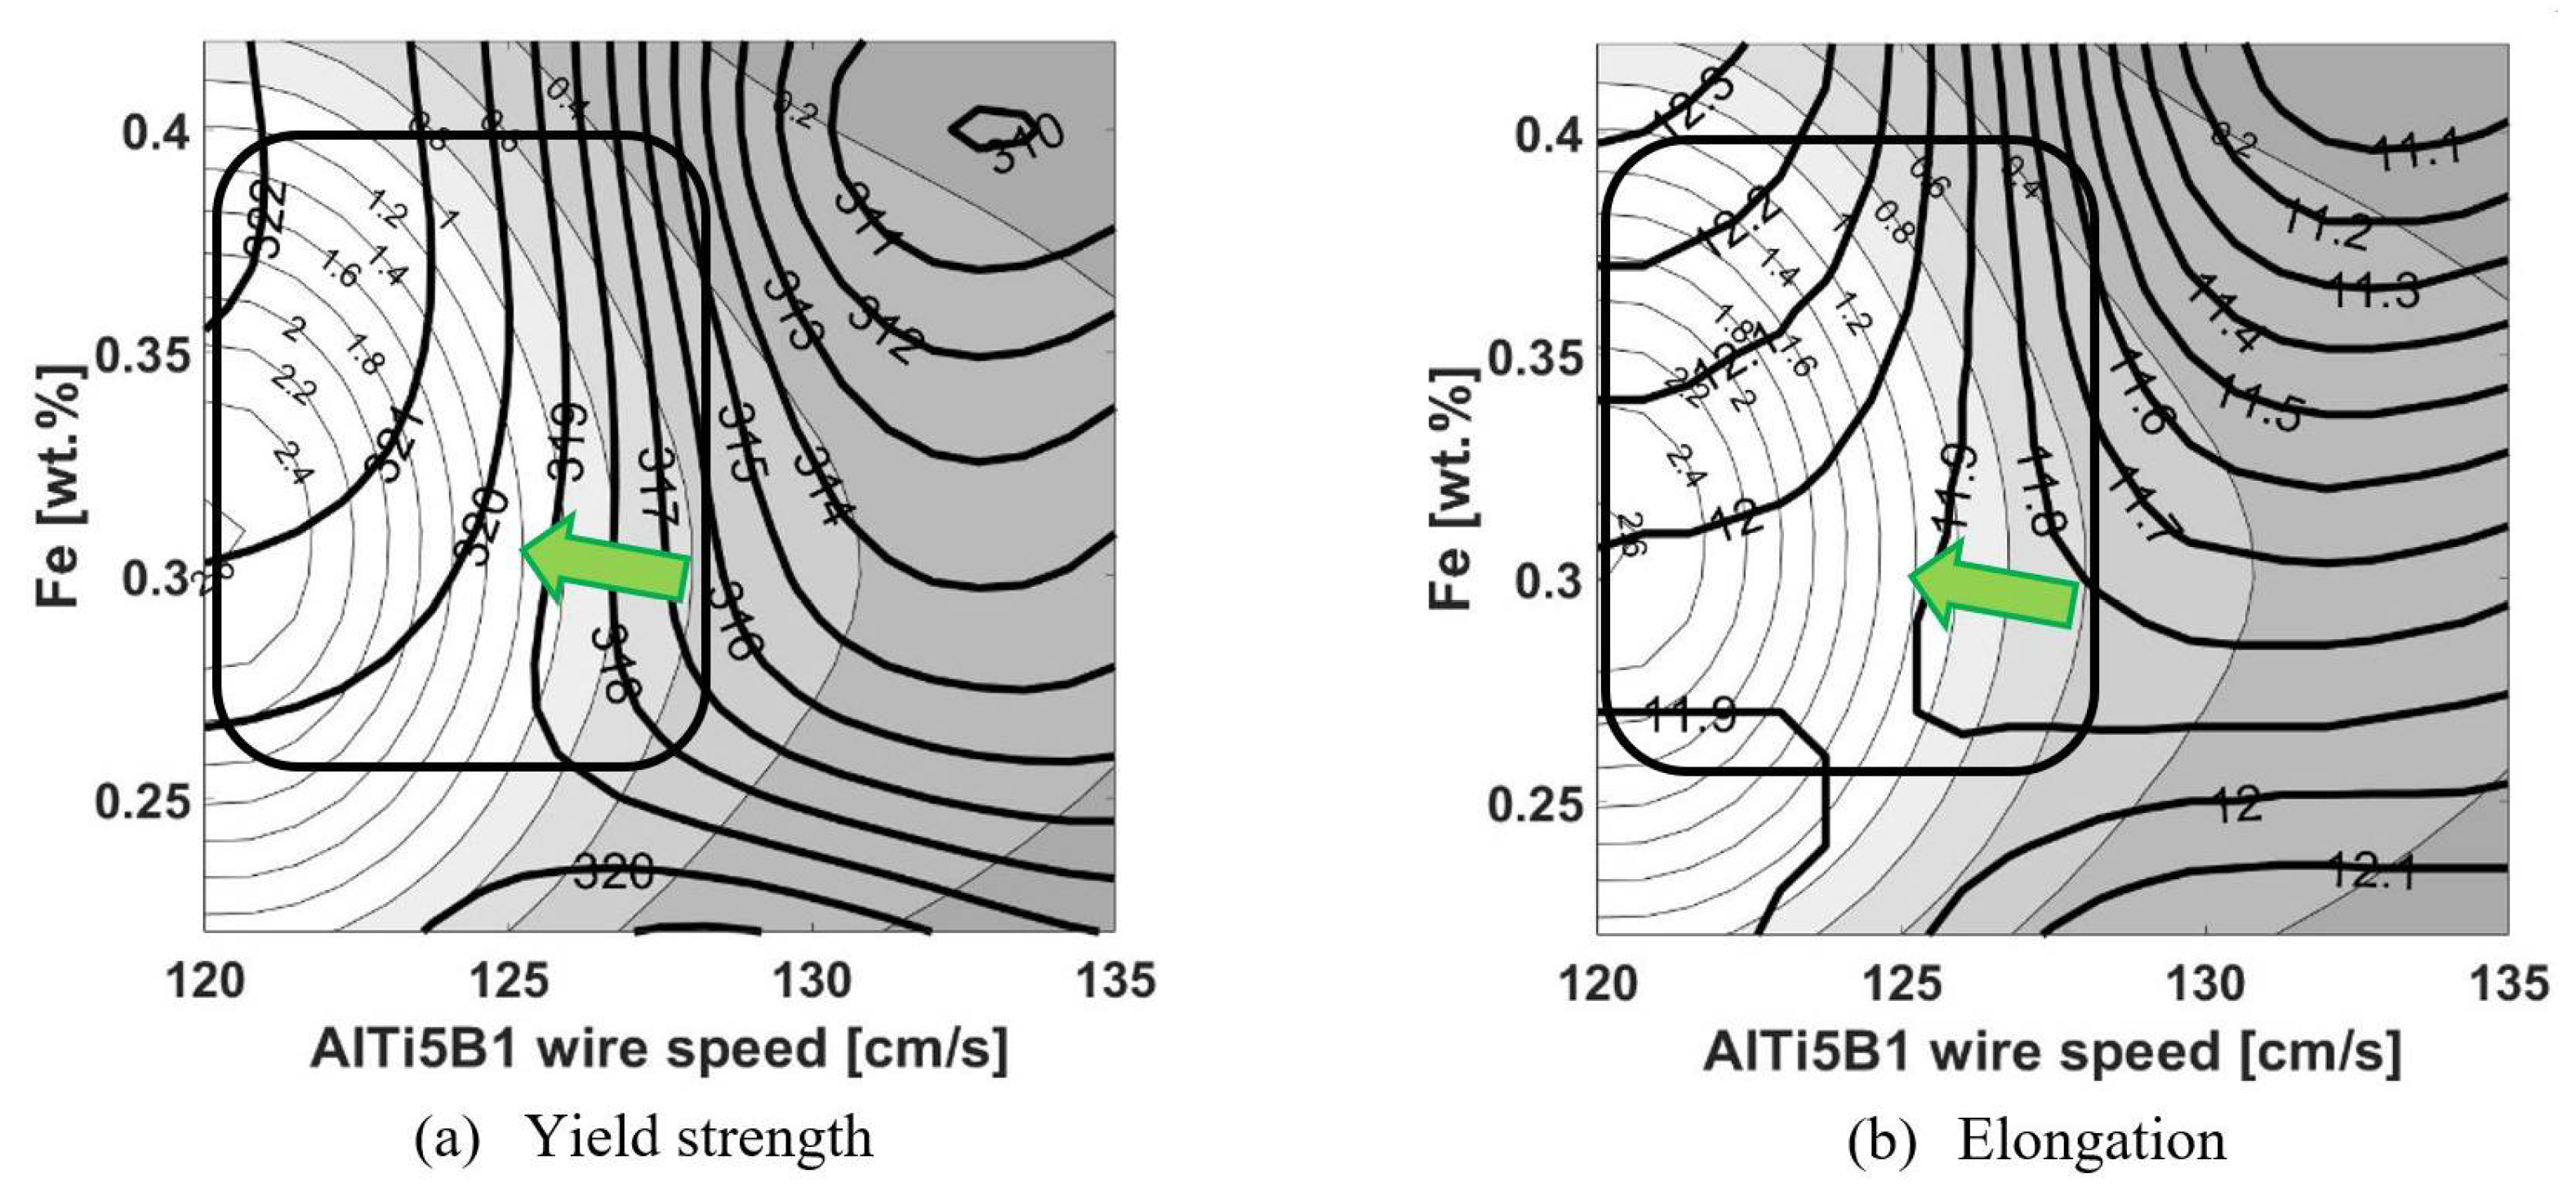
A good example of the second group of relationships are the results of the analysis of the Fe content and the values for the rate of AlTi5B1 wire addition. The yield strength and elongation values, shown in Figure 7a,b, increase simultaneously with the increasing Fe content and the decreasing rate of AlTi5B1 wire addition. This phenomenon is confined to the range defined by the Fe content of 0.26 to 0.40 wt.% and the addition rate of AlTi5B1 wire of 120 to 128 cm/s. The highest values for yield strength (322 MPa) and elongation (12.3%) are obtained at the highest Fe contents (0.4 wt.%) and the lowest addition rates of AlTi5B1 wire, which amounts to 120 cm/s.
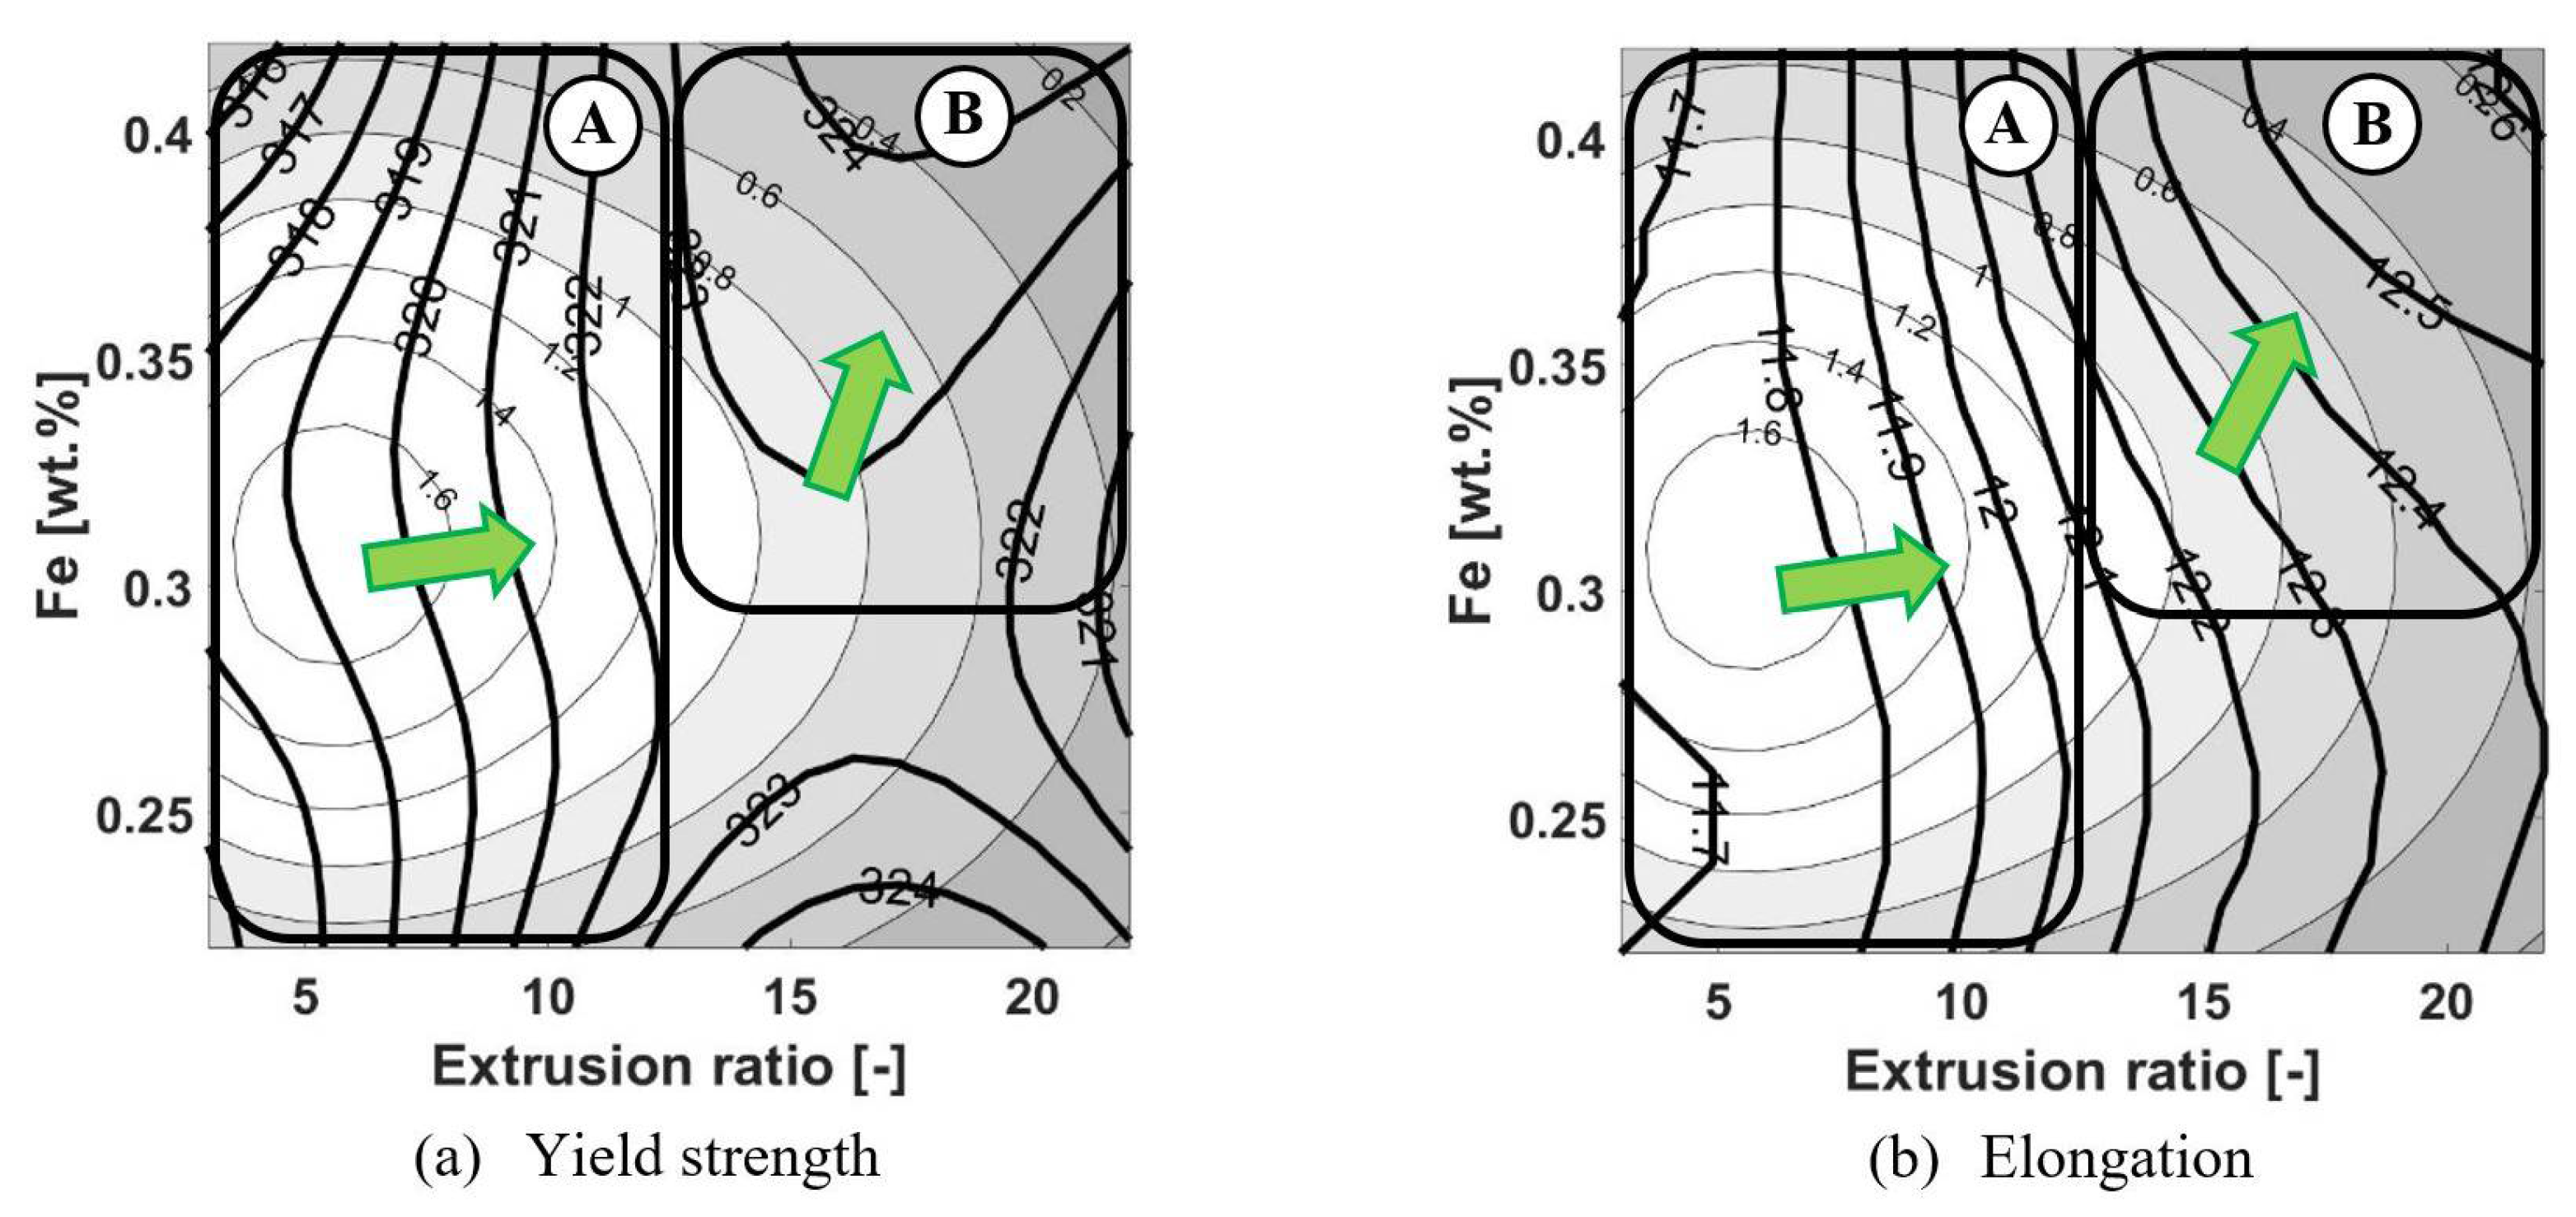
The contour map in Figure 8 is another example where two areas of a simultaneous increase in both properties can be observed. In Figure 8, region A is defined by an Fe content of 0.23 to 0.42 wt.% and an extrusion ratio of 3 to 12. The yield strength and elongation predominantly increase with the increasing extrusion ratio. The influence of the Fe content is much weaker. While an increase in the Fe content generally increases the elongation only slightly, its influence on the yield strength is rather non-linear.
In region B in Figure 8, at the Fe content of 0.3 wt.% and an extrusion ratio of 12, the yield strength (Figure 8a) and elongation (Figure 8b) reach 322 MPa and 12.1%, respectively. From this point on, the values for yield strength and elongation increase simultaneously with the increasing Fe content and increasing values of the extrusion ratio. At an Fe content of 0.42 wt.% and an extrusion ratio of 22, the values for yield strength and elongation reach 324 MPa and 12.8%, respectively.
The remaining relationships, where a change in input parameters increases both properties simultaneously, are summarized in Table 6.

4. Discussion

If you increase a property, for example, in our case the yield strength, usually, the elongation decreases, or vice versa. Such an example can be observed on almost all of the contour maps, such as in Figure 3, where with decreasing the values of casting speed down to 7.33 mm/s and increasing silicon content up to 1.1 wt.%, the values for yield strength increased, while the values for elongation decreased. However, in the multidimensional space of influential parameters, there are regions where both yield strength and elongation values can increase simultaneously. For example, in Figure 8, there are even two regions where the values for both mechanical properties increased simultaneously. Based on the complex results of the analysis with different chemical compositions (Si, Mg, Fe, and Mn) and two extrusion parameters (ram speed and extrusion ratio), there was clearly a complex, typically non-linear influence on the yield strength and elongation. As already indicated by reports in the literature, the chemical elements Si, Mg, Fe, and Mn form various intermetallic phases. The most important types are the intermetallic phase Mg2Si and various types of aluminides AlMnFeSi. Additionally, due to the extrusion process, the hardening and softening effects, and their interaction with intermetallic particles [31,32], also affected the final mechanical properties. The results of the analysis show that the simultaneously high values for yield strength and elongation were obtained at higher contents of Si, Mg, Fe, and Mn (i.e., 1.03 wt.% Si, 0.85 wt.% Mg, 0.4 wt.% Fe, and 0.54 wt.% Mn) and lower ram speeds (5–12 mm/s). Yield strength and elongation values ranged from 324 to 326 MPa and 12.2–12.5%, respectively. Above 15 mm/s and with the same content of Si, Mg, Fe, and Mn, the values of yield strength and the elongation decreased with the increasing values of the ram speed. Analysis of the influence of the chemical composition and extrusion ratio showed that the highest values of yield strength (in the range of 324–329 MPa) and average values of elongation (in the range of 12.2–12.5%) can also be obtained at high contents of Si, Mg, Fe, and Mn (i.e., 1.0 wt.% Si, 0.85 wt.% Mg, 0.4 wt.% Fe, and 0.53 wt.% Mn). Therefore, the combination of higher contents of influential chemical elements (which promote the formation of a higher volume fraction of intermetallic phases) with ram speeds and extrusion ratios in the range of 9–13 mm/s and 13–17, respectively, generally contributes to higher values of yield strength and elongation. The results of the analysis of the different elements and the rate of AlTi5B1 wire addition showed that the values for yield strength and elongation decreased with the increasing values for the rate of AlTi5B1 wire addition. However, the higher contents of Fe and Mn contributed to higher values of yield strength and elongation at an addition rate of AlTi5B1 wire of 120 cm/s.
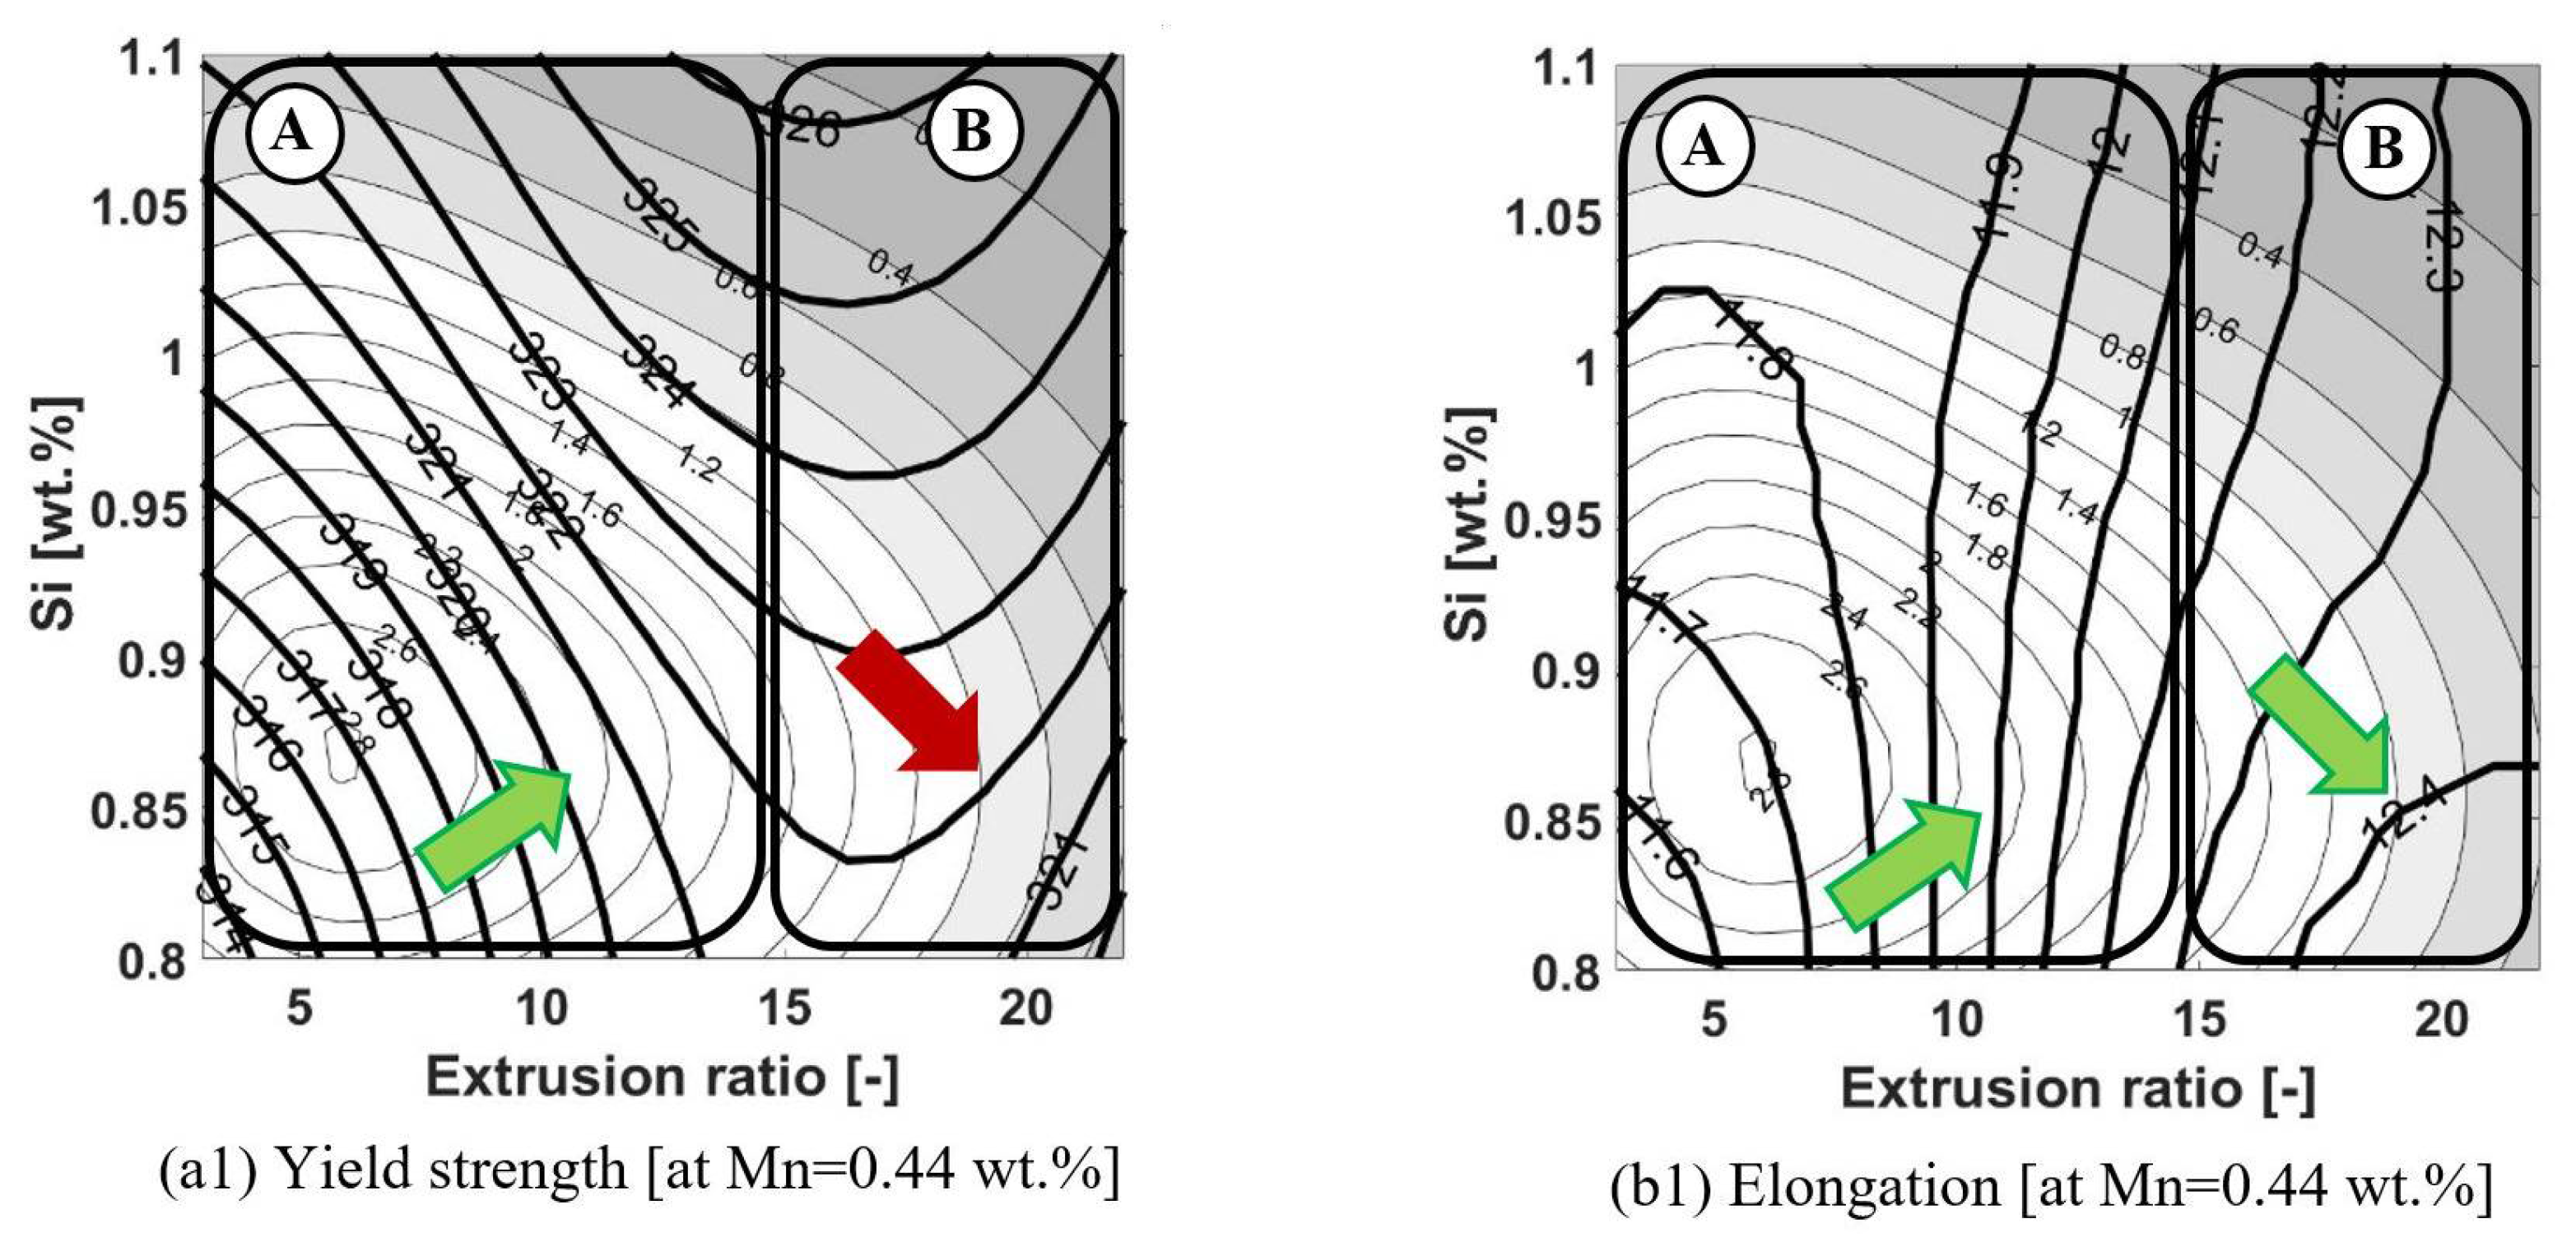
The influence of a larger number of chemical elements and process parameters (which may or may not be related) can also be analyzed (although a complete graphical representation is very difficult to obtain). This corresponds to more detailed multiparametric/multidimensional analyses, where the simultaneous influences of multiple input parameters are considered. Such an example can be found in Figure 9, where the influence of the Si content and extrusion ratio at a fixed Mn content is shown. With the introduction of an additional input parameter, we naturally obtained more complex relationships that are more difficult to represent graphically and more difficult to interpret. In Figure 9, we observe similar trends for both areas A and B as in Figure 4, with the differences being due to the influence of Mn. For example, significantly higher gradients in yield strength were observed at lower Mn values. Further research will therefore focus on the simultaneous consideration of several important influencing parameters and then use optimization techniques to find regions in multidimensional spaces that allow the largest possible simultaneous increase in mechanical properties.

5. Conclusions

In the present study, the Conditional Average Estimator artificial neural network (CAE ANN) was applied to reveal the relationships between chemical compositions and selected process parameters (so-called input parameters) on the yield strength and elongation of an extruded profile made of AA6082, with the aim of increasing both properties simultaneously. The analysis focused on the influences of different contents of Si, Mg, Fe, and Mn, etc., in relation to the casting temperature, casting speed, addition rate of alloy wire addition, different values of ram speed, extrusion ratio, number of extrusion strands, etc., on the above mechanical properties.
From the analyses of spatial (multidimensional) influences of various input parameters on yield strength and elongation, the following conclusions can be drawn:
  • Artificial intelligence methods, especially ANNs, could be a potentially useful tool for revealing complex relationships in the production of metallic alloys, as the presented results show.
  • Considering the obtained analysis results, a further simultaneous increase of yield strength and elongation can be achieved.
  • The results of the analyses showed complex influences of chemical composition (Si, Mg, Mn, and Fe) and extrusion process parameters (ram speed and extrusion ratio) on mechanical properties (yield strength and elongation). The first part of the analyses showed the relationships in which, when the input parameters are changed, there is a simultaneous increase in one property and a decrease in the other. The second part of the analyses revealed a relationship where there is a simultaneous increase in both properties when the influential parameters are changed. These observations are new compared to similar published studies and constitute the novelty of the study.
  • When analyzing the influences of chemical composition and ram speed on yield strength and elongation, the highest values for yield strength and elongation were obtained at a ram speed of about 7–11 mm/s, while the values for Mn and Si were both in the range of about 0.41–0.53 and 0.8–1.1 wt.%, respectively.
  • The decrease in the values of yield strength and elongation was observed at higher values of ram speed, above 15 mm/s. However, the decrease in the values of yield strength and elongation with increasing values for ram speed depends on the content of Si, Mg, Fe, and Mn.
  • When analyzing the effects of chemical composition and extrusion ratio on yield strength, the values for yield strength were highest for an extrusion ratio of 13–15. The values of elongation were highest for an extrusion ratio in the range of 17–20 and continued to increase with the increasing values of the extrusion ratio in the range with low predictive confidence.
  • The results showed areas where both yield strength and elongation values increased simultaneously. The ranges were at a ram speed in the range of 7–11 mm/s and at a content of 1.1 wt.% Si, 0.85 wt.% Mg, 0.4 wt.% Fe, and 0.54 wt.% Mn, where the values for yield strength and elongation were in the range of 324–326 MPa and 12.2–12.5%, respectively.
  • The values for ram speed from the different analyses of the influences of the chemical elements, where high values for the yield strength and elongation were found, were in the range of 7–11 mm/s. In the analysis of the complex influences of chemical composition and extrusion ratio, the high values for yield strength coincided with the value of the extrusion ratio of around 12–15. However, in this range, the values for elongation were generally in the middle range.
  • The contour maps presented were generated by CAE ANN using data from an actual industrial production. Confirmation or rejection of the reliability (effectiveness/correctness) of the proposed approach will be found by considering the relationships of the presented contour maps in everyday industrial production and by the response of the professional scientific research community.

Author Contributions

Conceptualization, I.P., G.K. and M.T.; Formal analysis, I.P., G.K. and S.M.; Funding acquisition, G.K. and M.T.; Investigation, I.P. and S.M.; Methodology, I.P. and M.T.; Project administration, M.T.; Resources, S.M.; Software, I.P.; Supervision, M.T.; Validation, I.P., G.K. and M.T.; Visualization, I.P. and S.M.; Writing—original draft, M.T.; Writing—review and editing, I.P., G.K., S.M. and M.T. All authors have read and agreed to the published version of the manuscript.

Funding

This research was funded by the Republic of Slovenia, the Ministry of Education, Science and Sport, and the European Regional Development Fund, grant number OP20.03531. D.B. and G.K. acknowledge funding by the Slovenian Research Agency (ARRS), grant number P2-0344. M.T. acknowledges funding by the Slovenian Research Agency (ARRS), grant number P2-0268.

Institutional Review Board Statement

Not applicable.

Informed Consent Statement

Not applicable.

Data Availability Statement

No additional data are publicly available.

Acknowledgments

The microstructure of extruded aluminum alloy 6082 from the optical microscope in Figure 1 was kindly provided by Aleš Nagode.

Conflicts of Interest

The authors declare no conflict of interest.

References

  1. Hägele, N.; Sonsino, C.M. Structural durability design recommendations for forged automotive aluminium chassis components submitted to spectrum and environmental loadings by the example of a tension strut. Int. J. Fatigue 2014, 69, 63–70. [Google Scholar] [CrossRef]
  2. Mistakidis, E.S.; De Matteis, G.; Formisano, A. Low yield metal shear panels as an alternative for the seismic upgrading of concrete structures. Adv. Eng. Softw. 2007, 38, 626–636. [Google Scholar] [CrossRef]
  3. Martiessen, W.; Warlimont, M. Springer Handbook of Condensed Matter and Materials Data; Springer: Berlin/Heidelberg, Germany, 2005. [Google Scholar]
  4. Lendvai, J. Precipitation and strengthening in aluminium alloys. Mater. Sci. Forum. 1996, 217–222, 43–56. [Google Scholar] [CrossRef]
  5. Hirth, S.M.; Marshall, G.J.; Court, S.A.; Lloyd, D.J. Effects of Si on the aging behaviour and formability of aluminium alloys based on AA6016. Mater. Sci. Eng. A 2001, 321, 452–456. [Google Scholar] [CrossRef]
  6. Wang, E.R.; Hui, X.D.; Wang, S.S.; Zhao, Y.F.; Chen, G.L. Improved mechanical properties in cast Al–Si alloys by combined alloying of Fe and Cu. Mater. Sci. Eng. A 2010, 527, 78–84. [Google Scholar] [CrossRef]
  7. Vončina, M.; Kores, S.; Mrvar, P.; Medved, J. Effect of Ce on solidification and mechanical properties of A360 alloy. J. Alloy. Compd. 2011, 509, 7349–7355. [Google Scholar] [CrossRef]
  8. Naglič, I.; Smolej, A.; Doberšek, M.; Mrvar, P. The influence of TiB2 particles on the effectiveness of Al-3Ti-0.15C grain refiner. Mater. Charact. 2008, 59, 1458–1465. [Google Scholar] [CrossRef]
  9. Žbontar, M.; Petrič, M.; Mrvar, P. The influence of cooling rate on microstructure and mechanical properties of AlSi9Cu3. Metals 2021, 11, 186. [Google Scholar] [CrossRef]
  10. Birol, Y. The effect of processing and Mn content on the T5 and T6 properties of AA6082 profiles. J. Mater. Proc. Technol. 2006, 173, 84–91. [Google Scholar] [CrossRef]
  11. Zhang, B.; Baker, T.N. Effect of the heat treatment on the hot deformation behaviour of AA6082 alloy. J. Mater. Proc. Technol. 2004, 153–154, 881–885. [Google Scholar] [CrossRef]
  12. Garrett, R.P.; Lin, J.; Dean, T.A. An investigation of the effects of solution heat treatment on mechanical properties for AA 6xxx alloys: Experimentation and modelling. Int. J. Plast. 2005, 21, 1640–1657. [Google Scholar] [CrossRef]
  13. Zhang, L.Y.; Jiang, Y.H.; Ma, Z.; Shan, S.F.; Jia, Y.Z.; Fan, C.Z.; Wang, W.K. Effect of cooling rate on solidified microstructure and mechanical properties of aluminium-A356 alloy. J. Mater. Proc. Technol. 2008, 207, 107–111. [Google Scholar] [CrossRef]
  14. Zhang, X.H.; Su, G.C.; Ju, C.W.; Wang, W.C.; Yan, W.L. Effect of modification treatment on the microstructure and mechanical properties of Al-035%Mg-7.0%Si cast alloy. Mater. Des. 2010, 31, 4408–4413. [Google Scholar] [CrossRef]
  15. Fjeldbo, S.K.; Li, Y.; Marthinsen, K.; Furu, T. Through-process sensitivity analysis on the effect of process variables on strength in extruded Al–Mg–Si alloys. J. Mater. Proc. Technol. 2012, 212, 171–180. [Google Scholar] [CrossRef]
  16. Sjolander, E.; Seifeddine, S. The heat treatment of Al-Si-Cu-Mg casting alloys. J. Mater. Proc. Technol. 2010, 210, 1249–1259. [Google Scholar] [CrossRef] [Green Version]
  17. Butkovich, J.N.; Hashash, Y.M.A. Neural network material model enhancement: Optimisation through selective data removal. AI EDAM 2007, 21, 61–72. [Google Scholar] [CrossRef]
  18. Flood, I. Performin calculus operations on poorly understood engineering functions using neural networks. AI EDAM 2009, 9, 419–426. [Google Scholar]
  19. Dobrzański, L.A.; Sitek, W. Designing of the chemical composition of constructional alloy Steels. J. Mater. Proc. Technol. 1999, 89-90, 467–472. [Google Scholar] [CrossRef]
  20. Guo, Z.; Sha, W. Modelling the correlation between processing parameters and properties of maraging steels using artificial neural network. Comput. Mater. Sci. 2004, 29, 12–28. [Google Scholar] [CrossRef] [Green Version]
  21. Capdevila, C.; Garcia-Mateo, C.; Caballero, F.G. Garcıa de Andres, C. Neural network analysis of the influence of processing on strength and ductility of automotive low carbon sheet steels. Comput. Mater. Sci. 2006, 38, 192–201. [Google Scholar] [CrossRef] [Green Version]
  22. Večko, P.T.; Peruš, I.; Kugler, G.; Terčelj, M. Towards improved reliability of the analysis of factors influencing the properties on steel in industrial practice. ISIJ Int. 2009, 49, 395–401. [Google Scholar] [CrossRef] [Green Version]
  23. Terčelj, M.; Fazarinc, M.; Kugler, G.; Peruš, I. Influence of the chemical composition and process parameters on the mechanical properties of an extruded aluminium alloy for highly loaded structural parts. Constr. Build. Mater. 2013, 44, 781–791. [Google Scholar] [CrossRef]
  24. Mrówka, N.G.; Sieniawski, J.; Wierzbińska, M. Intermetallic phase particles in 6082 aluminium alloy. Arch. Mater. Sci. Eng. 2007, 28, 69–76. [Google Scholar]
  25. Liu, Y.L.; Kang, S.B.; Kim, H.W. The complex microstructures in as-cast Al-Mg-Si alloy. Mater. Lett. 1999, 41, 167–272. [Google Scholar] [CrossRef]
  26. Mrówka, N.G.; Sieniawski, J. Influence of heat treatment on the microstructure and mechanical properties of 6005 and 6082 aluminium alloys. J. Mater. Proc. Technol. 2005, 163, 367–372. [Google Scholar] [CrossRef]
  27. Mrówka, N.G.; Sieniawski, J. Effect of heat treatment on tensile and fracture toughness properties of 6082 alloy. J. Achiev. Mater. Manuf. Eng. 2009, 32, 162–170. [Google Scholar]
  28. Grabec, I.; Sachse, W. Synergetics of Measurement, Prediction and Control; Springer Series in Synergetics; Springer: Berlin/Heidelberg, Germany, 1997. [Google Scholar]
  29. Perus, I.; Poljansek, K.; Fajfar, P. Flexural deformation capacity of rectangular RC columns determined by the CAE method. Earthq. Eng. Struct. Dyn. 2006, 35, 1453–1470. [Google Scholar] [CrossRef]
  30. Specht, D.F. A general regression neural network. IEEE Trans. Neural Netw. 1991, 2, 568–576. [Google Scholar] [CrossRef] [Green Version]
  31. Humpreys, F.J.; Hatherly, M. Recrystalization and Related Annealing Phenomena; Elsevier: Oxford, UK, 2004. [Google Scholar]
  32. Poletti, C.; Wójcik, T.; Sommitsch, C. Hot deformation of AA6082 containing fine intermetallic particles. Metall. Mater. Trans. A 2012, 44, 1577–1586. [Google Scholar] [CrossRef]
Figure 1. The microstructure of extruded aluminum alloy 6082 from the optical microscope.
Metals 12 00461 g001
Figure 2. Common influence of extrusion ratio and Mn content on yield strength (a) and elongation (b). Green (grey) and red (dark) arrows indicate increase and decrease of the observed mechanical property.
Metals 12 00461 g002
Figure 3. Common influence of casting speed and Si content on (a) yield strength and (b) elongation. Green (grey) and red (dark) arrows indicate increase and decrease of the observed mechanical property.
Metals 12 00461 g003
Figure 4. Common influence of extrusion ratio and Si content on (a) yield strength and (b) elongation. Green (grey) and red (dark) arrows indicate increase and decrease of the observed mechanical property.
Metals 12 00461 g004
Figure 5. Common influence of ram speed and Si content on yield strength (a) and elongation (b). Green (grey) and red (dark) arrows indicate increase and decrease of the observed mechanical property.
Metals 12 00461 g005
Figure 6. Common influence of ram speed and Mn content on (a) yield strength and (b) elongation. Green (grey) arrows indicate increase of the observed mechanical property.
Metals 12 00461 g006
Figure 7. Common influence of the rate of AlTi5B1 wire addition and casting temperature on (a) yield strength and (b) elongation. Green (grey) arrows indicate increase of the observed mechanical property.
Metals 12 00461 g007
Figure 8. Common influence of extrusion ratio and Fe content on yield strength (a) and elongation (b). Green (grey) arrows indicate increase of the observed mechanical property.
Metals 12 00461 g008
Figure 9. Common influence of extrusion ratio and Si content on yield strength and elongation at fixed values of Mn (Mn = 0.44 wt.% top, and Mn = 0.50 wt.% bottom).
Metals 12 00461 g009aMetals 12 00461 g009b
Table 1. Standard chemical composition of aluminum alloy 6082.
Fe (wt.%) Si (wt.%)Mn (wt.%)Mg (wt.%)Cu (wt.%)Zn (wt.%)Cr (wt.%)Ti (wt.%)Others (wt.%)
0.0–0.500.70–1.300.40–1.000.60–1.200.0–0.100.0–0.200.0–0.250.0–0.100.0–0.15
Table 2. Minimum, maximum, and average values for different process parameters.
Extrusion
Ratio (/)
Ram Speed (mm/s)Number of StrandsCasting Speed (mm/s)Addition Rate of AlTi5B1 Wire
(cm/s)
Casting Temperature (°C)
Min.2.55.317.2120690
Max.26.623.787.5144730
Avg.9.115.527.4123724
Table 3. Minimum, maximum, and average values of chemical composition.
Fe (wt.%)Si (wt.%)Mn (wt.%)Mg (wt.%)
Min.0.220.800.400.66
Max.0.441.240.590.90
Avg.0.310.890.470.75
Table 4. Minimum, maximum, and average values of mechanical properties.
Yield Strength (MPa)Elongation (%)
Min.243.237.20
Max.365.8217.39
Avg.319.8911.97
Table 5. Values for yield strength and elongation at certain values for different contents and process parameters, where one mechanical property increases while another decreases. Symbols ↑ and ↓ represent increase and decrease of the property, respectively.
No.x-axisy-axisYield Strength Range (MPa)Elongation Range (%)
1.Extrusion ratio → 15 ↑ 22 (Figure 2)Mn → 0.46 wt. % ↑ 0.54 wt.%324 ↓ 32212.3 ↑ 12.6
2.Casting speed → 7.5 mm/s ↓ 7.33 mm/s (Figure 3)Si → 0.8 wt.% ↑1.1 wt. %319 ↑ 328 12.1 ↓11.7
3.Extrusion ratio → 15 ↑ 22 (Figure 4)Si → 0.8 wt.% ↑1.1 wt. %326 ↓ 321 12.2 ↑12.5
4.Casting speed → 7.2 mm/s const.Fe → 0.24 wt. % ↓ 0.36 wt.%318 ↓ 31211.5 ↑12.5
5.Casting speed → 7.5 mm/s ↓ 7.37 mm/sMn → 0.52 wt. % ↓ 0.48 wt.%320 ↑ 322 12.3 ↓11.9
6.Ram speed → 5 mm/s ↑ 15 mm/s (Figure 5)Si → 0.8 wt.% ↑ 1.1 wt.%321 ↑ 32612.4 ↓ 12.0
7.Ram speed → 12 mm/s ↑ 15 mm/sMg → 0.75 wt. % ↑ 0.85 wt. %321 ↑ 327 12.4 ↓11.8
8.AlTi5B1 wire addition → 120 cm/s const.Mn → 0.54 wt. % ↑ 0.58 wt. %325 ↑ 33012.4 ↓ 11.8
9.Ram speed → 10 mm/s ↓ 5 mm/sNumber of strands → 2 ↑ 4324 ↓ 320 12.4 ↑ 13.1
Table 6. Values for yield strength and elongation at certain content of different elements and process parameters, where both yield strength and elongation increase simultaneously. Symbols ↑ and ↓ represent increase and decrease of the property, respectively.
No.x-axisy-axisYield Strength Range (MPa)Elongation Range (%)
1.Extrusion ratio → 3 ↑ 15 (Figure 2)Mn → 0.42 wt.% ↑ 0.54 wt.%314 ↑ 32311.6 ↑ 12.3
2.Extrusion ratio → 3 ↑ 15 (Figure 4)Si → 0.8 wt.% ↑ 1.1 wt.%315 ↑ 32611.6 ↑ 12.2
3.Ram speed → 23 mm/s ↑ 15 mm/s (Figure 5)Si → 0.8 wt.% ↑ 1.1 wt.%312 ↑ 32611.3 ↑ 12.0
4.Ram speed → 23 mm/s ↓ 10 mm/s (Figure 6)Mn → 0.42 wt.% ↑ 0.53 wt.%312 ↑ 32311. ↑ 12.3
5.AlTi5B1 wire addition
→ 128 cm/s ↓ 120 cm/s (Figure 7)
Fe → 0.35 wt.% const.318 ↑ 32311.7 ↑ 12.2
6.Extrusion ratio → 3 ↑ 12 (Figure 8)Fe → 0.35 wt.% const.318 ↑ 32311.7 ↑ 12.2
7.Extrusion ratio → 12 ↑ 22 (Figure 8)Fe → 0.30 wt.% ↑ 0.42 wt.%321 ↑ 32412.1 ↑ 12.6
8.Extrusion ratio → 15 const.Mn → 0.44 wt.% ↑ 0.54 wt.%323 ↑ 32512.4 ↑ 12.6
9.Extrusion ratio → 5 ↑ 17Mg → 0.72 wt.% const.316 ↑ 32311.6 ↑ 12.5
10.Extrusion ratio → 5 ↑ 15Si → 0.95 wt.% const.319 ↑ 32511.7 ↑ 12.3
11.Ram speed → 15 mm/s ↓ 5 mm/sFe → 0.3 wt.% ↑ 0.38 wt.%322 ↑ 32411.9 ↑ 12.5
12.AlTi5B1 wire addition → 130 cm/s ↓ 120 cm/s Mn → 0.42 wt.% ↑ 0.54 wt.%315 ↑ 32511.1 ↑ 12.4
13.Casting temperature → 718 °C const.AlTi5B1 wire addition
→ 132 cm/s ↓ 120 cm/s
32212.2
14.Extrusion ratio → 5 ↑ 14Ram speed → 22 mm/s ↓15 mm/s316 ↑ 32511.5 ↑ 12.4
Publisher’s Note: MDPI stays neutral with regard to jurisdictional claims in published maps and institutional affiliations.