Article

Analysis of Strain Inhomogeneity in Extruded Al 6061-T6 Processed by ECAE

by
Fernando D. Carazo
1,2,*,
Juan J. Pastor Alés
1,2,
Javier Signorelli
3,
Diego J. Celentano
4,
Carlos M. Guevara
1 and
Roberto Lucci
5
1
Facultad de Ingeniería, Instituto de Mecánica Aplicada, Universidad Nacional de San Juan, Av. Lib. Gral. San Martín (O), San Juan 1290, Argentina
2
Consejo Nacional de Investigaciones Científicas y Técnicas, CONICET, Godoy Cruz 2290, Buenos Aires 1425, Argentina
3
Facultad de Ciencias Exactas, Ingeniería y Agrimensura, Instituto de Física Rosario, CONICET-UNR, Bv. 27 de Febrero 210 bis, Rosario 2000, Argentina
4
Departamento de Ingeniería Mecánica y Metalúrgica, Pontificia Universidad Católica de Chile, Av. Vicuña Mackenna 4860, Macul, Santiago 7820436, Chile
5
Departamento de Ingeniería Metalúrgica, Facultad Regional Córdoba, Universidad Tecnológica Nacional, Maestro M. López esq. Cruz Roja Argentina, Ciudad Universitaria, Córdoba 5000, Argentina
*
Author to whom correspondence should be addressed.
Metals 2022, 12(2), 299; https://doi.org/10.3390/met12020299
Submission received: 20 December 2021 / Revised: 2 February 2022 / Accepted: 4 February 2022 / Published: 9 February 2022
(This article belongs to the Special Issue Computational Modeling of Material Forming Processes)

Abstract

:
This paper presents an analysis of the test and simulation of the equal channel angular extrusion (ECAE) of a commercial Al 6061-T6 alloy previously extruded. Special emphasis is given to the analysis and comparison of the simulated values and distribution of equivalent plastic strain with those calculated with analytical models across the height of the middle section of the deformed billet. The results reveal the limitations of the analytical models when the effects of the inner die corner and curvature of the outer wall on the material response during the test are considered for the ECAE device used in this work. Specifically, in the simulations performed in this work, the plastic deformation zone, far from being uniform, extends along with the height of the billet where, in particular, near the inner wall over the inlet and outlet channels, even in the central region of the billet, the equivalent plastic strain is not homogeneous or discontinuous, varying mainly due to the effect of the curvature of the outer channel.
Keywords:
ECAE; SPD; FEM; aluminum

1. Introduction

The procedure to obtain alloys with ultrafine grains (UFG) through severe plastic deformations (SPD) includes any process that, subjecting a material to high stress (generally hydrostatic pressure), gives it a large plastic deformation without a significant change to its dimensions [1,2]. The equal channel angular extrusion (ECAE) [3] is the most widely used SPD technique to obtain UFG alloys with increased strength and ductility.
In the ECAE, a punch exerts a force on a billet that flows through a channel with a constant section along its length while it is deformed in a region called the plastic deformation zone (PDZ) without changing its cross-sectional shape (Figure 1). In the ECAE, the main features of the PDZ are function of the process variables and the type and state of the material to be processed. The prediction and/or a determination of the degree and distribution of the plastic deformation imposed on a material is a crucial factor to obtain an alloy with UFG, as it is the driving force for the microstructural changes in alloys deformed by SPD (granular fragmentation). Hence, it is crucial to be able to describe and determine the strain developed in the ECAE of a material with a given previous state and condition, and for an ECAE device with arbitrary geometry.
Since the publication of [3], in which the authors proposed that the materials processed by ECAE are subjected to a discontinuous simple shear strain along the intersection plane of the inlet and outlet channels, there have been many articles that have proposed modifications of the original technique [4] and analytical models to calculate the strain and texture of a material processed by ECAE. The most used analytical models in determining the history of deformation, texture, and the effective strain of a material processed by ECAE are the models published in [5,6,7] and recently in [8]. Analytical models are useful and very interesting from a theoretical and/or conceptual point of view, but they usually assume simplifications and geometric idealizations of complex processes that include a large number of variables inherent to the material and the tool, and in general, they are found to not realistically represent the strain and stress states derived from the flow of the material through the PDZ. Another limitation of the analytical models is that the parameters, which are far from being universal and change in function of a large number of process variables, are obtained from finite element simulations (FEM). For example, in the models proposed in [6,7], the authors obtained the model parameters from FEM simulations. In this way, the authors adjusted the analytical results corresponding to effective plastic strain—grade and distribution—and texture to the results observed in the experiments.
In contrast, computational studies of the plastic flow, localization, and formability of metals including the effects of size or grain morphology in simulation/analysis are published in [9,10]. Regarding ECAE modeling, [11,12,13,14] and more recently [15,16,17,18] highlight the inhomogeneity of the strains in materials deformed via this process. Although some of the cited articles studied different aspects of aluminum alloys deformed by ECAE, none of them emphasized the analysis and characterization of the strain inhomogeneity in Al 6061-T6 previously extruded. This forming route has recently been proposed as an alternative to obtaining AA6XXX series alloys for use in aluminum conductor composite core (ACCC) with an excellent weight/conductivity ratio [19,20]. The ACCC conductors designed and manufactured with AA6XXX alloys (100% Al) [21] are an alternative to steel reinforced conductors (ACSR), with greater conductivity and strength but greatest weight, hence the interest in characterizing the strain inhomogeneity of aluminum alloys under the noted conditions.
In this article, we present an analysis of the test and simulation of one pass in an ECAE device with Ψ = Φ = π/2 of a previously extruded commercial Al 6061-T6 alloy. The main objective of this article is to address the aspects that have not been studied in depth in the bibliography with respect to the relation to the distribution of the values of the equivalent plastic strain and its relationship with the deformation history in regions close to the internal and external channels and in the central region of the billet and its variation in function of the dimensional model used in the simulations in this alloy when being formed by the ECAE with the noted geometry. To achieve this objective, the simulation results, such as the equivalent plastic strain in the middle section of the billet, are compared with the corresponding results provided by the analytical models proposed in [5,7] and with those reported in [22]. In addition, to analyze the nature of the deformation, the evolution of the effective plastic strain, strain rate, and spin tensor components of three material points are analyzed. Finally, the microhardness across longitudinal and normal directions and the degree of hardening after one ECAE pass are analyzed in terms of the strain achieved.

2. Experimental Work

This section describes the experimental methods and techniques used in the present investigation.

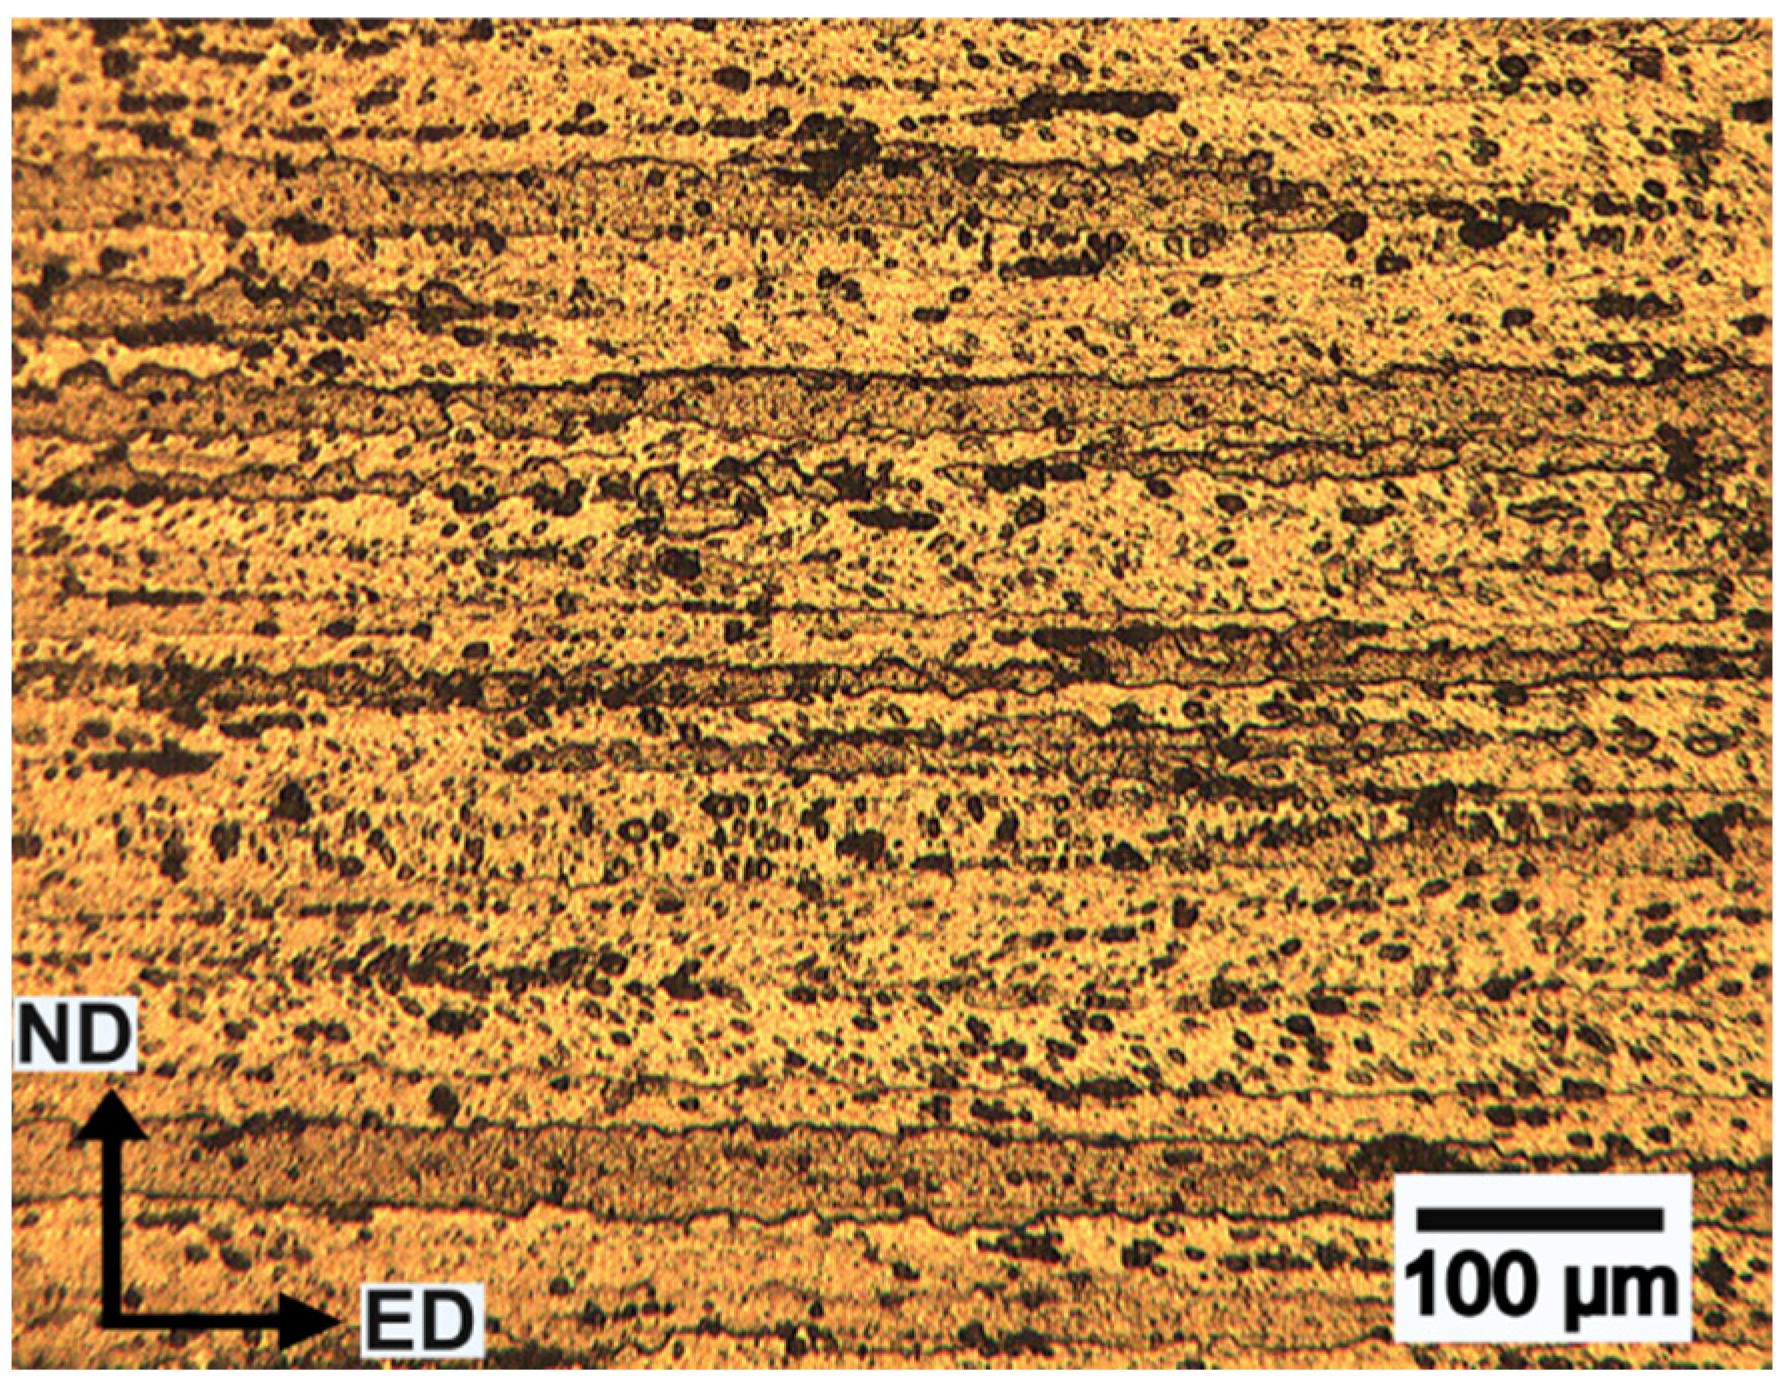
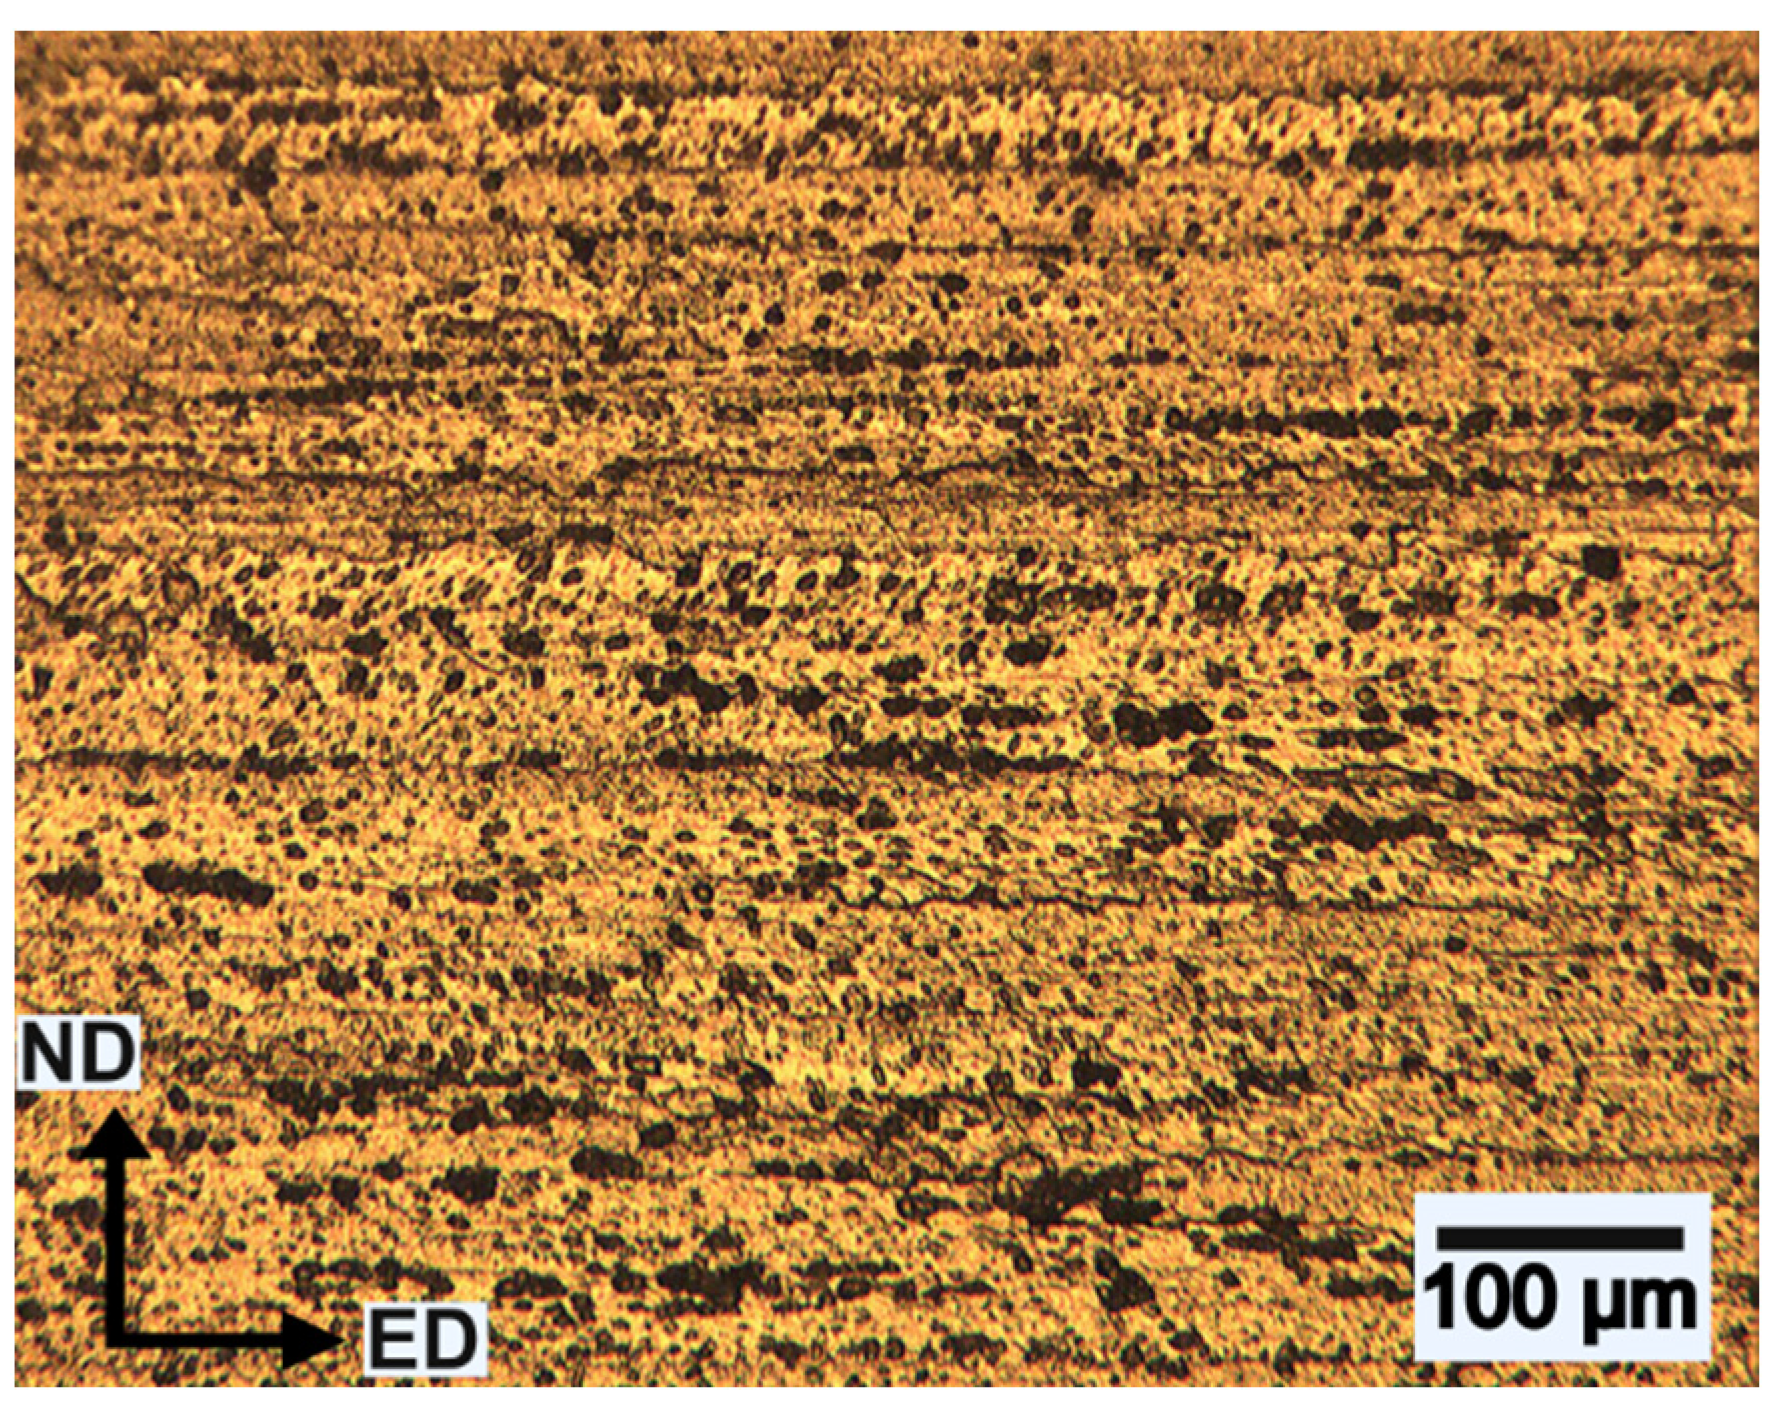
2.1. Material Characterization

The billets used in the tests and simulations were machined from extruded Al 6061 bars in T6 condition. The micrographs of the material were obtained by conventional manual saw cutting through the longitudinal plane and over the midsection of the billet. These samples were subsequently polished with cloth and diamond paste with a particle size < 1 µm in a Prazis metallographic polisher (Prazis, C.A.B.A., Argentina). Finally, the chemical etching was carried out with the Keller reagent during 30–60 s. The observation of the microstructure was performed using an Olympus microscope (Olympus, Tokyo, Japan).
Figure 2 shows the optical micrograph image taken from the material before being formed by ECAE. It reveals the typical aspects of a unidirectional cold formed high stacking fault energy material with morphological texture, i.e., elongated Al (α) grains in the extrusion direction (ED) and precipitates such as Mg2Si and/or intermetallic (Fe-Cr)3SiAl12 or simply AlFeSi [23].
Tensile tests of the material before the ECAE were carried out according to [24] on an INSTRON universal testing machine (INSTRON, Massachusetts, USA). The true stress-strain curve of the material obtained during tests is shown in Figure 3. The elastic region was identified and characterized. The region with a uniform plastic strain was interpolated by means of a Hollomon type law [25]. A summary of the values of the Young modulus (E), Poisson ratio (ν), yield strength (σ0.2), coefficient of resistance (K), and strain hardening exponent (n) of the Hollomon equation obtained and used in the simulations to be presented below are listed in Table 1.
Finally, the microhardness measurements were made at randomly selected points, the mean value of the measurements was 90 HV, and the standard deviation was very low.

2.2. ECAE

The test was carried out in the ECAE device shown in Figure 4a. It has two channels with 10 mm × 10 mm of cross section and Φ = 90° and Φ = 120°. The test and simulation presented in this article correspond to the channel with Ψ = Φ = 90°. The fillet radius of the inner die corner is 1 mm. Figure 4b shows the size of the billet used in the tests, i.e., a square section with 10 mm side and 55 mm of length. They were machined from extruded Al 6061 bars in T6 condition. Figure 4c shows the billets arranged in the extrusion channels, and finally Figure 4d shows the billets before and after ECAE processing. The forming process by ECAE was carried out at a speed low enough to neglect the effects of self-heating and strain rate on the behavior of the material. Industrial grease for high pressure bearings was used as a lubricant (YPF, C.A.B.A, Argentina).
The mechanical characterization of the material includes microhardness and tensile tests (see Figure 3). The microhardness test was performed with a Leitz tester (Esselte Leitz GmbH & Co KG, Stuttgart, Germany). The weight used in the tests was 100 g and the time of the load application was 30 s. The microhardness was measured in ED and ND through the center point of the stable region.
Figure 5 indicates, on the scheme of the deformed billet through the central point of the stable region (point 11), the directions used in the microhardness measurements (dashed and dot lines) and the material points used in the analysis of the evolution of the equivalent plastic strain and the strain inhomogeneity according to the ND direction, i.e., points 4, 11, and 18.

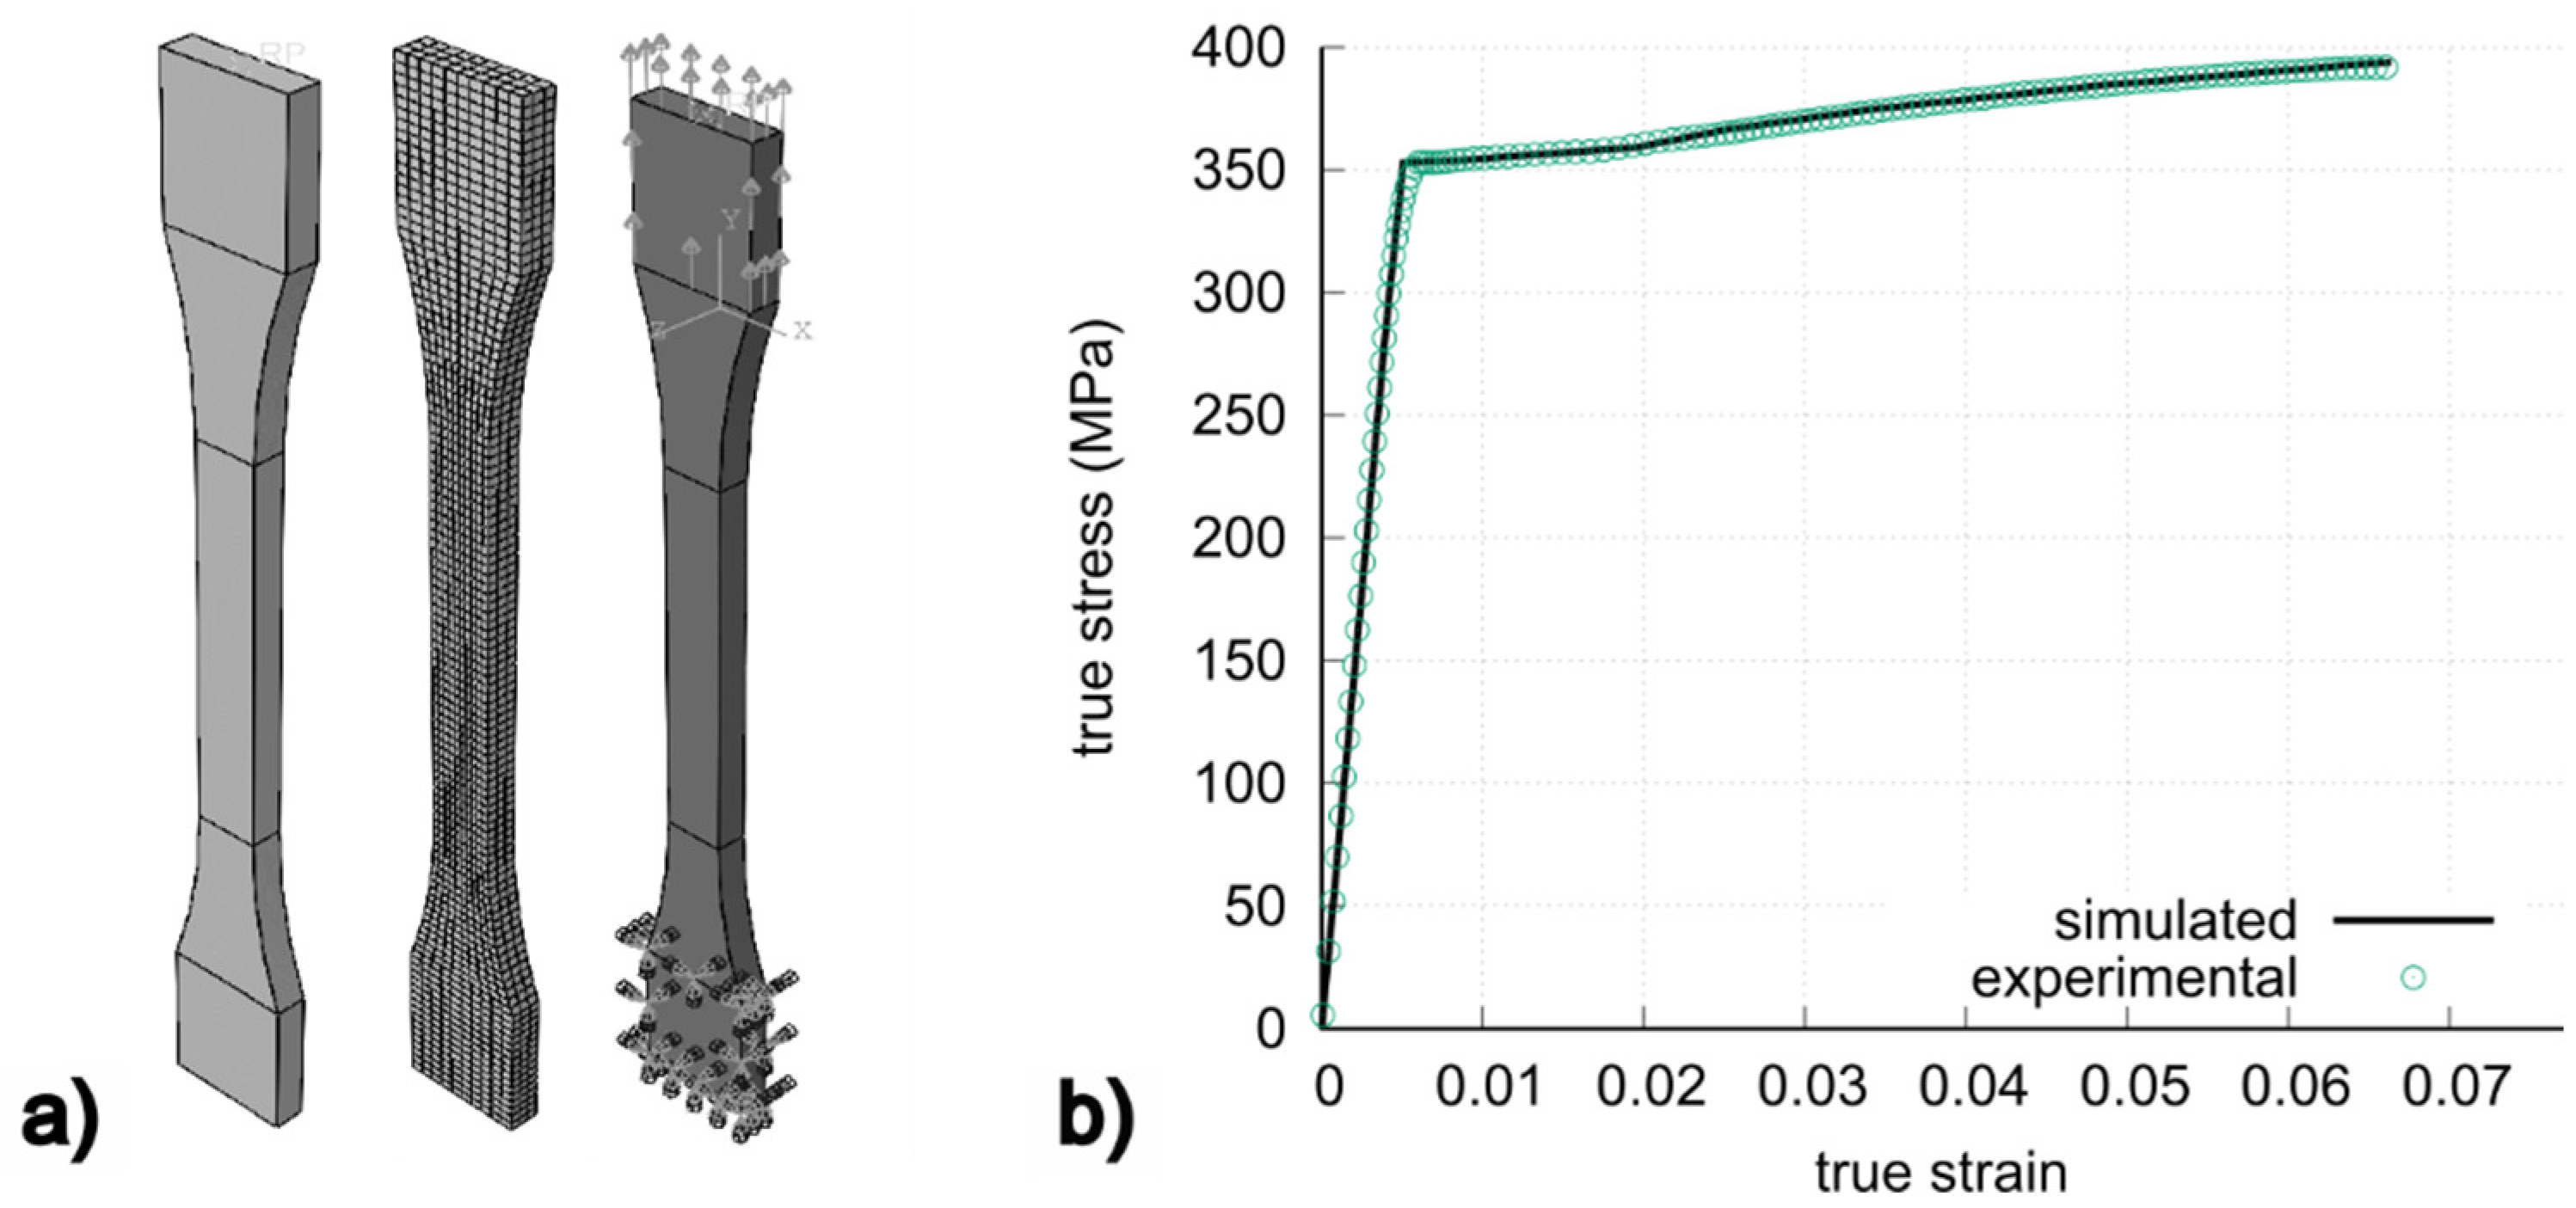
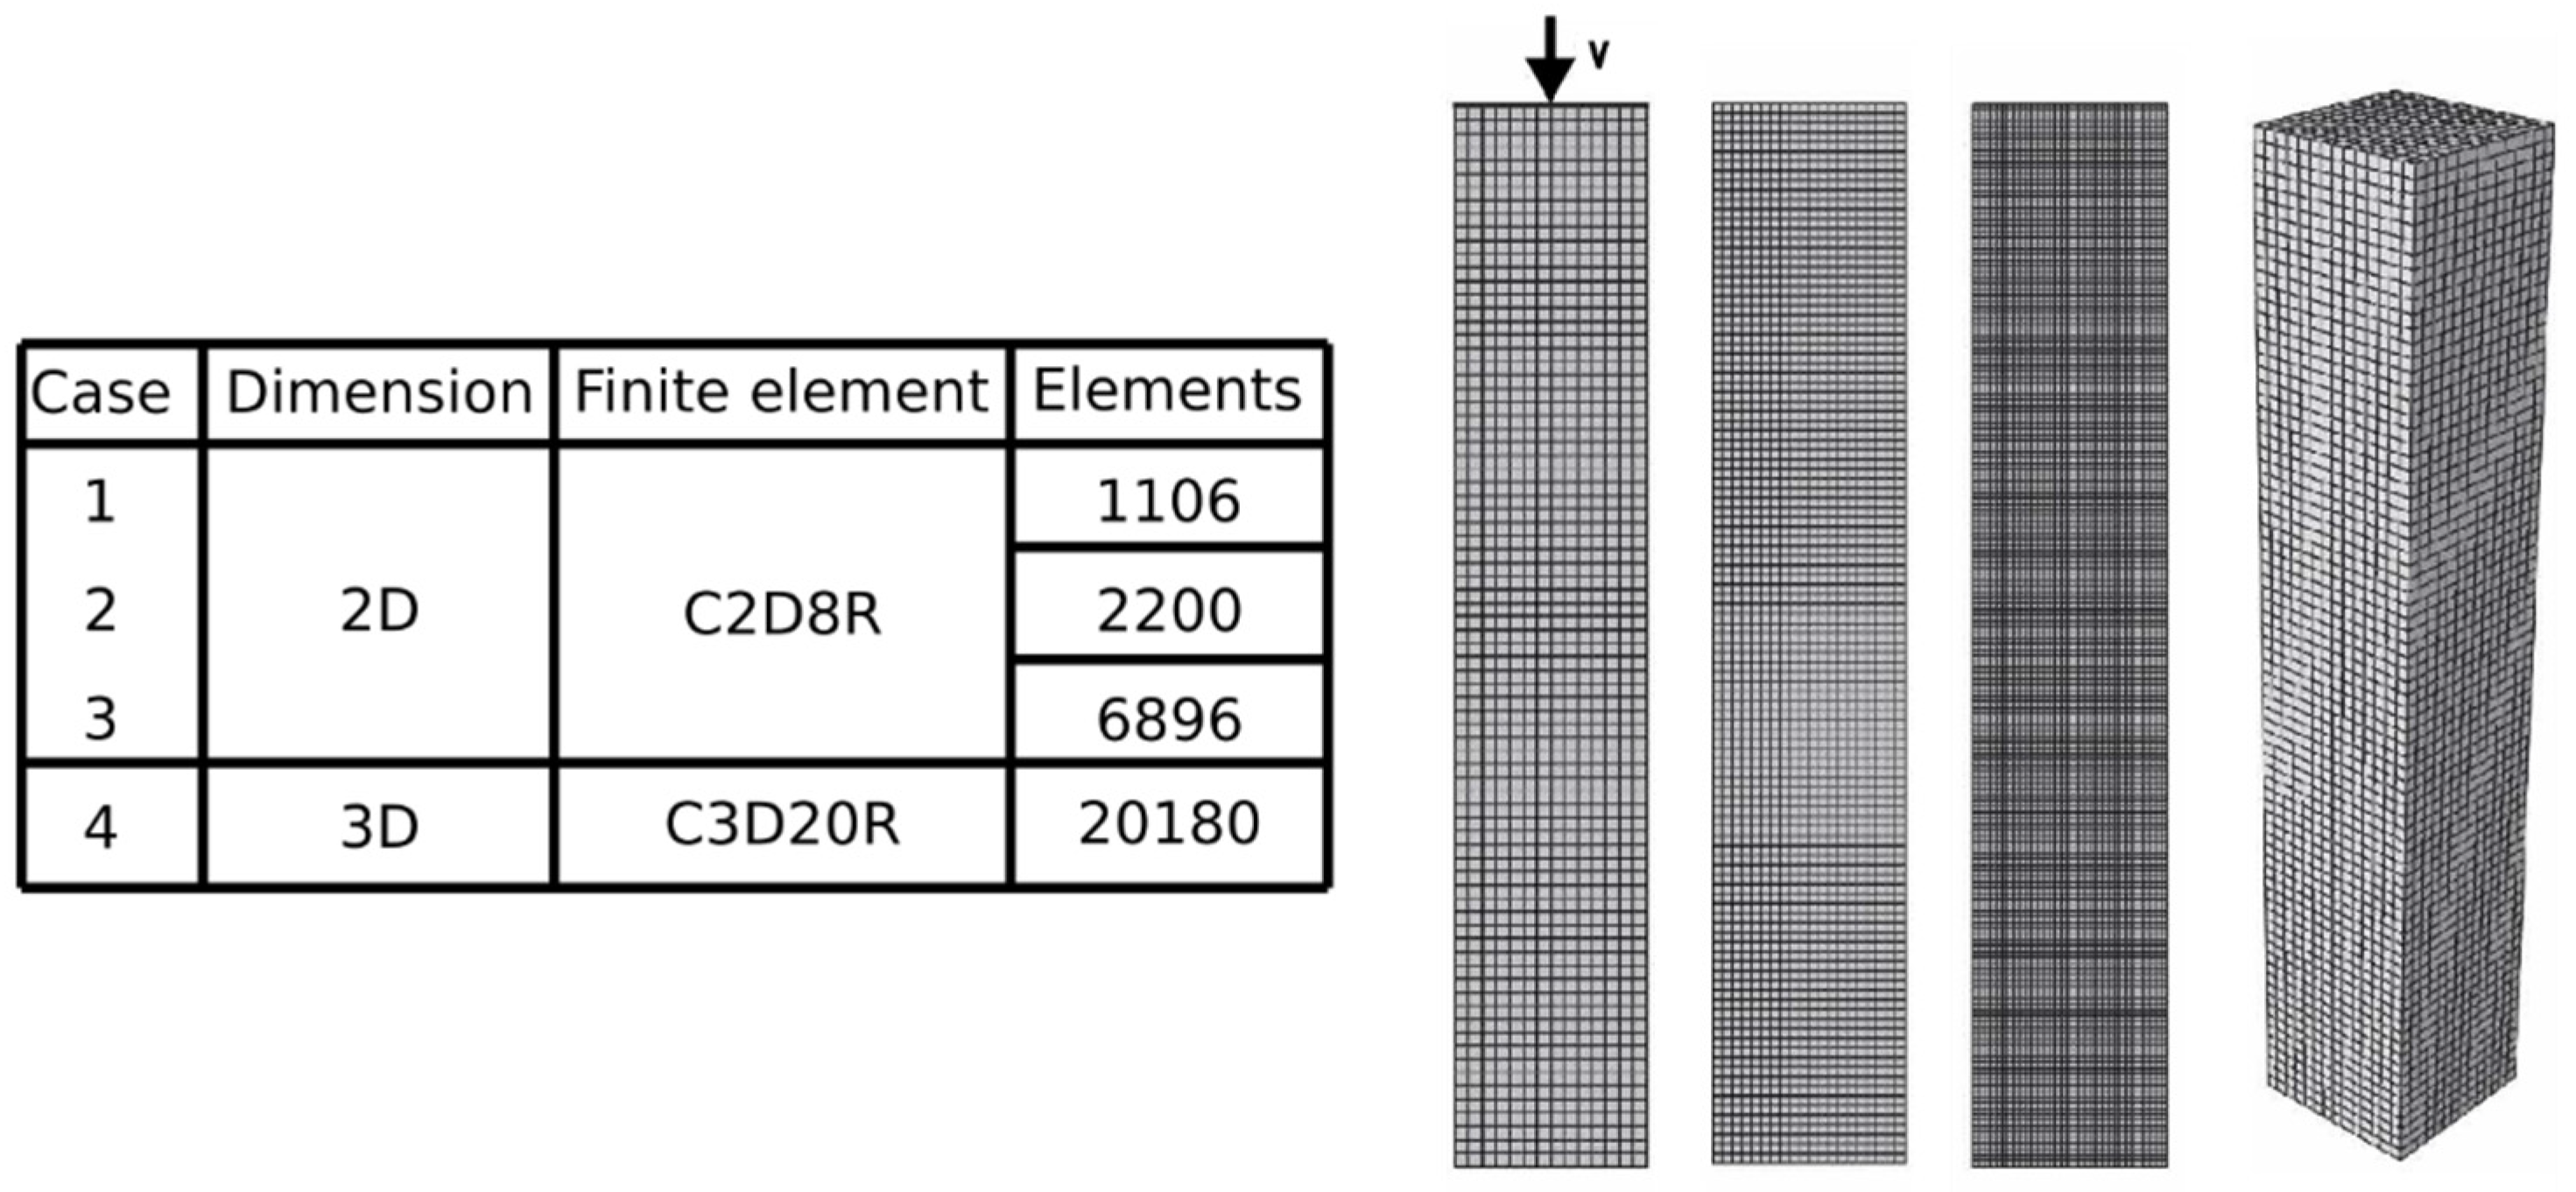
3. Numerical Simulation

The verification of the material response was carried out by modeling the tensile test and fitting the numerical and experimental curves. The model of the part and mesh and boundary conditions are showed in Figure 6a. The model was meshed with 3420 hexahedral second order elements with reduced integration—C3D20R. In Figure 6b, the experimental and simulated true stress-true strain curves are superimposed.
The variational formulation of the mechanical problem with boundary and initial conditions was solved using the finite element method [26]. The simulations were carried out using the general-purpose finite element code ABAQUS/Standard [27] (Dassault Systémes Simulia Corp, Vélizy-Villacoublay, France). The ECAE matrix was considered a rigid continuum medium and the Al specimens as elastoplastic continuum medium with isotropic hardening. The plasticity model is associative where the yield criterion considered is that of the maximum distortion energy. To solve the model, the radial return algorithm is used with an iterative incremental procedure in an updated Eulerian formulation.
In order to determine an optimal relationship between the computational cost and the quality of the numerical solution of the ECAE process in the channel used in this work, a convergence study was first performed. Four simulations were carried out: three with two dimensional models considering the deformation behavior at the central plane of the billet in ED, for which plane strain conditions were considered, and the remaining one with a three-dimensional model. Figure 7 presents and shows the main features of the meshes used in the simulations. The punch speed imposed in the simulations was 0.1 mm/s. The simulations consider tangential and normal contact with friction between the outer surface of the billet and the channel walls, where the friction coefficient used in simulations was 0.1 (typical value used by different authors, for example in [13]). The contact and friction increase the strain near the inner channel of the ECAE device but in general does not change its distribution, and decrease the strain inhomogeneity due to the effect of the backpressure exerted by frictional drag between the surfaces of the billet and exit channel [15].

4. Results and Discussion

In Figure 8, the values of the equivalent plastic strain of the 21 points of the medium stable region of the billet shown in Figure 5 at the end of process and the extrusion force are compared. In Figure 8a, it is observed that the differences between the values of equivalent plastic strain in the region comprised between the peak, approximately at 1 mm (s = 0.1), and the minimum, at 8 mm (s = 0.8), are not negligible. At the points of the billet near the inner channel of the ECAE device, the value of equivalent plastic strain and its gradients tend to soften for the refined meshes, either two or three-dimensional. Concerning the increase of equivalent plastic strain on the inner die corner, it is maximum for a three-dimensional case and tends to decrease as the 2D mesh becomes coarser. Beyond the contact surface at the billet/inner channel, the transition towards the middle of the billet is smoother in the three-dimensional case than two-dimensional models and vanishes as the refinement of the two-dimensional mesh increases (Figure 8a). From the peak (≈ 1mm or s = 0.1) to the point of contact of the billet with the outer channel at 10 mm or (s = 1), the values and the variation of equivalent plastic strain are very close for all meshes. Finally, in the contact region of the billet with the outer channel, the value of equivalent plastic strain is maximum in the three-dimensional case and is almost constant for the two-dimensional ones (Figure 8a).
Looking over the extrusion force, the values are similar for all cases. At the initial stage the differences are negligible. At approximately 12 mm of the punch displacement, the extrusion force for the three-dimensional mesh crosses the curves of the two-dimensional models and becomes greater up to 22 mm, from where the value of the extrusion force for the four cases reaches the maximum value (Figure 8b). Beyond this displacement, the extrusion force decreases and at 32 mm practically acquires the same value for all cases.
Based on the analysis carried out and considering that, of the three characteristics regions of a billet deformed by ECAE—head, stable region, and tail (according to [13])—only in the stable region do the stresses and strains tend to be homogeneous and that the differences shown in Figure 8a in the middle section of the stable region do not justify the use of the fine 2D or 3D meshes, the results presented below correspond to the intermediate two-dimensional mesh.
Figure 9 shows the equivalent plastic strain of three points close the inner and outer channels and in the middle zone of the billet (material points 4, 11, and 18 in Figure 5, respectively) in function of punch displacement. In Figure 9a–c, the points that delimit the sections of the graphs for which the gradient of equivalent plastic strain is different than zero are indicated. To correlate these sections with the position of the material points during extrusion, in the same figures and on the flow lines of points 4, 11, and 18 are indicated the points marked in the graphs of equivalent plastic strain in function of punch displacement. Examining Figure 9a–c, it is observed that the values and the evolution of equivalent plastic strain are conditioned by the position of the material point in the extrusion channel. They are marked differently, in value and history, at point 4 with respect to points 11 and 18.
Figure 9a corresponds to point 4 on the lower region of the billet close to the outer channel, four sections of which ε ¯ pl / d 0 can be identified and are indicated as Section 1, Section 2, Section 3, and Section 4. In the case of points 11 and 18, at the middle and upper region of the billet, respectively, unlike point 4 there are two sections in which ε ¯ pl / d 0 , labeled as Section 1 and Section 2 in Figure 9b,c, respectively. The values of the equivalent plastic strain at the end of ECAE at points 4, 11, and 18 are 0.99, 0.89, and 0.37, respectively. As can be seen, the final equivalent plastic strain is maximum in the material points close to the inner channel and decreases when moving towards the outer channel.
An interesting and not very in-depth aspect of the analysis of equivalent plastic strain values in the ECAE process is its distribution at the end of the process. In the case of point 4, the evolution of equivalent plastic strain has four increments ( ε ¯ pl ). Its take place at the four sections at which ε ¯ pl / d 0 : 24.7%, 32.2%, 38.0%, and 5.1% (Section 1, Section 2, Section 3, Section 4 in Figure 8a). The first three ε ¯ pl represent 94.9% of the total equivalent plastic strain, which is split almost evenly in the noted increments. In points 11 and 18, the distributions of the final equivalent plastic strain differ from that of point 4 and are similar to each other (see Figure 9b,c). In the case of point 11, the total equivalent plastic strain is split in two ε ¯ pl , for which 7.8% and 92.2% of the total equivalent plastic strain are reached (Section 1, and Section 2 in Figure 9b). At point 18, near to the inner channel, although it is observed that the total equivalent plastic strain is split in three   ε ¯ pl ; 99.2% of the total equivalent plastic strain is reached in the two initial ε ¯ pl , 11.0% and 88.2% respectively (Section 1, and Section 2 in Figure 9c), corresponding to the third ε ¯ pl being 0.8% of the total equivalent plastic strain (Section 3 in Figure 9c).
The differences in the values and evolution of the equivalent plastic strain shown in Figure 9 are due to the kinematics of the material points 4, 11, and 18, shown in Figure 10. Their analysis, in addition to contributing to the detailed description of the evolution of the process, allows for modeling the evolution of the texture and microstructure based on polycrystalline simulations based on the deformation histories of each material point. In Figure 10a–c. it is observed that the rigid rotation (w) is similar in the three points and, as we move from the external to the internal channel, its magnitude decreases. The magnitude of the components of the strain rate tensor, D11, D12, and D22, varies inversely to rigid rotation, and it decreases as we move from the internal to the external channel. A deeper analysis of the components of the tensor D allows us to justify the sections indicated in Figure 9a–c. In the case of material point 4 (next to the external channel), there is no section of the curves for which the components of tensor D have greater preponderance, hence the final value of the equivalent plastic strain is almost uniformly distributed among the sections indicated as 1–4 in Figure 9a. In contrast, before the material points 11 and 18 enter to the central fan region (non-null rigid rotation), the components of tensor D are negligible; when they enter in the noted region, the components of tensor D increase and acquire the maximum value, hence the greater contribution of Section 2 in Figure 9b–c to the final value of the equivalent plastic strain.
In Figure 11, the profiles of equivalent plastic strain along ND and ED at the center of the stable region are shown. As can be seen, in the ED the equivalent plastic strain is quasi-constant, whereas in the ND it varies along the height of the billet, being more pronounced in the regions of the billet near the outer channel. Although the analysis developed so far made light on the values and distribution of equivalent plastic strain of the material points in the three characteristic regions of the billet at end of the extrusion (Figure 9), the analysis of the inhomogeneity of the deformation along the height of the specimen deformed by ECAE involves analyzing the equivalent plastic strain at the 21 points indicated in Figure 5.
Figure 12 shows the values of equivalent plastic strain in the noted points obtained in the simulation, the values published in [22], which considers the material as being perfectly plastic and for which the friction effect was excluded in the simulation, and those calculated with the analytical models proposed in [5,7] for the geometry of the channel used in this article. From the analysis of the values obtained in the simulations, the inhomogeneity of the equivalent plastic strain is observed along ND of the middle section of the stable region. Looking more closely, four regions can be distinguished. Region I corresponds to the part of the billet in contact with the inner channel of the ECAE device in which the equivalent plastic strain reaches the maximum value in this region (1.05) at a distance of 0.5 mm from the inner channel (s = 0.05); on the surface of the inner channel the equivalent plastic strain is equal to 0.77. This fluctuation could be due to the dimensional limitation of the model used to catch the localization of the strain at the inner die corner (see analysis of Figure 8). As we move into the outer channel, the equivalent plastic strain decreases, being able to distinguish two regions in whose sections the ε ¯ pl changes. Region II extends from s = 0.1–0.5 and the equivalent plastic strain decreases from 1.05 to 0.89 ( ε ¯ pl = 0.16). In Region III, the equivalent plastic strain goes from 0.893 to 0.371 and extends from s = 0.5–0.8. Clearly, the negative ε ¯ pl is considerably higher in region III due to the effect of the finite radius of the outer channel. In region IV, close to the outer channel, the equivalent plastic strain increases from 0.37 to 0.60; this increment is due to the increase of the strain rate tensor at the starting point of Region IV to the external channel (semicircular regions on the external channel marked in Figure 9). Finally, comparing the equivalent plastic strain simulated and values extracted from [22], there are differences in regions I, II, and III, and a lack of uniformity throughout the entire section, from what is postulated in [5], according to which the equivalent plastic strain is 0.90, as well as in the so-called central fan region proposed in [7], for which equivalent plastic strain is 0.93 (α ≈ 17.6 and βm ≈ 54.8) from s = 0 until s ≈ 0.81.
Quantitatively the degree of inhomogeneity of the plastic strain shown in Figure 12 can be estimated by calculating the strain inhomogeneity index proposed in [13]:
C i = ( ε ¯ pl ,   max ε ¯ pl ,   min ) / ε ¯ pl ,   mean ,  
where ε ¯ pl ,   max , ε ¯ pl ,   min , and ε ¯ pl ,   mean are the maximum, minimum, and mean equivalent plastic strain along the thickness of the billet. Table 2 shows the values of the listed variables and the index Ci.
The values reported in Table 2 show that as the two-dimensional models use finer meshes or a three-dimensional model is used, the value of Ci and strain inhomogeneity tend to decrease. From the analysis of ε ¯ pl ,   i with i: max, min, and mean, it is observed that the variation of ε ¯ pl ,   min does not present a clear trend when refining the mesh or using a three-dimensional model. This makes sense because, as was noted, the ε ¯ pl ,   min has its origin in the value of the angle of the outer channel ψ ≠ 90°. In contrast, the ε ¯ pl ,   max tends to decrease as the two-dimensional mesh is finer or if the three-dimensional model is used because, as was concluded, the origin of Region I is the spatial dimension of the model and the refinement of the mesh used in the 2D simulations. From the analysis of the ε ¯ pl ,   min and ε ¯ pl ,   max , it follows that the values ε ¯ pl ,   mean increase and, as a consequence (see Equation (1)), the coefficient Ci decreases as the mesh used in the simulations is finer or if the model used is three-dimensional.
As can be seen from the analysis carried out as a result of ECAE processing in general and strain inhomogeneity in particular, the material hardness and grains are stretched in the ED direction.
Figure 13 shows the microhardness profiles along ED and ND at point 11. In ED, the hardness presents a soft and slight tendency to increase from the beginning and end of the stable region towards point 11, where the mean value and the associated standard deviations were 92 ± 1 HV and 91 ± 2 HV, respectively. In ND, the hardness increases from the outer to the inner channel, where in the material point 21 of Figure 5, the microhardness is the highest and equal to 103 HV. In the head and the tail part of the deformed billet, the measured values showed considerable deviations (the equivalent plastic strains in the noted regions are inhomogeneous), and the mean values in each one were 110 HV in the tail and 90 HV in the head.
In Figure 14, the microhardness as a function of the equivalent plastic strain in the 21 points of the middle section of the stable region (dashed line in Figure 5) is plotted. Clearly and even when the strain hardening of the material shaped is low, it can be seen that as the strain increases the hardness value does so as well.
Finally, Figure 15 shows a micrograph of a midpoint of the central region of the extruded billet. Comparing the material before and after being processed by ECAE (Figure 2 and Figure 15), it is observed that the Al grains (α solid solution) and the intergranular precipitates have stretched in the extruded direction (ED) and their thickness has decreased in the normal direction (ND), whereas the precipitates have been deformed and aligned in ED. The average sizes of the Al grains before and after the deformations were 60.07 µm and 39.93 µm.

5. Conclusions

The main conclusion for the material and ECAE device used in this work (Ψ = Φ = π/2) is that the equivalent plastic strain is not discontinuous, it is neither uniform throughout the entire height of the specimen, nor does it have the idealized central fan shape proposed by other authors.
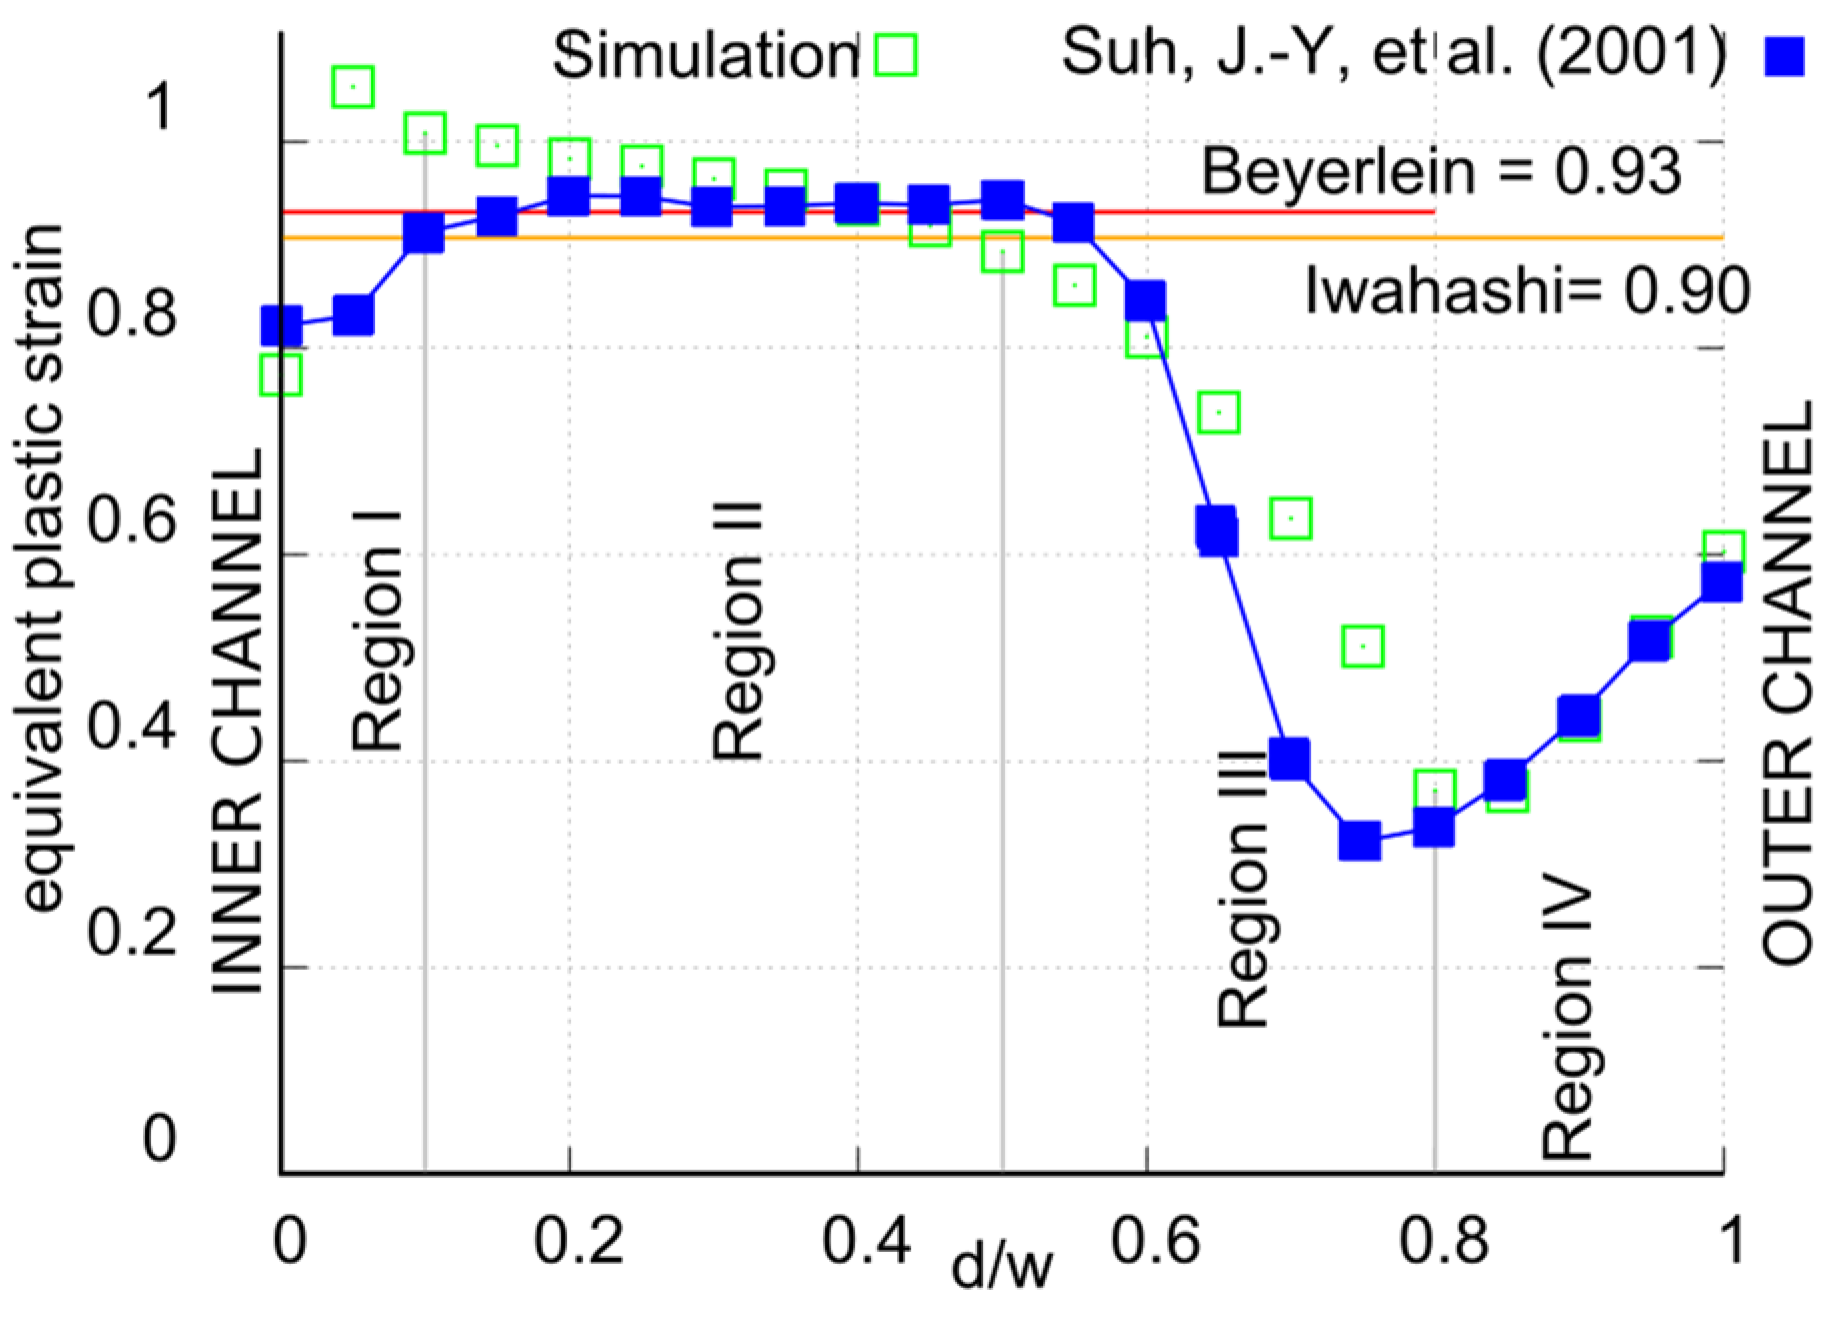
  • Regarding the influence of the model and the refinement of the mesh used in the simulations, it can be said that the differences in the values of the equivalent plastic strain in the regions far from the inner walls of the extrusion device are negligible, being appreciated in the regions near the inner channel due to the localized effects of inner die corner.
  • The billet starts to deform plastically in regions before and after the PDZ, being greater in the regions close to the inner channel due to the finite radius of curvature of the outer channel.
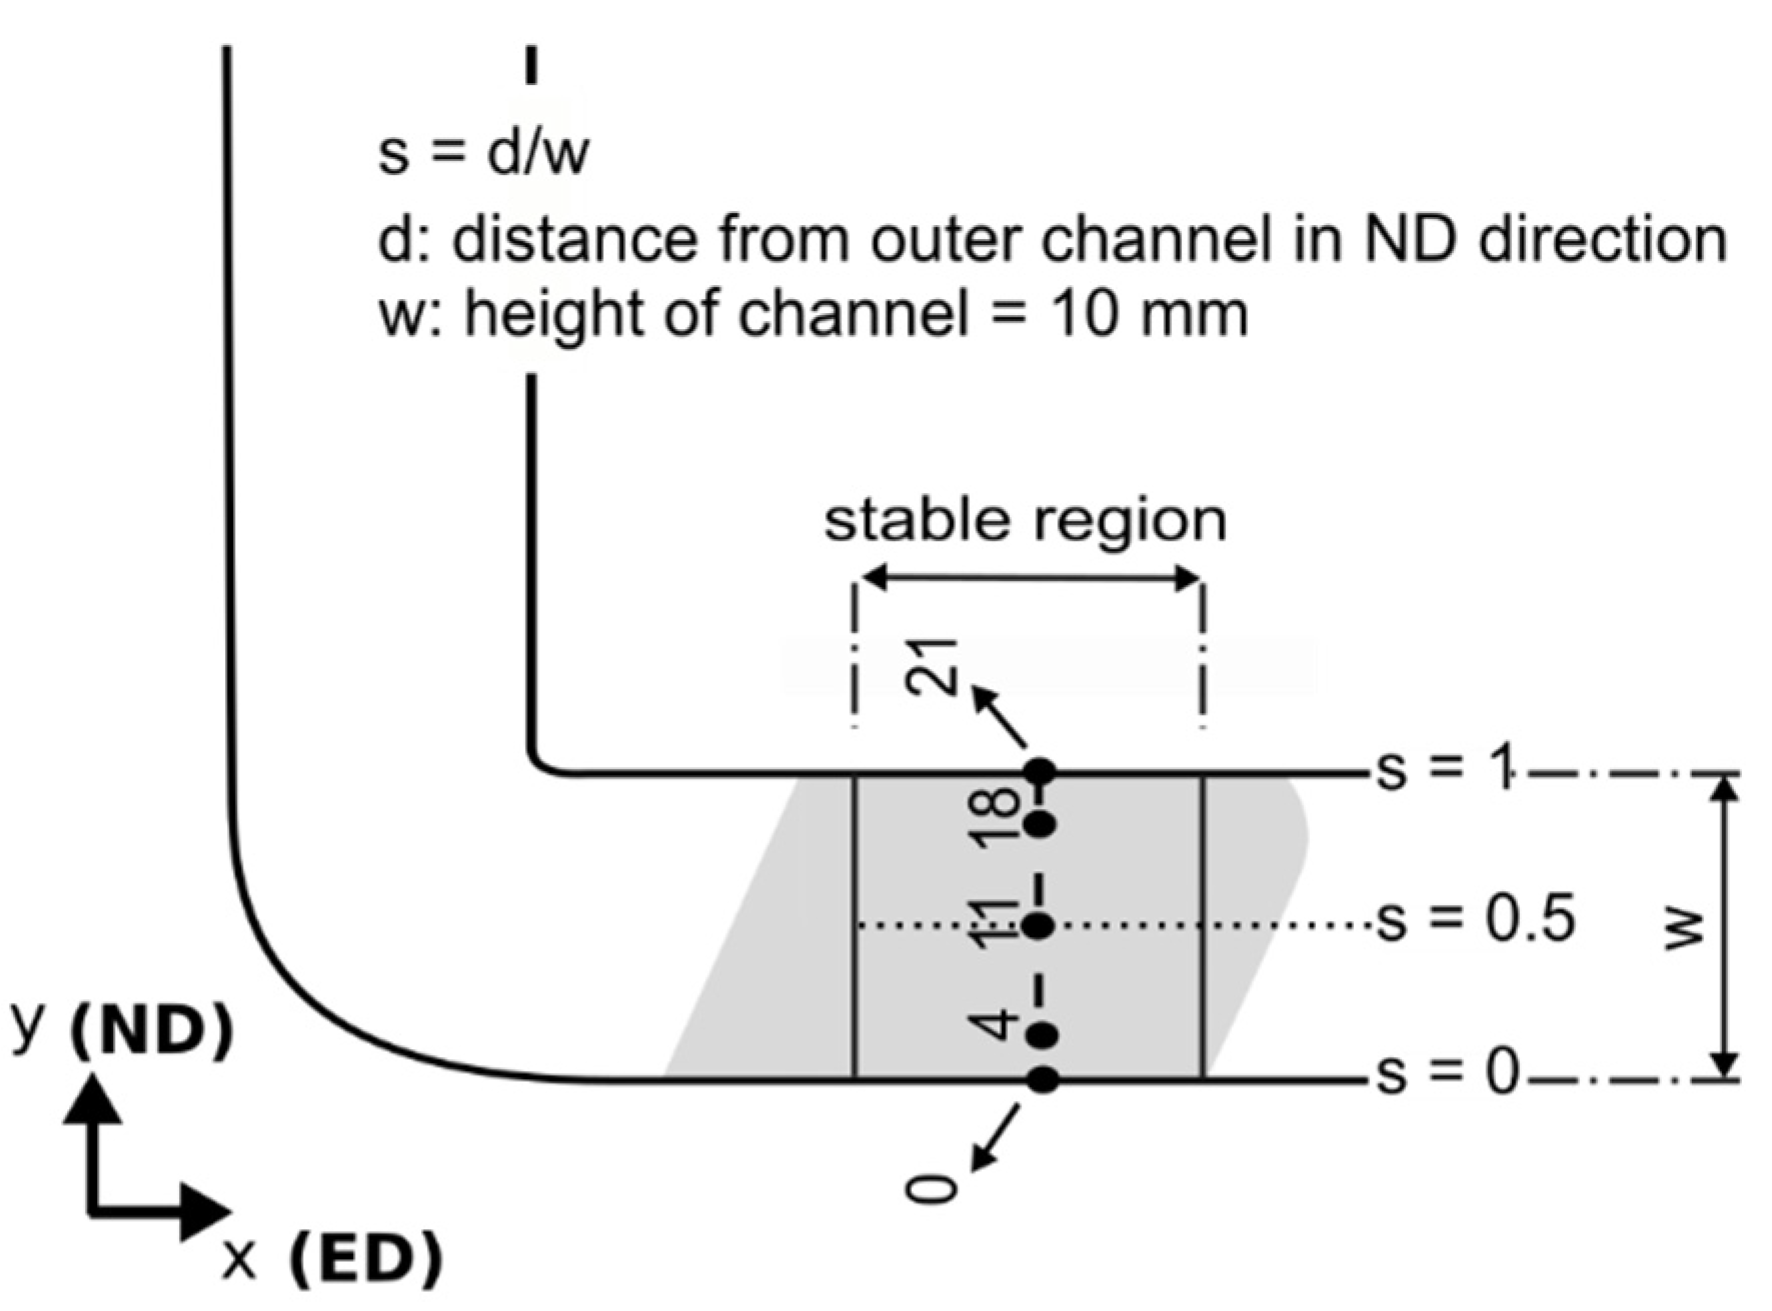
  • The uniform values of equivalent plastic strain calculated from analytical models are approximately equal to each other and to the value of simulations at s ≈ 0.5, being closer to the simulated values in Regions I and II of the 3D mesh, for which the location effect caused by the inner die corner is captured and the finite radius of the external channel is less pronounced.
  • Concerning the hardening of the material processed in this work, a relationship was observed between the value of the equivalent plastic deformation reached and the measured microhardness value. According to the ED and along the line across the middle height of the stable region, the hardness and deformation are constant and greater than initially measured. However, according to the ND through the central point of the stable region, the hardening is directly related to the equivalent plastic deformation reached in the 21 points used in the analysis.

Author Contributions

Conceptualization and design of a project, F.D.C., J.S., J.J.P.A. and C.M.G.; formal analysis, F.D.C., J.J.P.A. and J.S.; simulations, F.D.C. and J.J.P.A.; design, construction and experiments, F.D.C., J.J.P.A. and C.M.G.; microstructural and microhardness characterization, R.L.; investigation and analysis of results, F.D.C., J.J.P.A. and J.S.; writing—original draft preparation, F.D.C.; writing—review and editing, F.D.C., J.J.P.A., J.S. and D.J.C.; supervision, J.S.: and D.J.C.; funding acquisition, D.J.C. All authors have read and agreed to the published version of the manuscript.

Funding

This work was financially supported by Institute of Applied Mechanics and UNSJ through CICITCA grand and by Chilean Agency of Research and Development (ANID) through Fondecyt Project 1180591.

Data Availability Statement

All data supporting published results can be found in this paper.

Acknowledgments

The authors would like to thank Soluciones Industriales S.R.L. by machining the ECAE device.

Conflicts of Interest

The authors declare no conflict of interest.

References

  1. Valiev, R.Z.; Estrin, Y.; Horita, Z.; Langdon, T.G.; Zehetbauer, M.J.; Zhu, Y. Producing Bulk Ultrafine-Grained Materials by Severe Plastic Deformation: Ten Years Later. JOM 2016, 68, 1216–1226. [Google Scholar] [CrossRef] [Green Version]
  2. Valiev, R.Z.; Korznikov, A.V.; Mulyukov, R.R. Structure and properties of ultrafine-grained materials produced by severe plastic deformation. Mater. Sci. Eng. A 1993, 168, 141–148. [Google Scholar] [CrossRef]
  3. Segal, V.M.; Reznikov, V.I.; Drobyshevskiy, A.E.; Kopylov, V.I. Plastic working of metals by simple shear. Russ. Met. 1981, 1, 99–105. [Google Scholar]
  4. Sadasivan, N.; Balasubramaian, M.; Rameshbapu, B.R. A Comprehensive Review on Equal Channel Angular Pressing of Bulk Metal and Sheet Metal Process Methodology and its Varied Applications. J. Manuf. Process. 2020, 59, 698–726. [Google Scholar] [CrossRef]
  5. Iwahashi, Y.; Wang, J.; Horita, Z.; Nemoto, M.; Langdon, T.G. Principle of equal-channel angular pressing for the processing of ultra-fine grained materials. Scr. Mater. 1996, 35, 143–146. [Google Scholar] [CrossRef]
  6. Tóth, L.S.; Massion, R.A.; Germain, L.; Baik, S.; Suwas, S. Analysis of texture evolution in equal channel angular extrusion of copper using a new flow field. Acta Mater. 2004, 52, 1885–1898. [Google Scholar] [CrossRef]
  7. Beyerlein, I.J.; Tomé, C.N. Analytical modeling of material flow in equal channel angular extrusion (ECAE). Mater. Sci. Eng. A 2004, 380, 171–190. [Google Scholar] [CrossRef]
  8. Wagner, M.F.X.; Nostitz, N.; Frint, S.; Frint, P.; Ihlemann, J. Plastic flow during equal-channel angular pressing with arbitrary tool angles. Int. J. Plast. 2020, 134, 102755. [Google Scholar] [CrossRef]
  9. Habibi, M.; Darabi, R.; de Sa, J.C.; Reis, A. An innovation in finite element simulation via crystal plasticity assessment of grain morphology effect on sheet metal formability. Proc. Inst. Mech. Eng. Part L J. Mater. Des. Appl. 2021, 235, 1937–1951. [Google Scholar] [CrossRef]
  10. Safikhani, A.R.; Hashemi, R.; Assempour, A. Some numerical aspects of necking solution in prediction of sheet metal forming limits by strain gradient plasticity. Mater. Des. 2009, 30, 727–740. [Google Scholar] [CrossRef]
  11. Kim, H.S. Finite element analysis of equal channel angular pressing using a round corner die. Mater. Sci. Eng. A 2001, 315, 122–128. [Google Scholar] [CrossRef]
  12. Li, S.; Beyerlein, I.J.; Necker, C.T.; Alexander, D.J.; Bourke, M.A.M. Heterogeneity of deformation texture in equal channel angular extrusion of cooper. Acta Mater. 2004, 52, 4859–4875. [Google Scholar] [CrossRef]
  13. Li, S.; Bourke, M.A.M.; Beyerlein, I.J.; Alexander, D.J.; Clausen, B. Finite element analysis of the plastic deformation zone and working load in equal channel angular extrusion. Mater. Sci. Eng. A 2004, 382, 217–236. [Google Scholar] [CrossRef]
  14. Signorelli, J.W.; Vieira, E.A.; Turner, P.; Ferrante, M.; Bolmaro, R. Study by experiments and simulations of ECAE deformation of Al-4%Cu alloys. Rev. Matéria 2005, 10, 585–599. [Google Scholar]
  15. Patil, B.V.; Chakkingal, U.; Kumar, T.S.P. Influence of friction in equal channel angular pressing—A study with simulation. Metal 2008, 13, 1–9. [Google Scholar]
  16. Abioye, O.P.; Abioye, A.A.; Afolalu, S.A.; Udo, M.O.; Atanda, P.O.; Osinkolu, G.A. Numerical investigation of stress and strain distribution in equal channel angular extrusion of al 6063 alloy. Int. J. Civ. Eng. Technol. 2018, 9, 522–531. [Google Scholar]
  17. Skrotzki, W. Deformation heterogeneities in equal channel angular pressing. Mater. Trans. 2019, 60, 1331–1343. [Google Scholar] [CrossRef] [Green Version]
  18. Mishra, B.; Mohapatra, S.K.; Ranjan, V.; Maity, K. Equal channel angular pressing of the aluminum alloy: A numerical investigation. Mater. Today Proc. 2020, 26, 2173–2178. [Google Scholar] [CrossRef]
  19. Rashmi, G.; Shivashankar, P. Overview of different overhead transmission line conductors. Mater. Today Proc. 2017, 4, 11318–11324. [Google Scholar] [CrossRef]
  20. Yuanshen, Q.; Kosinova, A.; Lakin, E.; Popov, V.V., Jr.; Rabkin, E.; Lapovok, R. Effect of SPD processing on the strength and conductivity of AA6061 alloy. Adv. Eng. Mater. 2019, 21, 1801370. [Google Scholar] [CrossRef]
  21. SIST EN 50183:2000; Conductors for Overhead Lines Aluminium-Magnesium-Ailicon Alloy Wires. Slovenian Institute For Standardization: Ljubljana, Slovenia, 2000.
  22. Suh, J.Y.; Kim, H.S.; Park, J.W.; Chang, J.Y. Finite element analysis of material flow in equal channel angular pressing. Scr. Mater. 2001, 44, 677–681. [Google Scholar] [CrossRef]
  23. MacKenzie, D.S.; Totten, G.E. Analytical Characterization of Aluminum, Steel, and Superalloy, 1st ed.; Taylor and Francis: New York, NY, USA, 2005; pp. 105–106. [Google Scholar]
  24. ASTM. Standard Test Method for Tension Testing of Metallic Materials; ASTM E8/E8M-21; ASTM International: West Conshohocken, PA, USA, 2021. [Google Scholar] [CrossRef]
  25. Hollomon, J.H. Tensile deformation. Trans. AIME 1945, 162, 268–290. [Google Scholar]
  26. Zienkiewicz, O.C.; Taylor, R.; Zhu, J.Z. The Finite Element Method: Its Basis and Fundamentals, 6th ed.; Elsevier Butterworth: Oxford, UK, 2006; p. 54. [Google Scholar]
  27. Smith, M. ABAQUS/Standard User’s Manual, Version 6.9, 1st ed.; Dassault Systémes Simulia Cor: Providence, RI, USA, 2009. [Google Scholar]
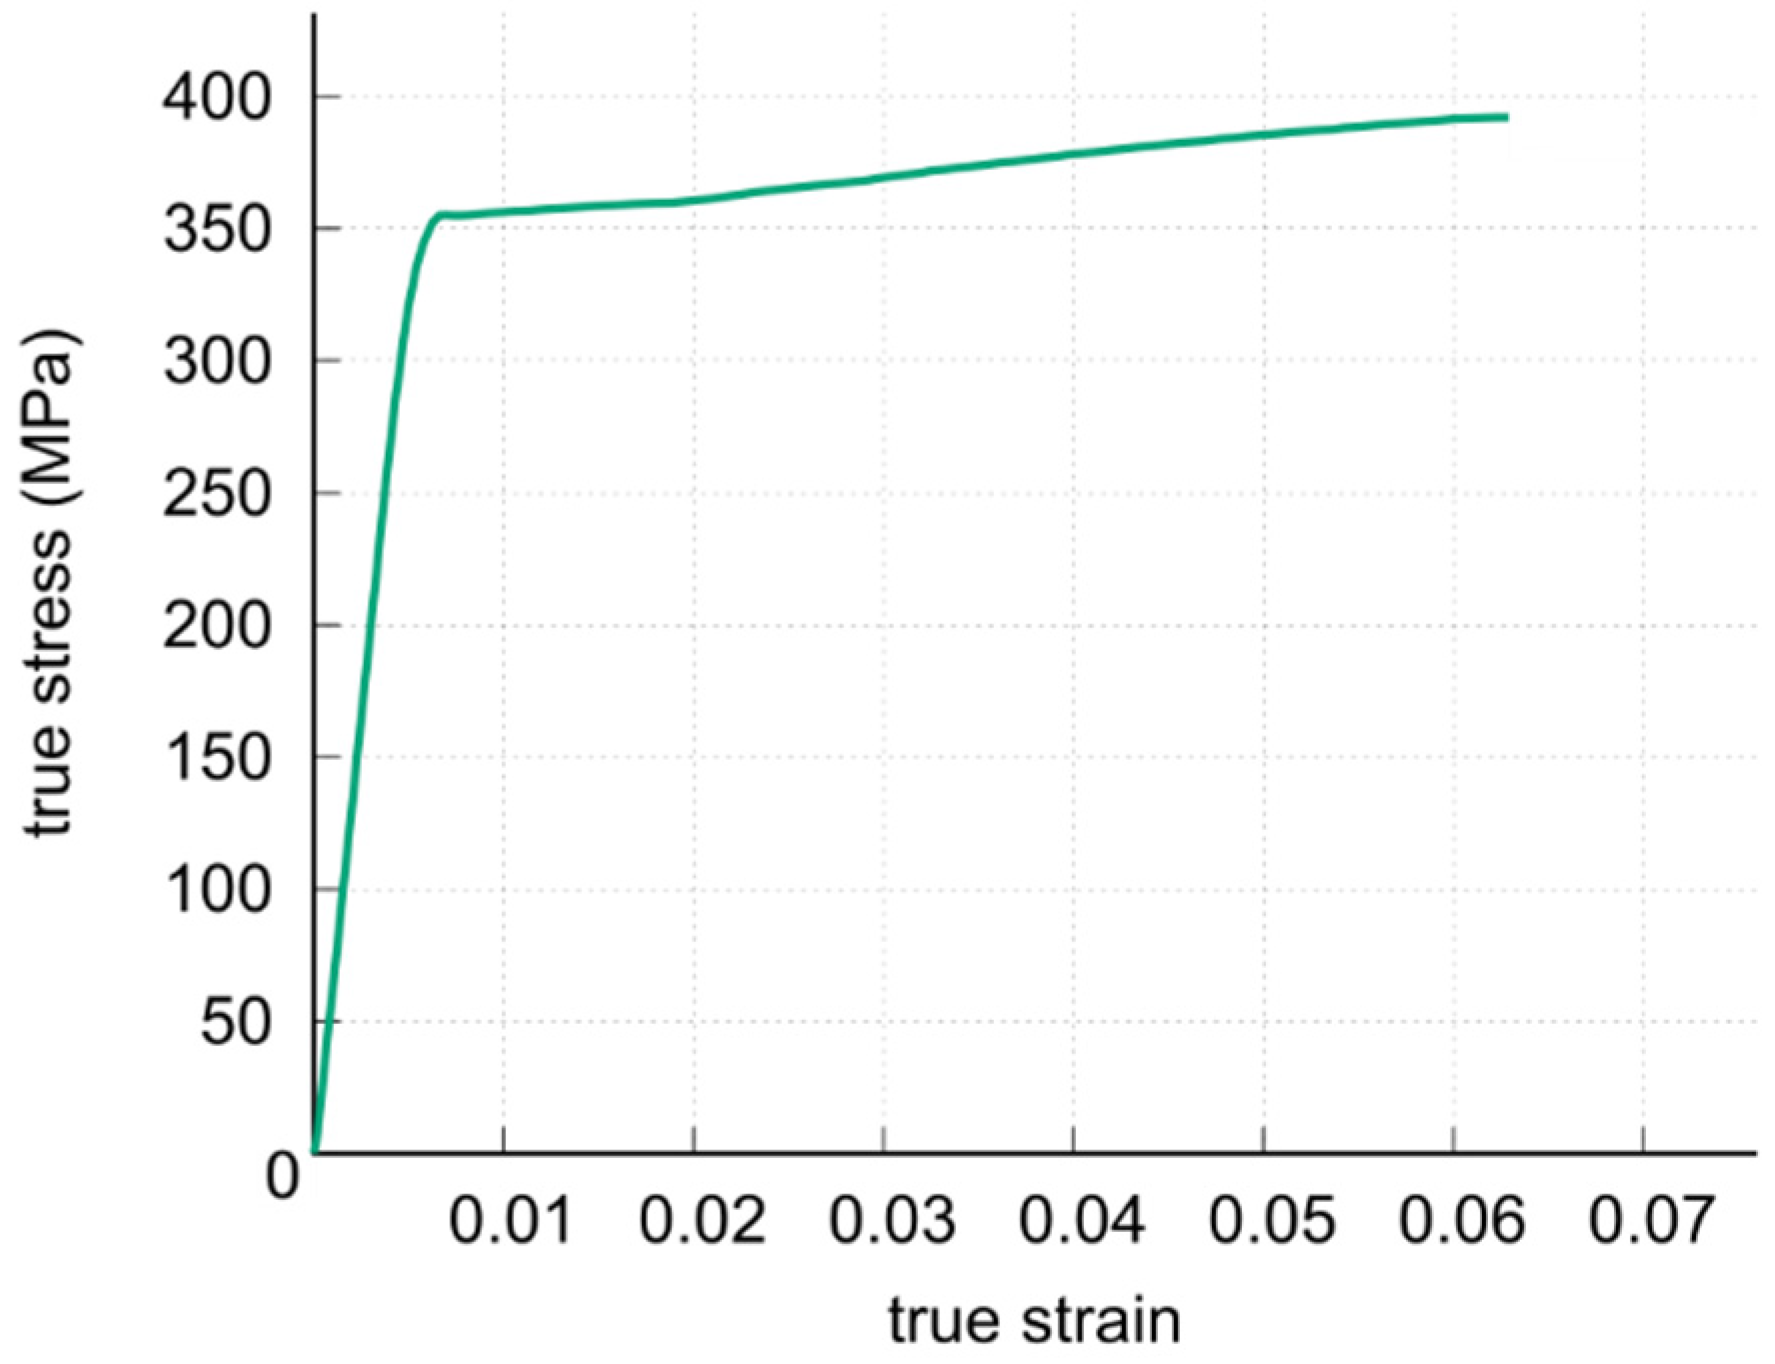
Figure 1. Schematic representation of ECAE device.
Metals 12 00299 g001
Figure 2. Optical micrograph image of the Al billet before being formed by ECAE (×100).
Metals 12 00299 g002
Figure 3. True stress-strain curve.
Metals 12 00299 g003
Figure 4. (a) Device used in the ECAE test; (b) dimensions of the billet used in the ECAE test; (c) ECAE device with billets on 120° and 90° channels 8; (d) undeformed and deformed billets.
Metals 12 00299 g004
Figure 5. Indication of the directions and the points selected to carry out part of the strain analysis and microhardness measurements.
Metals 12 00299 g005
Figure 6. (a) Model, mesh, and boundary conditions used in tensile test simulation; (b) flow tensile curve of the billet (before ECAE): experimental and simulated.
Metals 12 00299 g006
Figure 7. Main aspect features and meshes used in the convergence analysis.
Metals 12 00299 g007
Figure 8. (a) Equivalent plastic strain at 21 points indicated in Figure 5; (b) extrusion force obtained with the meshes shown in Figure 7.
Metals 12 00299 g008
Figure 9. Evolution of the equivalent plastic strain as a function of the punch displacement: (a) point 4; (b) point 11; (c) point 18.
Metals 12 00299 g009
Figure 10. Evolution of components of symmetric part of the velocity gradient tensor and accumulative rigid body rotation angle as a function of punch displacement: (a) point 4; (b) point 11; and (c) point 18.
Metals 12 00299 g010
Figure 11. Equivalent plastic strain in central region of the billet along ND and ED at the 21 points indicated in Figure 5.
Metals 12 00299 g011
Figure 12. Equivalent plastic strain along ND at the 21 points indicated in Figure 5, adapted from [22].
Metals 12 00299 g012
Figure 13. Microhardness profiles in central region of the billet along ED and ND at point 11 (dotted and broken lines in Figure 5).
Metals 12 00299 g013
Figure 14. Microhardness as a function of the equivalent plastic strain at the 21 points indicated in Figure 5.
Metals 12 00299 g014
Figure 15. Optical micrographs image of the Al billet after the ECAE deformation (×100).
Metals 12 00299 g015
Table 1. Elastic and plastic coefficients calculated from the true stress-strain curve.
E (GPa)νσ0.2 (MPa)Kn
450.3352.8480.40.074
Table 2. Values of ε ¯ pl , i , with i: max, min, and mean and Ci (Equation (1)) for the meshes shown in Figure 7.
MeshRefinementEquivalent Plastic StrainCi
MinMaxMean
2DCoarse0.3671.0680.7730.906
Intermediate0.3701.0500.7770.870
Fine0.3591.0420.7780.878
3D-0.3621.0310.7890.847
Publisher’s Note: MDPI stays neutral with regard to jurisdictional claims in published maps and institutional affiliations.

