Article

Passive Film Properties of Martensitic Steels in Alkaline Environment: Influence of the Prior Austenite Grain Size

1
Department of Materials Science and Engineering, Delft University of Technology, Mekelweg 2, 2628 CD Delft, The Netherlands
2
Materials Innovation Institute (M2i), Van der Burghweg 1, 2628 CS Delft, The Netherlands
3
Netherlands Organisation for Scientific Research, NWO, Van Vollenhovenlaan 659-661, 3527 JP Utrecht, The Netherlands
4
Research Group Electrochemical and Surface Engineering (SURF), Department of Materials and Chemistry, Vrije Universiteit Brussel, Pleinlaan 2, B-1050 Brussels, Belgium
*
Author to whom correspondence should be addressed.
Metals 2022, 12(2), 292; https://doi.org/10.3390/met12020292
Submission received: 22 December 2021 / Revised: 27 January 2022 / Accepted: 29 January 2022 / Published: 8 February 2022
(This article belongs to the Section Corrosion and Protection)

Abstract

:
The role of prior austenite grain size (PAGS) on the passive layer properties of martensitic steels is studied. Electron backscatter diffraction analysis shows that PAGS between 5 and 66 µm were obtained after applying different heat treatments. The barrier properties of passive film deteriorate with grain refinement up to 28 µm, attributed to increased donor density and a decrease in the fraction of γ-Fe2O3 in passive films. However, the further refinement of PAGS to 5 µm leads to improvement in the barrier properties due to the changes within the martensite structure. This improvement stems from the increase in γ-Fe2O3 fraction.

1. Introduction

High-strength steels are of significant interest to engineering and scientific societies because of their good mechanical properties [1]. Hence, they have found a wide range of applications varying from infrastructure, automotive to oil and gas industries. Engineering the microstructure of high strength steels to enhance their properties is therefore of enormous relevance. Grain refinement is of special significance since it generally improves the mechanical properties of the steel. Although quantitative relations are available for mechanical properties such as strength and hardness, this is not the case for the corrosion properties. This fact has been highlighted in the recent review by Ralston and Birbilis [2]. This review presents a holistic review of the current literature related to the relationship between grain size and corrosion resistance for a wide range of metals. In the case of steels, it is possible to find that the literature reported contradictory results on the relationship between grain size and both corrosion behaviour and passive layer properties.
The effect of grain refinement on the passive layer properties of ferritic stainless steels was investigated [3]. It was reported that the barrier properties of the passive layer worsen with grain refinement. This is attributed to the increase in both acceptor and donor density with grain refinement. In another research, the role of grain refinement on passive layer properties of austenitic stainless steels is studied in a borate buffer solution containing chloride [4]. An increase in the current density values in the passive region of potentiodynamic polarization and a decrease in breakdown potential was observed with grain refinement, also showing that the barrier properties of passive film deteriorate with grain refinement. However, it was also reported that the size of non-metallic inclusions changes, and dislocation density increases during hydrostatic extrusion, used for achieving different grain sizes. In our other research, the role of grain size on the passive layer of pure iron was investigated for grain sizes in the micron range [5]. It was observed that grain refinement leads to an increase in the passivity current density in the potentiodynamic polarization curves and lower resistance values in the electrochemical impedance spectroscopy (EIS) analysis. This deterioration in the barrier properties of the passive film stems from the increase in donor density and decrease in the fraction of protective γ-Fe2O3 in the passive film.
In contrast to these studies, the improvement in the barrier properties of the passive layer with grain refinement is also reported. The effect of grain refinement induced by cold rolling on the passivity behaviour of pure iron was studied in a borate buffer solution [6]. An improvement in the barrier properties of the passive film with grain refinement was observed, associated with the decrease in donor density in the passive film. However, the formation of texture was also reported besides grain refinement after the cold rolling used for manipulating the grain size.
These contradictory reports show that no straightforward relationship between grain size and passive layer properties has been established. These discrepancies arise because the processes applied for grain refinement may lead to other variations within the microstructure, such as dislocation density, crystallographic orientation, inclusions and segregation of alloying elements. These microstructural features might have a combined effect on passive layer properties, causing discrepancies in the results if no systematic approach is followed on the processing of the microstructure. This shows that a major challenge still lies in the great difficulty of isolating the effect of each microstructural feature on the corrosion properties of the steel.
This work investigates the effect of prior austenite grain size (PAGS) on the passive layer properties of fully martensitic steels. Several heat treatments were applied to obtain samples with different PAGS while minimising the changes in other microstructural features. Low alloyed carbon steel was employed to minimise the presence of secondary phases and possible alloy segregation. Electron backscatter diffraction (EBSD) analysis was conducted to provide a detailed analysis of the microstructural differences after heat treatments. X-ray photoelectron spectroscopy (XPS) was performed to determine the chemical composition and thickness of passive films. The barrier properties of passive films for the specimens with different PAGS were evaluated with potentiodynamic polarization (PDP) and electrochemical impedance spectroscopy (EIS). The electronic properties of passive films were determined with capacitance measurements (Mott-Schottky analysis). These experimental results form the basis for discussing the effect of the prior-austenite grain size on the properties of passive films formed on fully martensitic steels.

2. Experimental

2.1. Material

The as-received material was dual-phase steel sheets with a thickness of 1 mm (DP600 provided by Tata Steel, IJmuiden, The Netherlands). The chemical composition of the material is given in Table 1. Samples were laser cut to the dimensions of 10 mm × 5 mm. The chemical composition of the steel samples was determined with a JEOL JXA 8900R microprobe that applies an electron beam with energy of 10 keV and beam current of 100 nA using Wavelength Dispersive Spectrometry (WDS, Jeol, Tokyo, Japan). The composition at each analysis location of the sample was determined using the X-ray intensities of the constituent elements after background correction relative to the corresponding intensities of reference materials.

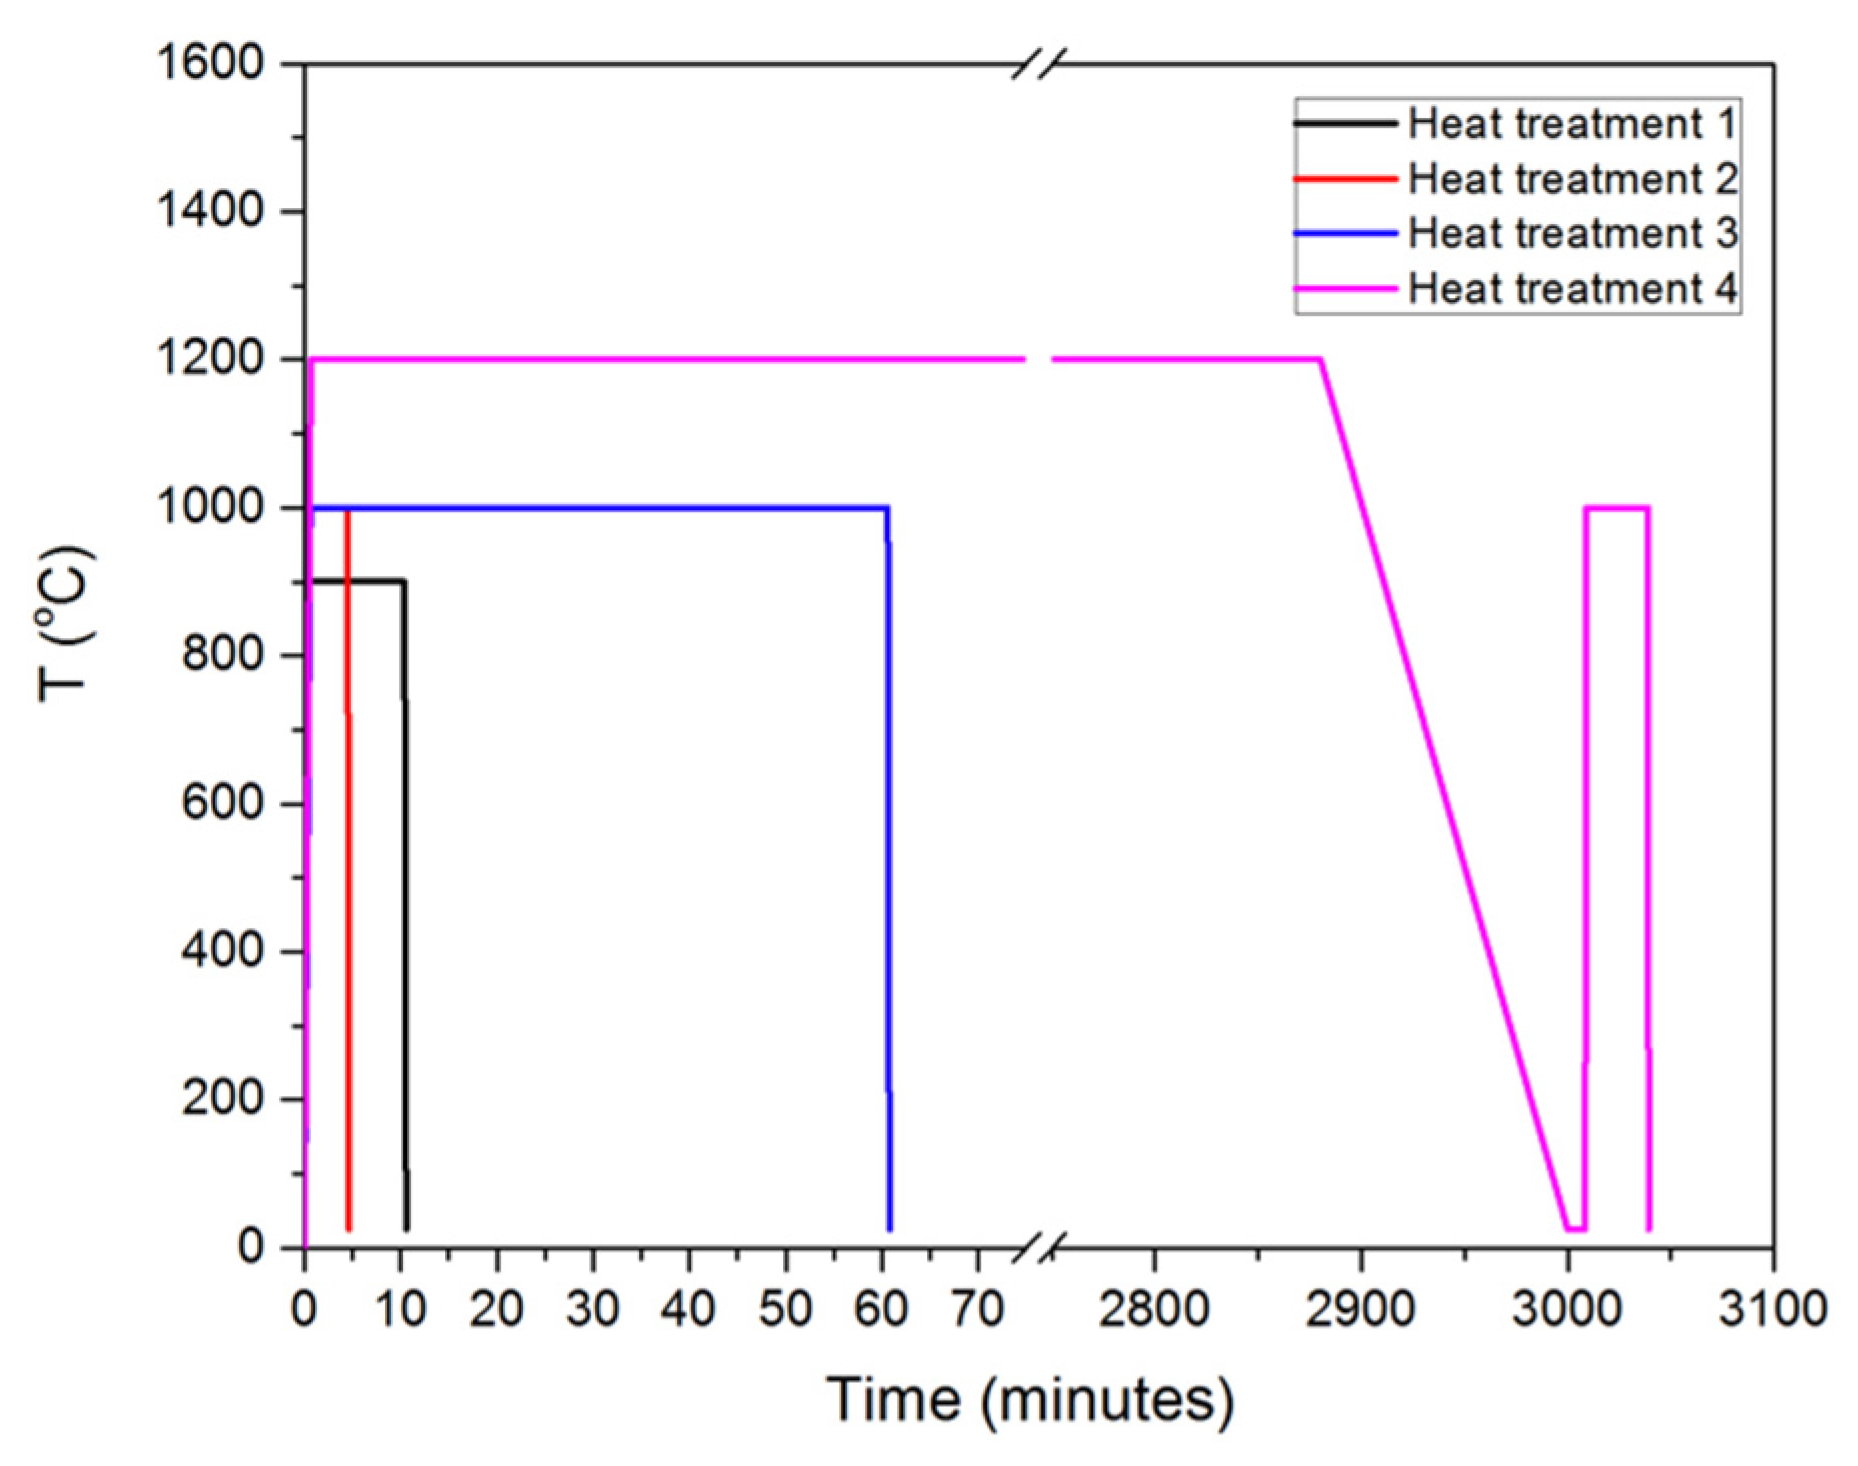
2.2. Design of the Microstructure

To obtain the desired martensitic microstructures with different prior austenite grain sizes, the as-received material was heat treated at different temperatures for specific times. The Thermo-Calc software (v2020a, Thermo-Calc, Solna, Sweden) was used to determine the single-austenite phase range to choose the appropriate annealing temperature and time. Four different heat treatment strategies (Figure 1) were followed to create martensitic steels with varying PAGS. The heat treatments were as follows:
-
Heat treatment 1 (HT-1)—Samples were heated to the austenitisation temperature of 900 °C, held for 10 min under vacuum and quenched to room temperature.
-
Heat treatment 2 (HT-2)—Higher austenitisation temperature of 1000 °C was chosen. Samples were held at austenitisation temperatures for 4 min. Subsequently, samples were quenched to room temperature.
-
Heat treatment 3 (HT-3)—Samples were heated to the austenitisation temperature of 1000 °C, held for 60 min under vacuum, then quenched to room temperature.
-
Heat Treatment 4 (HT-4)—Samples were heated to 1200 °C and held 48 h in a furnace and slowly cooled to room temperature. Subsequently, the samples were annealed at the austenitisation temperature of 1000 °C for 30 min under vacuum in the dilatometer, then quenched to room temperature.
The heat treatments were conducted under vacuum of 10−4 mbar in a dilatometer (Bähr DIL 805 A/D, TA Instruments, Detroit, DE, USA). Samples were heated with a heating rate of 10 °C/s and quenched with helium gas to room temperature with a cooling rate of 50 °C/s.

2.3. Characterization of the Microstructure

The optical micrographs were taken with a Keyence VHX-5000 digital optical microscope (Keyence, Mechelen, Belgium) after etching with the agent Nital 2%, rinsing with ethanol and drying with compressed clean air. Different illuminations were applied to optimize the image quality.
Electron backscatter diffraction (EBSD) imaging was applied to identify and measure the PAGSs and estimate the geometrically necessary dislocation (GND) density of the samples after the corresponding heat treatments. The samples were ground from 80 to 2000 grit SiC papers and subsequently polished with diamond particle slurry with particle diameters of 3 and 1 μm. Then, a standard colloidal silica suspension (Struers, Copenhagen, Denmark) with 0.04 μm particles was employed for the final polishing of the surface. A JEOL JSM-6500F field emission gun scanning electron microscope (FEG-SEM, Jeol, Tokyo, Japan) operating at an acceleration voltage of 20 kV was used for EBSD imaging. For EBSD mapping, a work distance of 10 mm was used. The step size was 50 nm. The geometrically necessary dislocation (GND) distribution was determined with the help of the electron backscattered diffraction (EBSD). TSL OIM v8 analysis software (EDAX, Pleasanton, CA, USA) was used for the EBSD data analysis. For GND density calculation, the function in OIM v7.3 software (EDAX, Pleasanton, CA, USA) described in [7] was employed. To identify the PAGS, clean-up was done by applying neighbour orientation correlation as well as grain dilatation tools provided with the OIM v7.3 software, as described in [8]. Then, the linear intercept method was used to measure the size of the prior austenite grains.

2.4. Electrochemical Measurements

The samples were embedded in Struers ClaroCit resin and cured for 1 h under 2 bar pressure. Subsequently, the samples were ground from 80 to 2000 grit SiC paper, then polished with diamond particle slurry with particle diameters of 3 and 1 μm, respectively until obtaining a mirror-like polished surface. The samples were cleaned ultrasonically in an ultrasonic bath of ethanol for 10 min before the electrochemical measurements. The resin/metal interface was covered with a thin layer of sealing lacquer (Electolube Bloc Lube Red) to avoid crevice corrosion.
All electrochemical measurements were conducted in aerated 0.1 M NaOH solution with a pH of 12.75 prepared with Milli-Q® ultra pure water. Measurements were carried out at room temperature. A conventional three-electrode electrochemical cell setup, consisting of the sample as the working electrode, graphite rod as the counter electrode and Ag/AgCl (sat. KCl) as the reference electrode, was employed. The polarization and electrochemical impedance spectroscopy experiments were carried out using a Solartron 1257 potentiostat combined with SI 1255 HF frequency response analyser (FRA, Solartron, Houston, TX, USA). Pre-passivation of the samples and subsequent capacitance measurements (Mott-Schottky analysis) were carried out with a SP300 potentiostat (Biologic, Seyssinet-Pariset, France). Open Circuit Potential (OCP) was measured for 30 min before all electrochemical measurements.
Potentiodynamic polarization measurements were carried out within the potential range of −0.25 V to 1.25 V (vs. OCP) with a scan rate of 0.167 mV/s. Before and capacitance experiments, samples were passivated by potentiostatic polarization for 6 h. Two passivation potentials were studied, 0.2 and 0.4 V. EIS data were acquired in the frequency range from 30 kHz to 10 mHz with an amplitude of 10 mV peak to peak for the AC signal. Capacitance measurements (Mott-Schottky analysis) were conducted at a frequency of 1 kHz with an amplitude of 10 mV peak to peak for the AC signal and 50 mV potential step size. The potential sweep was conducted from 0.6 V to −1 V.
For the data analysis, CorrView software (Solartron, Houston, TX, USA) was used for potentiodynamic and potentiostatic polarization measurements and Zview for EIS and ECLab for capacitance measurements.

2.5. Passive Layer Analysis

X-ray photoelectron spectroscopy (XPS) studies were performed to analyse the chemical composition of passive films. The samples were passivated with potentiostatic polarization at both 0.2 V and 0.4 V for 6 h. Before XPS measurements, pre-passivated samples were rinsed with ethanol and dried with compressed clean air. XPS spectra were recorded using a PHI5600 photoelectron spectrometer (Physical Electronics, Chanhassen, MN, USA) with an Al K monochromatic X-ray source (1486.71 eV photon energy). The low pressure in the analysis chamber was at a maximum of 5 × 10⁻⁹ Torr during measurements. A take-off angle of 45° was chosen for the measurements. A variation of the angle to 90° allowed to elucidate the build-up of the oxides on the surface. A spot diameter of 0.8 mm was used for the high-resolution scans of the Fe 2p and O 1s core electron peaks. An energy of 0.1 eV and pass energy of 23.5 eV were applied. PHI Multipak software (V9.5, Physical Electronics, Chanhassen, MN, USA) was used for XPS data analysis. The XPS data were fitted with CasaXPS software (v2.3.22, Casa Software Ltd., Teignmouth, UK).

3. Results and Discussion

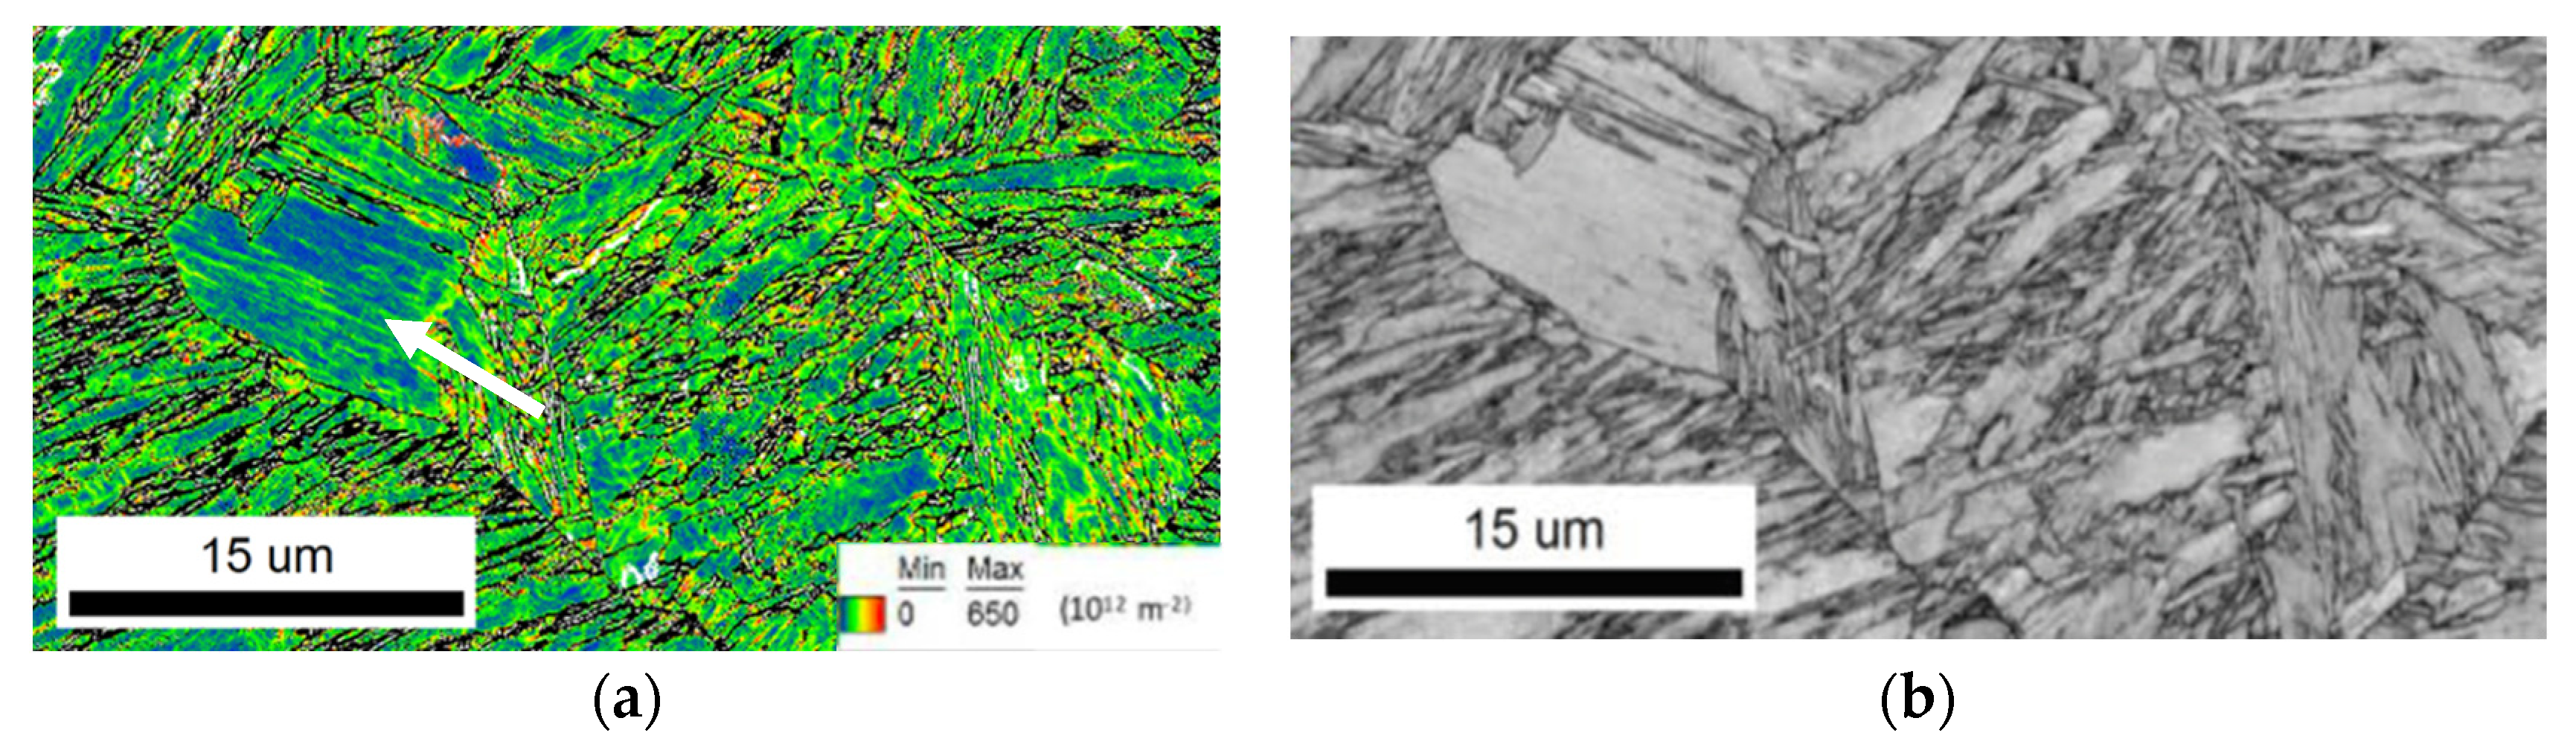
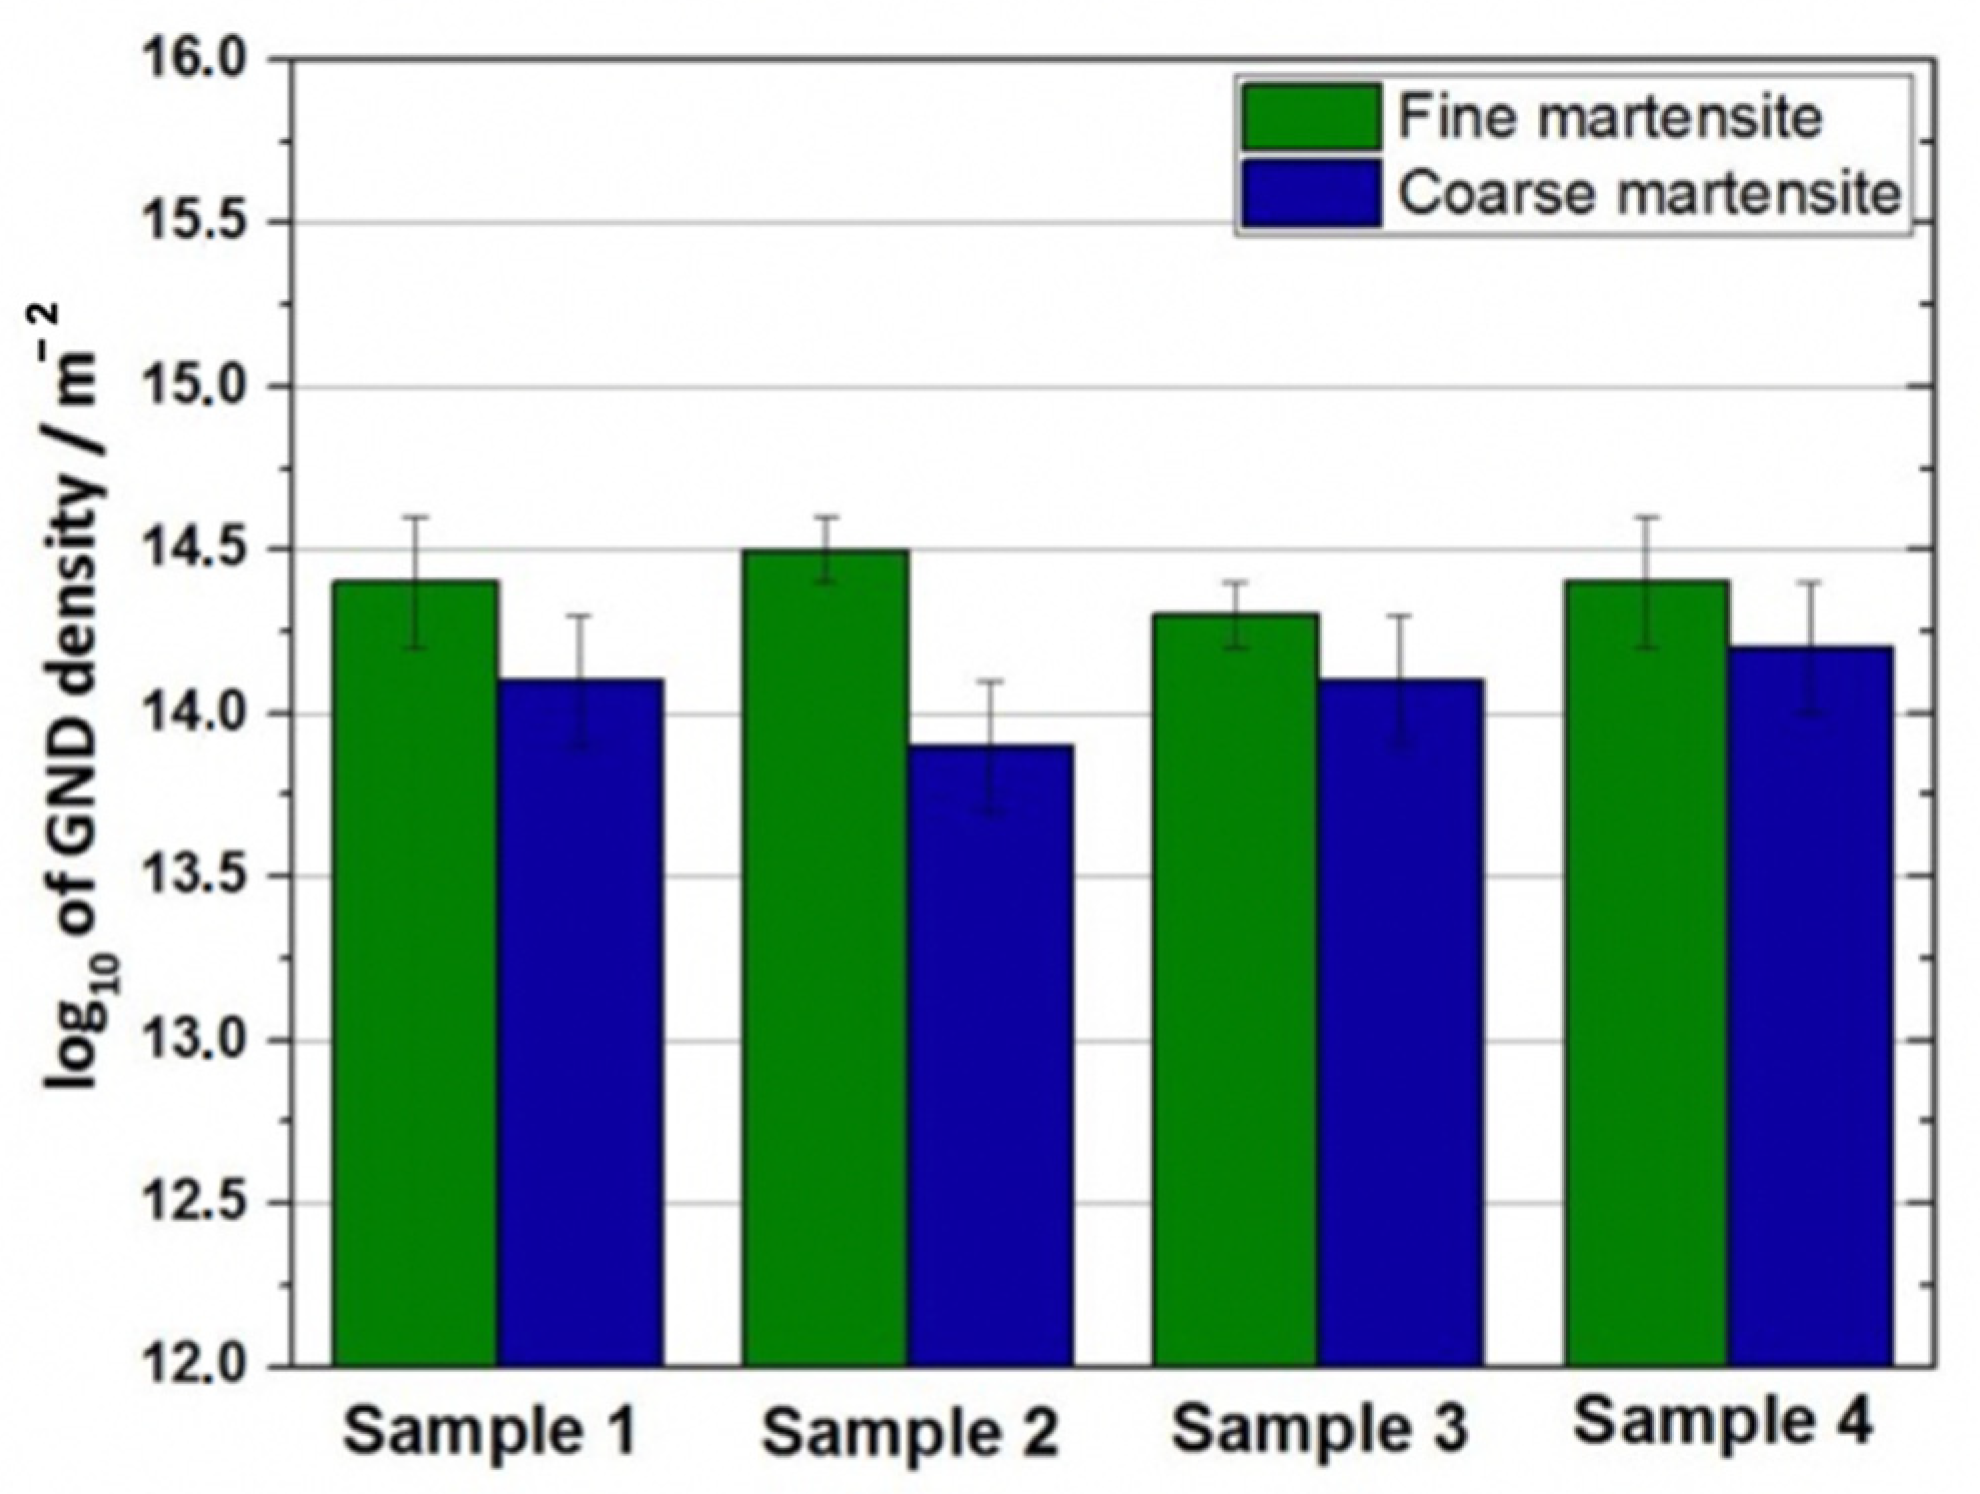
3.1. Microstructure Characterization of the Martensitic Steels

Low alloyed steel was chosen to minimise the formation of secondary phases and alloy segregation that may influence the passive layer properties. In Figure 2, optical micrographs of the resulting microstructures after the different heat treatments are given. Micrographs show the fully martensitic steel structure composed of very complex sub-grain structures in all samples. High-resolution electron backscatter diffraction (EBSD) measurements were conducted to determine the average PAGS. The results from the EBSD analysis are summarised in Table 2. The heat treatment with the lowest austenitisation temperature (HT-1) shows the finest average grain size, 5 ± 2 µm. The application of higher austenitisation temperatures results in larger average PAGS, 28 ± 3 µm and 38 ± 4 µm for HT-2 and HT-3, respectively. To obtain even larger grains, pre-annealing in a furnace at 1200 °C was conducted in HT-4. In this case, samples present an average grain size of 66 ± 6 µm. The prior-austenite grain size increases with increasing austenitisation temperature, which agrees with previous studies of fully martensitic steels [9].
Additionally, from the EBSD measurements, the geometrically necessary dislocation (GND) density was obtained through the local orientation distribution analysis. Figure 3a,b shows the selected GND density and image quality map of sample 2 (PAGS 28 µm), respectively. Local differences in the distribution of the GND in fine (block width smaller than 5 µm) and coarse martensite (block width larger than 5 µm) are observed. The coarse martensite (shown with arrows in Figure 3) shows lower dislocation density values in comparison with fine martensite. The average GND values are given in Figure 4. The GND densities for fine and coarse martensite are in the same order for all samples, with a variation between 1014 and 2 × 10¹⁴ m−2, showing that the average GND density is not significantly affected by the grain size.
Concerning dislocation density, only the structural dislocations (GNDs) are considered. Statistically stored dislocation (SSD) density can also contribute to the total dislocation density in the material, but their density cannot be derived from the present observations. Figure 3b shows the morphology of the martensite structure as well as prior austenite grains.

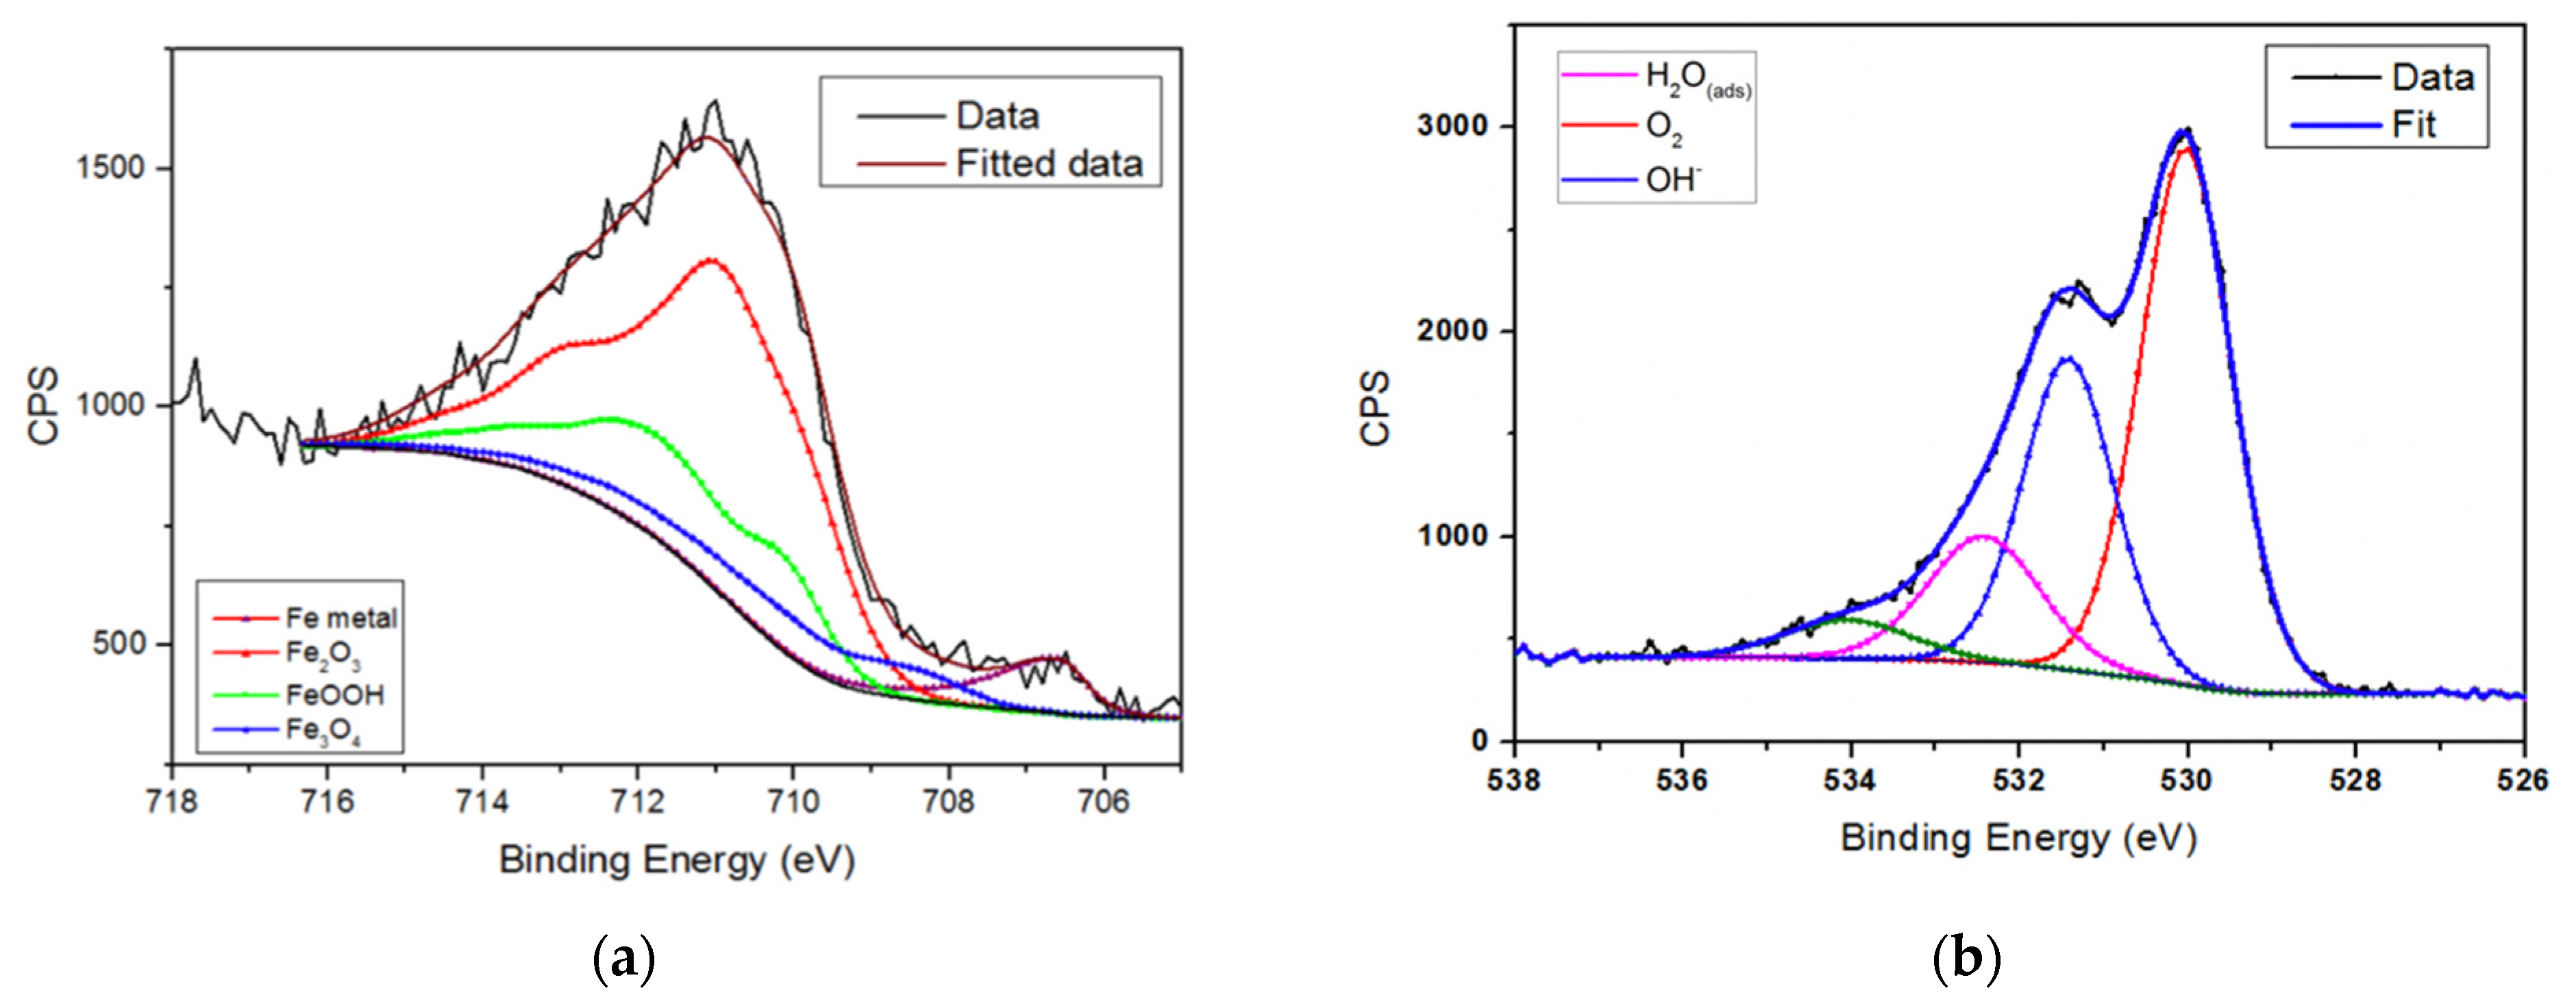
3.2. Passive Layer Analysis

The chemical composition of passive layers was investigated using X-ray Photoelectron Spectroscopy (XPS). Figure 5a shows the selected high-resolution Fe 2p3/2 spectrum of sample 4 (66 μm PAGS) after pre-passivation at a potential of 0.4 V. To identify the composition of the passive layer, the Fe 2p spectra were fitted by using the multiplet-splitting fitting [10,11,12]. Multiplet splitting occurs for Fe since high-spin Fe(II) and Fe(III) species contain unpaired d-electrons, which leads to coupling between a photoionized core electron vacancy and an unpaired outer d orbital electron [10]. This leads to several energy states with close binding energies. The fitting of the close binding energies provides accurate quantification of (hydr)oxides. Mutliplet-splitting fitting was applied with the reported fitting parameters [12]. The fitting corresponds to fractions of Fe3O4, γ-Fe2O3 and FeOOH, in agreement with the research that indicates the same passive layer build-up in low-alloyed carbon steels [12,13,14,15]. In Figure 5b, the high-resolution O 1s spectrum of sample 4 is presented. From the fitting, the presence of hydroxide lattice, OH, and oxides lattice, O−2, peaks. Furthermore, a low contribution of adsorbed water (H2O adsorption peak) is observed. The ratio between the contributions of lattice O−2 (iron oxides) and lattice OH varies, depending on the PAGS of samples and passivation potential (not shown here).
Figure 6a,b present the fractions of Fe3O4, γ-Fe2O3 and FeOOH in the passive film for all samples after passivation at 0.2 V and 0.4 V, respectively. First, it is possible to observe the differences between oxides and hydroxide ratios between both potentials. The volume fractions of γ-Fe2O3 oxide are higher for the case of 0.4 V, with values between 45 and 62%, they are in the range of 40–50% for 0.2 V. For the case of Fe3O4 oxides, there are small variations between potentials, with Fe3O4 content in the range of 5–12%. In the case of FeOOH, at 0.2 V, passive layers show a content between 30 and 43%. However, for the more positive potential, the content of hydroxide is on average lower. The magnitude of the variation depends on the PAGS, fluctuating from 20 to 45%. At 0.2 V passivation potential, a decrease in γ-Fe2O3 percentage from 53 to 39% is observed with the refinement of PAG of 66 to 28 µm. However, further refinement of grain refinement leads to an increase in γ-Fe2O3 percentage, reaching a value of 49% for the sample with 5 µm PAGS. A similar trend is observed for the samples passivated at 0.4 V. A gradual decrease in γ-Fe2O3 from 63 to 46% was observed with PAGS refinement from 66 to 28 µm, while further refinement in PAGS to 5 µm leads to an increase in γ-Fe2O3 percentage to 61%. A higher contribution of oxide than hydroxide species at the more positive potential 0.4 V is observed for all samples, which agrees with previously reported results by Li et al. [16].
The thickness of the oxide layers was estimated from the analysis of the Fe 2p spectra data by applying the equation proposed by Herzing et al. [17]:
d = λ o x c o s θ ln ( N F e λ F e N o x λ o x   I o x I F e + 1 )
where d is oxide thickness, I F e is the photoelectron intensity of metallic iron (209.7), I o x is the intensity of γ-Fe2O3 (3654.1), N is the number of atoms per unit volume, λ F e is the inelastic mean free path in metallic iron (1.1 nm) [18], λ o x is the inelastic mean free path in γ-Fe2O3 (1.1 nm), and θ   is the detection angle (45°). In this equation, it is assumed that the passive layer is composed of only γ-Fe2O3. In Table 3, the calculated thickness for all samples is presented. For both potentials, the variation of thickness for the different PAGS is limited to ±0.1 nm. For the 0.2 V potential, the passive layers formed have an average thickness of 3.02 nm. In the case of 0.4 V, passive layers are slightly thicker, with an average thickness of 3.27 nm.

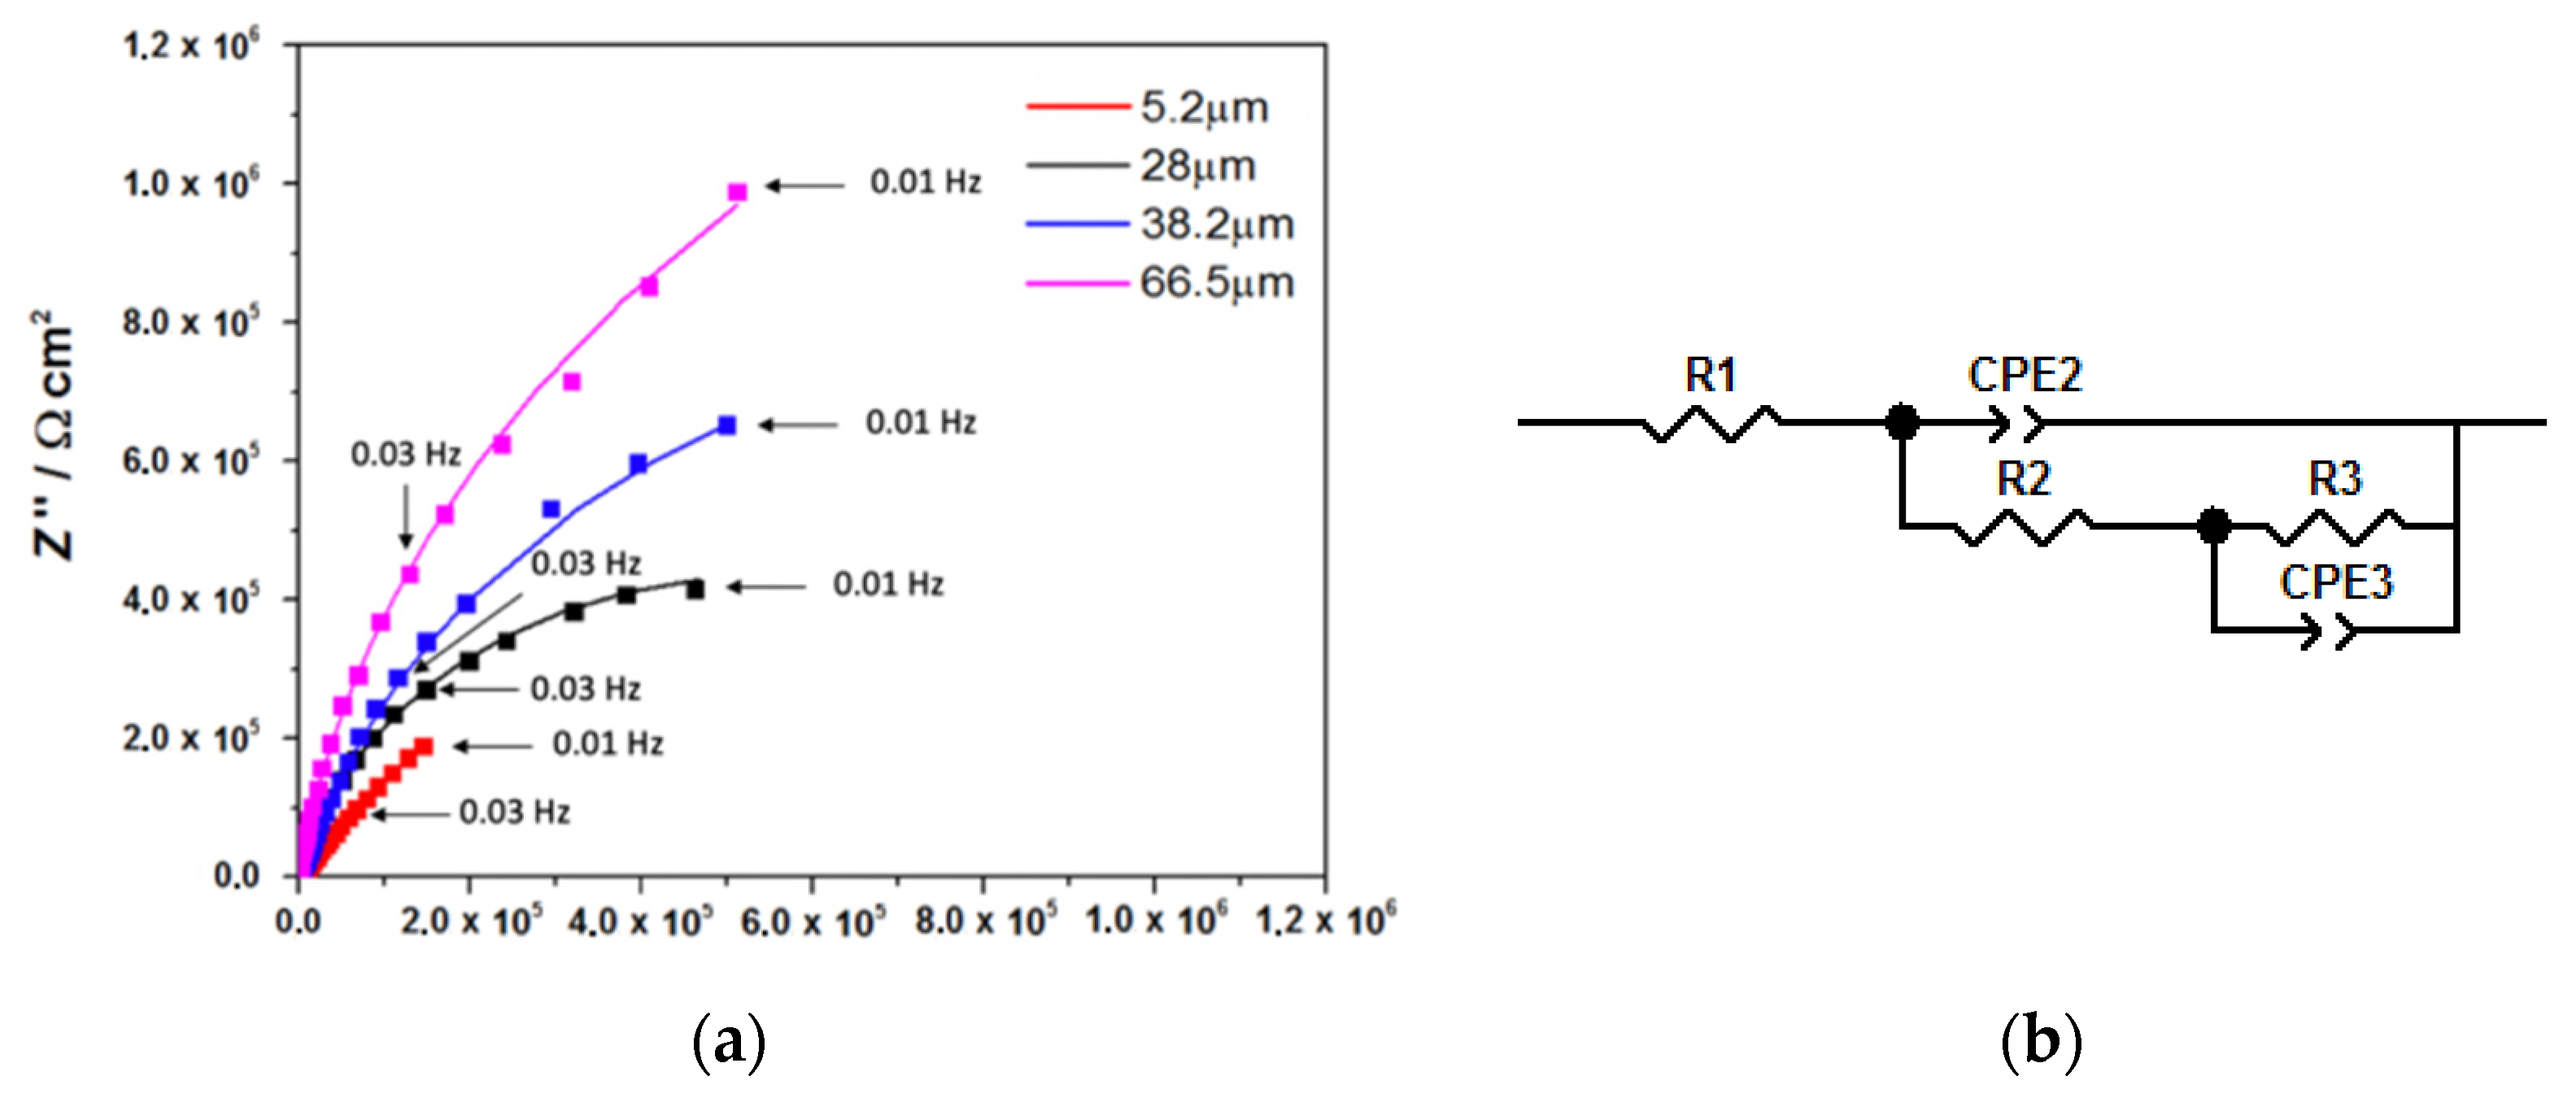
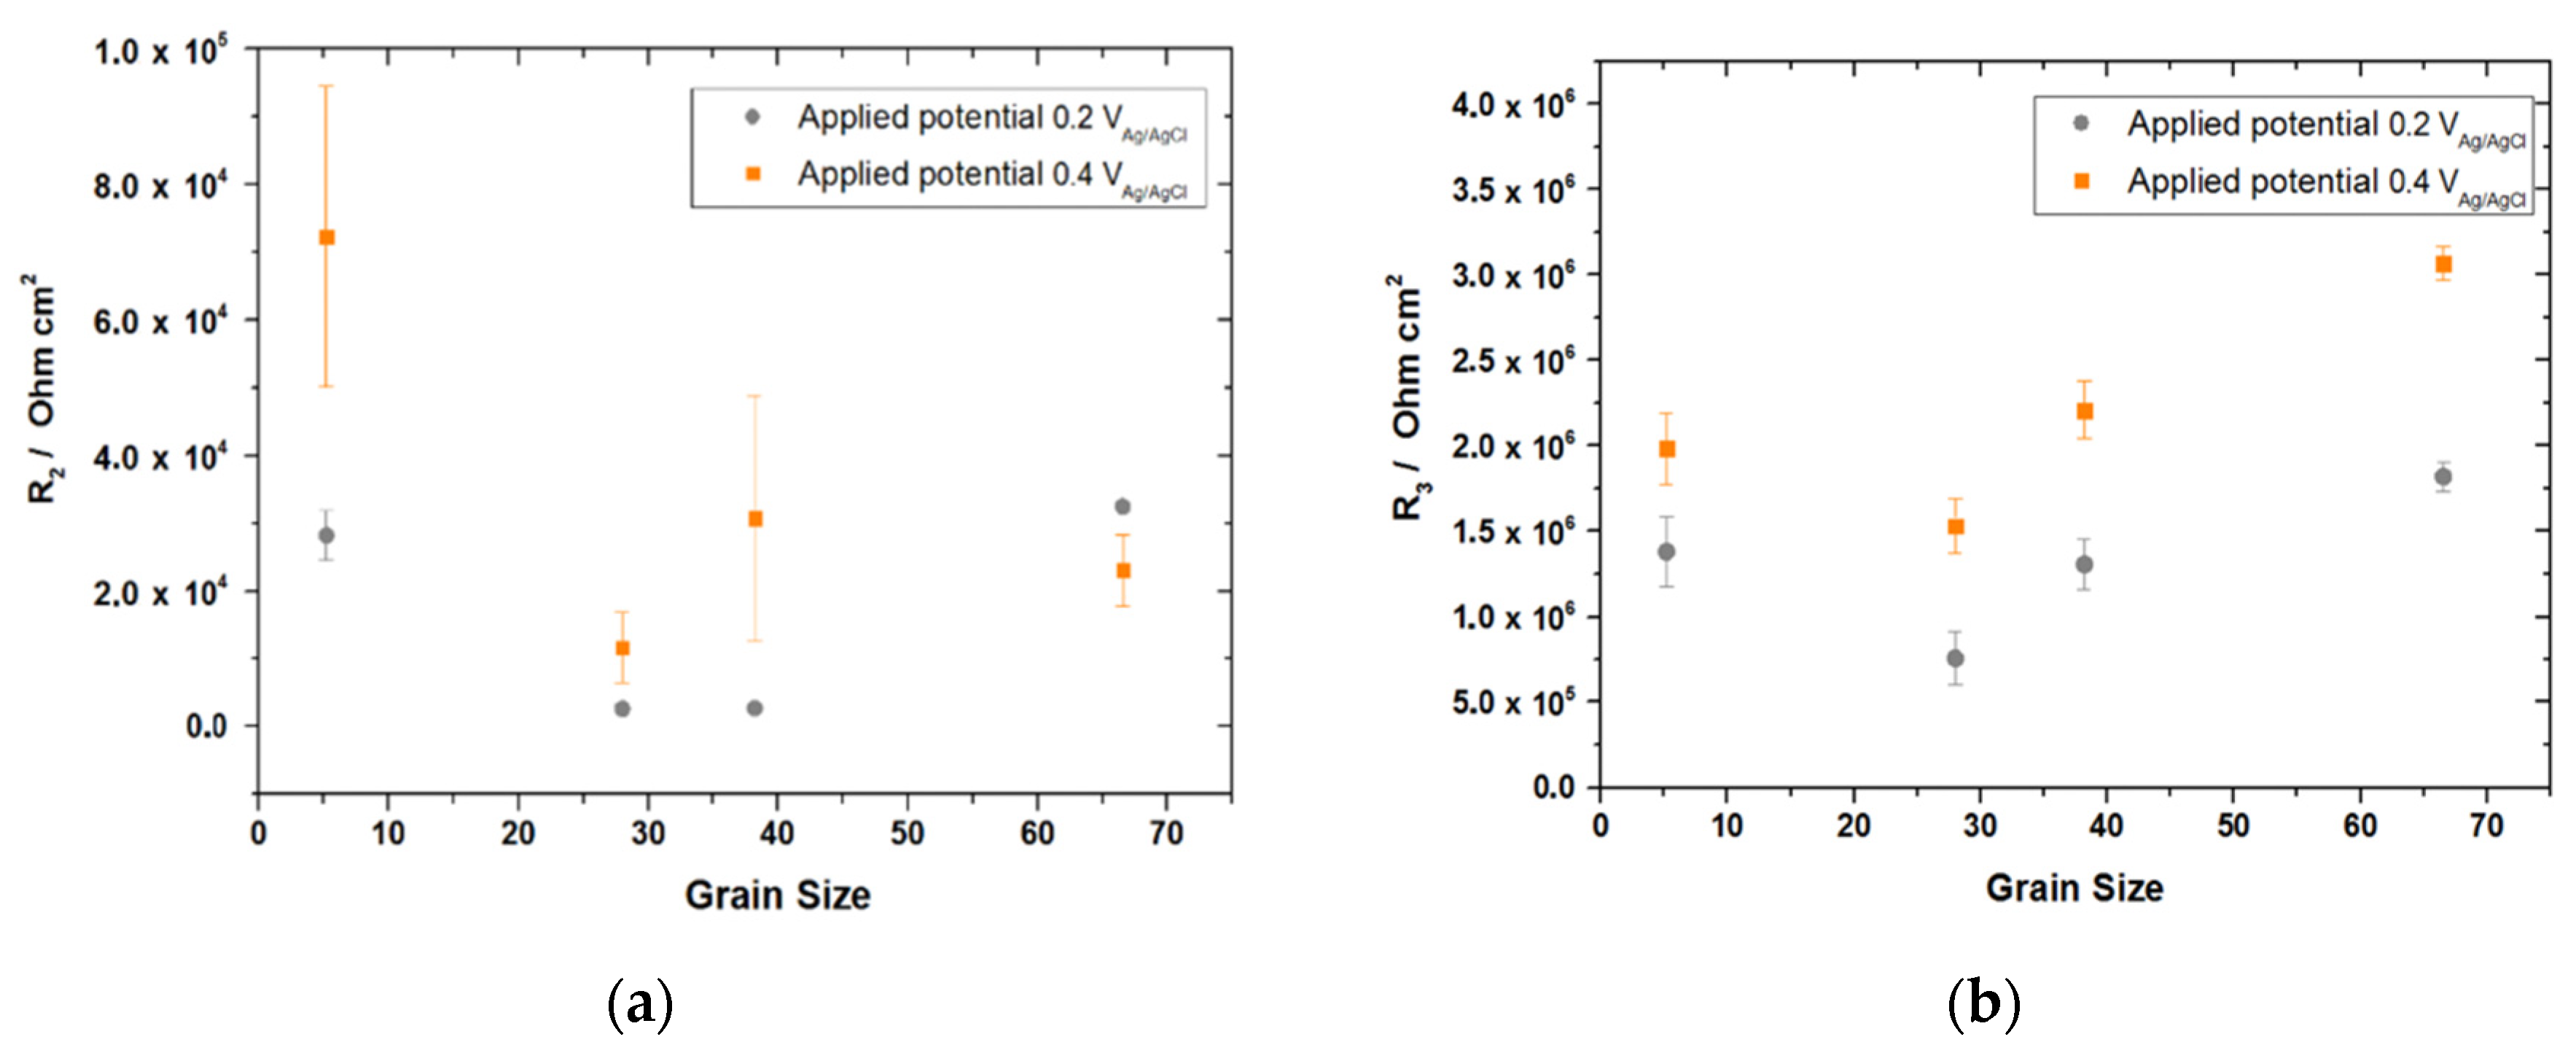
3.3. Electrochemical Investigation

Potentiodynamic Polarization—Figure 7a shows the potentiodynamic polarization curves of all samples with different PAGS during immersion in 0.1 M NaOH solution. The cathodic branch is attributed to the reduction in oxygen dissolved in the solution. After reaching the corrosion potential, the anodic current increases until reaching a plateau corresponding to the passivity region. Figure 7b shows the passivity current densities measured from the polarization curves at two selected potentials, 0.2 and 0.4 V. At both potentials, the current density values increase by a factor of 4 with PAGS refinement from 66 to 28 µm. However, further refinement in grain size to 5 µm causes a decrease in current density by a factor 2. The significant difference in the passivity current density values shows that the electrochemical properties of passive layers are affected by the prior austenite grain size. Interestingly, the current differences do not follow a monotonous dependency with the refinement of the grains. Moreover, it is observed that the current density values for all samples are higher for passive layers formed at 0.4 V in comparison to layers formed at 0.2 V. This indicates that the passive layers formed at more positive potentials are less conductive than the ones formed at lower potentials, in line with previous research [3,19,20].
EIS measurements—EIS data were acquired from the passivated samples at 0.2 and 0.4 V in 0.1 M NaOH solution. Figure 8a shows the Nyquist plots of the pre-passivated samples at 0.4 V. The impedance values are highest for the sample with 66 µm grain size. With PAGS refinement to 28 µm, the impedance values decrease, while further refinement to 5 µm causes an increase in the impedance. This behaviour is observed for both pre-passivation potentials.
A quantitative analysis of the equivalent electrical circuit fitting was carried out for EIS data. An equivalent circuit with two R-CPE (resistance—Constant Phase Element) elements in parallel (Figure 8b) provides the best fitting for EIS data. CPEs are employed instead of a capacitance element C since no fully capacitive behaviour is observed as indicated by CPE coefficients lower than 1. R1 is associated with the resistance of the solution. R2 and CPE2 are associated with the resistive and capacitive behaviour of the double layer, respectively. The resistive and capacitive behaviour of the passive layer is represented by R3 and CPE3, respectively. This equivalent circuit has been proposed in previous research to describe the passive layer of similar systems [13,21,22,23,24]. The fitting results are summarised in Figure 9a,b.
Figure 9a,b show the charge transfer resistance values of the double layer (R2) and passive layer (R3), respectively, for both pre-passivation potentials, 0.2 and 0.4 V. R2 is two orders of magnitude lower than R3, indicating that the protective capacity of the double layer is much lower than that of the passive layers. Figure 9b shows that the resistance of the passive layer (R3) decreases by a factor 2 at both potentials upon PAGS refinement from 66 to 28 μm. However, the resistance values of oxide layers (R3) increase with further refinement to 5 μm. These results agree with the trends in passivity currents observed in the potentiodynamic experiments. Furthermore, the resistance values of the oxide layers (R3) are higher in all samples at pre-passivation potential 0.4 V in comparison with 0.2 V, which agrees with the trend observed in the passivity current densities from the polarization results.
Capacitance measurements—Mott-Schottky analysis was applied to evaluate the semi-conductive behaviour of the passive layers. This analysis allows us to assess the electronic properties of the oxides and correlate them with the electrochemical properties as a function of the prior austenite grain size. The Mott–Schottky relationship (Equation (2)) can be applied to calculate the donor density. In this equation, ε is the dielectric constant of the passive film reported for carbon steels [25], ε0 the permittivity of free space, q the electron charge, Nd the donor density, EFB the flat band potential, k the Boltzmann constant and T the absolute temperature.
1 C 2 = 2 E E F B k T / q / ε ε o q   N d  
Figure 10a shows the variations in the Mott–Schottky plot (C−2 vs. potential) of the pre-passivated samples at 0.4 V. For n-type semiconductor behaviour, C−2 vs. V in the Mott–Schottky plot has a positive slope that is inversely proportional to the donor density of the passive layer. Hence, the passive layer formed on all samples shows n-type semiconductor behaviour. However, non-linear behaviour (two positive slopes with a transition at −0.1 V) is observed in Mott–Schottky plots. This non-linear behaviour is attributed to donors’ inhomogeneous distribution within the passive layer [25]. It is proposed that the band gap contains a deep donor level stemming from changes in chemical states within the passive layer, leading to structural changes in the passive layer [26,27]. The deep donor level occurs in the band gap and the potential at which sharp changes in the slope of the Mott-Schottky plot are observed, corresponds to the ionisation of the deep donor level in the band gap. It is suggested to calculate the donor density levels from the two slopes with the Equations (3) and (4) [25]:
S 1 = 2 ε ε 0 e N 1   for   E < E c
S 2 = 2 ε ε 0 e ( N 1 + N 2 )   for   E > E c
where Ec is the potential at which the slope change occurs and is considered as the critical potential for the ionization of the deep donor in the space charge layer, S1 is the first slope, N1 is the donor density level that has an energy level close to the conduction band, S2 is the second slope and N2 is the deep donor density level that occurs deeper in the band gap.
Figure 10b shows the donor density values (N1 and N2) obtained for samples passivated at both 0.2 and 0.4 V. The donor density values (Figure 10b), on the order of 1021 cm−3, are comparable with the previous results on passive layer properties of martensitic steels in an alkaline environment [20] and shows that the passive layer is highly defective. The donor density level N1 is higher than N2 for all samples and this agrees with the previously reported results [25]. Furthermore, it is observed that both donor density values are lower for samples passivated at more positive potentials. The results in Figure 10b show that both donor density values depend on PAGS and show an increasing trend with decreasing PAGS.
The electrochemical measurement results discussed above show that the characteristics of passive films formed on martensitic steels are dependent on prior austenite grain size and the protective capacity decreases with PAG refinement down to PAGS of 28 µm. One of the factors of the deterioration in barrier properties of the passive layer is the increase in donor density with PAG refinement. The decreased PAGS causes an increased grain boundary density, leading to higher donor density in passive layers. This is in line with the previous studies, which reported the donor density to increase with increasing grain boundary density [5]. This probably stems from the crystal lattice mismatch at grain boundaries, leading to more intensive donor formation of passive film formed at these sites. The donor population in the passive layer affects both ionic and electronic resistivity of the passive layer. A higher density of donors in a passive layer leads to a narrower band gap in metal oxides [28,29]. Therefore, the electron transfer in the passive layer becomes easier with the increase in donor density, implying a lower electronic resistivity in the passive layer. In terms of ionic resistivity of passive layers, the ionic charges in iron oxide are carried by the donors in iron oxide films [30,31,32]. Hence, an increase in donor density facilitates the charge transfer, lowering the ionic resistivity of the passive film. Considering the decrease in electronic and ionic resistivity of the passive film, the increase in donor density with PAG refinement leads to higher conductivity.
Another factor in the deterioration in barrier properties of passive film is the changes in the fraction of γ-Fe2O3 in the passive film with PAG refinement. The most effective barrier properties of the passive film are provided by γ-Fe2O3 since Fe3O4 has an almost metallic conductivity due to a very small band gap of 0.1 eV [33], whereas the large band gap of γ-Fe2O3 (2.3 eV) [34] provides lower conductivity. Furthermore, FeO(OH) has a less dense and porous structure, leading to high conductivity. Therefore, the decrease in γ-Fe2O3 in the passive film and the increase in donor density lead to the deterioration in the barrier properties of the passive film with PAG refinement down to 28 µm.
Nevertheless, the further refinement in PAGS to values lower than 28 μm leads to improvement in electrochemical properties of the passive layer, although the donor density continues to increase with PAG refinement. The increase in donor density can again be attributed to the formation of more defective passive film at grain boundaries due to the further increase in crystal mismatch and higher misorientation angle between grains. However, PAGS refinement has other consequences within the complex martensite structure. The refinement in PAGS leads to not only the reduction in packet and block sizes [8] but also changes the lath width-to-length ratio. It was reported that the refinement of PAGS to lower than a grain size of 14 µm in low carbon steels leads to dramatic changes within the martensite in terms of reducing packet and block sizes [8] and martensite lath width-to-length ratio [9]. These changes within the martensite structure dominate the effect of PAG refinement on the properties of the passive layer due to a significant increase in lath stored energy. This increase in lath stored energy probably affects the surface reactivity, leading to a more resistive passive layer due to an increase in the fraction of protective γ-Fe2O3 layer.

4. Conclusions

This study investigates the effect of prior austenite grain size on the passive layer properties formed on martensitic steels in 0.1 M NaOH solution. PAGs refinement from 66 to 28 µm leads to increased current density in polarization measurements and decreased in charge transfer resistance in EIS measurements. This deterioration in the passive layer properties stems from increased donor density and a decrease in γ-Fe2O3 fraction. In this PAGs range, grain refinement is the dominant factor, controlling the passive layer properties. On the other hand, further refinement in PAGs to 5 µm leads to decreased current density values in polarization measurements and increased charge transfer resistance values in EIS measurements. This improvement in electrochemical properties of the passive films is due to an increase in γ-Fe2O3 fraction. With this PAG refinement to 5 µm, alterations within the complex martensite structure occur and have a dominant effect, governing the enhancement in passive layer properties.

Author Contributions

Conceptualization, A.Y., X.L., J.S., Y.G.-G.; methodology, A.Y., X.L., J.S., Y.G.-G.; formal analysis, A.Y., S.P., X.L.; investigation, A.Y., S.P., X.L.; resources, T.H., J.S. and Y.G.-G.; writing—original draft preparation, A.Y.; writing—review and editing, A.Y., X.L., S.P., T.H., J.S. and Y.G.-G.; supervision, T.H., J.S., Y.G.-G. project administration, J.S., Y.G.-G.; funding acquisition, J.S., Y.G.-G. All authors have read and agreed to the published version of the manuscript.

Funding

This research was funded by Netherlands Organisation for scientific research (NWO) under grant number F41.3.14546a in the framework of the Partnership Program of the Materials innovation institute (M2i).

Institutional Review Board Statement

Not applicable.

Informed Consent Statement

Not applicable.

Data Availability Statement

The data presented in this study are available on request from the corresponding author.

Acknowledgments

The authors acknowledge funding under project number F41.3.14546a (MICROCORR) in the framework of the Partnership Program of the Materials Innovation Institute M2i (www.m2i.nl (accessed on 1 January 2022)) and the Foundation of Fundamental Research on Matter (FOM), which is now part of the Netherlands Organisation for Scientific Research (www.nwo.nl (accessed on 1 January 2022)).

Conflicts of Interest

The authors declare no conflict of interest.

References

  1. Tasan, C.; Diehl, M.; Yan, D.; Bechtold, M.; Roters, F.; Schemmann, L.; Zheng, C.; Peranio, N.; Ponge, D.; Koyama, M.; et al. An Overview of Dual-Phase Steels: Advances in Microstructure-Oriented Processing and Micromechanically Guided Design. Annu. Rev. Mater. Res. 2015, 45, 391–431. [Google Scholar] [CrossRef]
  2. Ralston, K.D.; Birbilis, N. Effect of grain size on corrosion: A review. Corrosion 2010, 66, 0750051–07500513. [Google Scholar] [CrossRef]
  3. Fattah-Alhosseini, A.; Vafaeian, S. Influence of grain refinement on the electrochemical behavior of AISI 430 ferritic stainless steel in an alkaline solution. Appl. Surf. Sci. 2016, 360, 921–928. [Google Scholar] [CrossRef]
  4. Pisarek, M.; Kedzierzawski, P.; Janik-Czachor, M.; Kurzydłowski, K.J. Effect of hydrostatic extrusion on passivity breakdown on 303 austenitic stainless steel in chloride solution. J. Solid State Electrochem. 2009, 13, 283–291. [Google Scholar] [CrossRef]
  5. Yilmaz, A.; Traka, K.; Pletincx, S.; Hauffman, T.; Sietsma, J.; Gonzalez-Garcia, Y. Effect of microstructural defects on passive layer properties of interstitial free (IF) ferritic steels in alkaline environment. Corros. Sci. 2021, 182, 109271. [Google Scholar] [CrossRef]
  6. Lv, J.; Luo, H. The effects of cold rolling temperature on corrosion resistance of pure iron. Appl. Surf. Sci. 2014, 317, 125–130. [Google Scholar]
  7. Adams, B.L.; Kacher, J. EBSD-based microscopy: Resolution of dislocation density. Comput. Mater. Contin. 2009, 14, 183–194. [Google Scholar]
  8. Hidalgo, J.; Santofimia, M.J. Effect of Prior Austenite Grain Size Refinement by Thermal Cycling on the Microstructural Features of As-Quenched Lath Martensite. Metall. Mater. Trans. A Phys. Metall. Mater. Sci. 2016, 47, 5288–5301. [Google Scholar] [CrossRef] [Green Version]
  9. Celada-Casero, C.; Sietsma, J.; Santofimia, M.J. The role of the austenite grain size in the martensitic transformation in low carbon steels. Mater. Des. 2019, 167, 107625. [Google Scholar] [CrossRef]
  10. Gupta, R.P.; Sen, S.K. Calculation of multiplet structure of core p-vacancy levels. Phys. Rev. B 1974, 10, 71–77. [Google Scholar] [CrossRef]
  11. Moulder, J.F.; Stickle, W.F.; Sobol, P.E. Handbook of X-ray Photoelectron Spectroscopy; Perkin-Elmer Corp.: Eden Prairie, MN, USA, 1992. [Google Scholar]
  12. Biesinger, M.C.; Payne, B.P.; Grosvenor, A.P.; Lau, L.W.; Gerson, A.R.; Smart, R.S.C. Resolving surface chemical states in XPS analysis of first row transition metals, oxides and hydroxides: Cr, Mn, Fe, Co and Ni. Appl. Surf. Sci. 2011, 257, 2717–2730. [Google Scholar] [CrossRef]
  13. Freire, L.X.R.N.; Nóvoa, X.R.; Montemor, M.F.; Carmezim, M.J. Study of passive films formed on mild steel in alkaline media by the application of anodic potentials. Mater. Chem. Phys. 2009, 114, 962–972. [Google Scholar] [CrossRef]
  14. Strehblow, H.; Marcus, P. X-ray photoelectron spectroscopy in corrosion research. In Analytical Methods in Corrosion Science and Engineering; Marcus, P., Mansfeld, F., Eds.; CRC Press Taylor Fr.: Boca Raton, FL, USA, 2006. [Google Scholar]
  15. Xu, W.; Daub, K.; Zhang, X.; Noel, J.; Shoesmith, D.; Wren, J. Oxide formation and conversion on carbon steel in mildly basic solutions. Electrochim. Acta 2009, 54, 5727–5738. [Google Scholar] [CrossRef]
  16. Li, Y.; Cheng, Y.F. Passive film growth on carbon steel and its nanoscale features at various passivating potentials. Appl. Surf. Sci. 2017, 396, 144–153. [Google Scholar] [CrossRef]
  17. Martin, J.E.; Herzing, A.A.; Yan, W.; Li, X.-Q.; Koel, B.; Kiely, C.; Zhang, W.-X. Determination of the oxide layer thickness in core-shell zerovalent iron nanoparticles. Langmui 2008, 24, 4329–4334. [Google Scholar] [CrossRef]
  18. Cumpson, P.J.; Seah, M.P. Elastic Scattering Corrections in AES and XPS. II. Estimating Attenuation Lengths and Conditions Required for their Valid Use in Overlayer/Substrate Experiments. Surf. Interface Anal. 1997, 25, 430–446. [Google Scholar] [CrossRef]
  19. Kim, J.J.; Young, Y.M. Study on the passive film of type 316 stainless steel. Int. J. Electrochem. Sci. 2013, 8, 11847–11859. [Google Scholar]
  20. Yanagisawa, K.; Nakanishi, T.; Hasegawa, Y.; Fushimi, K. Passivity of Dual-Phase Carbon Steel with Ferrite and Martensite Phases in pH 8.4 Boric Acid-Borate Buffer Solution. J. Electrochem. Soc. 2015, 162, C322–C326. [Google Scholar] [CrossRef] [Green Version]
  21. Sánchez, M.; Gregori, J.; Alonso, C.; García-Jareño, J.; Takenouti, H.; Vicente, F. Electrochemical impedance spectroscopy for studying passive layers on steel rebars immersed in alkaline solutions simulating concrete pores. Electrochim. Acta 2007, 52, 7634–7641. [Google Scholar] [CrossRef]
  22. Sánchez, M.; Mahmoud, H.; Alonso, M.C. Electrochemical response of natural and induced passivation of high strength duplex stainless steels in alkaline media. J. Solid State Electrochem. 2012, 16, 1193–1202. [Google Scholar] [CrossRef]
  23. Joiret, S.; Keddam, M.; Nóvoa, X.R.; Pérez, M.C.; Rangel, C.; Takenouti, H. Use of EIS, ring-disk electrode, EQCM and Raman spectroscopy to study the film of oxides formed on iron in 1 M NaOH. Cem. Concr. Compos. 2002, 24, 7–15. [Google Scholar] [CrossRef]
  24. Andrade, C.; Keddam, M.; Nóvoa, X.R.; Pérez, M.C.; Rangel, C.M.; Takenouti, H. Electrochemical behaviour of steel rebars in concrete: Influence of environmental factors and cement chemistry. Electrochim. Acta 2001, 46, 3905–3912. [Google Scholar] [CrossRef]
  25. Hamadou, L.; Kadri, A.; Benbrahim, N. Characterisation of passive films formed on low carbon steel in borate buffer solution (pH 9.2) by electrochemical impedance spectroscopy. Appl. Surf. Sci. 2005, 252, 1510–1519. [Google Scholar] [CrossRef]
  26. Schoonman, J.; Vos, K.; Blasse, G. Donor Densities in TiO2 Photoelectrodes. J. Electrochem. Soc. 1981, 128, 1154. [Google Scholar] [CrossRef]
  27. Horowitz, G. Capacitance-voltage measurements and flat-band potential determination on Zr-doped α-Fe2O3 single-crystal electrodes. J. Electroanal. Chem. Interfacial Electrochem. 1983, 159, 421–436. [Google Scholar] [CrossRef]
  28. Carmezim, M.; Simões, A.; Figueiredo, M.; Belo, M.D.C. Electrochemical behaviour of thermally treated Cr-oxide films deposited on stainless steel. Corros. Sci. 2002, 44, 451–465. [Google Scholar] [CrossRef]
  29. Kennedy, J.H.; Frese, K.W., Jr. Flatband Potentials and Donor Densities of Polycrystalline α -Fe2O3 Determined from Mott-Schottky Plots. J. Electrochem. Soc. 1978, 125, 723–726. [Google Scholar] [CrossRef]
  30. Wang, J.; Wang, Z.; Huang, B.; Ma, Y.; Liu, Y.; Qin, X.; Zhang, X.; Dai, Y. Oxygen vacancy induced band-gap narrowing and enhanced visible light photocatalytic activity of ZnO. ACS Appl. Mater. Interfaces 2012, 4, 4024–4030. [Google Scholar] [CrossRef]
  31. Ansari, S.A.; Khan, M.M.; Ansari, M.O.; Kalathil, S.; Lee, J.; Cho, M.H. Band gap engineering of CeO2 nanostructure using an electrochemically active biofilm for visible light applications. RSC Adv. 2014, 4, 16782–16791. [Google Scholar] [CrossRef]
  32. Sato, N.; Noda, T. Ion Migration in Anodic Barrier Oxide Films on Iron in Acidic Phosphate Solutions. Electrochim. Acta 1976, 22, 839–843. [Google Scholar] [CrossRef]
  33. Cornell, R.M.; Schwertmann, U. The Iron Oxides; Structure Properties, Reactions, Occurrences and Uses; John Wiley & Sons: Hoboken, NJ, USA, 2003. [Google Scholar]
  34. Stimming, U.; Schultze, J. A semiconductor model of the passive layer on iron electrodes and its application to electrochemical reactions. Electrochim. Acta 1979, 24, 859–869. [Google Scholar] [CrossRef]
Figure 1. Heat treatment operations that were applied to obtain fully martensitic steels with various prior austenite grain sizes.
Metals 12 00292 g001
Figure 2. Optical images corresponding to (a) Sample 1 (b) Sample 2 (c) Sample 3 and (d) Sample 4.
Metals 12 00292 g002
Figure 3. EBSD (a) Geometrically Necessary Dislocation (GND) density and (b) Image quality map of Sample 2. The GNDs were calculated for a maximum angle of 10° and up to the 3rd neighbour pixel.
Metals 12 00292 g003
Figure 4. Geometrically Necessary Dislocation (GND) density values of all samples.
Metals 12 00292 g004
Figure 5. High-resolution XPS (a) Fe 2p and (b) O 1s spectrum of Sample 4. Passive layer is formed with potentiostatic polarisation for 6 h at 0.4 V (vs. Ag/AgCl) in 0.1 M NaOH solution.
Metals 12 00292 g005
Figure 6. The fractions of oxides and hydroxide depending on PAGS for samples passivated with potentiostatic polarization at (a) 0.2 V and (b) 0.4 V.
Metals 12 00292 g006
Figure 7. (a) Potentiodynamic polarization curves in 0.1 M NaOH solution (b) Current density values measured at 0.2 and 0.4 V as a function of PAGS.
Metals 12 00292 g007
Figure 8. (a) Nyquist plots of samples collected after passivation with potentiostatic polarisation at 0.4 V for 6 h in 0.1 M NaOH solution (b) Equivalent electrical circuit (EEC) used to interpret the EIS data for all samples. Solid lines represent the fitted data.
Metals 12 00292 g008
Figure 9. Resistance values of (a) R2 corresponding to the double layer and (b) R3 corresponding to passive layer.
Metals 12 00292 g009
Figure 10. (a) Mott–Schottky plot of samples after forming passive layer at 0.4 V for 6 h. (b) Donor density values of the passive layers formed at both 0.2 and 0.4 V for 6 h.
Metals 12 00292 g010
Table 1. Chemical composition of the low alloyed steel specimens.
ElementsFeCSiMnSAlCrNNiSnTi
wt.%bal.0.0950.2481.7760.0020.0320.5740.0080.0260.0020.003
Table 2. Prior Auestenite Grain Sizes (PAGS) of samples after undergoing the heat treatments.
HeadingSample 1Sample 2Sample 3Sample 4
PAG Size5.2 ± 1.5 µm28 ± 3 µm38 ± 4 µm66 ± 6 µm
Table 3. Passive layer thickness values of all samples acquired from XPS data.
Passivation Potential/VPassive Layer Thickness/nm
Sample 1Sample 2Sample 3Sample 4
0.23.0 ± 0.22.9 ± 0.13.1 ± 0.23.1 ± 0.2
0.43.2 ± 0.23.3 ± 0.23.3 ± 0.23.3 ± 0.2
Publisher’s Note: MDPI stays neutral with regard to jurisdictional claims in published maps and institutional affiliations.

