Article

Finite Element Analysis on Welding-Induced Distortion of Automotive Rear Chassis Component

1
Graduate School, Kyungpook National University, Daegu 41566, Korea
2
R&D Division Metallic Material Research Lab, Hyundai Motor Group, Seoul 18280, Korea
3
Smart Manufacturing Technology R&D Group, Korea Institute of Industrial Technology, Daegu 711-883, Korea
4
School of Mechanical Engineering, Kyungpook National University, Daegu 41566, Korea
*
Author to whom correspondence should be addressed.
These authors contributed equally to this work.
Metals 2022, 12(2), 287; https://doi.org/10.3390/met12020287
Submission received: 5 January 2022 / Revised: 24 January 2022 / Accepted: 28 January 2022 / Published: 7 February 2022

Abstract

:
Welding-induced distortion is a major concern for the industrial joining practice. The welding-induced distortion at the weldment between the coupled torsion beam axle (CTBA) of the automotive rear chassis parts and trailing arm connected to the wheel hub axle module seriously affects the tow angle, camber angle, and caster of the wheel axle. In this paper, the welding process between CTBA and trailing arm was numerically analyzed via SYSWELD (i.e., a finite element analysis code), using the material properties predicted via J-MatPro SW, material properties software, considering the thermo-mechanical-metallurgical properties of materials. From the numerical study for the weldment of CTBA and trailing arm, we predicted the welding and thermal distortions, temperature variation, microstructure, and residual stress at the concerned area. As a result, the temperature of the welded area was predicted between 102 °C and 840 °C at the end of weldment and converged to room temperature after 1000 s. The maximum portion of the martensite structure at the welded area was expected to be 55%. The expected distortions of the trailing arm after the weldment were 0.52 mm, −1.47 mm, and 0.44 mm in the x, y, and z-directions, respectively. Finally, the limitations of this research and recommendations are presented.

1. Introduction

Among the several methods employed in the automobile manufacturing process wherein tens of thousands of parts are assembled, welding is an immensely efficient methods for joining parts. Welding is widely used in various engineering applications such as automotive, ship building, aerospace, construction, thermal power plants, and pressure vessels, etc. [1,2,3,4].
The welding processes in the automobile manufacturing industry have quickly been replaced by robot technology due to a few workloads involved in the latter. Therefore, process variable optimization is one of the important factors in the welding process with robot technology. The welding methods used in the automobile manufacturing process include spot welding, connecting the vehicle exterior panel and body, ND: YAG (Yttrium Aluminum Garnet) laser, metal inert gas (MIG) welding, etc. Spot welding involves inducing a temperature increase in the material using electrical resistance. The YAG welding method involves a laser using a YAG rod as the laser medium. MIG welding involves generating an arc between the wire (uncoated bare wire) and the base material, with subsequent melting of the wire.
Although the welding process is a quick and convenient process, some product defects must be considered during the process. While performing such welding (i.e., the joining process using heat), even though the precision and tolerance of each part are secured in the previous manufacturing processes, the already secured precision and tolerance of each part may be deteriorated in the assembly process because nonuniform thermal deformation (i.e., welding-induced distortion) occurs during the heating and cooling cycles of the welding processes [5,6,7].
This thermal deformation is an unavoidable phenomenon in the welding process using a high-temperature heat source due to the transformation characteristics of iron and the difference in the thermal strain rate during the local heating and cooling process [8,9]. Thermal deformation occurring in the welding process plays a negative role in the fabrication process such as the accuracy of part assembly, external appearance, and additional quality cost. Additionally, the tensile residual stress after welding seriously affects the strength and the durability of the product, thus, tight management of the welding process is required [10,11,12]. However, confirming the welding process to obtain the optimal shape consumes a lot of time and effort because the trial for producing the jig to clamp the divided parts and setting variables are needed.
As an alternative to overcome these difficulties, many computational simulation and analysis techniques including thermal elastic-plastic finite element method have been developed to predict the thermal deformation and residual stress occurring during the welding process after the work of Ueda [13]. He performed an elastic finite element simulation using inherent strain method to quantify residual stresses in long welds. Later, Michaleris and Debiccari [14] developed a two-step numerical analysis to predict welding-induced distortion (buckling) and the structural integrity of large and complex structures, where two-dimensional (2D) welding simulation and three-dimensional (3D) structural analysis were combined in a de-coupled approach. Deng et al. [15] presented a numerical model based on the thermal elastic-plastic finite element method to investigate the welding distortion in low carbon steel thin-plate bead-on joints. Wang et al. [16] developed a more accurate model to predict angular distortion and longitudinal bending of the T-joint weld. A 3D TEP-FEM numerical model was established to simulate the welding process during the single-pass welding of pipes as proposed by Wu et al. [17]. They used a rigorous model strictly predicting the thermal-mechanical-metal (phase transformation) characteristics during the welding process. When examining the deformation, residual stress, and metallic properties of the product after welding, a rigorous coupled thermal-structural analysis model must be adopted that strictly considers the thermal-mechanical-metallurgical properties despite excessive computational time and costs. To solely determine the product deformation after welding, it is realistic to adopt a simplified model such as the inherent deformation model, simplified mechanical model, strain as a direct boundary method, and thermal shrinkage model [18,19,20,21]. Such a model needs less analysis time and is consistent with the experimental results to some extent. Recently, Wu and Kim [22] provided a comprehensive literature review of various techniques to reduce and optimize the deformation induced by welding in the design stage and manufacturing process. Rong et al. [23] provided the research status on the welding distortion and residual stress prediction by FE analysis.
Most of the recent research studies in this field have been conducted by using a commercial FE code such as ABAQUS, ANSYS, COMSOL SW, etc., a multi-purpose software proven reliable in analyzing the results. Yang and Kim [24] explained the basic knowledge required for finite element analysis of the welding process and the analysis method in ABAQUS SW. Goldak et al. [25] showed that the actual welding result is well-represented by assuming that the heat source applied during welding is a Gaussian distribution of a double ellipse. Nguyen et al. [26] developed an analytical solution for the transient temperature of a semi-infinite body subjected to the double-ellipsoidal moving heat source and used it to evaluate the residual stresses in weldments by inherent strains and the elastic-plastic finite element method.
SYSWELD [27], a welding software developed by ESI, introduced Gaussian-type heat source distribution and coupled thermal-mechanical-metallic (phase transformation) characteristics. This program has been widely used to control the welding deformation of structures, evaluate the effects of phase transformation on residual stress [16,17], and analyze the thermal-mechanical-metallurgical phenomena of the heat-affected zone (HAZ), etc. in the welding process. Bate et al. [28] suggested that SYSWELD predicts the thermal deformation of the welding process well, but to evaluate the residual stress, a kinematic hardening model is preferred over the isotropic hardening model.
The main purpose of performing computational simulation analysis for the welding process is to predict the welding deformation and residual stress through analysis in advance, and to design the optimal welding process to reduce their occurrence. Jang and Kang et al. [29,30] conducted an experiment on the welding process of automobile bracket products and an analysis study by applying the finite element method. They showed that the method of changing the jig clamping conditions and welding sequence or forced deformation method of the welded deformed product into a shape is effective in suppressing the warpage of the product within the assembly tolerance. Park et al. [31] obtained the residual welding stress by coupling the heat transfer analysis results to the thermal stress analysis for the welding process of automobile frames and compared the analysis and experimental results for welding deformation. Additionally, Lee et al. [32] predicted the welding-induced deformation and residual stress in the MIG welding of an automotive muffler by using the SYSWELD software. They showed that the simulation results were similar to the experimental results, and optimization of the welding procedure by SYSWELD improved the muffler productivity.
Although most research studies have proven that FEM simulation is a good alternative approach, obtaining the material properties related to high temperature such as strain hardening, heat coefficient, TTT curve, etc., remain the research topic.
In this study, the coupled torsion beam axle (CTBA), which is mainly connected to the rear wheel of a small and medium-sized vehicle directly and plays an important role in the vehicle’s behavior, was selected because of the difficulty in obtaining the target shape after the welding process. Figure 1 shows the CTBA, reflecting a relatively stable turning behavior compared to the combination method of the lateral rod and the trailing arm because the vehicle wheel is directly connected to the CTBA. In the lateral rod method, since the overall length of the lateral rod does not change when inducing the up and down bounce of the vehicle body, it is difficult to obtain a stable movement of the vehicle body because the wheels move slightly from side to side. Additionally, when passing through unevenness concentrated on one wheel, the camber angle of the opposite wheel may change to the outside. However, in CTBA, since the up and down bounces are offset by the torsion of the CTBA itself, it shows a relatively stable body behavior compared to the lateral road method. Furthermore, when one-wheel passes through the unevenness, the force is distributed or transmitted to the opposite wheel, and the rolling of the car body is relatively reduced [23,24,25].
The last and most important process in the CTBA manufacturing process is the joining process with the trailing arm using MIG welding. In most cases, CTBA is manufactured differently from the initial design value during the manufacturing process due to the thermal deformation in the welding process above-mentioned. In this case, since it affects the toe and camber values of the wheels related to the driving performance of the vehicle, thermal deformation in the welding process must be strictly managed to secure the driving stability of the vehicle. To minimize thermal deformation in the welding process of the CTBA and the trailing arm, a method of restraining the deformation by fastening a jig at each important point of the CTBA and the trailing arm has been used. However, the restraint position of the jig and the time (cooling time) for biting the jig were intuitively determined in most cases, with some time wasted by not being analytical and systematic.
In this study, for the purpose of analyzing the welding process of CTBA and trailing arm, the thermal-mechanical-metal characteristics of the material of CTBA and trailing arm were first identified. For this purpose, J-MatPro (Java-based Material Properties) [33], based on the CALPHAD method, was used. In addition, using SYSWELD, a finite element analysis program for welding quantified the thermal deformation at critical points during the welding process, temperature change over time, phase transformation, and residual stress. Through this welding process simulation analysis, the welding deformation was identified, the texture distribution of the material was predicted, and the welding residual stress related to the durability of the chassis parts was investigated.

2. Finite Element Analysis

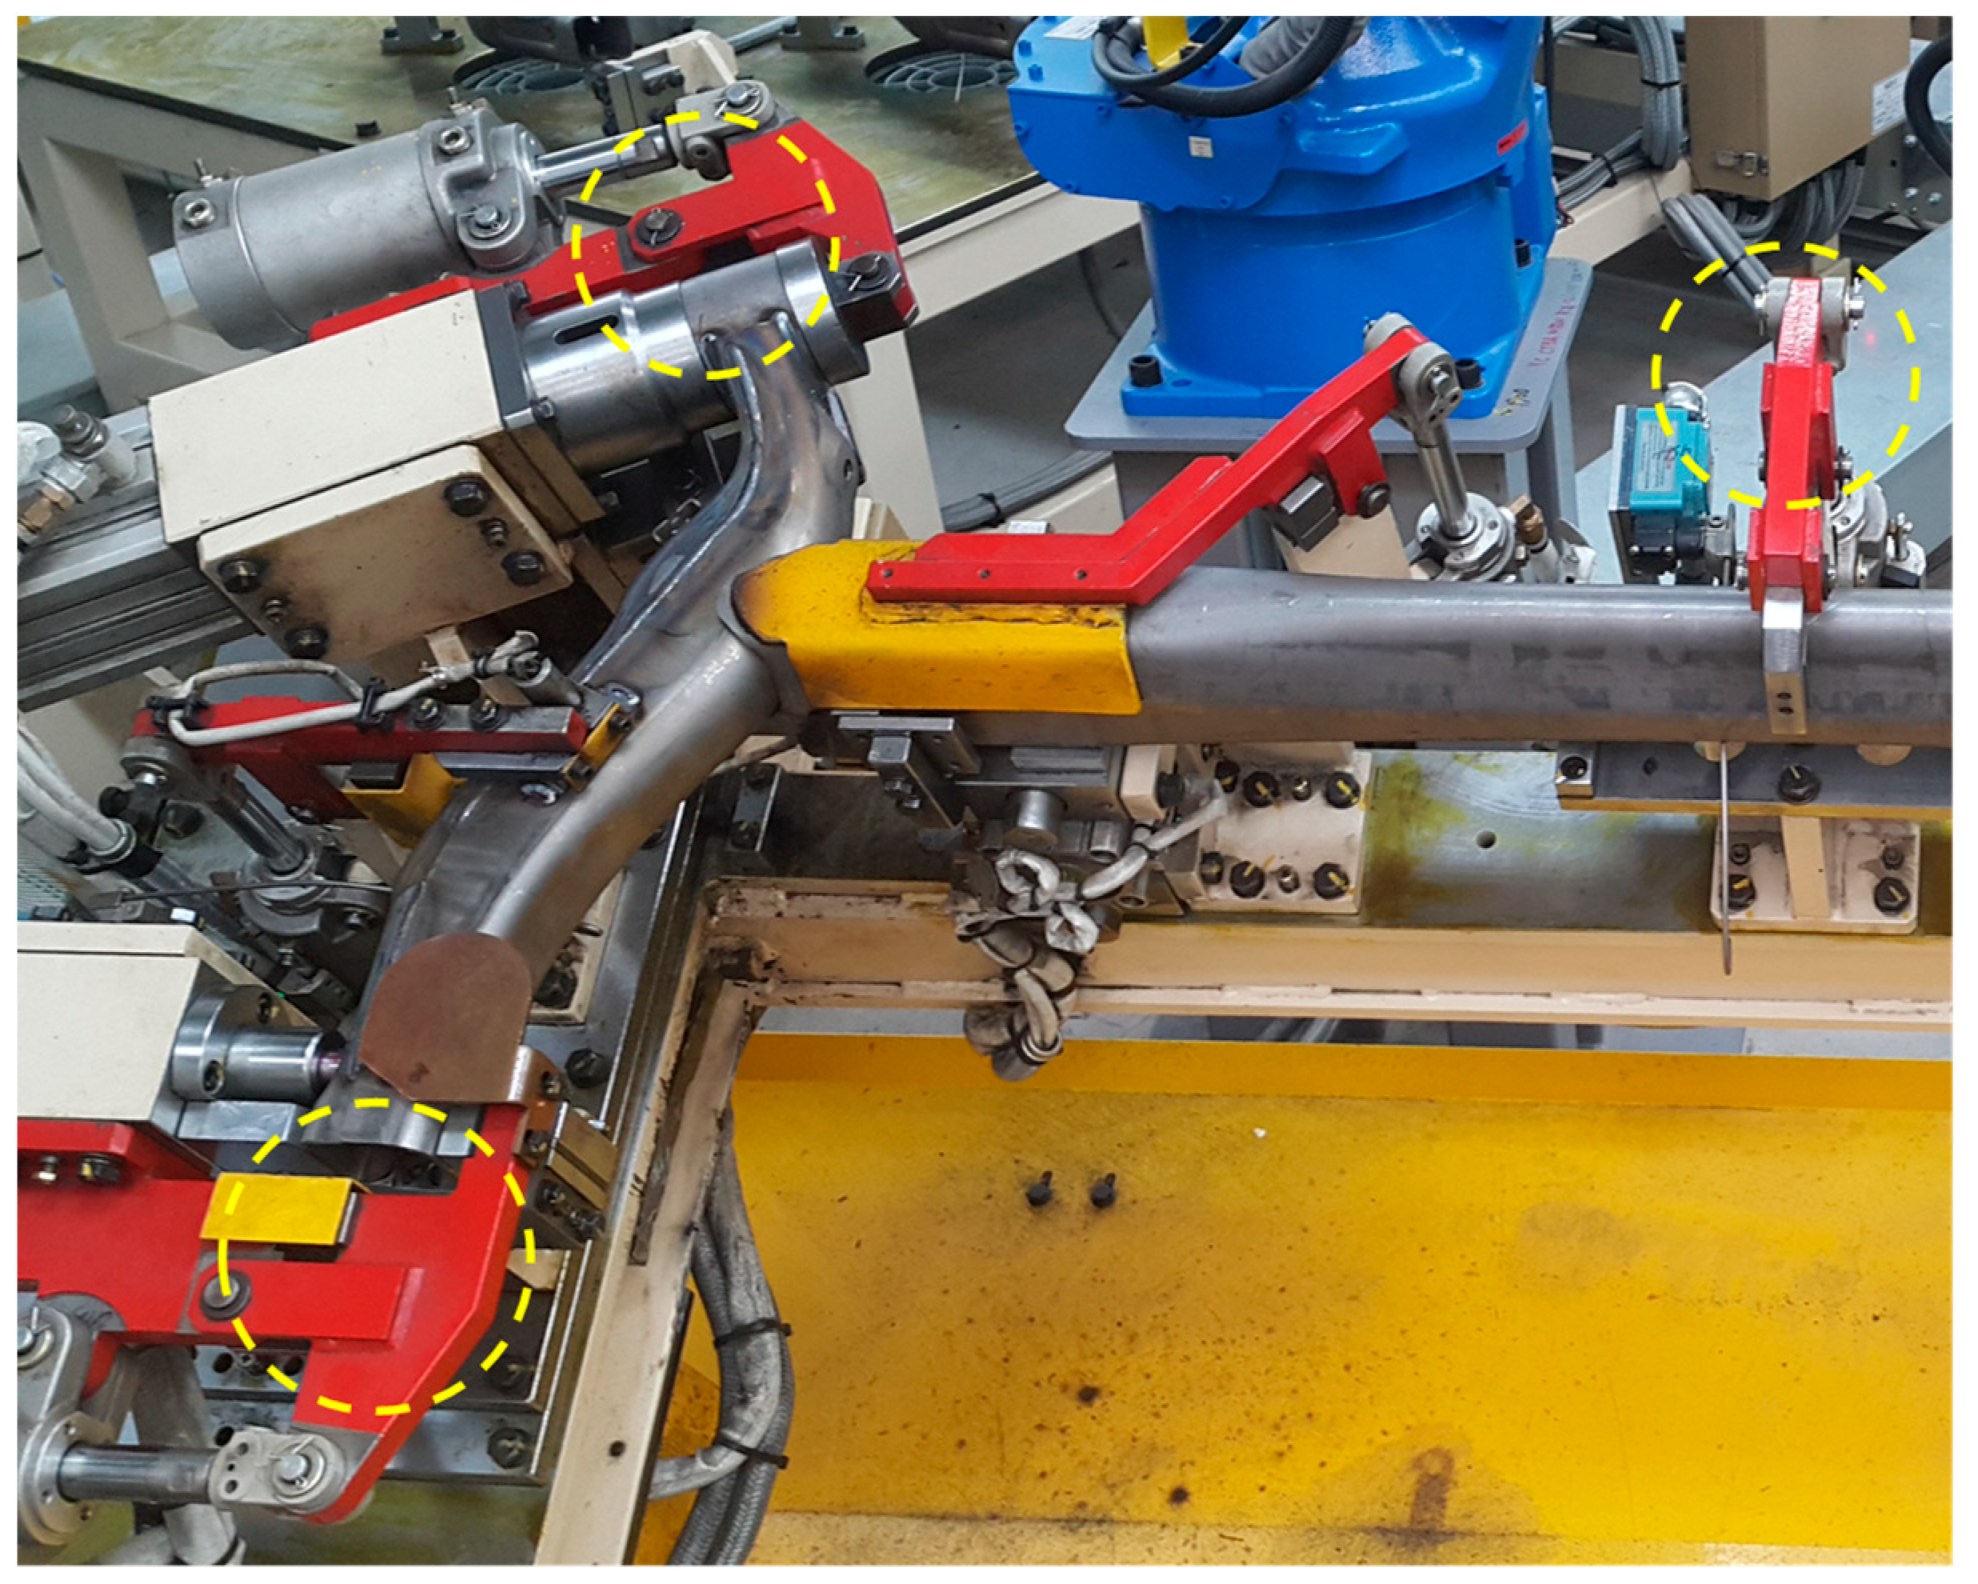
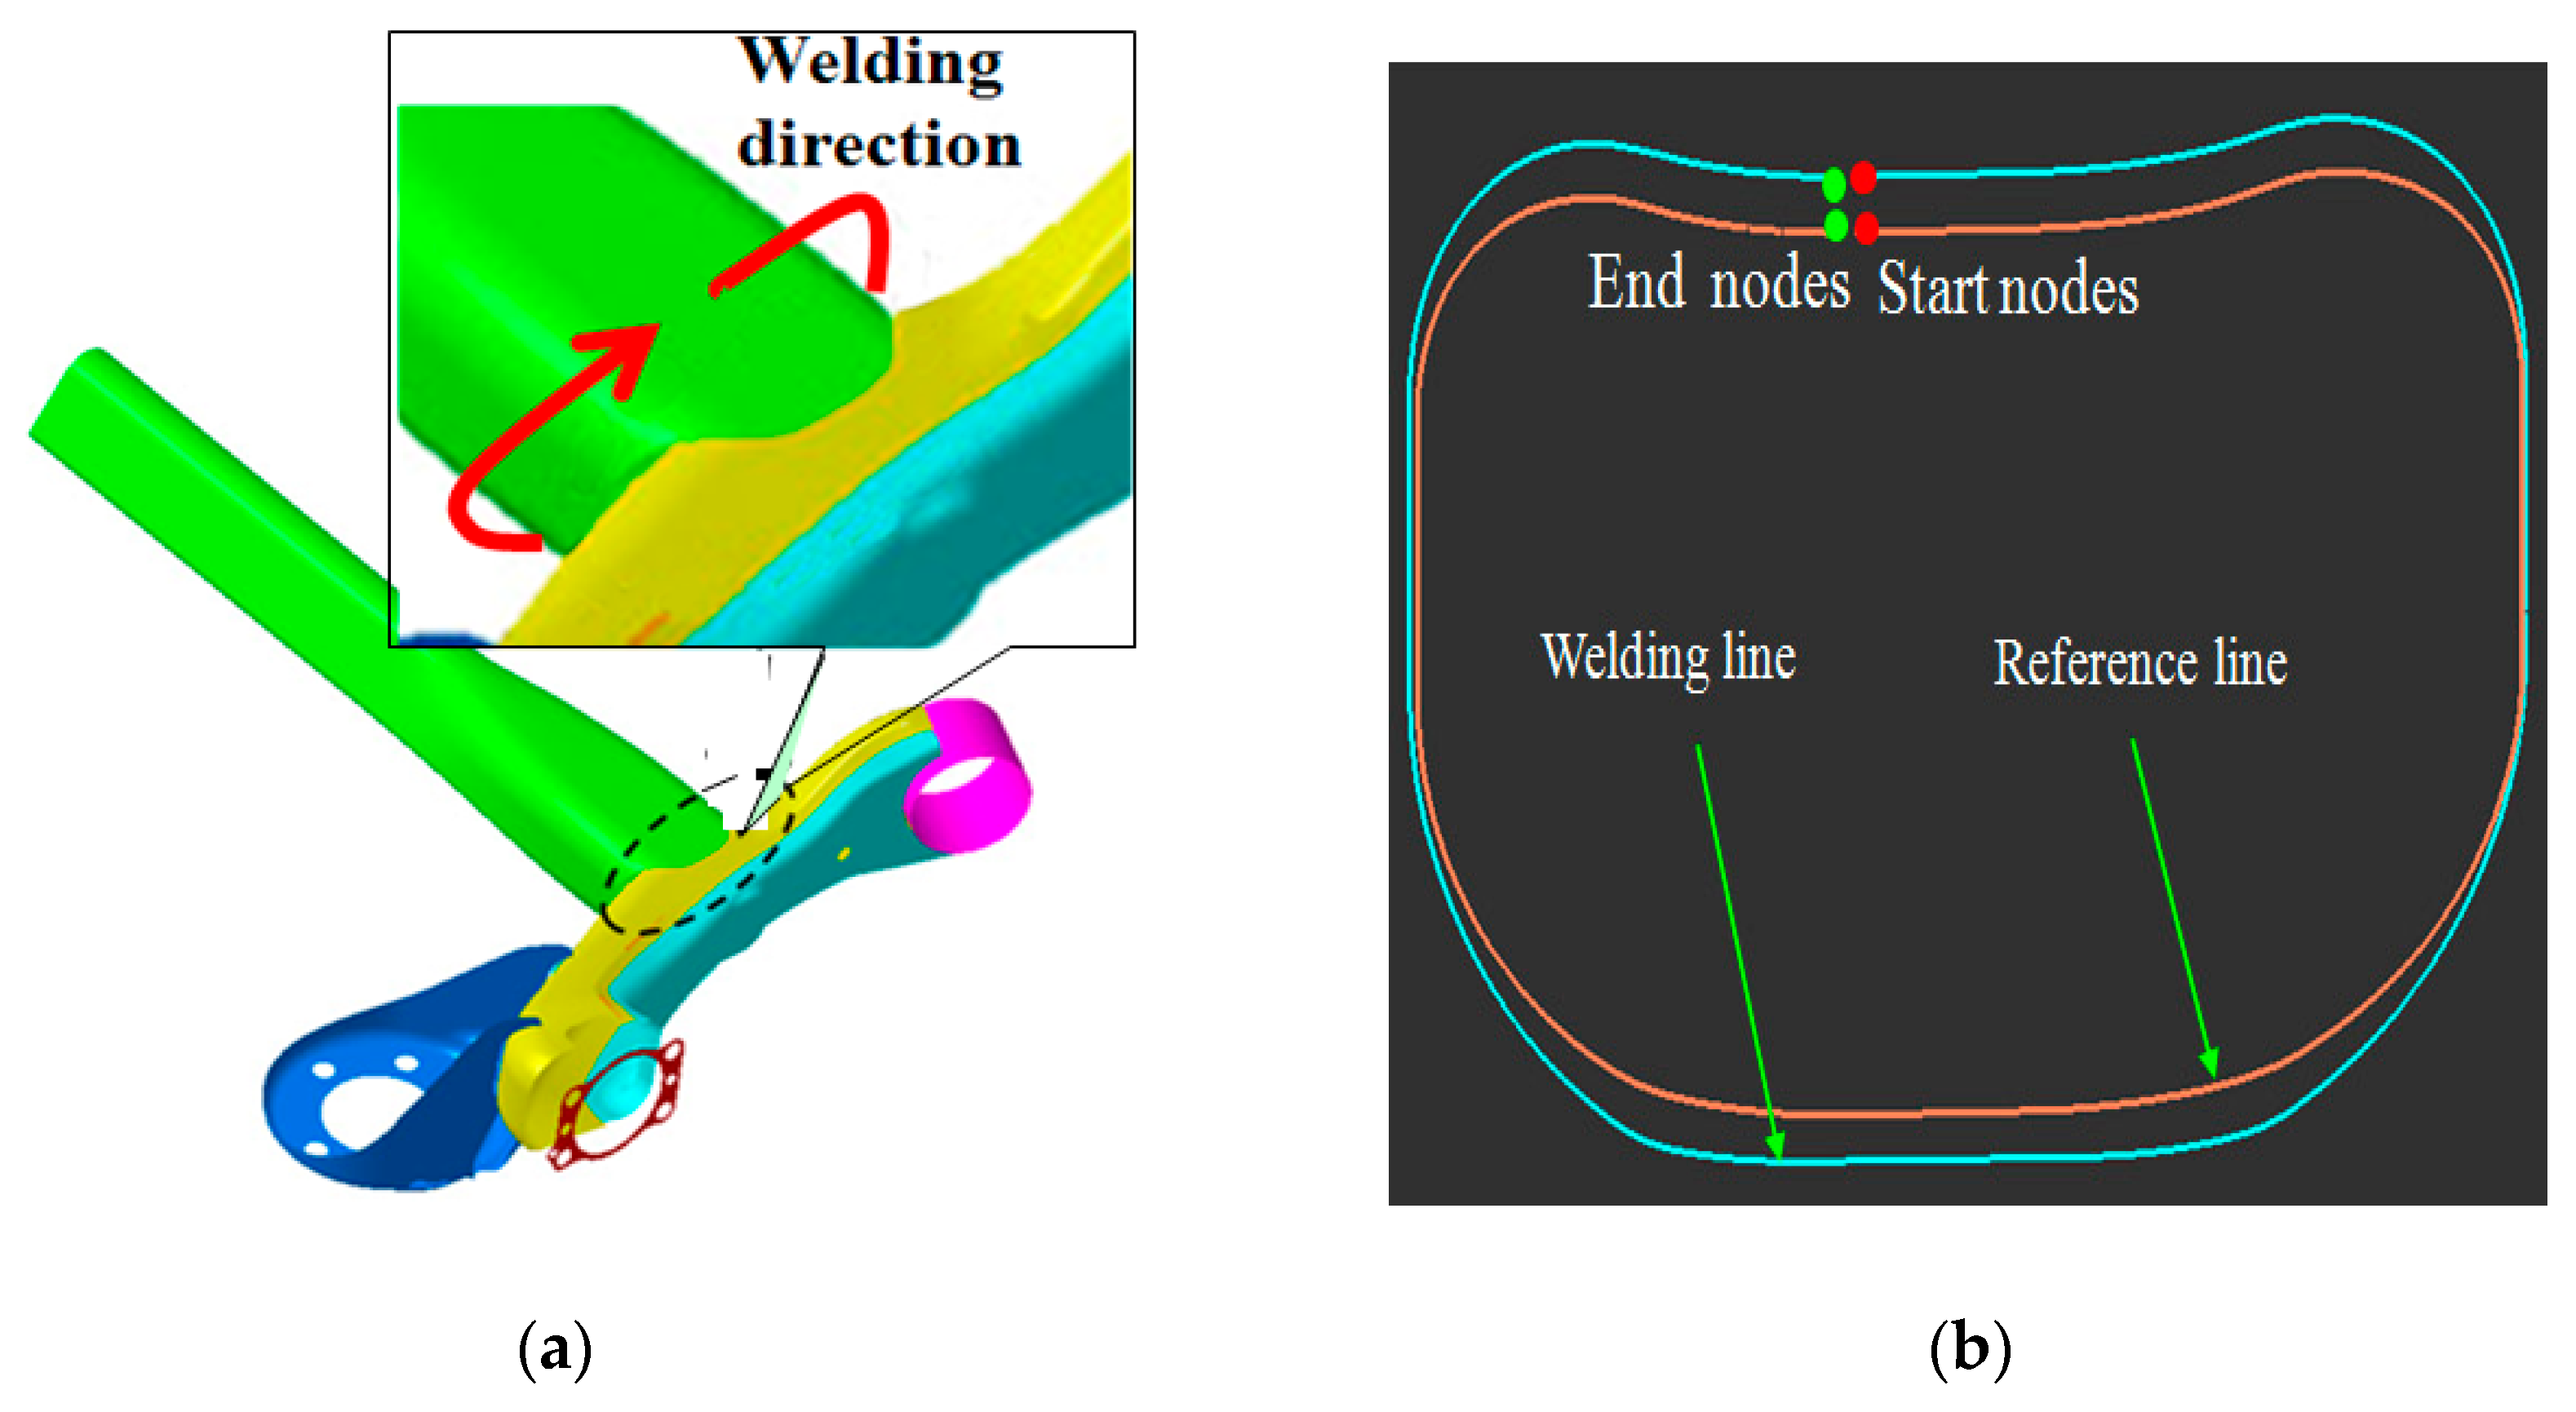
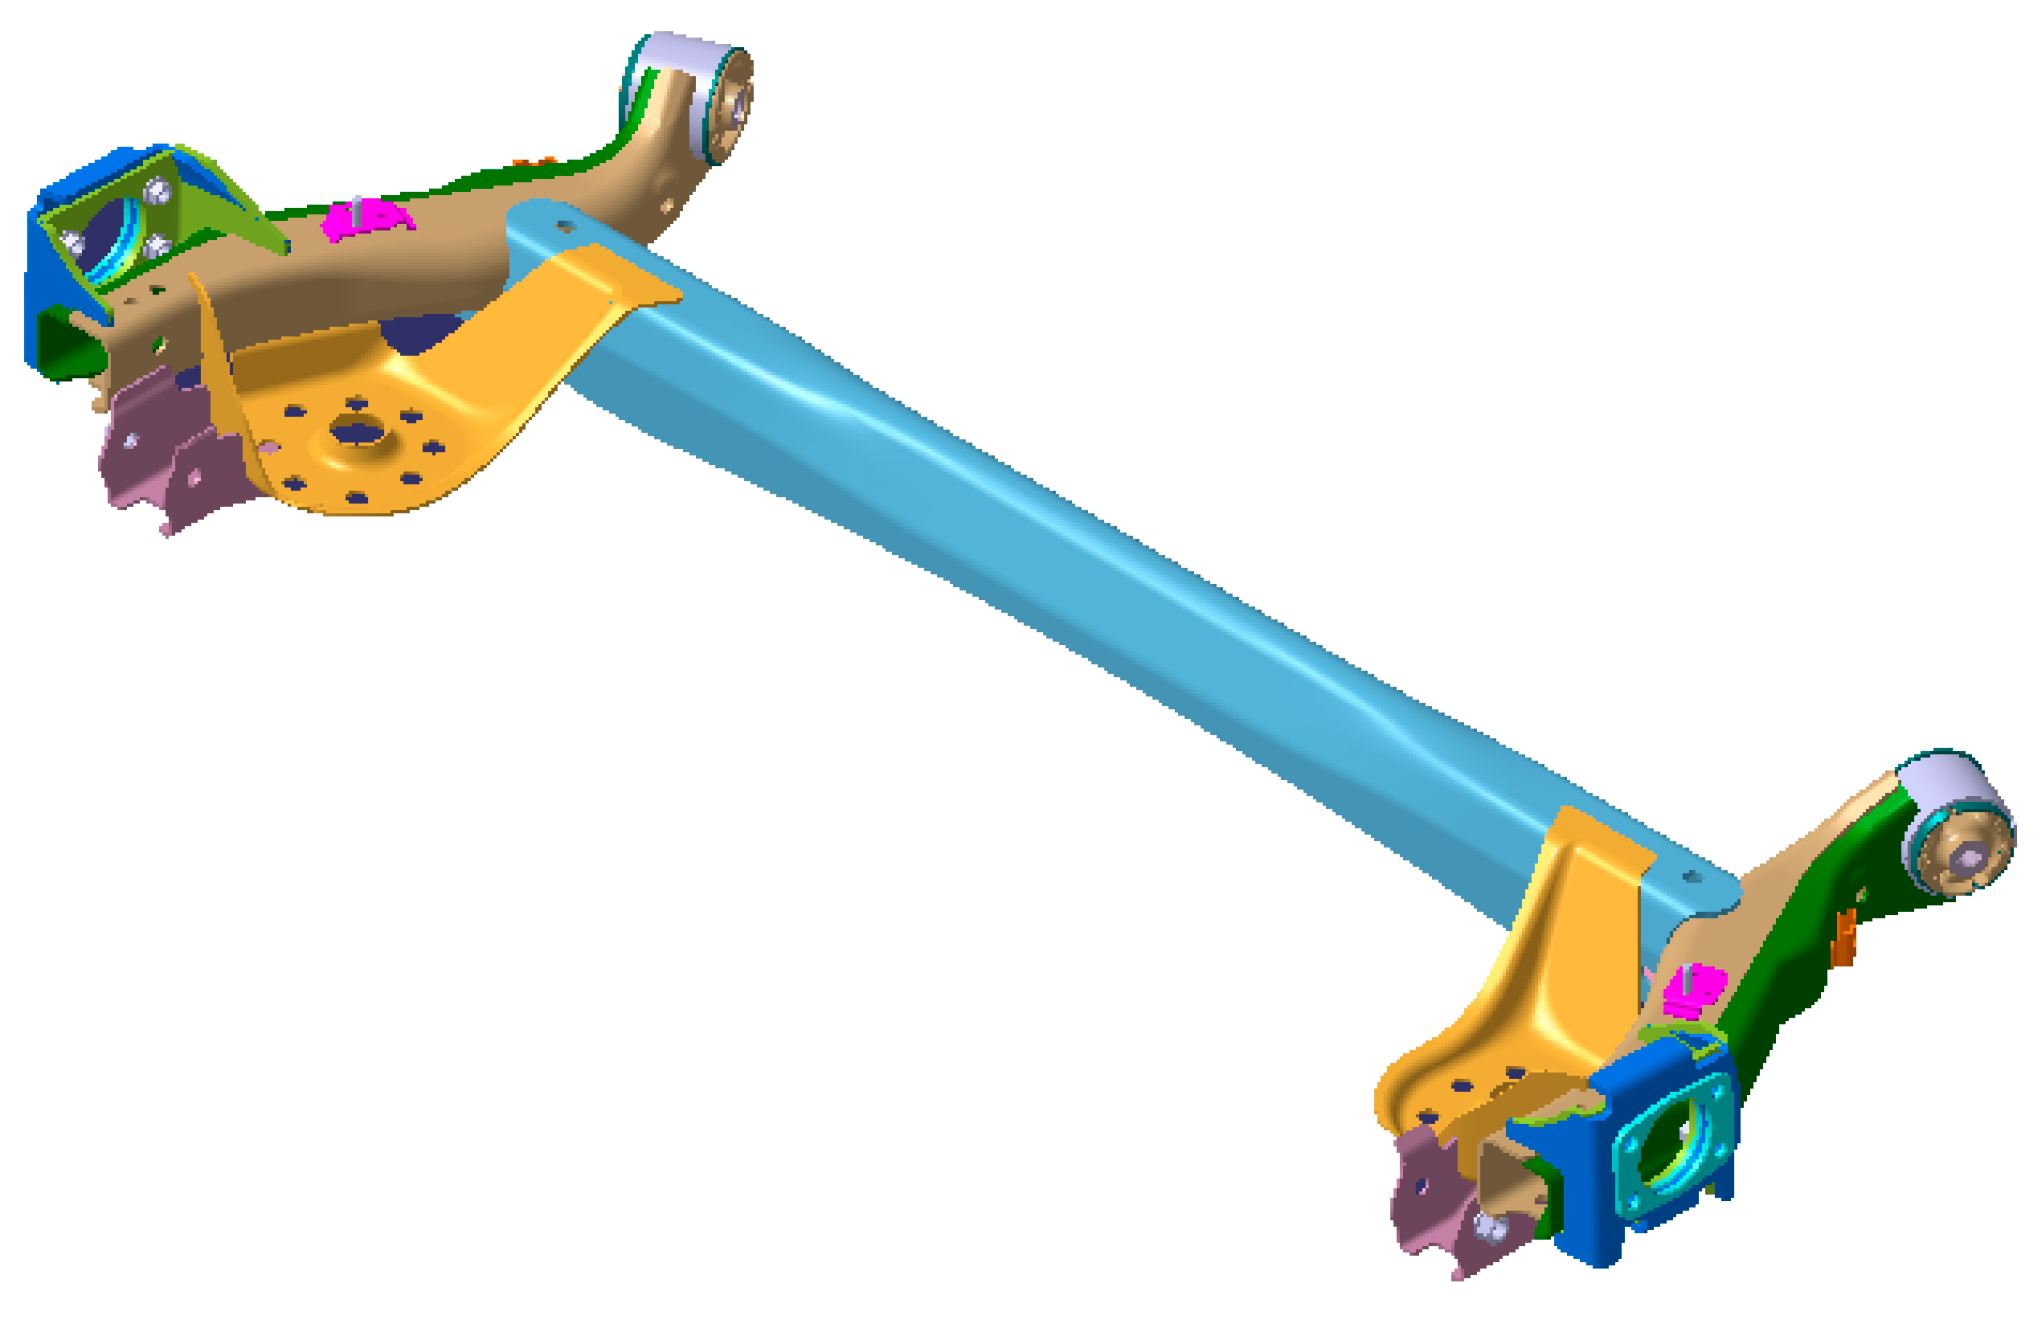
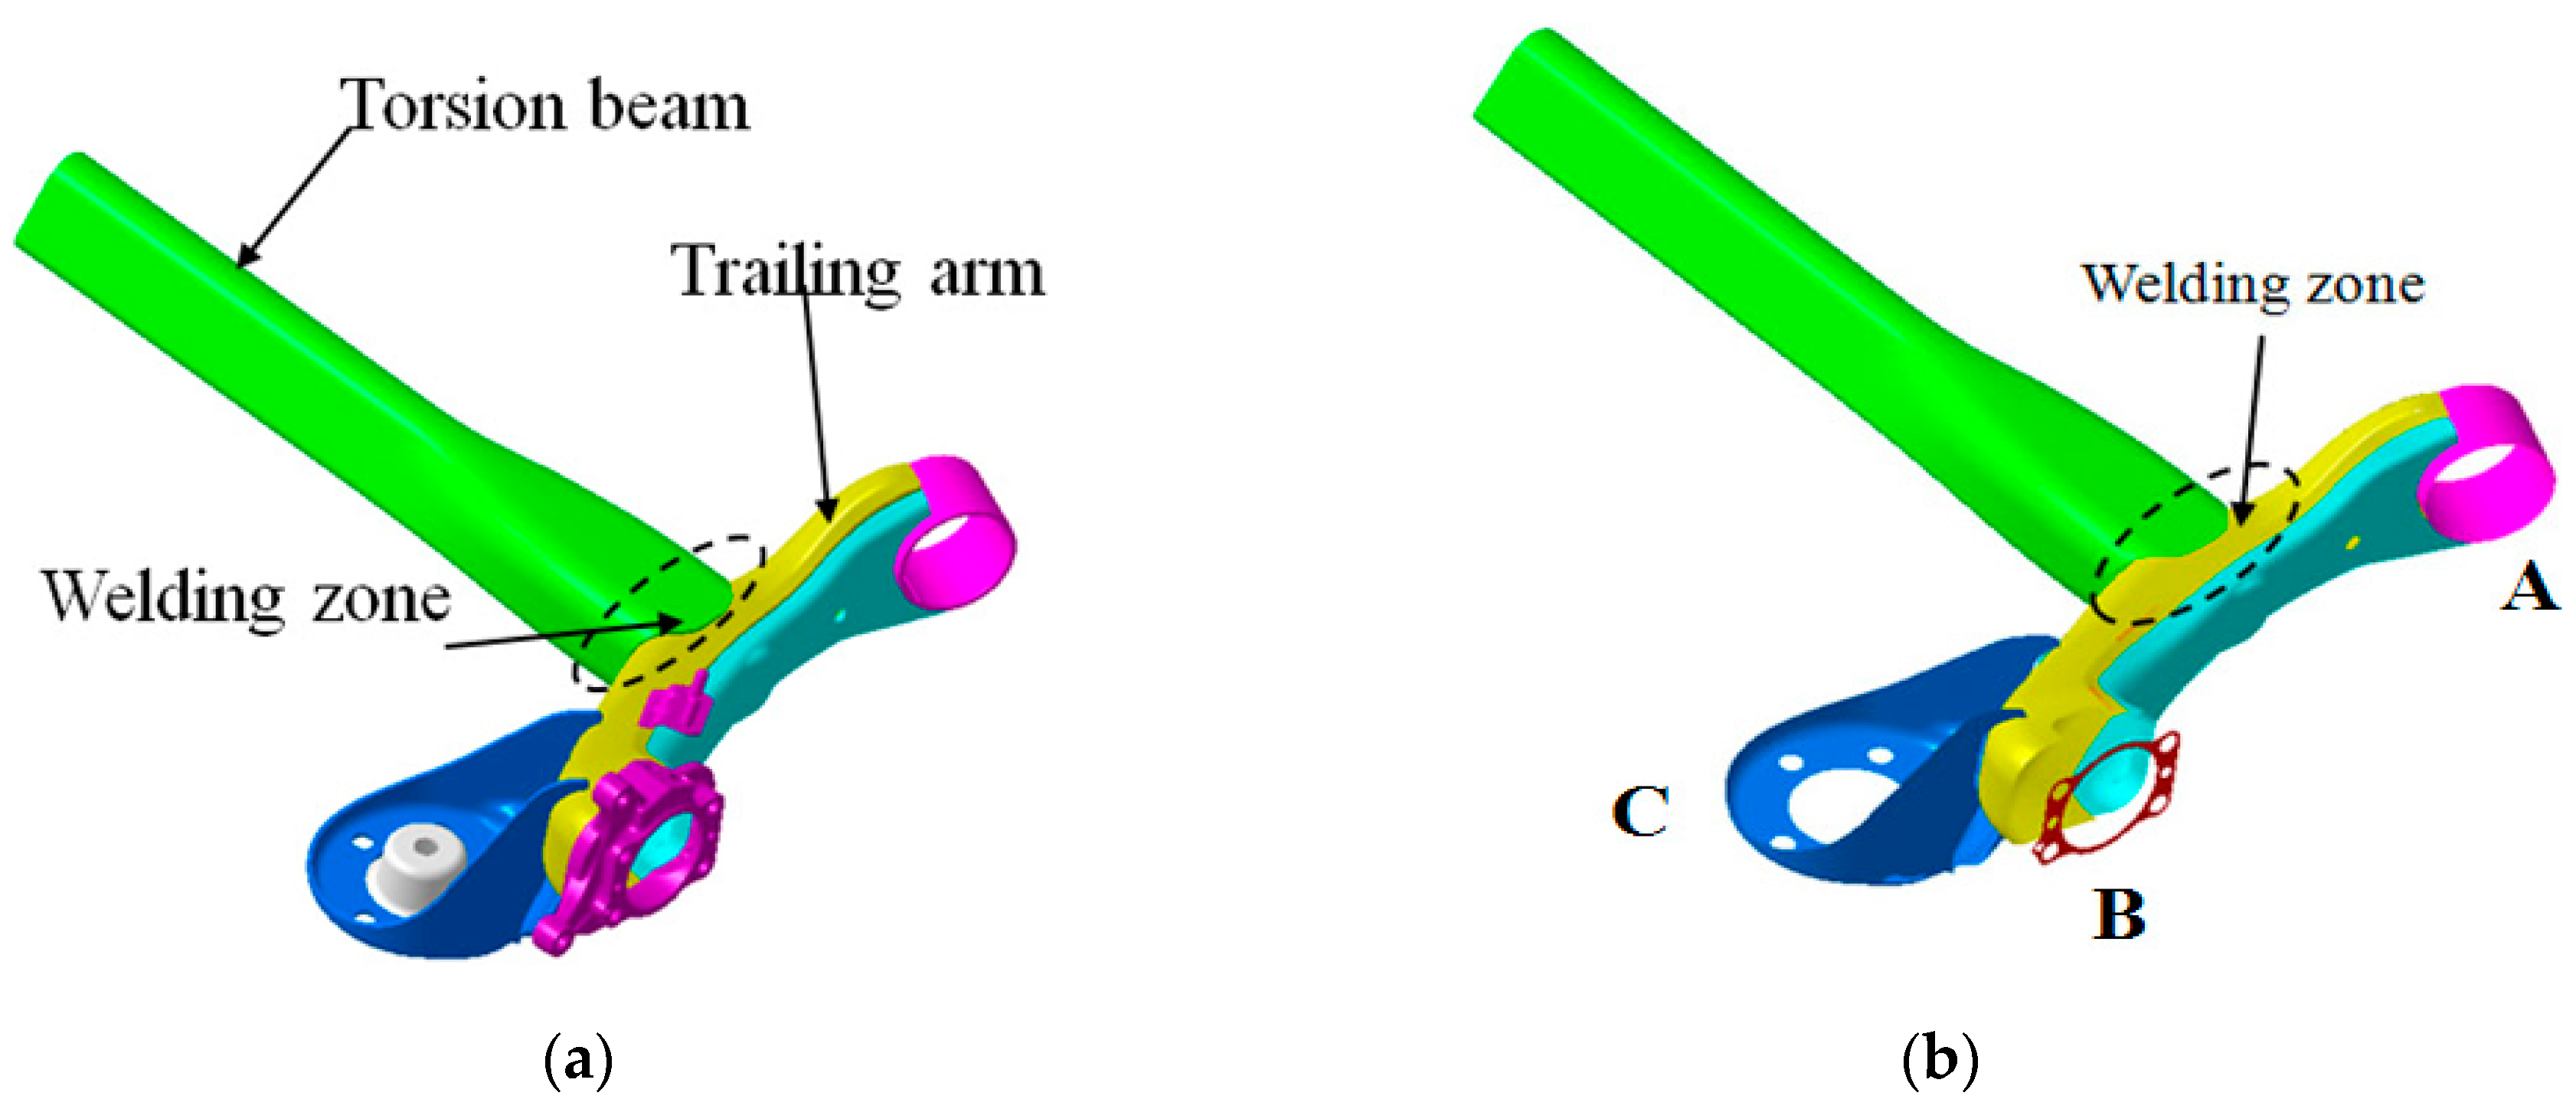
2.1. Specification and Modeling of CTBA and Trailing Arms

In general, CTBA is ~1200 mm in length, ~100 mm in diameter, and ~2.5 mm in thickness. The central part of the CTBA forms a V-shape, and both ends form a square shape for fastening (welding) to the trailing arm. In this study, CTBA processed with 22MnB5, a hot forming material, was used. Hot forming generates automotive structure parts with a high strength of about 1500 MPa by heating a steel material, containing numerous B and Mn atoms, to a high temperature to form an austenite structure, and then forming a martensitic structure through a rapid cooling process such as die quenching.
Conversely, the trailing arm used a round or square tube with a tensile strength of 590 MPa. Table 1, Table 2, Table 3 and Table 4 show the chemical composition and mechanical properties of the 22MnB5 material and the SAPH590 material. In Table 2 and Table 4, E, YS, TS, El, n-value, and R-value represent the Young’s modulus, initial yield stress, yield strength, elongation, strain hardening exponent, and plastic anisotropy ratio, respectively.
Figure 2 shows the actual welding process between the CTBA and the trailing arm, and the numbered part shows the position of the jig fastened during the welding processes.
To analyze the welding process joining CTBA and the trailing arm, FE modeling was performed using shell elements, as shown in Figure 3a,b. For accurate finite element analysis, only the middle surface was taken, and the welding part was modeled. In Figure 3b, part A is fastened to the car body using a bush pipe, part B is connected to the wheel through the hub bearing via the spindle bracket, and part C is where the spring of the suspension is coupled. Therefore, parts A and B affect the toe, camber, and caster angles, thus, the dimensional accuracy of these two parts is particularly important.
The upper figure of Figure 4a is an enlarged view of the welding part. This part, which is the tip of the CTBA, is joined to the trailing arm, and the welding process is performed along the tip periphery. Figure 4b shows the welding start and end points, line to be welded, welding reference line, and welding start and end positions. The positions of the welding start and the end are the same, but here, they are shown as separate for the convenience of indicating the welding path.
Additionally, Figure 5a,b shows the boundary conditions during welding and cooling. As shown in the figure, boundary conditions constraining displacement in all directions were applied to the finite element nodes at the positions marked in white, similar to the actual process shown in Figure 3.

2.2. Setting Parameters for Welding Simulation

The welding process in the actual production line consists of the following steps: (1) Fasten the CTBA and the trailing arm in place; (2) As shown in Figure 3, restrain the bush pipe and the connecting part A, the hub bearing and the connecting part B, and the center of the CTBA; (3) In this state, weld for 40 s along the welding line in Figure 4 with a MIG robot welding machine; and (4) After welding is completed, cool in the air for 1000 s with all restraints dismantled.
Table 5 shows the detailed welding conditions and parameters. The temperature of HAZ used for the analysis was set to 867 °C, an average of the temperatures measured at the locations of 20 actual welds. The efficiency coefficient was assumed to be 0.6.
Among the welding types, overlapping welding is a method of welding overlapping parts by adding two plates, as shown in Figure 6a. Figure 6b shows the type of heat source used for the MIG welding adopted in this study.

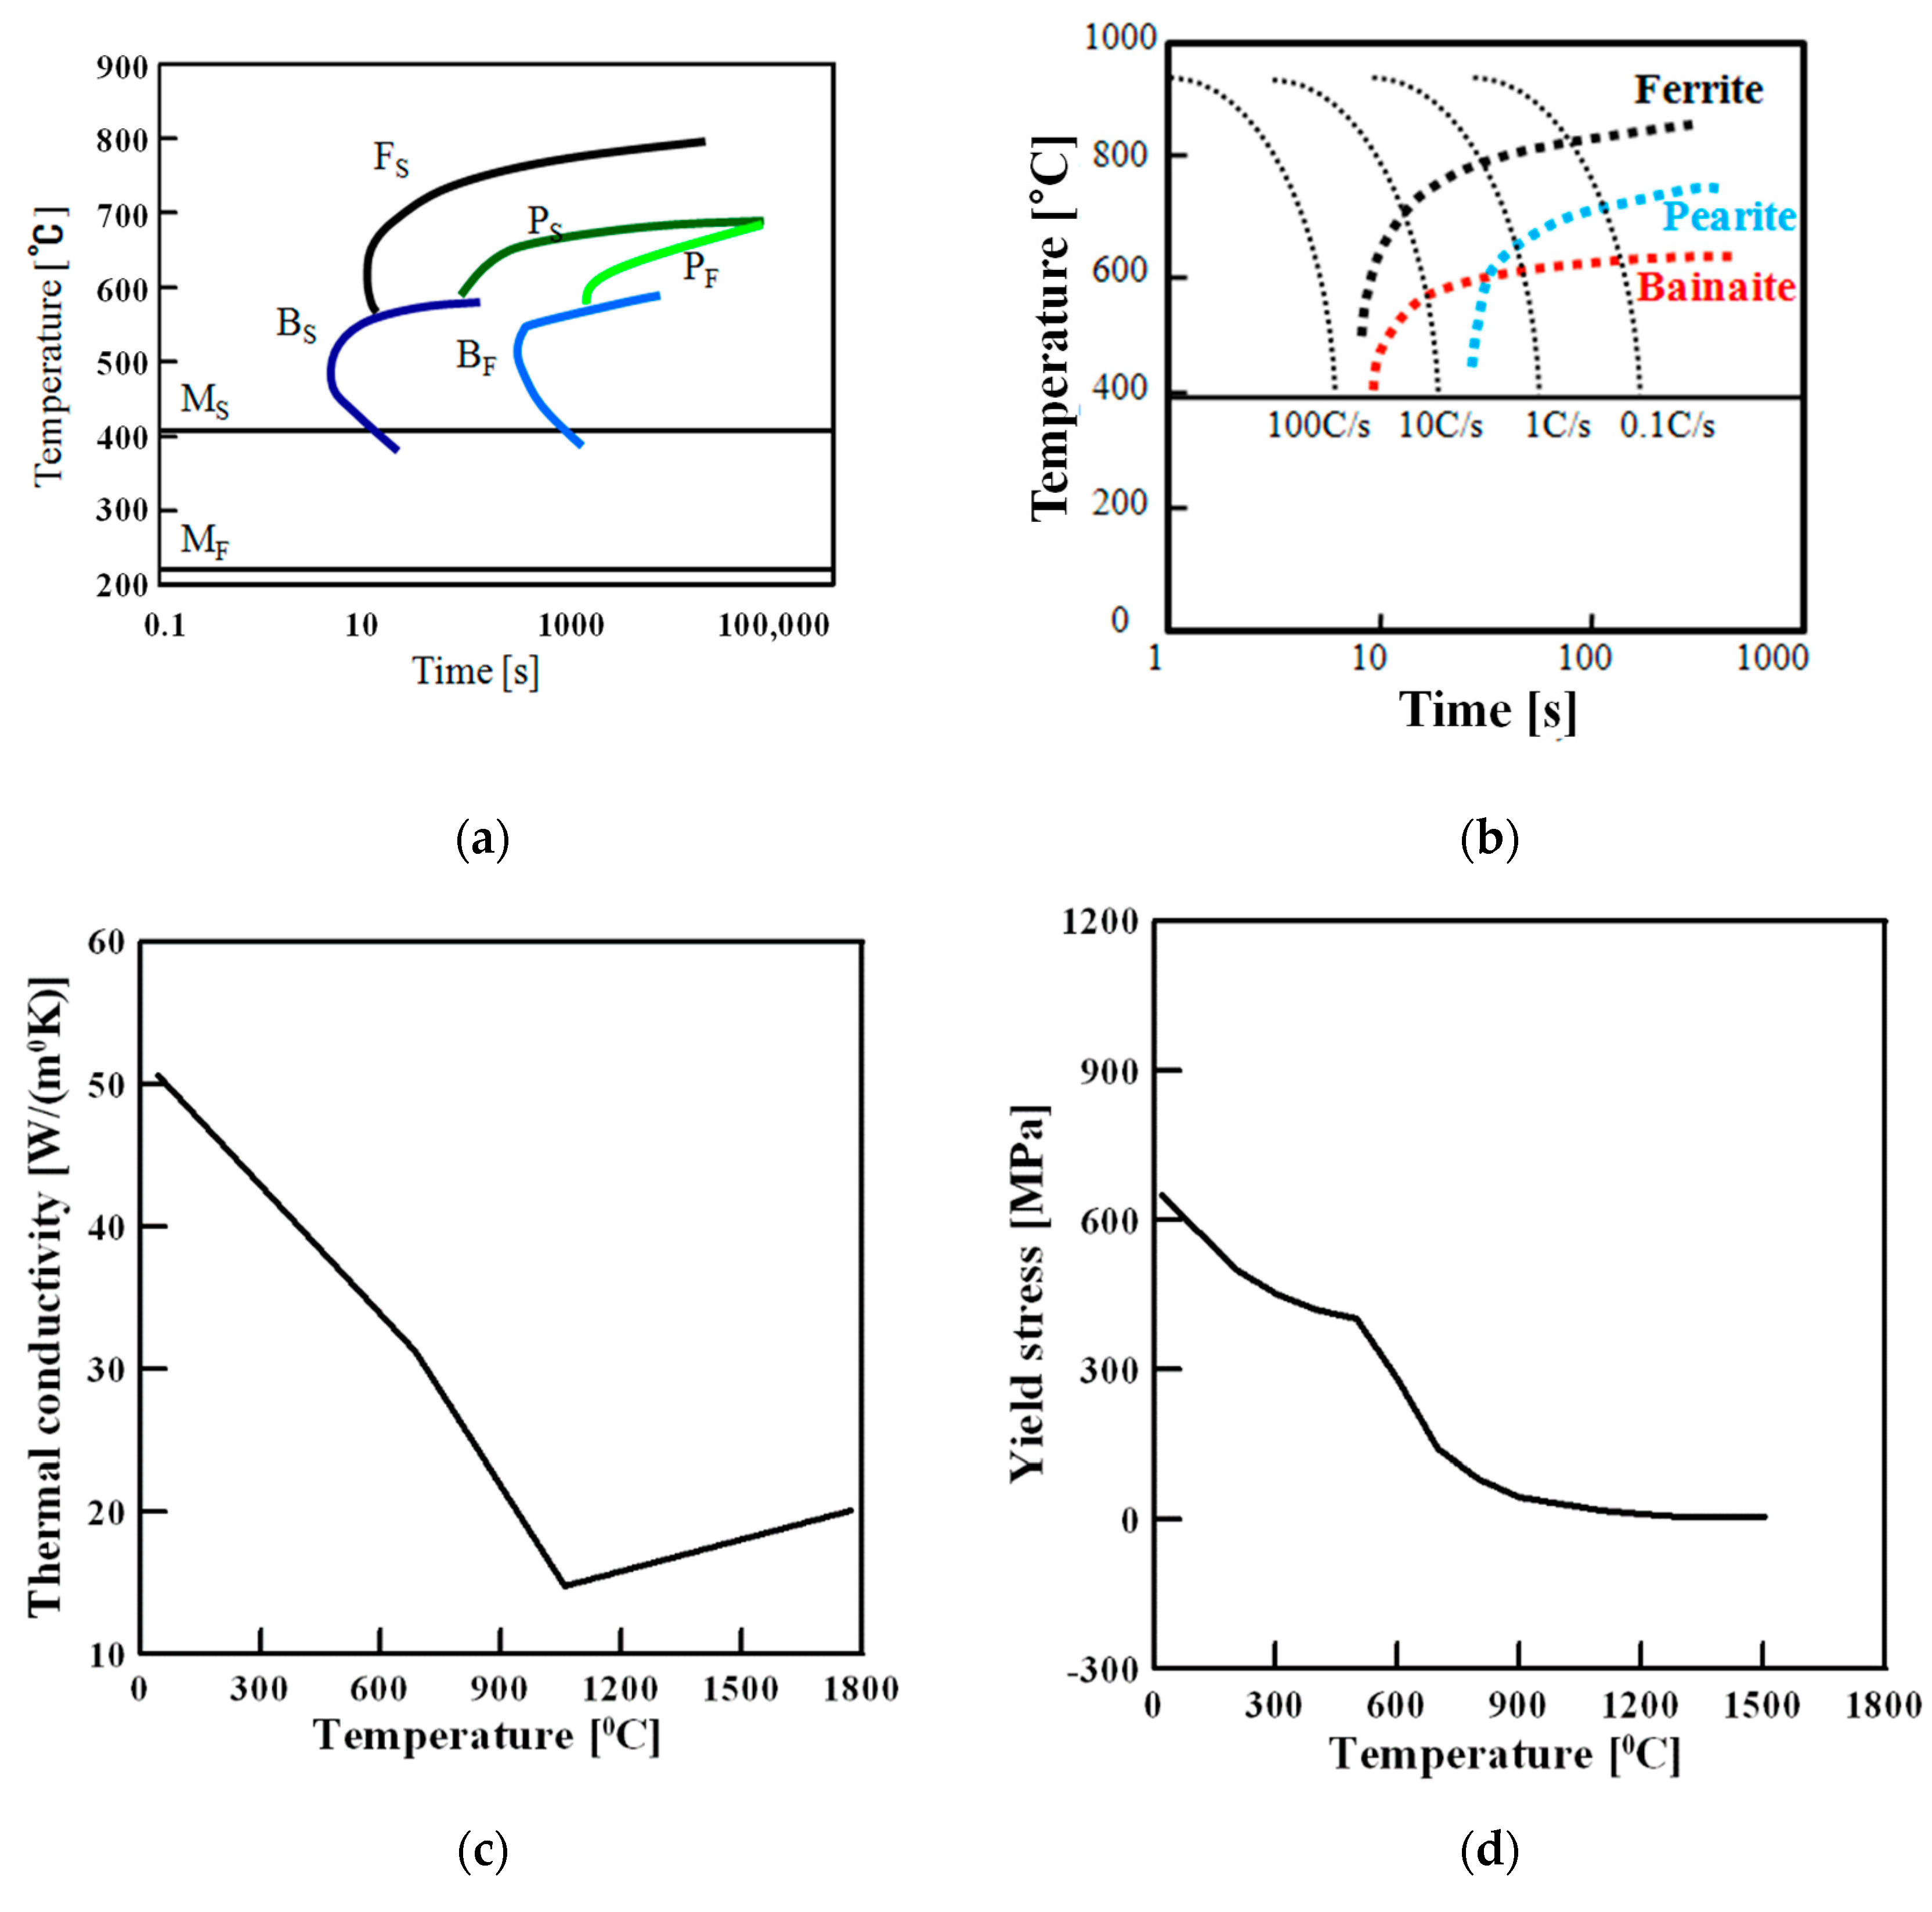
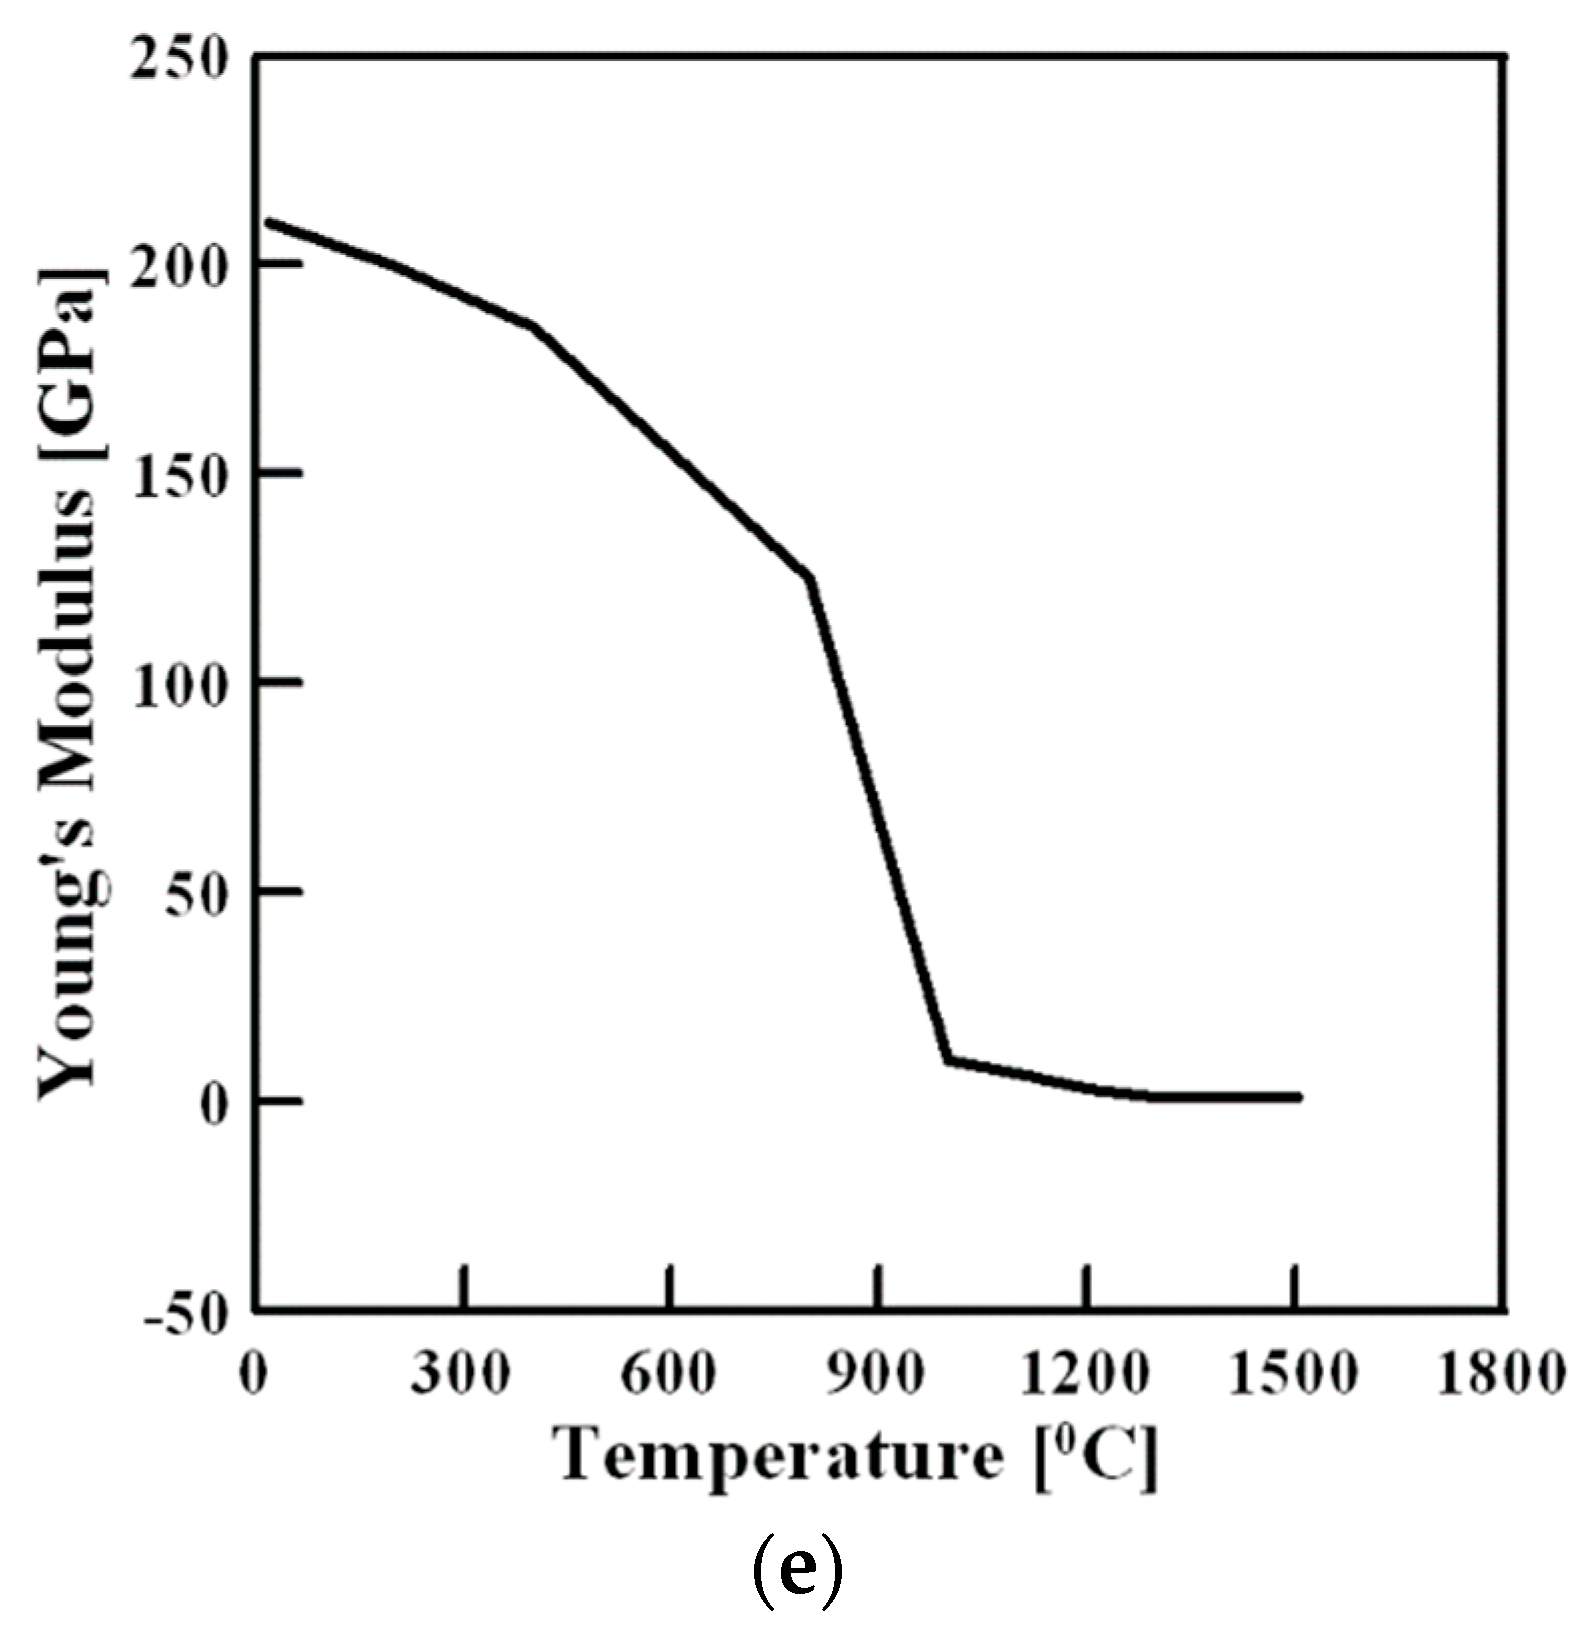
2.3. Material Properties for High Temperature

For accurate welding process analysis, the database for thermal-physical properties of 22MnB5 and SAPH590 materials was obtained using the J-MatPro program.
J-MatPro provides the thermo-physical properties of a material such as thermal conductivity, specific heat, Young’s modulus, flow curve, phase transform characteristics, continuous cooling transform curve (CCT), and time–temperature transform (TTT) by inputting the chemical composition of the material. The obtained database of the thermal-physical properties is an important variable for the analysis of the welding process.
Figure 7a–e shows the TTT diagram, CCT diagram, thermal conductivity, yield stress, and Young’s modulus, which are the thermal-physical properties of 22MnB5 obtained using J-MatPro, respectively. Detailed information on the thermo-physical properties of the SAPH590 material is described in [27], omitted here for reasons of space.

3. Analysis of Finite Element Analysis Results

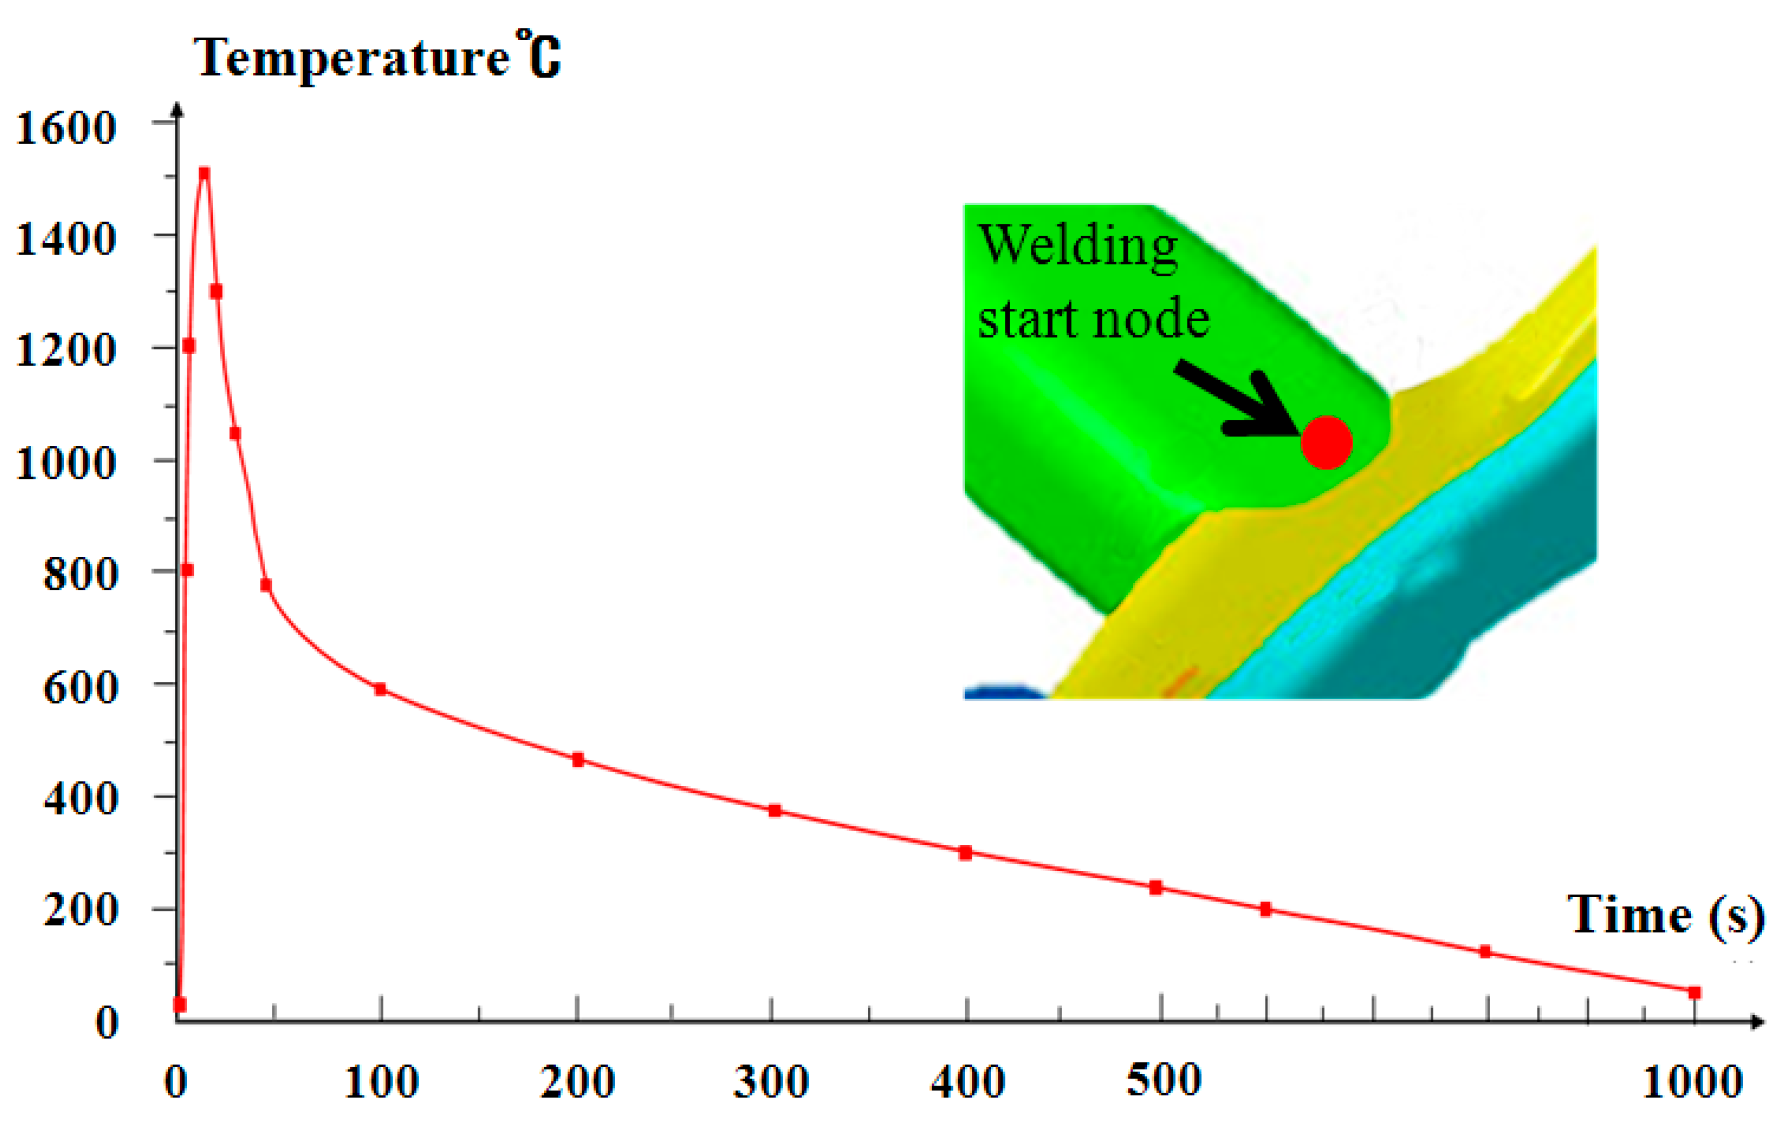
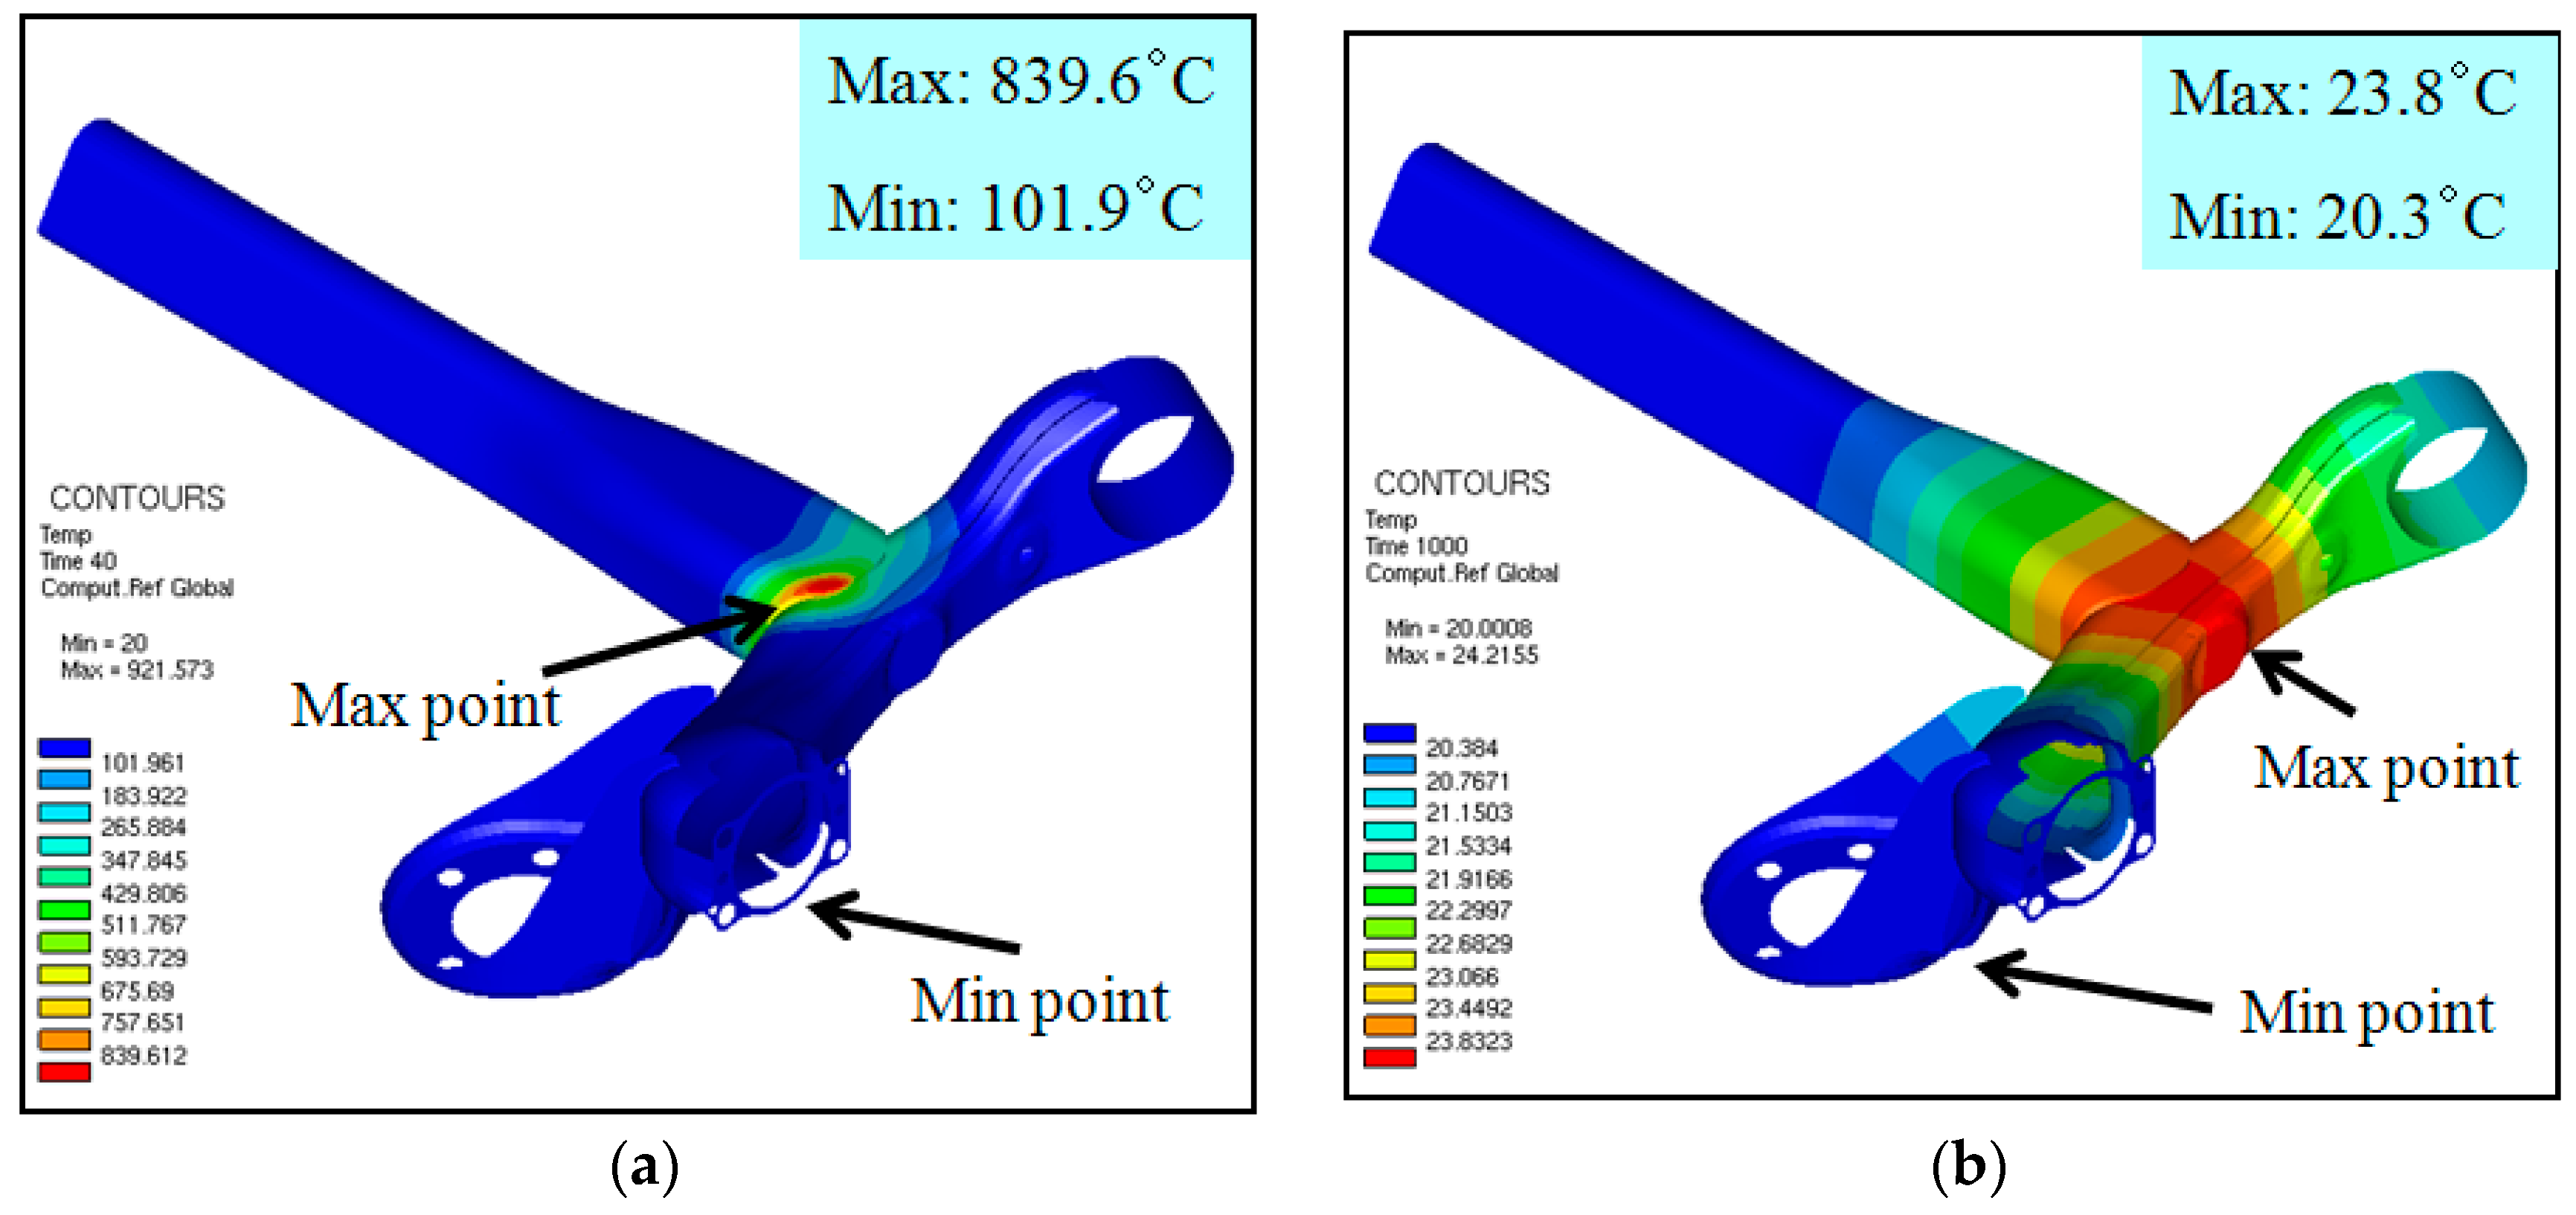
3.1. Temperature Analysis

As in the previous section, after modeling the welding process between the CTBA and the trailing arm, the welding process was analyzed using SYSWELD, and the results for important properties were derived.
Figure 8 shows the results of calculating the temperature change according to the process time based on the position of the welding start point. As shown in the figure, at the beginning of the welding process, the joint between CTBA and trailing arm is heated to 1500 °C or higher, that is, to the melting point or higher, and when the welding time passes 40 s, it drops to 800 °C or lower. After welding is completed, the welding jig is dismantled and cooled to room temperature for up to 1000 s.
After welding completion, if the welding jig is dismantled, the welded part is cooled to RT after 1000 s.
As shown in Figure 8, the cooling rate for 40 s while restraining the thermal deformation of the material with the welding jig was about 17.5 °C/s. The cooling rate was about 3.6 °C/s between 40 and 100 s after dismantling the welding jig. Therefore, as predicted from the CCT curve in Figure 8, a mixed structure of martensite, ferrite, and bainite must be obtained at the welding starting point.
At 100 s after the welding completion and dismantling of the welding jig, CTBA showed a linear decrease in temperature by convective heat transfer (cooling rate: ~0.64 °C/s).
The temperature at ~100 s from the starting point of welding rises to the melting temperature of the material and then rapidly decreases due to conduction and convective heat transfer from the heat source moving along the welding path. Therefore, the first 100 s of the cooling dominated by conduction and convection is a relatively short time compared to the total cooling time of 1000 s, although rapid. Therefore, the cooling behavior up to the first 100 s after the welding process is important in controlling the welding heat deformation of the CTBA products.
Figure 9a,b shows the temperature of each part after the welding process. Figure 9a shows the temperature distribution around the weld area after 40 s immediately post welding, with the highest and lowest temperatures of 839.6 °C and 101.9 °C, respectively. Figure 9b shows the temperature distribution around the welding part after cooling for 1000 s immediately post welding with the highest and lowest temperatures of 23.8 °C and 20.3 °C. When performing the cooling process by convective heat transfer for about 1000 s, the welded member is cooled to the room temperature in all parts.

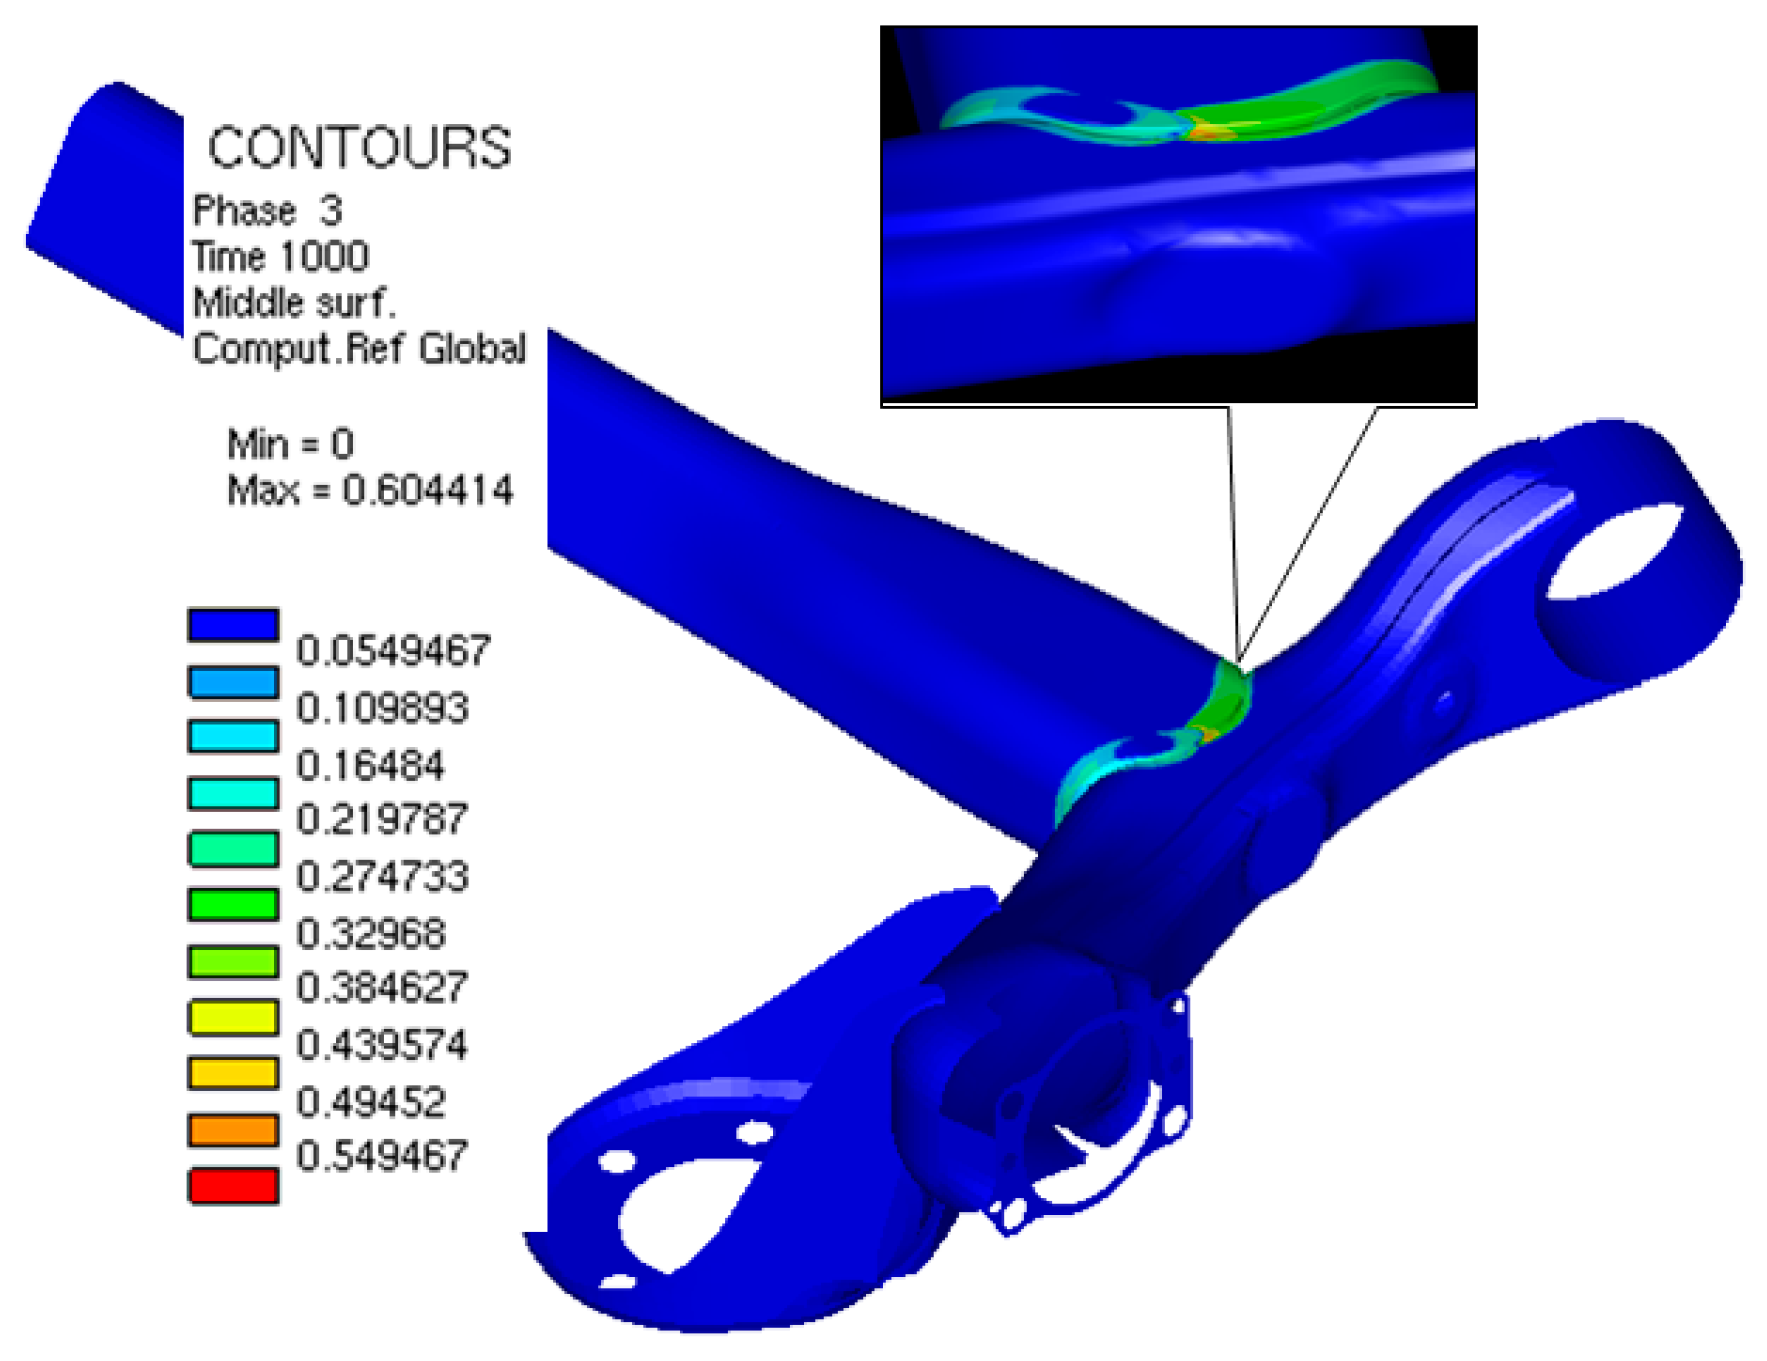
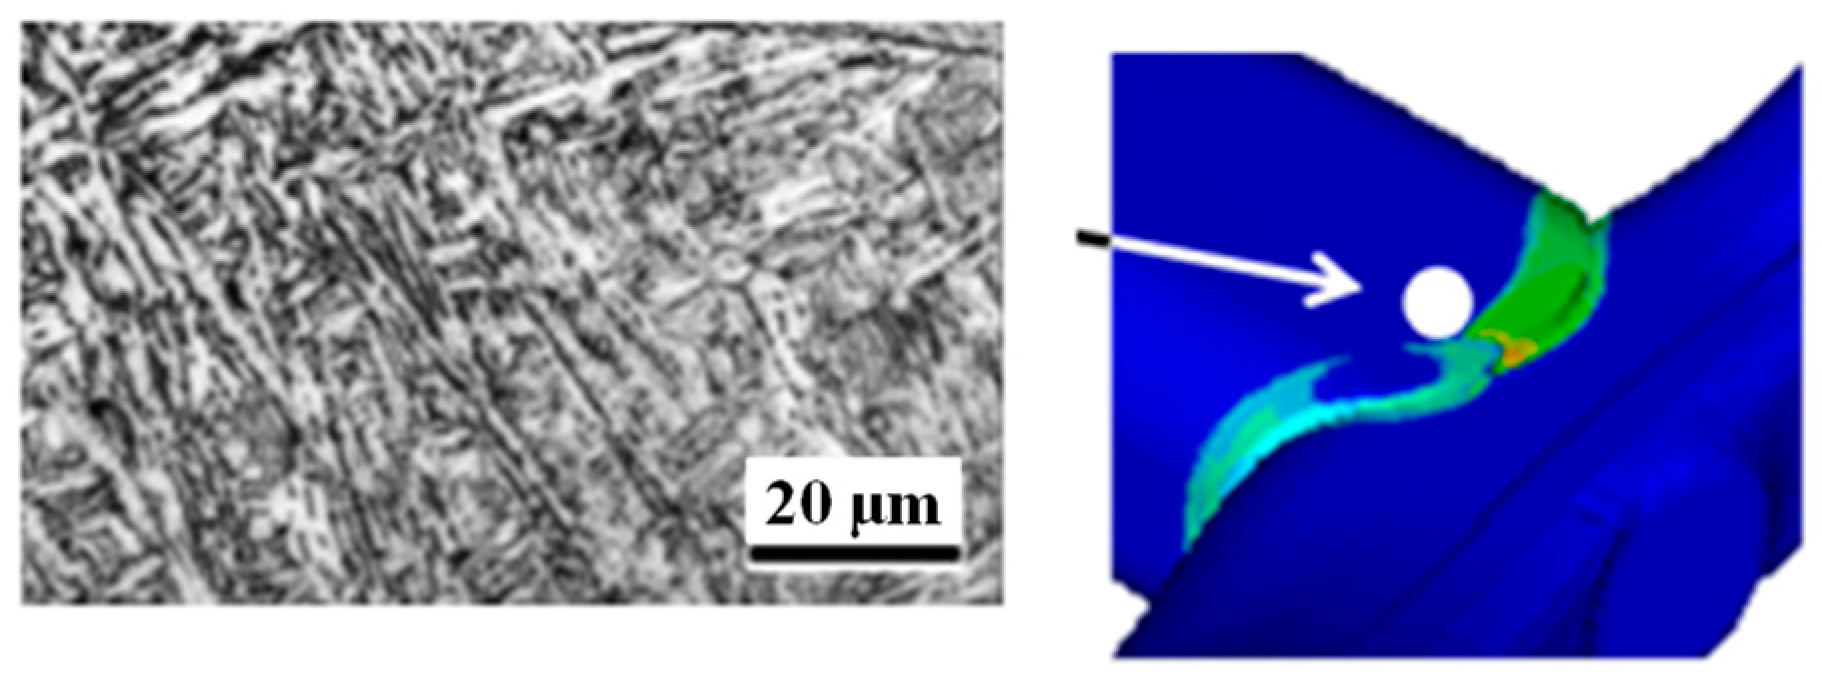
3.2. Phase Transformation

Figure 10 shows the fraction of the martensite structure obtained in the HAZ area where welding started post-welding analysis by SYSWELD. The part showing the highest fraction of martensitic structure among welded parts is a very small area where the maximum heat source near the welding start point is applied. The region had a martensite fraction of about 55% and other HAZ regions were about 35% or less.
In the air cooling of austenitic steel, the material is cooled by convective heat transfer with a low cooling rate, and the fraction of martensite structure does not exceed 50%.
In this study, cooling is accelerated by the convective heat transfer and heat conduction in most of the HAZ region during the cooling process after welding, but the cooling rate is slow, thus, the fraction of martensite structure is not high.
The cooling rate at the HAZ position is shown on the continuous cooling transformation curve in Figure 8. As predicted from the CCT diagram, the region contained a mixed structure of martensite, ferrite, and bainite.
To confirm the phase located at the HAZ position, scanning electron microscopy was performed. Figure 11 shows a picture of the structure at the central part of the HAZ area post-welding completion, which is composed of a mixed phase of martensite, ferrite, and bainite.

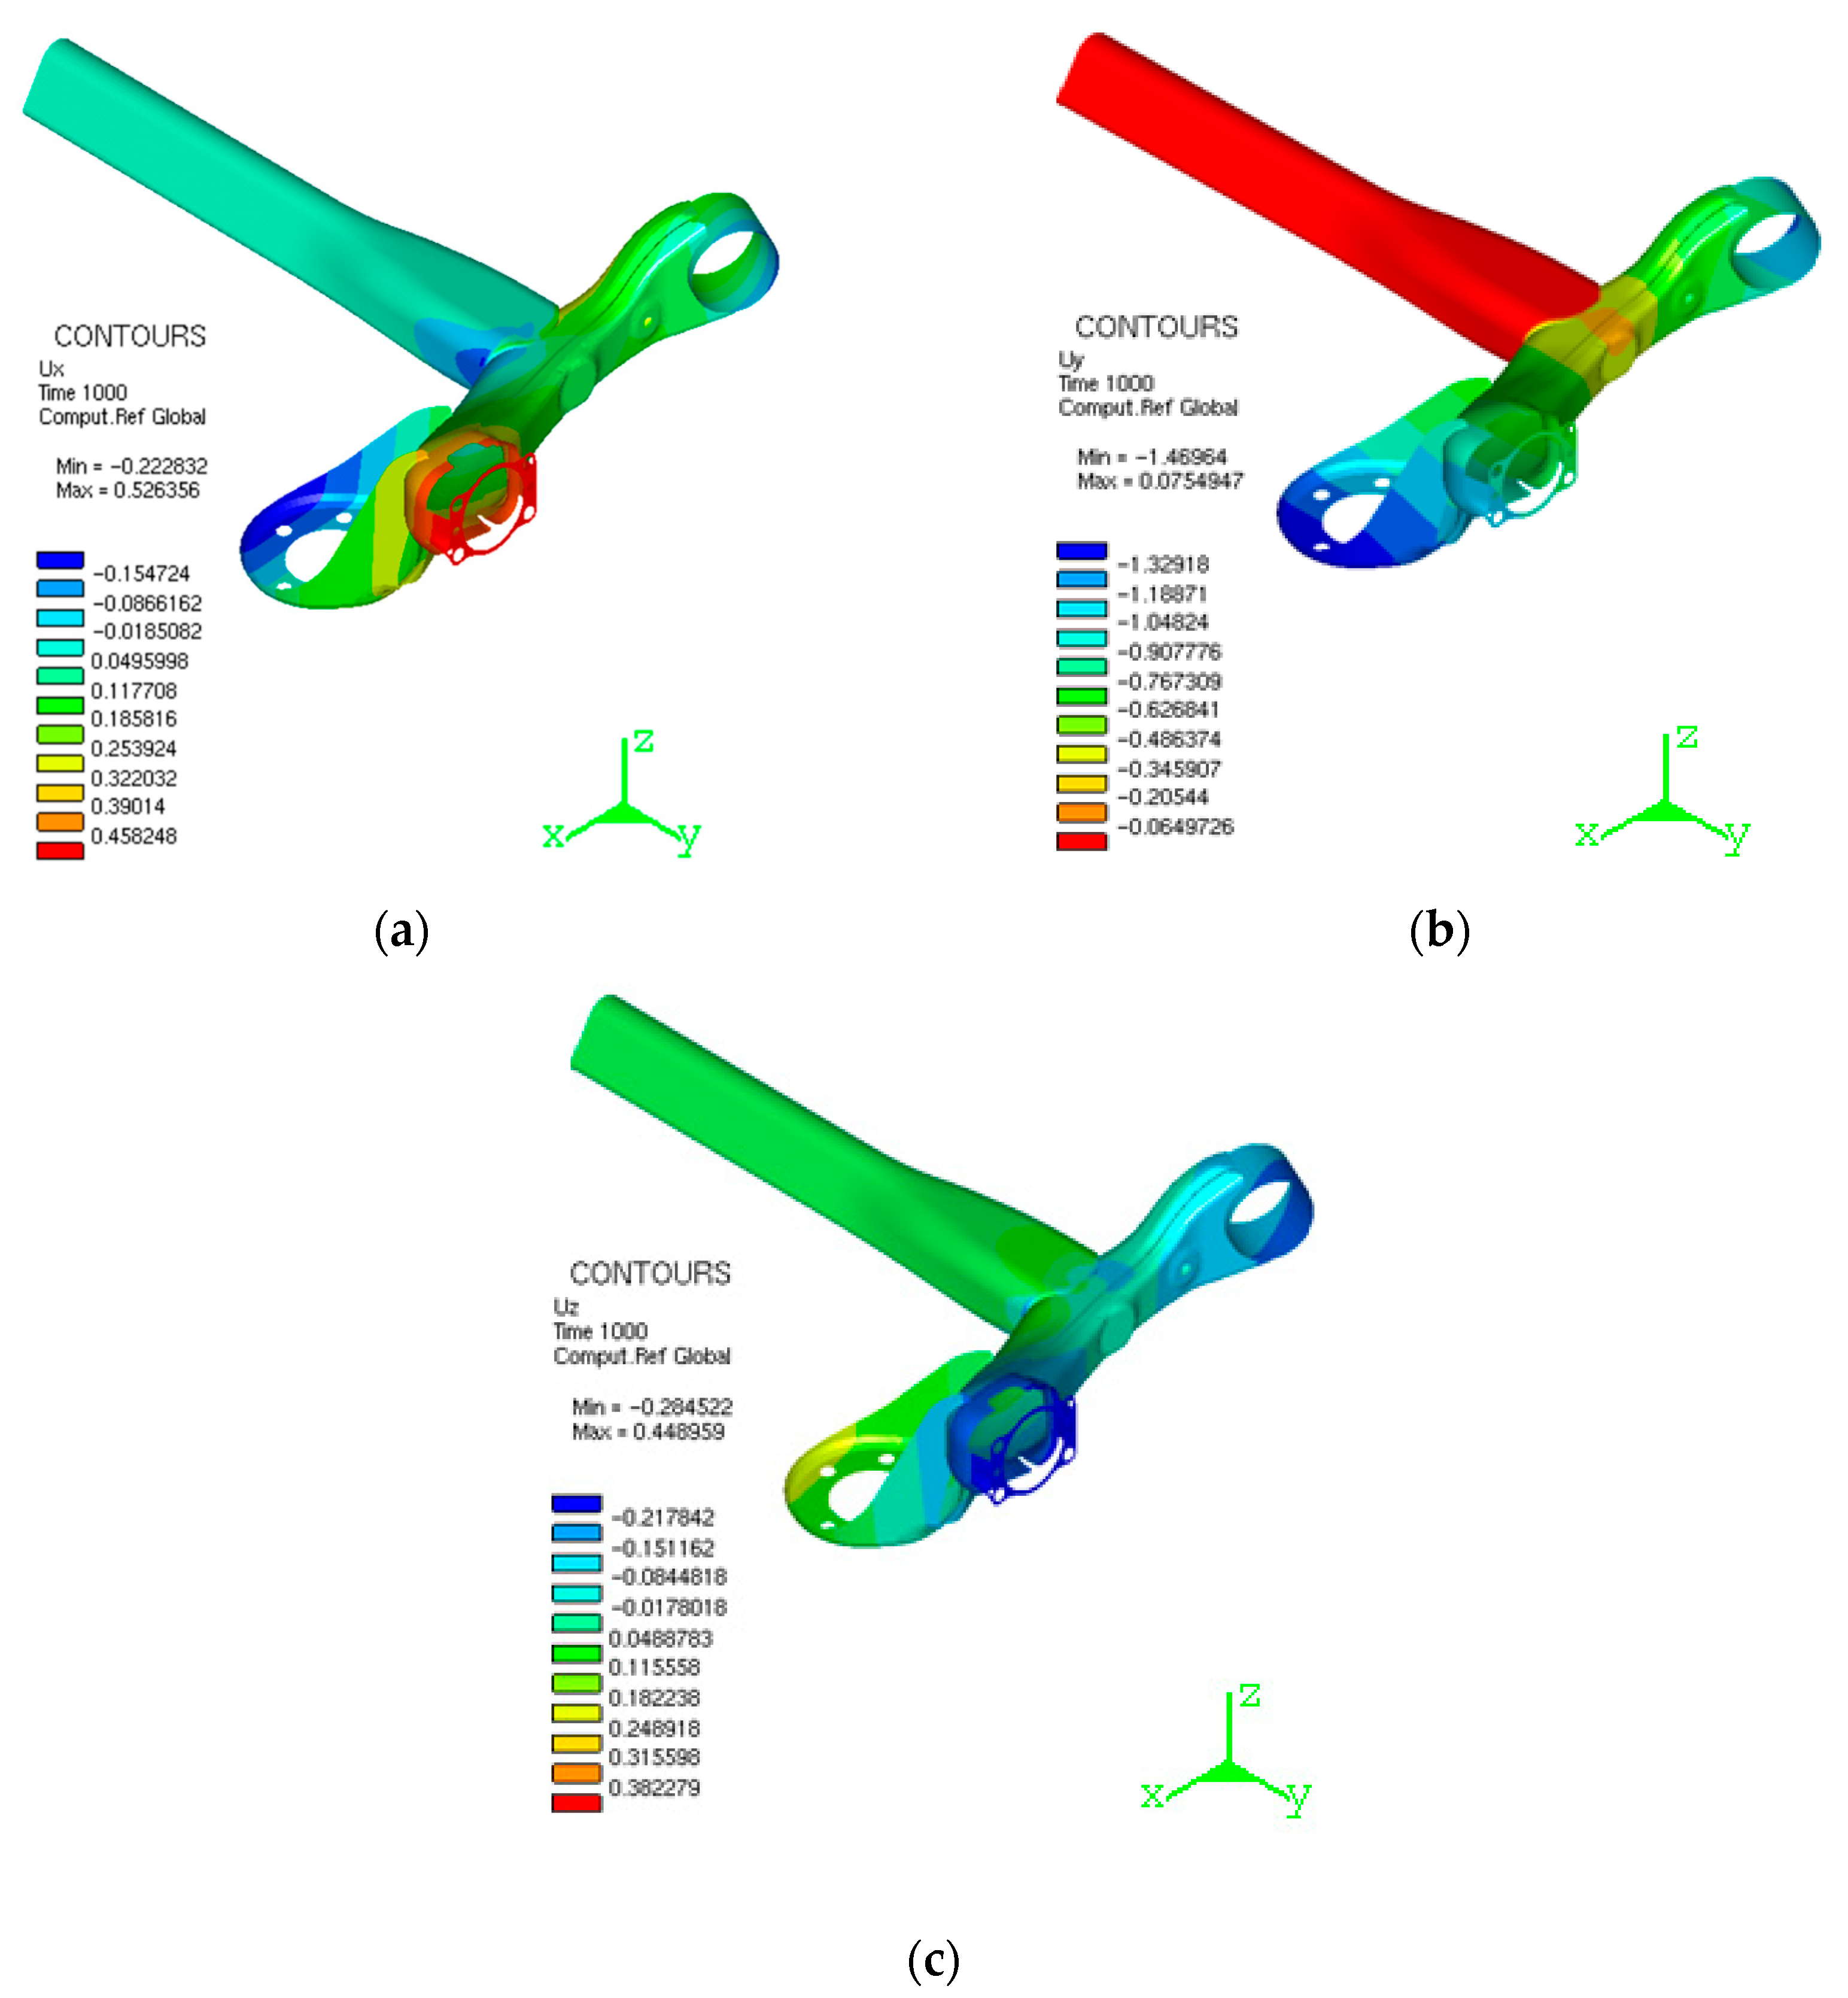
3.3. Thermal Deformation

As mentioned before, the welding process is accompanied by deformation due to the difference in the thermal strain and transformation due to the local heat generated during the heating and cooling cycles.
Figure 12a,b shows the thermal deformation at 40 s immediately post welding and 1000 s after dismantling the welding jig, respectively. As shown in Figure 12a, 40 s immediately after the welding process, the maximum thermal strain was 0.41 mm at the hub bearing connection, and the minimum thermal strain at the bush pipe connection was 0.04 mm. However, as shown in Figure 12b, 1000 s post-cooling, the maximum thermal deformation was 1.33 mm in the suspension spring-mounted part and the minimum thermal deformation was 0.13 mm in the middle of the trailing arm. The predicted deformation in the suspension spring-mounted part was within the maximum allowable thermal deformation amount in the actual production line.
Figure 13a–c also shows the amount of deformation in each direction (X, Y, Z) at 1000 s post-cooling. As shown in Figure 13, the amount of thermal deformation after the welding process was up to 0.53 mm at the C position in the X direction, −1.47 mm at the maximum at B in the Y direction, and up to 0.44 mm at C in the Z direction. The amount of thermal deformation increased along with the distance from the welding site.
Figure 14 shows the residual stress (Von mises stress) distribution after welding. In this figure, the residual stress is formed near HAZ due to its two welded parts. The stress remaining in the product is distributed between the maximum of 501 MPa and the minimum of 50 MPa 1000 s post welding. The residual stress can affect the deformation of the part after welding.
To confirm the effect of residual stress on the deformation of the part, the deformation contours are depicted in Figure 15. This figure compares the shape after thermal deformation during welding and the shape before the welding process (design shape) after 1000 s (i.e., corresponding to residual stress contour) have passed after the welding. Additionally, the solid line in Figure 15 shows the shape before the welding process. The deformation of part A connected to the bush pipe was 0.8 mm, and the deformation of part B connected to the hub bearing via the spindle bracket was 1.2 mm. As in the previous results, the greater the distance from the welding part, the greater the amount of thermal deformation due to welding.
If the deformation at the spindle bracket B position of the trailing arm is predicted through the finite element analysis of the welding process, the deformation generated in the welding must be post-processed and removed for coupling with the hub bearing. In this study, there must be no problem in securing the driving stability of the designed vehicle only after welding and removing the spindle bracket protruding 1.20 mm from the design shape after welding. In the actual production process, all welded CTBAs are inspected, and post-processing is usually performed to a diameter of about 1.5 mm.
At the manufacturing site of automobile parts, to reduce the number of machining man-hours in the manufacturing process and quality problems caused by machining errors, it is desirable to design a process that suppresses welding deformation within an allowable range, if possible. For this purpose, finite element analysis is meaningful in predicting the deformation in the welding process and to review the process design to reduce possible welding deformation.
In this study, we did not consider the effect of the deposition bodies considering the filler material deposition in the real welding process as discussed in [34], where each welding seam is sliced into several deposition bodies to predict the welding distortion realistically. This approach will be used in future studies.

4. Conclusions

In this study, the following conclusions were drawn by analyzing the welding deformation behavior during the welding process between the vehicle rear wheel chassis component CTBA and the trailing arm using SYSWELD, a finite element analysis program that considers the physical properties of the thermo-mechanical-metallurgical properties.
(1)
The welding process between the vehicle rear wheel chassis component CTBA and the trailing arm was simulated and analyzed using SYSWELD.
(2)
For the accurate analysis of the welding process, the thermo-mechanical-metallurgical properties of 22MnB5 were obtained using J-MatPro.
(3)
As a result of the finite element analysis, the welding site temperature immediately post welding was predicted to be a maximum of 840 °C and a minimum of 102 °C, while that after cooling for 1000 s was predicted to be a maximum of 24 °C and a minimum of 20 °C.
(4)
As a result of the finite element analysis, the martensite fraction of the welded region is a very small region where the maximum heat source near the welding start point is applied, but in most HAZ regions, the martensite tissue fraction is judged less than ~35%.
(5)
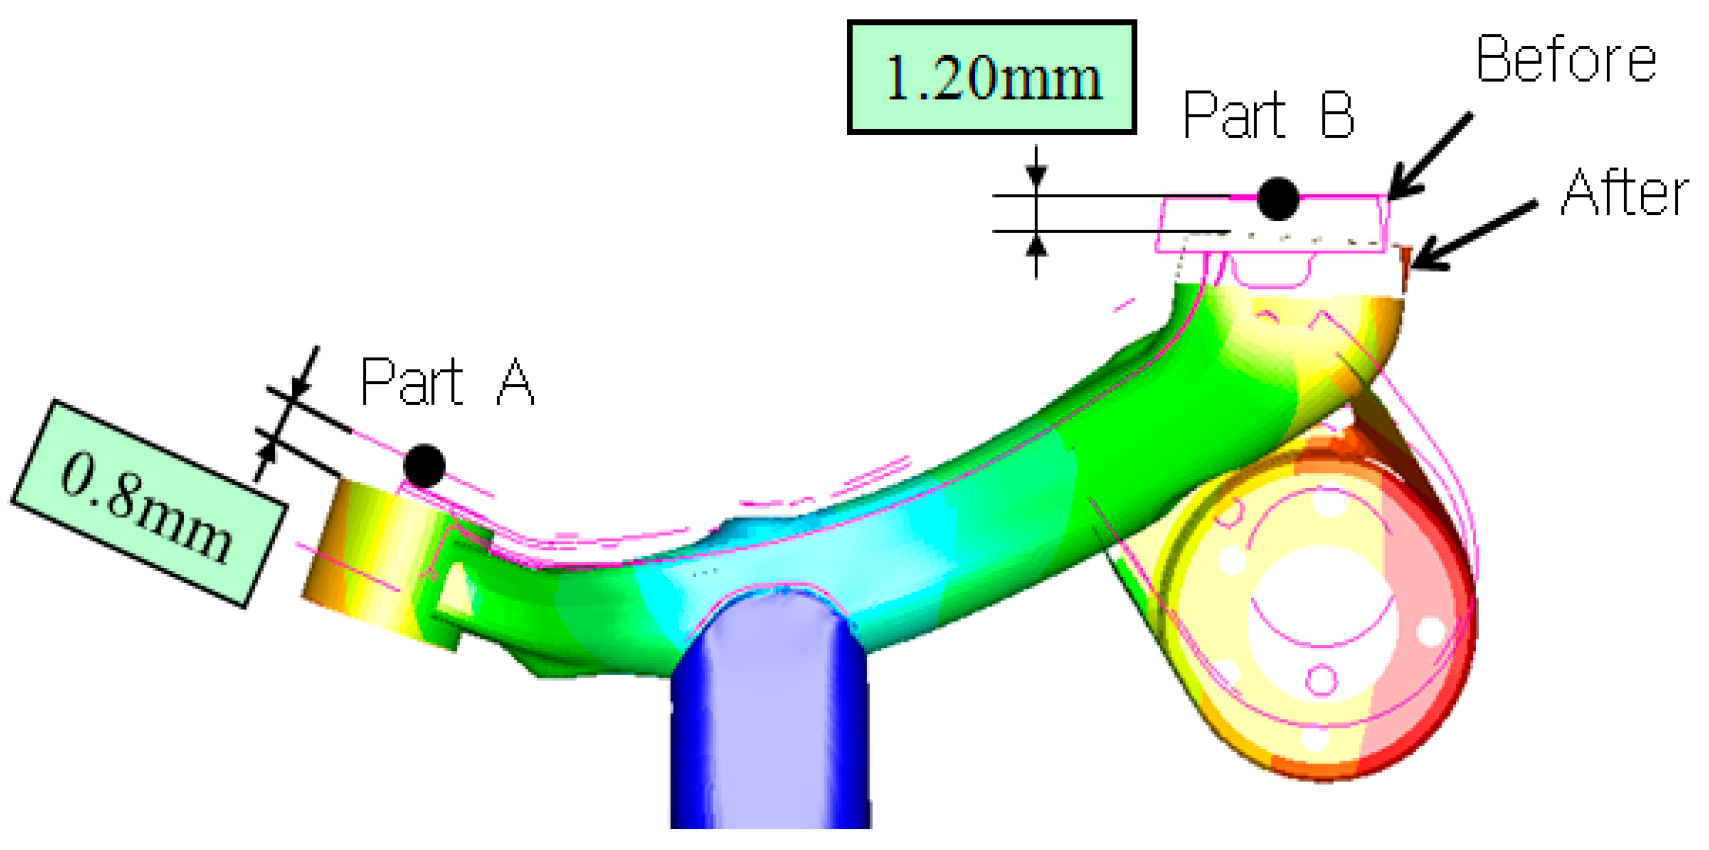
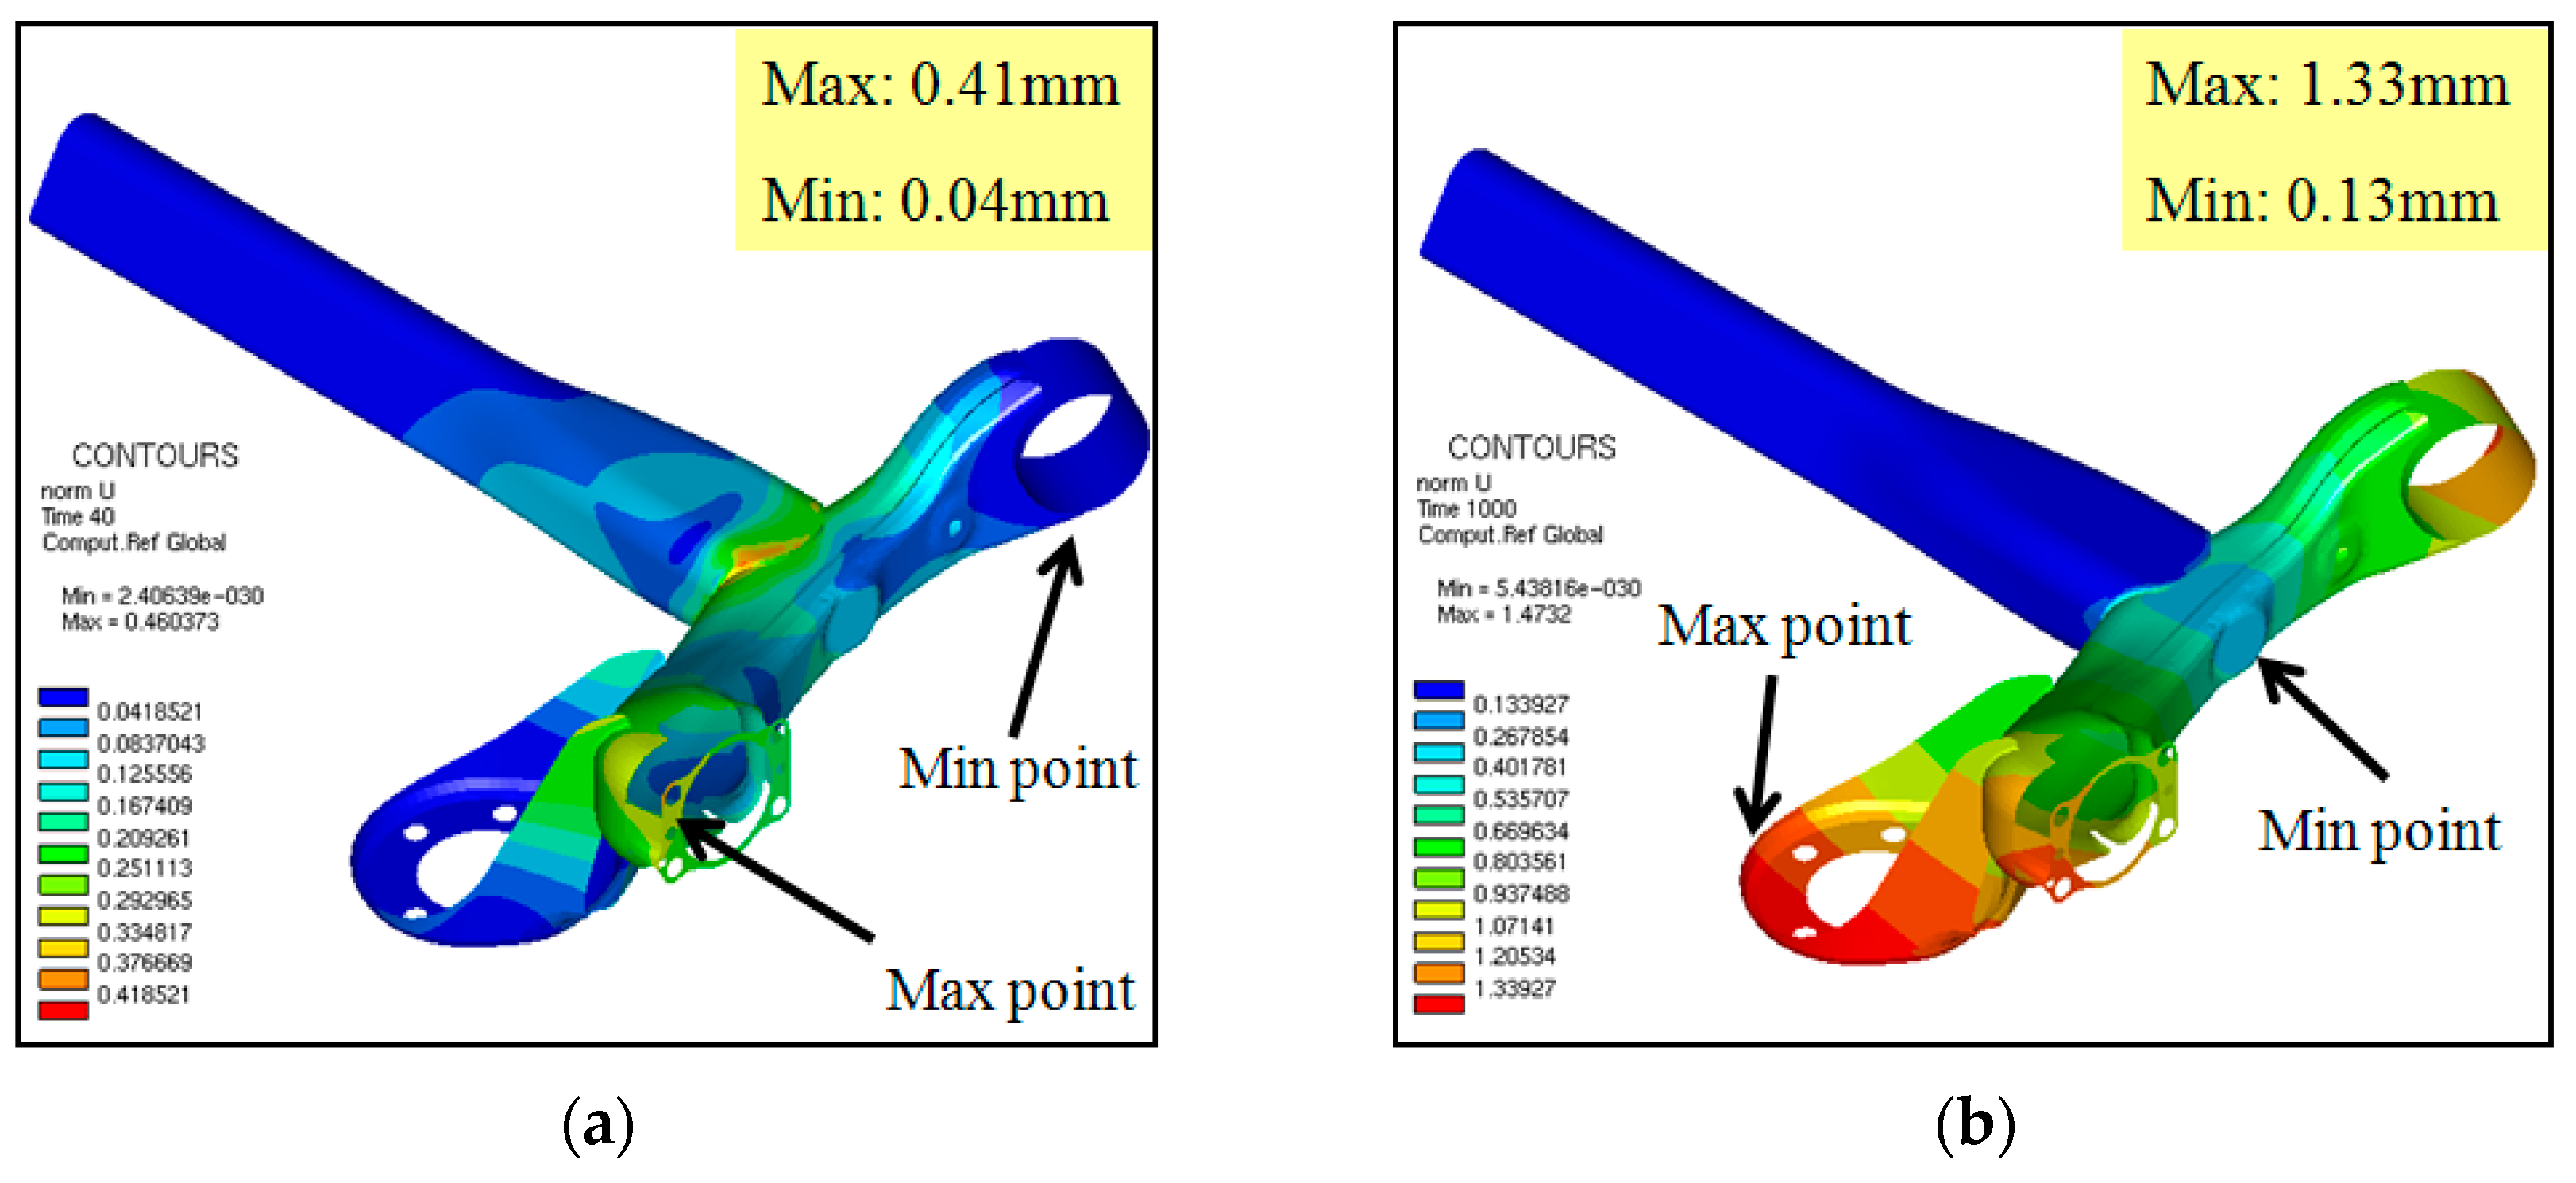
As a result of the finite element analysis, the maximum thermal deformation of the trailing arm was 1.33 mm with the minimum 0.13 mm, and by direction, the maximum was 0.52 mm in the X direction, 1.47 mm in the Y direction, and 0.44 mm in the Z direction.
(6)
The finite element analysis of the welding process in this study can be used to design the optimal welding process or welding schedule to reduce the welding deformation of the trailing arm combined with the hub bearing.
In this study, computational simulation analysis of the CTBA welding process was performed to identify thermal deformation and residual stress. However, the simulation result was not validated due to the absence of the experimental results. Moreover, to secure the accuracy of the analysis and its application value to industry, it is necessary not only to measure the temperature and hardness of the welded part and compare it with the results of this analysis, but also to compare it with many simplified analysis techniques that do not consider the phase transformation characteristics. We intend to leave this study as a follow-up study by the authors.

Author Contributions

Conceptualization, Y.-S.K. and M.B.; Methodology, M.B.; Software, M.B.; Validation, J.-J.K. and M.-P.H.; Writing—original draft preparation, J.-J.K.; Writing—review and editing, J.-J.K., M.-P.H. and Y.-S.K.; Supervision, Y.-S.K. All authors have read and agreed to the published version of the manuscript.

Funding

This work was supported by the Ministry of Education of the Republic of Korea and the National Research Foundation of Korea (NRF-2019R1A2C1011224) and the Brain Korea 21 (BK21) funded by the Ministry of Education, Korea (4199990314305).

Conflicts of Interest

The authors declare no conflict of interest.

References

  1. Springer, T.A.; Welch, A.J. Temperature control during laser vessel welding. Appl. Opt. 1993, 32, 517–525. [Google Scholar] [CrossRef]
  2. Wu, Q.; Gong, J.; Chen, G.; Xu, L. Research on laser welding of vehicle body. Opt. Laser Technol. 2008, 40, 420–426. [Google Scholar] [CrossRef]
  3. Costa, A.P.D.; Botelho, E.C.; Costa, M.L.; Narita, N.E.; Tarpani, J.R. A review of welding technologies for thermoplastic composites in aerospace applications. J. Aerosp. Technol. Manag. 2012, 4, 255–265. [Google Scholar] [CrossRef] [Green Version]
  4. Chaturvedi, M. (Ed.) Welding and Joining of Aerospace Materials; Woodhead Publishing: Sawston, UK, 2020. [Google Scholar]
  5. Mohamed, H.A.; Washburn, J. Mechanism of SOLID State Pressure Welding. Weld. J. 1975, 54, 302. [Google Scholar]
  6. Xie, L.S.; Hsieh, C. Clamping and welding sequence optimisation for minimising cycle time and assembly deformation. Int. J. Mater. Prod. Technol. 2002, 17, 389–399. [Google Scholar] [CrossRef]
  7. De Strycker, M.; Lava, P.; Van Paepegem, W.; Schueremans, L.; Debruyne, D. Measuring welding deformations with the digital image correlation technique. Weld. J. 2011, 90, 107S–112S. [Google Scholar]
  8. Adak, M.; Soares, C.G. Effects of different restraints on the weld-induced residual deformations and stresses in a steel plate. Int. J. Adv. Manuf. Technol. 2014, 71, 699–710. [Google Scholar] [CrossRef]
  9. Verhaegbe, G. Predictive Formulae for Weld Distortion—A Critical Review; Abington Publishing: Cambridge, UK, 1999. [Google Scholar]
  10. Zhang, J.; Yu, L.; Liu, Y.; Ma, Z.; Li, H.; Liu, C.; Li, Z. Analysis of the effect of tungsten inert gas welding sequences on residual stress and distortion of CFETR vacuum vessel using finite element simulations. Metals 2018, 8, 912. [Google Scholar] [CrossRef] [Green Version]
  11. Price, D.A.; Williams, S.W.; Wescott, A.; Harrison, C.J.C.; Rezai, A.; Steuwer, A.; Kocak, M. Distortion control in welding by mechanical tensioning. Sci. Technol. Weld. Join. 2007, 12, 620–633. [Google Scholar] [CrossRef]
  12. Tsai, C.L.; Park, S.C.; Cheng, W.T. Welding distortion of a thin-plate panel structure. Weld. J. 1999, 78, 156. [Google Scholar]
  13. Ueda, Y.; Yamakawa, T. Annalysis of thermal elastic-plastic stress and strain during welding by finite element method. Trans. Jpn. Weld. Soc. 1971, 2, 186–196. [Google Scholar]
  14. Michaleris, P.; Debiccari, A. Prediction of welding distortion. Weld. J. 1997, 76, 172–180. [Google Scholar]
  15. Deng, D.; Zhou, Y.; Bi, T.; Liu, X. Experimental and numerical investigations of welding distortion induced by CO2 gas arc welding in thin-plate bead-on joints. Mater. Des. 2013, 52, 720–729. [Google Scholar] [CrossRef]
  16. Wang, C.; Kim, Y.R.; Kim, J.W. Comparison of FE models to predict the welding distortion in T-joint gas metal arc welding process. Int. J. Precis. Eng. Manuf. 2014, 15, 1631–1637. [Google Scholar] [CrossRef]
  17. Wu, C.; Kim, J. Analysis of welding residual stress formation behavior during circumferential TIG welding of a pipe. Thin Walled Struct. 2018, 132, 421–430. [Google Scholar] [CrossRef]
  18. Liang, X.; Chen, Q.; Cheng, L.; Hayduke, D.; To, A.C. Modified inherent strain method for efficient prediction of residual deformation in direct metal laser sintered components. Comput. Mech. 2019, 64, 1719–1733. [Google Scholar] [CrossRef]
  19. Wang, J.; Rashed, S.; Murakawa, H. Mechanism investigation of welding induced buckling using inherent deformation method. Struct. Thin-Walled 2014, 80, 103–119. [Google Scholar] [CrossRef]
  20. Heo, J.; Li, Y.; Lee, J.H. Prediction of plate thermal deformation by multi-line heating using SDB method based on thermal strain. J. Weld. Join. 2019, 37, 40–45. [Google Scholar] [CrossRef]
  21. Zeng, Z.; Wu, X.; Yang, M.; Peng, B. Welding distortion prediction in 5A06 aluminum alloy complex structure via inherent strain method. Metals 2016, 6, 214. [Google Scholar] [CrossRef] [Green Version]
  22. Wu, C.; Kim, J.W. Review on mitigation of welding-induced distortion based on FEM analysis. J. Weld. Join. 2020, 38, 56–66. [Google Scholar] [CrossRef] [Green Version]
  23. Rong, Y.; Xu, J.; Huang, Y.; Zhang, G. Review on finite element analysis of welding deformation and residual stress. Sci. Technol. Weld. Join. 2018, 23, 198–208. [Google Scholar] [CrossRef]
  24. Yang, Y.S.; Kim, J.W. Analysis of Weldment by Using Finite Element Method (1)-(4). J. Korean Weld. Join. Soc. 2011, 29, 138–140. [Google Scholar]
  25. Goldak, J.; Chakravarti, A.; Bibby, M. A New Finite Element Model for Welding Heat Sources. Metall. Trans.-B 1984, 15B, 299–305. [Google Scholar] [CrossRef]
  26. Nguyen, N.T.; Ohta, A.; Matsuoka, K.; Suzuki, N.; Maeda, Y. Analytical solution of double-ellipsoidal moving heat source and its use for evaluation of residual stresses in bead-on plate. Int. J. Mech. Sci. 1999, 50, 513–521. [Google Scholar]
  27. ESI Group. SYSWELD v2004. Available online: https://www.esi-group.com/ (accessed on 21 December 2021).
  28. Bate, S.K.; Charlesa, R.; Warrena, A. Finite Element Analysis of a Single Bead-on-Plate Specimen using SYSWELD. Int. J. Press. Vessels Pip. 2009, 86, 73–78. [Google Scholar] [CrossRef]
  29. Jang, G.B.; Kim, H.K.; Kang, S.S. A Study on the Prediction and Control of Welding Deformation of the Bracket Tilt in Automotive Parts (I)—Experimental Examination. J. Korean Weld. Join. Soc. 1998, 16, 97–103. [Google Scholar]
  30. Jang, G.B.; Kim, H.K.; Kang, S.S. A Study on the Prediction and Control of Welding Deformation of the Bracket Tilt in Automotive Parts (II)—Application of FEA. J. Korean Weld. Join. Soc. 1998, 16, 104–112. [Google Scholar]
  31. Park, T.W.; Kim, K.J.; Han, C.P.; Kim, Y.S.; Lim, J.H. Deformation and Residual Stress of Automotive Frame by Welding. Trans. Korean Soc. Automot. Eng. 2011, 19, 113–117. [Google Scholar]
  32. Lee, S.H.; Kim, E.S.; Park, J.Y.; Choi, J. Numerical analysis of thermal deformation and residual stress in automotive muffler by MIG welding. J. Comput. Des. Eng. 2018, 5, 382–390. [Google Scholar] [CrossRef]
  33. JMatProTM v4.0. Available online: www.jmatpro.com (accessed on 21 December 2021).
  34. Granell, I.; Ramos, A.; Carnicero, A. A Geometry-Based Welding Distortion Prediction Tool. Materials 2021, 14, 4789. [Google Scholar] [CrossRef]
Figure 1. Coupled torsion beam axle (CTBA) in a car body.
Metals 12 00287 g001
Figure 2. The position of the welding jig.
Metals 12 00287 g002
Figure 3. FEM modeling of CTBA: (a) trailing arm and welding zone; (b) trailing arm after shell modeling.
Metals 12 00287 g003
Figure 4. Welding zone: (a) Welding zone and welding direction of CTBA with the trailing arm; (b) welding line (1D).
Metals 12 00287 g004
Figure 5. Boundary condition of the welding process: (a) isometric view; (b) front view.
Metals 12 00287 g005
Figure 6. Properties of welding: (a) overlapping welding; (b) heat source of MIG welding.
Metals 12 00287 g006
Figure 7. Thermo-physical properties of 22MnB5 predicted by J-MatPro. (a) TTT diagram of 22MnB5; (b) CCT diagram of 22MnB5. (c) Thermal conductivity coefficient of 22MnB5. (d) Yield stress of 22MnB5. (e) Young’s modulus of 22MnB5.
Metals 12 00287 g007aMetals 12 00287 g007b
Figure 8. Time–temperature graph at the welding start node in Heat Affect Zone (HAZ).
Metals 12 00287 g008
Figure 9. Temperature distribution after the welding process. (a) Temperature distribution after 40 s. (b) Temperature distribution after 1000 s.
Metals 12 00287 g009
Figure 10. Martensite distribution after the welding process at HAZ.
Metals 12 00287 g010
Figure 11. Microstructure in the weld starting point.
Metals 12 00287 g011
Figure 12. Distortion distribution after the welding process: (a) after 40 s; (b) after 1000 s.
Metals 12 00287 g012
Figure 13. Distortion distribution along each direction after 1000 s: (a) displacement in the x direction, UX; (b) displacement in the y direction, UY; (c) displacement in the x direction, UZ.
Metals 12 00287 g013
Figure 14. Residual stress distribution after 1000 s.
Metals 12 00287 g014
Figure 15. Distortion comparison before and after the welding process.
Metals 12 00287 g015
Table 1. Chemical composition of the 22MnB5 sheets.
CSiMnNiBMbCrV
0.200.191.380.010.00130.010.150.002
Table 2. Mechanical properties of the 22MnB5 sheets.
E (GPa)YS (MPa)TS (MPa)El (%)n-ValueR-Value
206.2481.262819.940.1530.805
Table 3. Chemical composition of the SAPH590 sheets (Max).
CSiMnNiBMbCrV
0.090.151.550.10.10.080.10.01
Table 4. Mechanical properties of the SAPH590 sheets.
E (GPa)YS (MPa)TS (MPa)El (%)n-ValueR-Value
206.253461222.80.1-
Table 5. Parameters of the welding process.
Welding MethodOverlapping Joint
Welding processMIG welding (Double ellipsoid)
Input energyU = 21.5 V, I = 235 A
Temperature of HAZ
(Heat affect zone)
867 °C (AC3)
Velocity of heat source50 cm/min = 8.3 mm/s
Cooling time1000 s
Publisher’s Note: MDPI stays neutral with regard to jurisdictional claims in published maps and institutional affiliations.

