Abstract
Solidification cracking is a major obstacle when joining dissimilar alloys using additive manufacturing. In this work, location-specific solidification cracking susceptibility has been investigated using an integrated computational materials engineering (ICME) approach for a graded alloy formed by mixing P91 steel and Inconel 740H superalloy. An alloy mixture of 26 wt.% P91 and 74 wt.% Inconel 740H, with high configurational and total entropy, was fabricated using wire arc additive manufacturing. Microstructure characterization revealed intergranular solidification cracks in the FCC matrix, which increased in length along with the enrichment of Nb (~27 to 56 wt.%) and Cu (~87 wt.%) in the middle and top regions. DICTRA simulations to model location-specific solidification cracking susceptibility showed that the top region with the highest cooling rate (270 K/s) has the highest solidification cracking susceptibility in comparison with the middle and bottom regions. This is in good agreement with the experimentally observed varying crack length. From Scheil simulations, it was deduced that enrichment of Nb and Cu affected the solidification range as high as ~77%, in comparison with the matrix composition. The overall solidification cracking susceptibility and freezing range was highest for the 26 wt.% P91 alloy amongst the mixed compositions between P91 steel and 740H superalloy, proving that solidification characteristics play a major role in alloy design for additive manufacturing.
1. Introduction
The high energy efficiency of steam power cycles in advanced ultra-supercritical power plants requires a steam temperature above 700 °C and a steam pressure up to 35 MPa. High steam pressure and temperature require the use of materials with excellent creep and high-temperature oxidation resistance. Conventionally used ferritic-martensitic steels, such as P91 steel, can only be employed up to 650 °C [1]. Hence, Ni-based superalloys, such as Inconel 740H (referred as 740H hereafter), were designed with high Co (~20 wt.%) and Cr (~24 wt.%) content to achieve superior creep properties up to 850 °C [2]. However, 740H is expensive compared to the traditional P91 steels due to the high content of alloying elements. Therefore, P91 steels can be employed in sections with operating temperatures below 650 °C, while Inconel 740H can be utilized for parts operating at a higher temperature, especially, for repairing and multifunctional purposes. This strategy involves joining P91 steel with 740H, which is challenging because these materials possess strikingly different crystal structures and properties. This necessitates using an interlayer for joining these dissimilar materials which possesses intermediate properties to ensure a smooth transition between the parent materials.
It is well known that in the high-entropy alloy composition range, there is a high chance that entropy contributions can overcome the enthalpies of compound formation, and hence avoid the formation of harmful intermetallic compounds [3]. For achieving improved creep properties, the formation of detrimental phases, such as the topologically close-packed (TCP) phases, needs to be suppressed. Alloys with multiple principal elements, rather than a single principle element, exhibit the high-entropy effect by stabilizing a solid solution phase over the formation of intermetallic compounds [4,5,6]. The simple microstructure of multi-principal element alloys makes them an attractive candidate material for achieving superior elevated temperature properties. Therefore, exploring interlayer materials with high configurational and total entropy will be suitable for joining P91 steel and 740H superalloy in ultra-supercritical power plants.
Additive manufacturing (AM) is an advanced manufacturing technique that can fabricate structural parts layer by layer using 3-dimensional models [7]. It is a promising alternative for joining dissimilar materials using an interlayer or gradual composition gradient. Directed energy deposition (DED) has been extensively used for multi-material deposition [8,9,10]. Wire arc additive manufacturing (WAAM) is a cost-effective DED-based technique that uses welding wire as a starting material. The deposition rate of WAAM is much higher, enabling the efficient fabrication of large components. Some of the crucial parameters such as torch tilt, bead size and geometry, external magnetic field, and microstructural evolution have been evaluated using physics-based models as well as key experiments to improve the WAAM process in comparison with other conventional manufacturing techniques, such as machining [11,12,13,14,15]. The ability to fabricate large builds is beneficial for real world applications, but special attention must be given to changes in the thermal history that can lead to location-specific changes in material behavior and properties. Changes in thermal history can lead to significant changes in the as-built microstructure, residual stress, and solidification cracking susceptibility [16,17,18].
Solidification cracking is a common defect observed in additively manufactured parts that limits its applicability. Solidification cracks are caused by the trapping of interdendritic liquid. When liquid becomes trapped, differences in the solid and liquid density lead to shrinkage inside the mushy zone [19]. Since the grains are not firmly held together, due the presence of grain boundary liquid, the strength of the mushy zone is low. Moreover, the liquid phase fraction is not high enough towards the end of the solidification to accommodate large tensile strains and the rearrangement of grains [19]. The capability of liquid metal to fill the interdendritic region plays an important role in determining the solidification cracking susceptibility. The main factors that need to be accounted for when assessing the solidification cracking susceptibility are the freezing range, amount and distribution of liquid at the end of solidification, primary solidification phase, and grain structure [20].
Several models are available in the literature for predicting the solidification cracking susceptibility of an alloy as a function of composition [21,22,23,24,25,26,27]. In particular, the Kou model [19,28] provides a comprehensive approach for assessing the solidification cracking susceptibility for fusion welds. Such a solidification cracking model can determine the risk of solidification cracking. The Kou model relates the solidification gradient to the solidification cracking susceptibility of a material. In particular, it can directly link to the Scheil-Gulliver model [29], which is commonly used to predict the solidification gradient. Recently, the DICTRA (diffusion-controlled transformations) package within Thermo-Calc software has been used to model the solidification gradient by considering the effects of thermal history and kinetics [17]. Though, there are similarities between welding and AM, the Kou model has not been used extensively to evaluate the solidification cracking susceptibility for AM processes. There are only a few reports that evaluate the solidification cracking susceptibility for alloys processed using AM [17,30,31,32,33]. So far, to the best of our knowledge, there are no reports evaluating the location-specific solidification cracking susceptibility of additively manufactured alloys.
In this work, the location-specific solidification cracking susceptibility has been evaluated for a mixed alloy with high calculated configurational and total entropy, that can potentially act as an interlayer for joining P91 steel and 740H superalloy. The mixed alloy was fabricated using WAAM and the difference in cracking behavior at various locations along the build direction has been correlated with the solidification cracking susceptibility deduced by applying the Kou model criterion. The extent of microsegregation in different locations and its effect on the solidification range has also been investigated. This work is aimed at providing a pathway to assess the feasibility of fabricating new alloys designed using the ICME (integrated computational materials engineering) approach for AM processes. Moreover, it demonstrates how an ICME-based framework can be employed to determine the location-specific solidification cracking behavior and can be correlated with experimental observations. The main aim of this work is to establish that apart from the prediction of thermodynamic properties and microstructure, the solidification behavior also needs to be taken into account to obtain crack-free builds successfully. In addition to that, some of the possible shortcomings that could lead to cracking are explored; these will have to be carefully evaluated for the fabrication of new alloys using AM.
2. Materials and Methods
With the aim of identifying an alloy with the highest entropy amongst the mixed compositions between P91 steel and 740H superalloy, to act as an interlayer for joining the constituent materials, the total entropy for each alloy was calculated using the CALPHAD (Calculation of Phase Diagrams) approach as implemented in Thermo-Calc software. Additionally, the configurational entropy was determined for these compositions using the well-known Boltzmann equation, as follows:
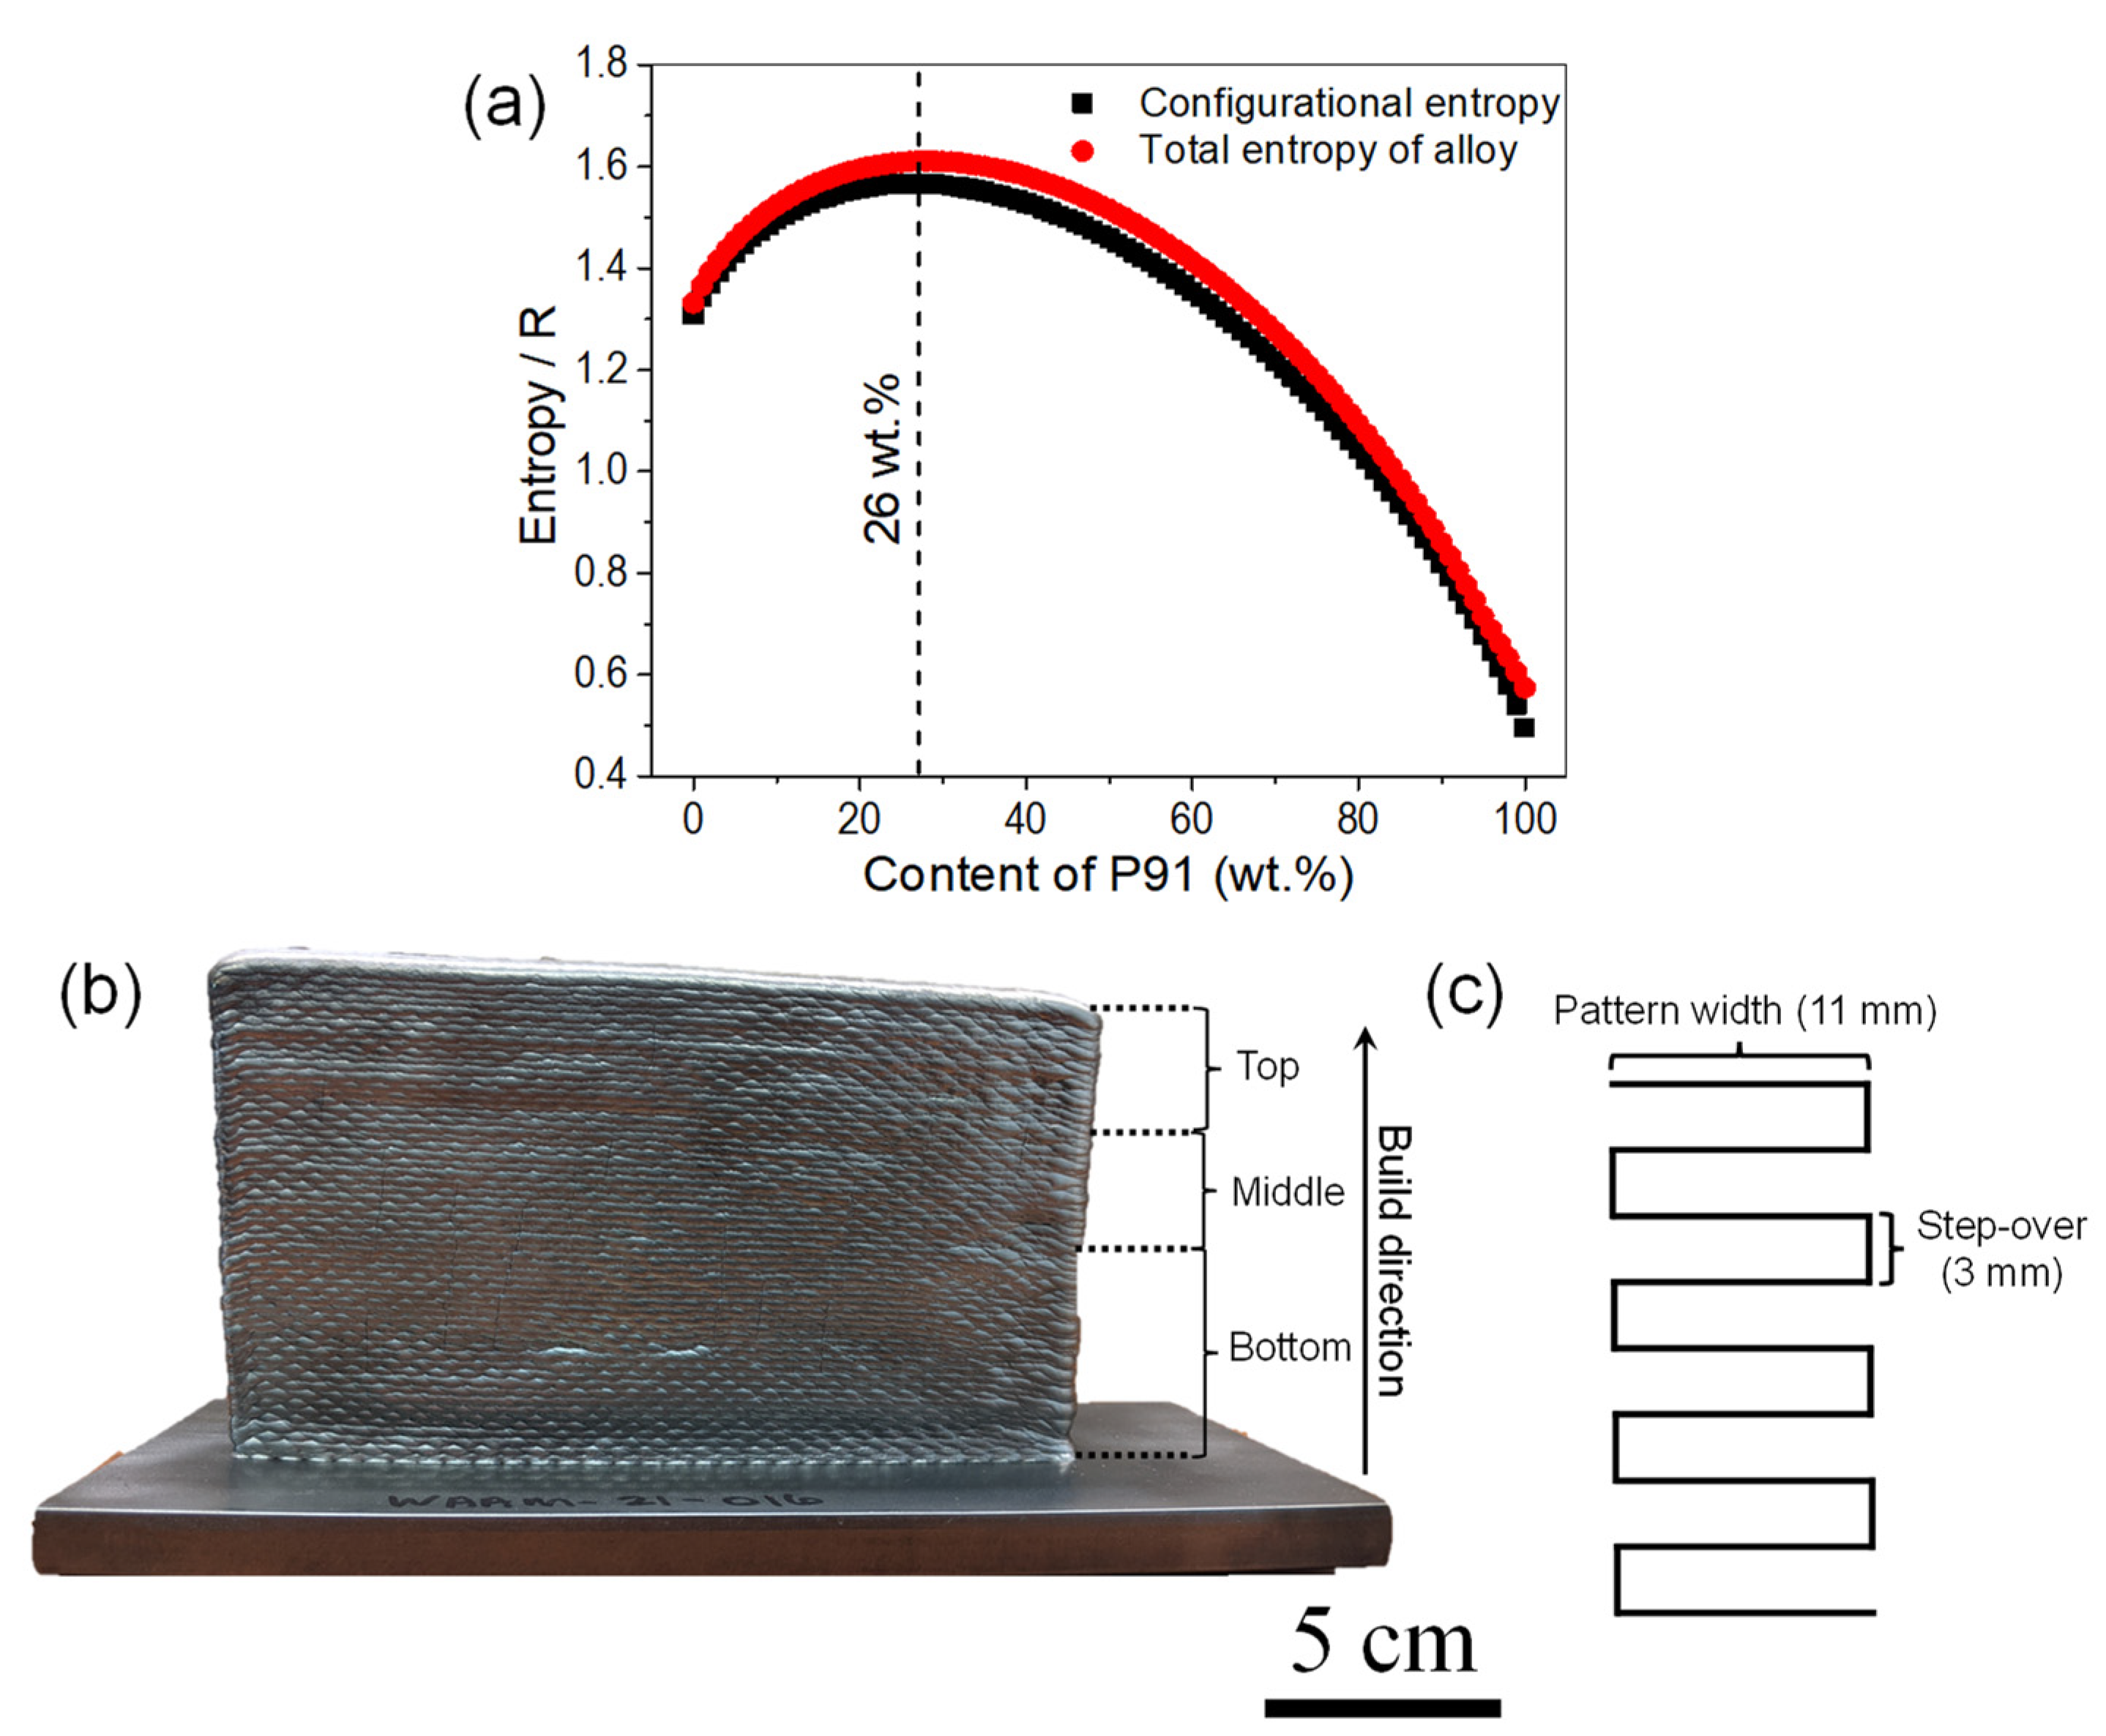
where x is the composition of component i in mole fraction, and n is the total number of elements in the alloy system. The mixed compositions between P91 steel and 740H superalloy were determined by computing the weighted mean of the composition of each element for varying content of P91 steel (in steps of 1 wt.%) and used as input for these calculations. The composition of the P91 and 740H wires (listed in Table 1) used for the WAAM processing were used to find the weighted average. From the calculated entropy values for the mixed compositions, shown in Figure 1a, it can be observed that the configurational entropy, as well as the total entropy, reaches a maximum at 26 wt.% P91; hence, this composition was chosen for fabrication using WAAM.

Table 1.
Composition (in wt.%) of the P91 and 740H wires used for deposition in the WAAM process and the nominal composition (in wt.%) of 26 wt.% P91 alloy.
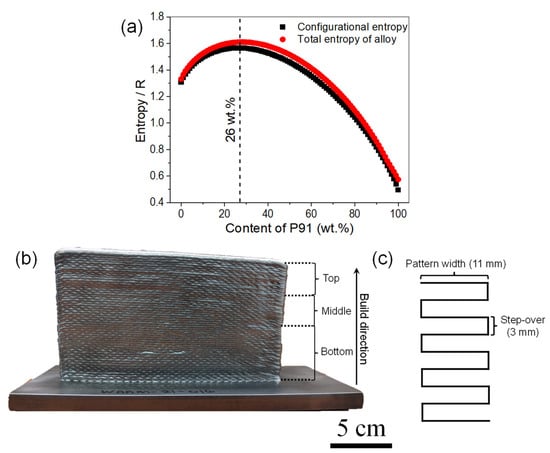
Figure 1.
(a) Configurational and total entropy calculated for the mixed compositions of P91 steel and 740H superalloy showing a maximum at 26 wt.% P91, (b) 26 wt.% P91 build and (c) the printing pattern used for each layer during fabrication of the build using WAAM.
P91 steel (ER90S-B91, manufactured by Euroweld Ltd., Mooresville, NC, USA) and 740H superalloy (Special Metals Welding Products Co., Newton, NC, USA) wires with compositions (specified by vendor) listed in Table 1 were employed for the deposition of the 26 wt.% P91 alloy using WAAM. The diameter of the P91 steel and 740H superalloy wires were 0.9 and 1 mm, respectively. A sample of 180 mm length, 11 mm width, and 100 mm height were built over a mild steel (Fe-0.165C-0.6Mn-0.225Si, wt.%) substrate of nearly 13 mm thickness using a WAAM system (ABB robotic platform) with a plasma torch in the Raytheon Technologies Research Center (RTRC), as shown in Figure 1b. A plasma arc welding (PAW) torch and a twin wire feeder connected to a six-axis robot were the major components of the WAAM setup. The printing parameters were selected based on an earlier design of experiments used while depositing the constituent materials, namely, P91 steel and Inconel 740H superalloy. A range of conditions were deposited with different travel speeds, wire feeds, and power, until a stable melt pool was achieved based on observations and microscopy. The process parameters were selected, keeping in mind that the same conditions needed to be used for the deposition of P91 steel and the Inconel 740H superalloy, to allow for smooth transitioning between the components while attempting for multi-material builds using WAAM.
For plasma production and the shielding of the PAW torch, purified Argon gas was used with a flow rate of 1.2 L/min. Each layer was deposited in a square wave pattern with a width of 11 mm and step-over (spacing) of 3 mm (Figure 1c), while the overall mass deposition rate was 0.9 kg/hr. The distance between the torch and deposit was 12 mm and the wire was fed at an angle of 30°. In order to reach the nominal composition listed in Table 1 for 26 wt.% P91 alloy, the wire feed rate was maintained as 0.82 m/min for P91 steel, and 1.8 m/min for the 740H superalloy. The average voltage was 20.9 V, while the current and travel speed were varied for different layers, as summarized in Table 2. The current and travel speed were automated using the robotic motion platform whose values are prescribed by the operator for each layer. High current and low travel speed was employed for the first few layers to ensure complete adhesion with the mild steel substrate, and further reduced gradually for the subsequent layers. The interpass temperature was maintained as 175 °C, i.e., each layer was cooled till 175 °C before the deposition of the subsequent layer to reduce dilution between the layers, affecting the height of the build. An infrared (IR) pyrometer was used to monitor the interpass temperature during the deposition. It is to be noted that the melt pool temperature was not monitored. The temperature of the melt pool was too high to be detected using the IR camera, and the camera was blinded by the plasma arc used for deposition in the WAAM process. After each layer was deposited, the IR camera was used to monitor the temperature of the bulk part, so as to ensure that the sample was below 175 °C before beginning to deposit the subsequent layer. The interpass time for each layer was not fixed, but rather dictated by the time it took for the bulk of the sample to cool to below 175 °C.
Table 2.
Printing parameters for 26 wt.% P91 build fabricated using WAAM.
The build (Figure 1b) fabricated using the WAAM technique was sectioned along the XZ plane (X is the scan direction and Z is the build direction) with electric discharge machining (EDM, Mitsubishi MV2400S, Mitsubishi Electric Corporation, Tokyo, Japan). This slice of sample was used for further location-specific analysis, and the sample was partitioned as top, middle and bottom, as indicated in Figure 1b, for ease of identification. The sample was ground from 800 to 1200 grit SiC emery papers and further polished using diamond (3 and 1 μm particle size) and colloidal silica (0.04 μm particle size) suspensions to obtain a scratch-free surface with a mirror finish. The cracks at different locations along the build direction were viewed in the as-polished surface using a ZEISS Sigma 500 VP scanning electron microscope (SEM, Carl ZEISS, Dresden, Germany) in both secondary electron (SE) and backscattered electron (BSE) modes. The composition maps were determined using Oxford Aztec energy dispersive spectroscope (EDS, Oxford Instruments, Abingdon, UK) attached to the SEM. To determine the nature of the cracks, electron backscattered diffraction (EBSD) was carried out using FEI Scios Dual Beam focused ion beam (FIB)–SEM equipped with the EDAX Hickory EBSD system and analyzed using TSL-OIM software version 8.
To evaluate the location-specific solidification cracking susceptibility, non-equilibrium simulations using DICTRA and Scheil modules were performed using the Thermo-Calc software (version 2021b, Thermo-Calc Software AB, Solna, Sweden). The TC-API (Thermo-Calc Application Programming Interface) toolkit known as TC-Python (based on Python programming language) was mainly used for these simulations to enable batch calculations. TCNI (v8), which is the commercial multicomponent thermodynamic database, and MOBNI (v4), the multicomponent mobility database, were used for the simulations. In the Scheil modeling, the back diffusion due to carbon was taken into account [29]. The input compositions were obtained using EDS at various points around the cracks from different locations, and the Scheil simulations were performed for 75 different points to determine the effect of segregation on the solidification range (temperature difference between liquidus and solidus).
The solidification cracking susceptibility was evaluated using the Kou criterion [19], coupled with one-dimensional DICTRA simulations. The input parameters required for the DICTRA simulations, i.e., the cell size and cooling rate from each section of the build, as shown in Figure 1b, were obtained by observing the microstructure under the SEM in SE mode. The samples used for SEM were etched by immersion in a solution consisting of 4.8 g of CuCl2, 4 mL of water, and 48 mL of HCl for nearly 25 s. The secondary dendrite arm spacing (SDAS) was measured from the SEM micrographs using the ImageJ software. The cell size for the DICTRA simulation for the top, middle and bottom regions was considered as half the SDAS size. In order to determine the location-specific cracking susceptibility, the cooling rate in different regions needed to be identified. Therefore, the cooling rate was determined from the SDAS using the following relation determined for Inconel 625 by Tinoco et al. [34]:
where λ is the SDAS, and R is the cooling rate. The cooling rate from different regions determined using Equation (2) was incorporated, and a linear grid with 100 points was used for these simulations. The solid fraction calculated as a function of temperature from the DICTRA simulations was used for determining the solidification cracking susceptibility using the Kou criterion by finding the maximum in the slope of the temperature vs. the square root of the solid fraction curve [28]. For computing the derivative to determine the slope, a three-point central Lagrange polynomial differentiation similar to the method reported by Sargent et al. was used [17].
3. Results
3.1. Characterization of Cracks
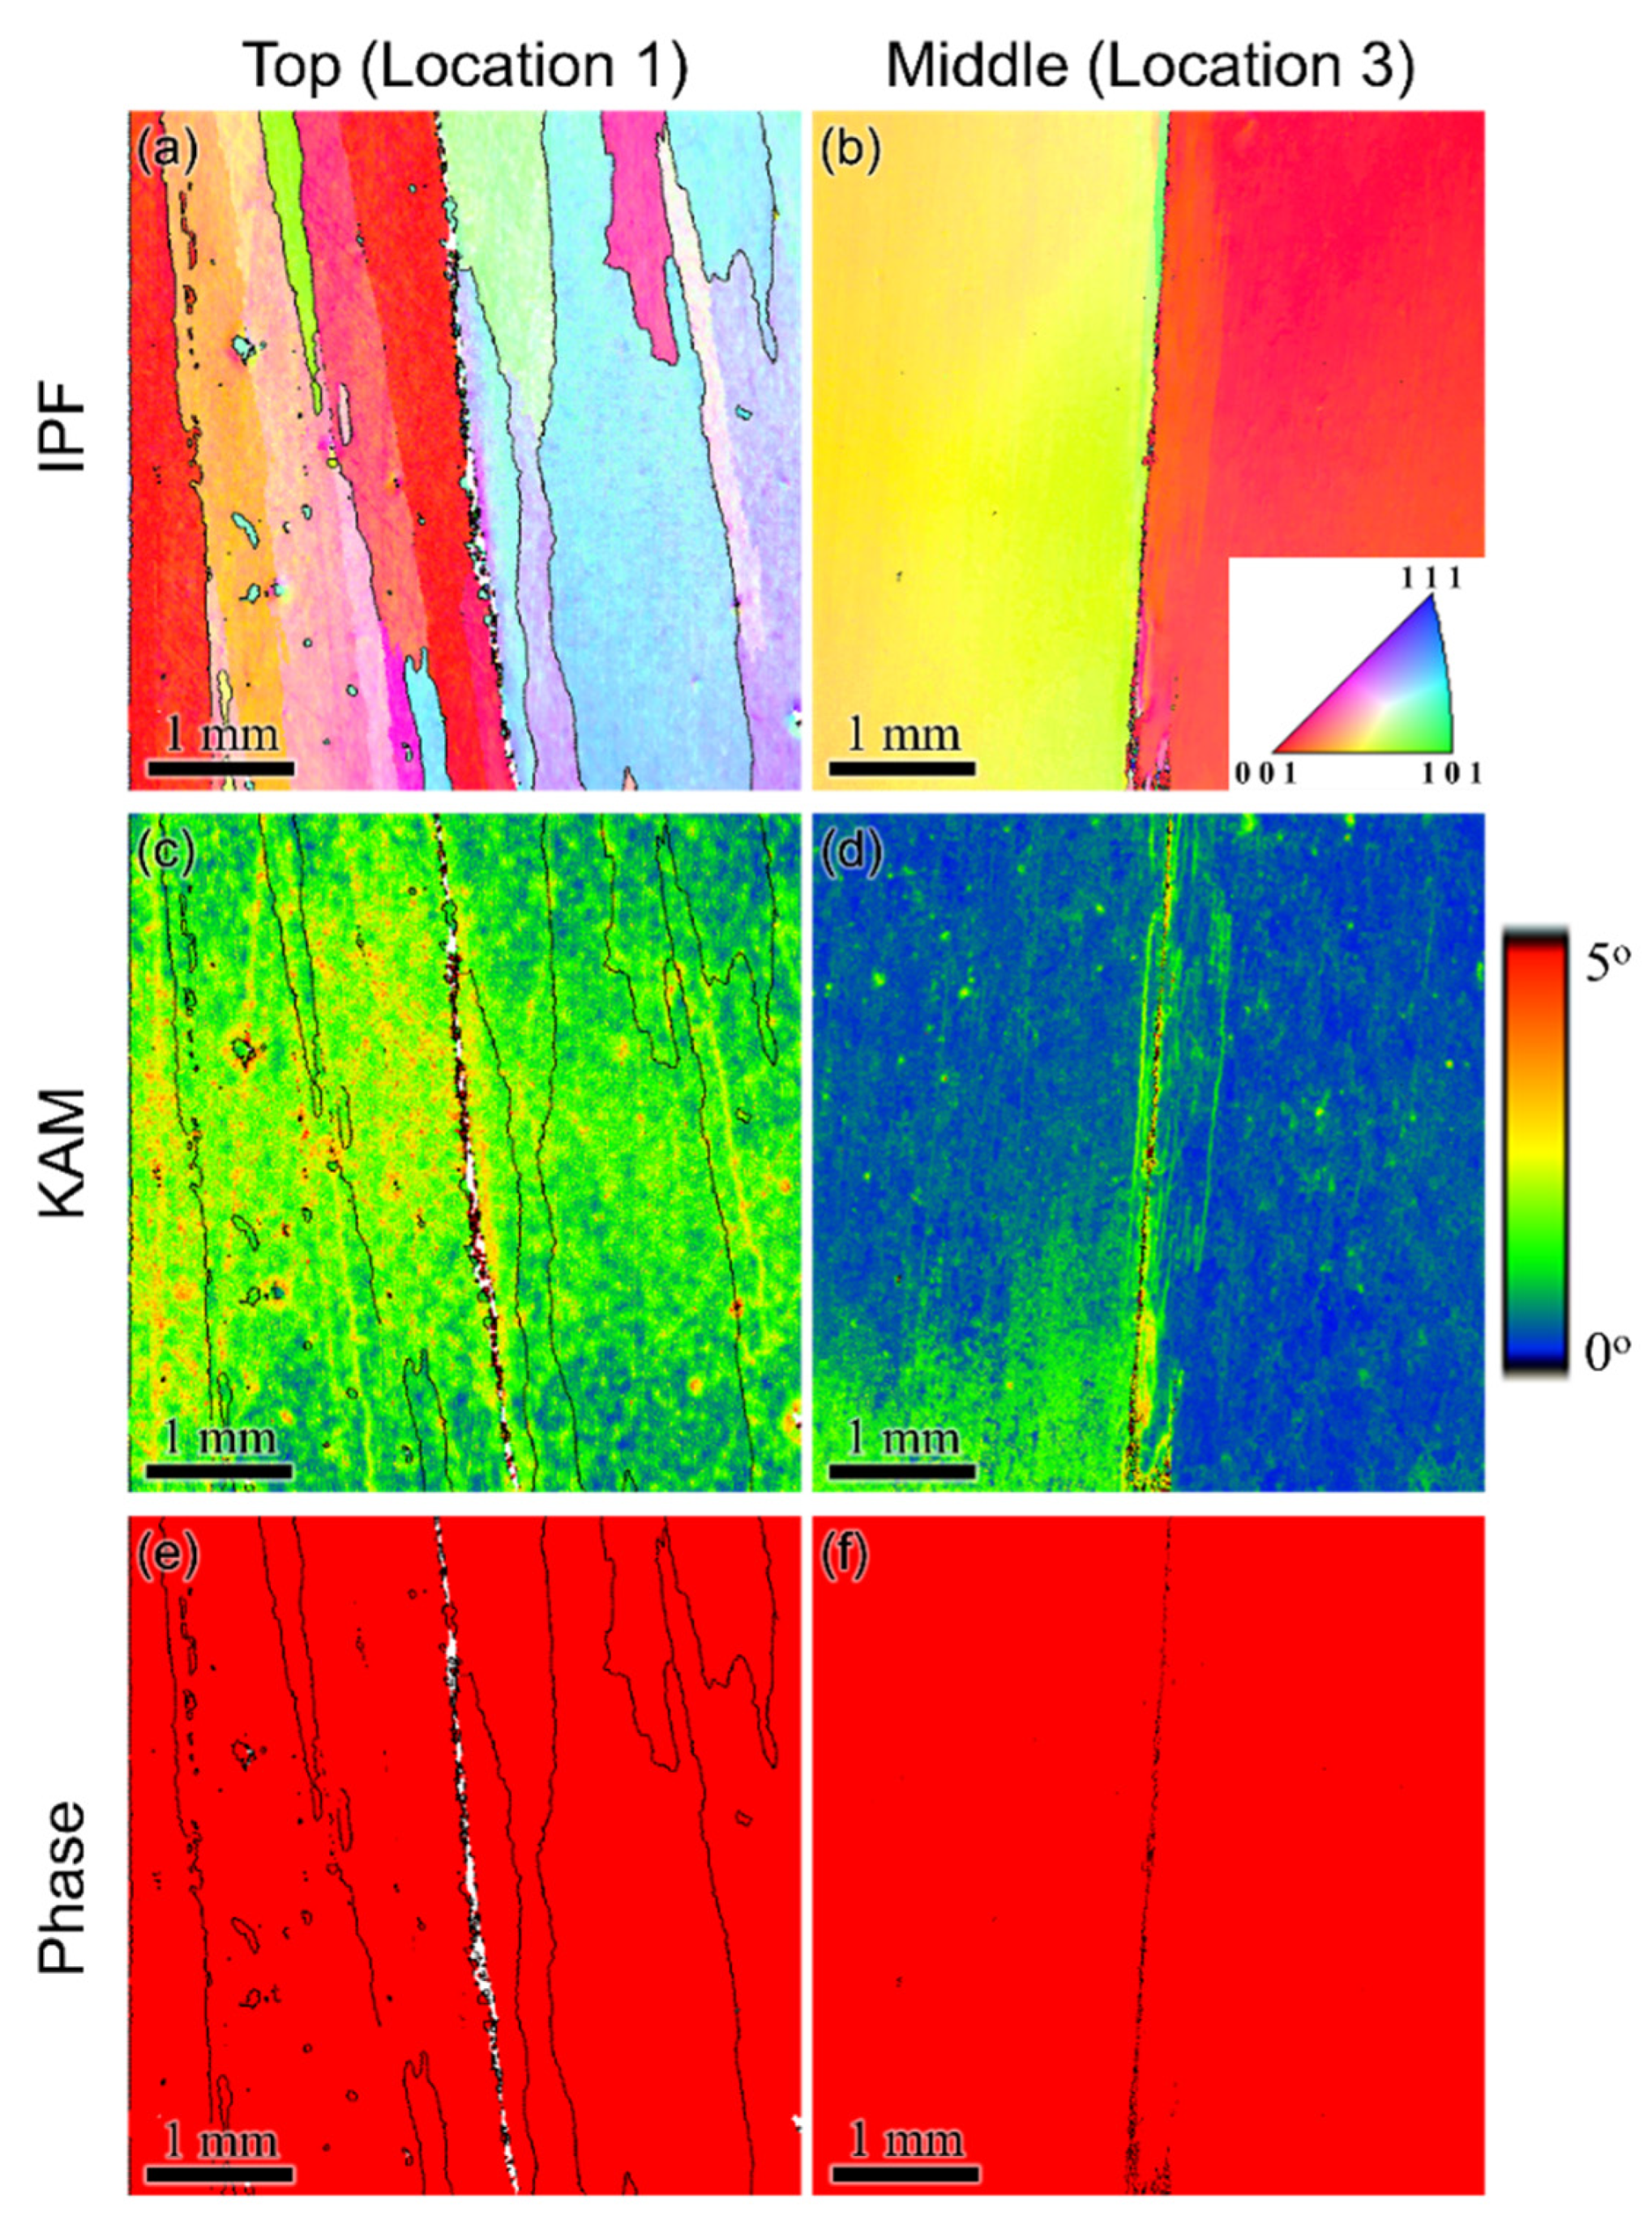
Figure 2 shows the SE-SEM micrographs of the cracks of varying lengths from different locations of the sample. It can be observed that the longest cracks were observed in the top portion of the sample and the crack length decreased in the middle region. No cracks were observed in the bottom region of the sample. It is to be noted that cracking was observed only after deposition of the first 15 layers during the WAAM processing, although, in total, there were 58 layers to accomplish the build. The inverse pole figure (IPF), kernel average misorientation (KAM) and phase maps obtained from the cracked region in the top and middle portions of the sample using EBSD are shown in Figure 3. It is evident from the IPF map that the grain structure was columnar, and the crack was intergranular since it propagated along the grain boundary. Moreover, the grains were coarser in the middle portion, since it underwent multiple thermal cycling during the deposition, in comparison with the top section of the sample. KAM qualitatively represents the residual stresses and is defined as the average misorientation around a point corresponding to a defined set of nearest neighbors [35,36]. Therefore, we applied it to gain further insight into the crack formation at locations 1 and 2. From the KAM maps (Figure 3c,d), it can be observed that the region around the crack had a very high misorientation angle (red points with KAM ~5° and the yellow regions with KAM ~3–4° surrounding the crack) in comparison with the surrounding matrix, implying that the residual stresses were high near the cracked region. It was also evident that the grains in the top portion of the sample had higher KAM (green regions with KAM ~2–3°) within the grains, in comparison with the middle portions (blue regions with KAM ~0°) within the grains. This is because the middle portion underwent a larger number of heating and cooling cycles that annihilated the residual stresses, while the top layers were subjected to lesser thermal cycling leading to higher residual stress within the grains. From the phase maps (Figure 3e,f), it is evident that the 26 wt.% P91 alloy has a single-phase FCC structure.
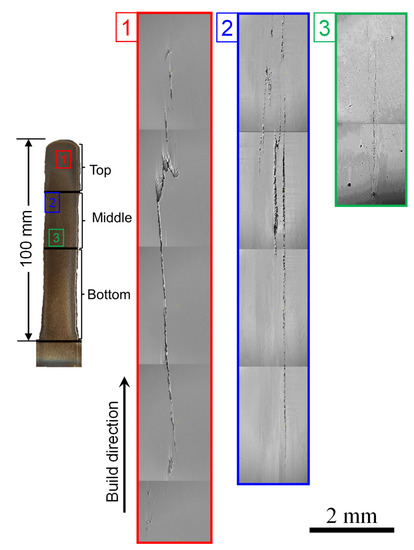
Figure 2.
SE-SEM micrographs showing cracks of varying length from different locations of the 26 wt.% P91 sample along the build direction.

Figure 3.
(a,b) IPF, (c,d) KAM and (e,f) phase maps from Locations 1 and 3 (shown in Figure 2) from the top and middle sections, respectively, showing that the cracks are intergranular with high KAM around the crack.
Figure 4 and Figure 5 show the composition maps for the major (Ni, Fe, Cr, and Co) and minor (Cu, Mo, Nb, and Ti) alloying elements from the cracked regions in the top and middle sections of the sample, respectively. The composition maps for Cu and Nb clearly show that the extent of segregation varied in different sample locations. The Cu segregation was higher in the top portion of the sample, but lower in the middle portion. Thus, it is clear that the extent of Cu segregation increased as the build height increased. On the other hand, Nb segregation was found to be more pronounced in the middle section, but to a lesser extent in the top portion of the sample. Therefore, it can be inferred that the difference in the length of the cracks and extent of segregation of the minor alloying elements, such as Cu and Nb, will lead to varying solidification cracking susceptibility along the build direction, which will be estimated using computational techniques, and explained further.
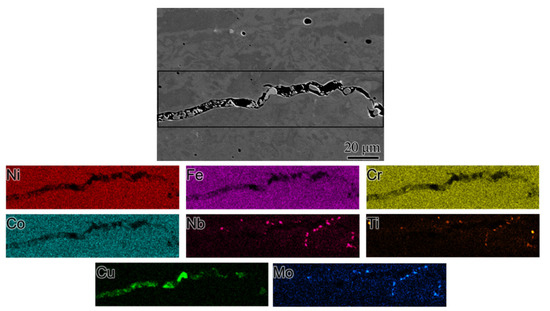
Figure 4.
BSE-SEM micrograph along a crack from the top portion (Location 1 in Figure 2) of the sample and their corresponding composition maps for major (Fe, Ni, Co, Cr) and minor (Nb, Ti, Mo, Cu) alloying elements.
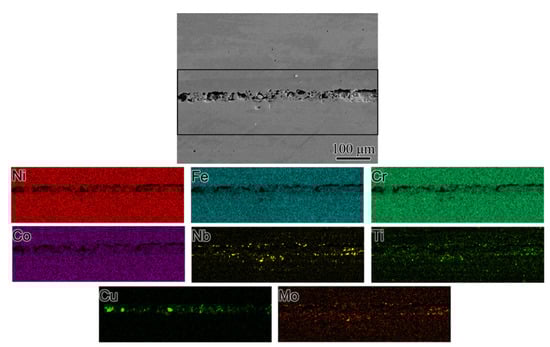
Figure 5.
BSE-SEM micrograph along a crack from the middle portion (Location 2 in Figure 2) of the sample and their corresponding composition maps for major (Fe, Ni, Co, Cr) and minor (Nb, Ti, Mo, Cu) alloying elements.
3.2. Evaluation of Location-Specific Solidification Cracking Susceptibility
To estimate the location-specific solidification cracking susceptibility in the 26 wt.% P91 alloy processed using the WAAM technique, the Kou criterion coupled with DICTRA simulations were used [17].
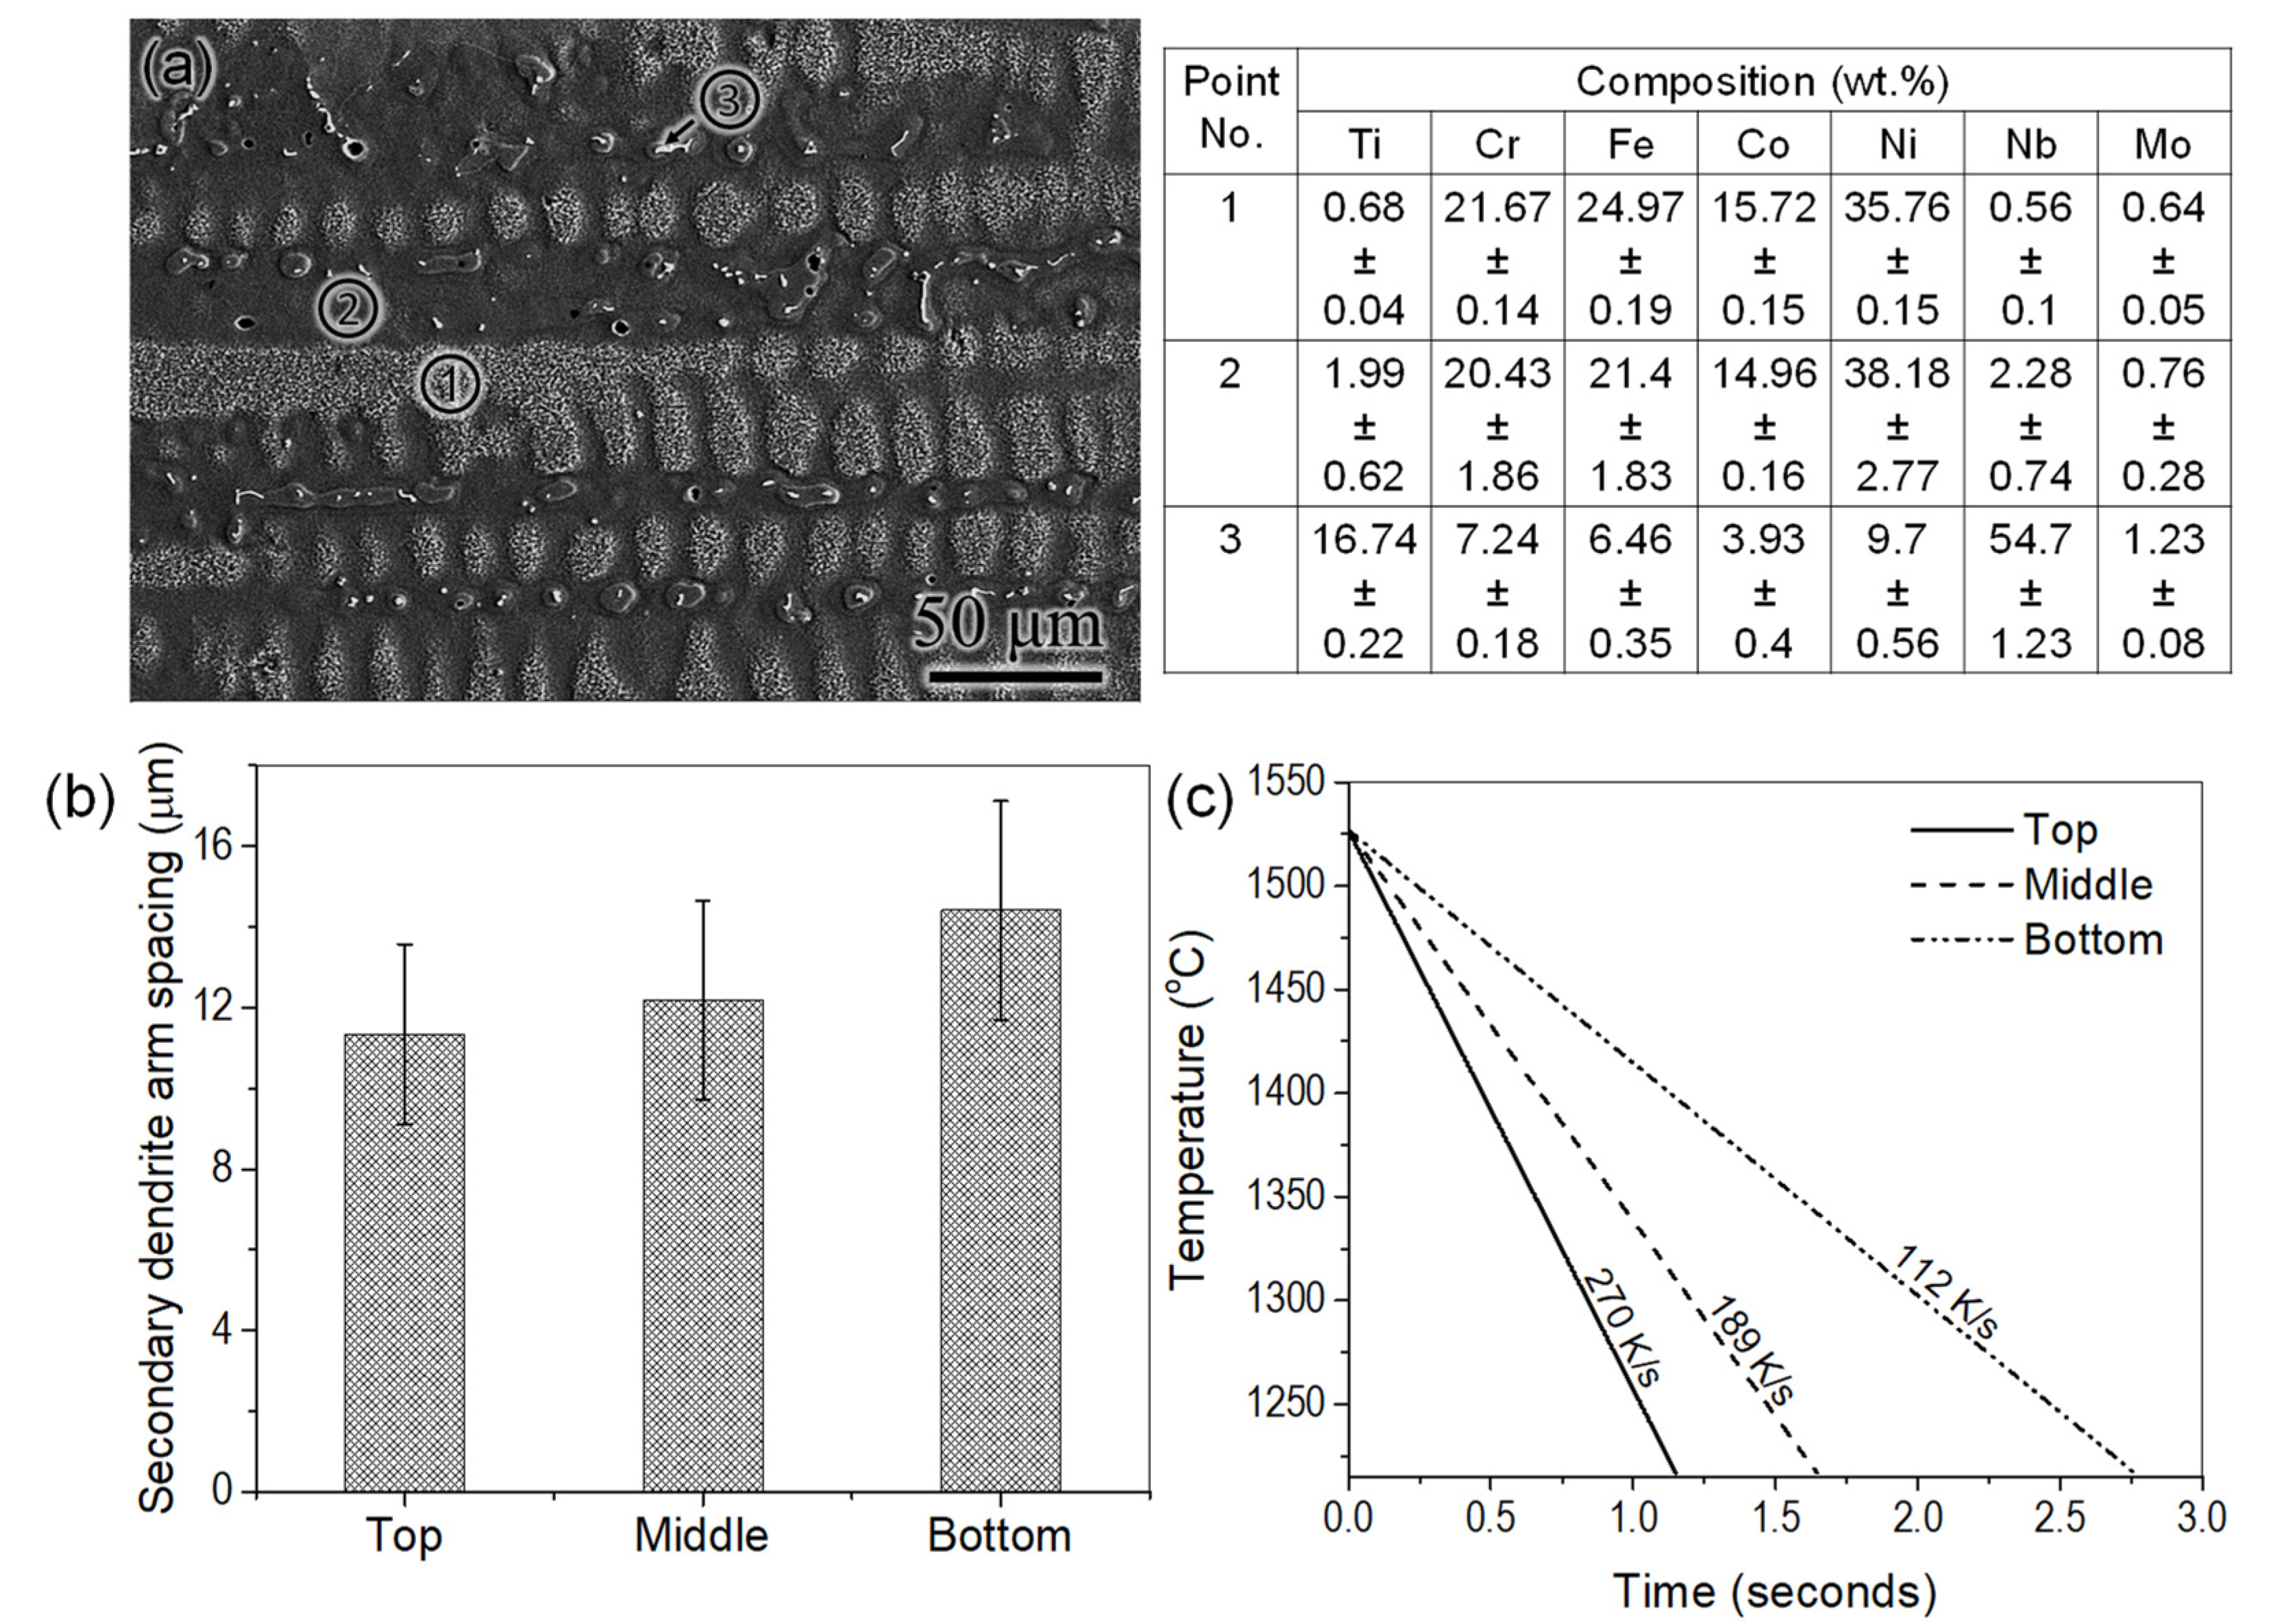
The SDAS was determined from the etched microstructure of the sample, as shown in Figure 6a. The compositions determined using EDS from different regions are listed in the table embedded in Figure 6. It can be observed that the concentration of Nb varies significantly in different locations. Nb enrichment can be observed in the interdendritic region (Point 2 in Figure 6a), in comparison with the dendrites (Point 1 in Figure 6a), including the primary and secondary ones. However, the white precipitates found in the interdendritic region had a higher Nb content, along with Ti and Mo. These precipitates corresponded to the Laves phase (Point 3 in Figure 6a). Due to the increased enrichment of Nb towards the end of solidification, the Laves phase was expected to form in the interdendritic region. Moreover, the Laves phase was found to be one of the solidifying phases towards the end of solidification, from the Scheil solidification curve obtained for the nominal composition of 26 wt.% P91 listed in Table 1. The SDAS, calculated using the etched micrographs, and the cooling rate calculated using Equation (2) are shown in Figure 6b,c, respectively. An inverse correlation was observed between the SDAS and the cooling rate. It is to be noted that although a constant interpass temperature (175 °C) was maintained during the deposition of each layer to control the bulk cooling rate, the local cooling rate was found to vary considerably leading to variation in microstructural features along the build direction. The estimated cooling rate and SDAS were used as inputs for the DICTRA simulation.
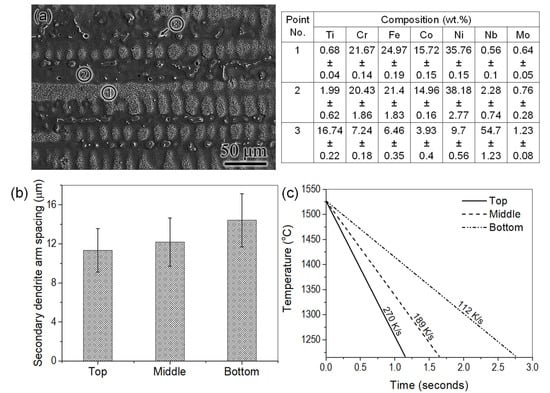
Figure 6.
(a) SE-SEM micrograph showing the etched microstructure from the top portion of the sample with the secondary dendrites and the composition of points 1, 2 and 3 measured using EDS as well as (b) SDAS calculated from the etched microstructure and (c) cooling rate calculated using the SDAS from different locations of the sample.
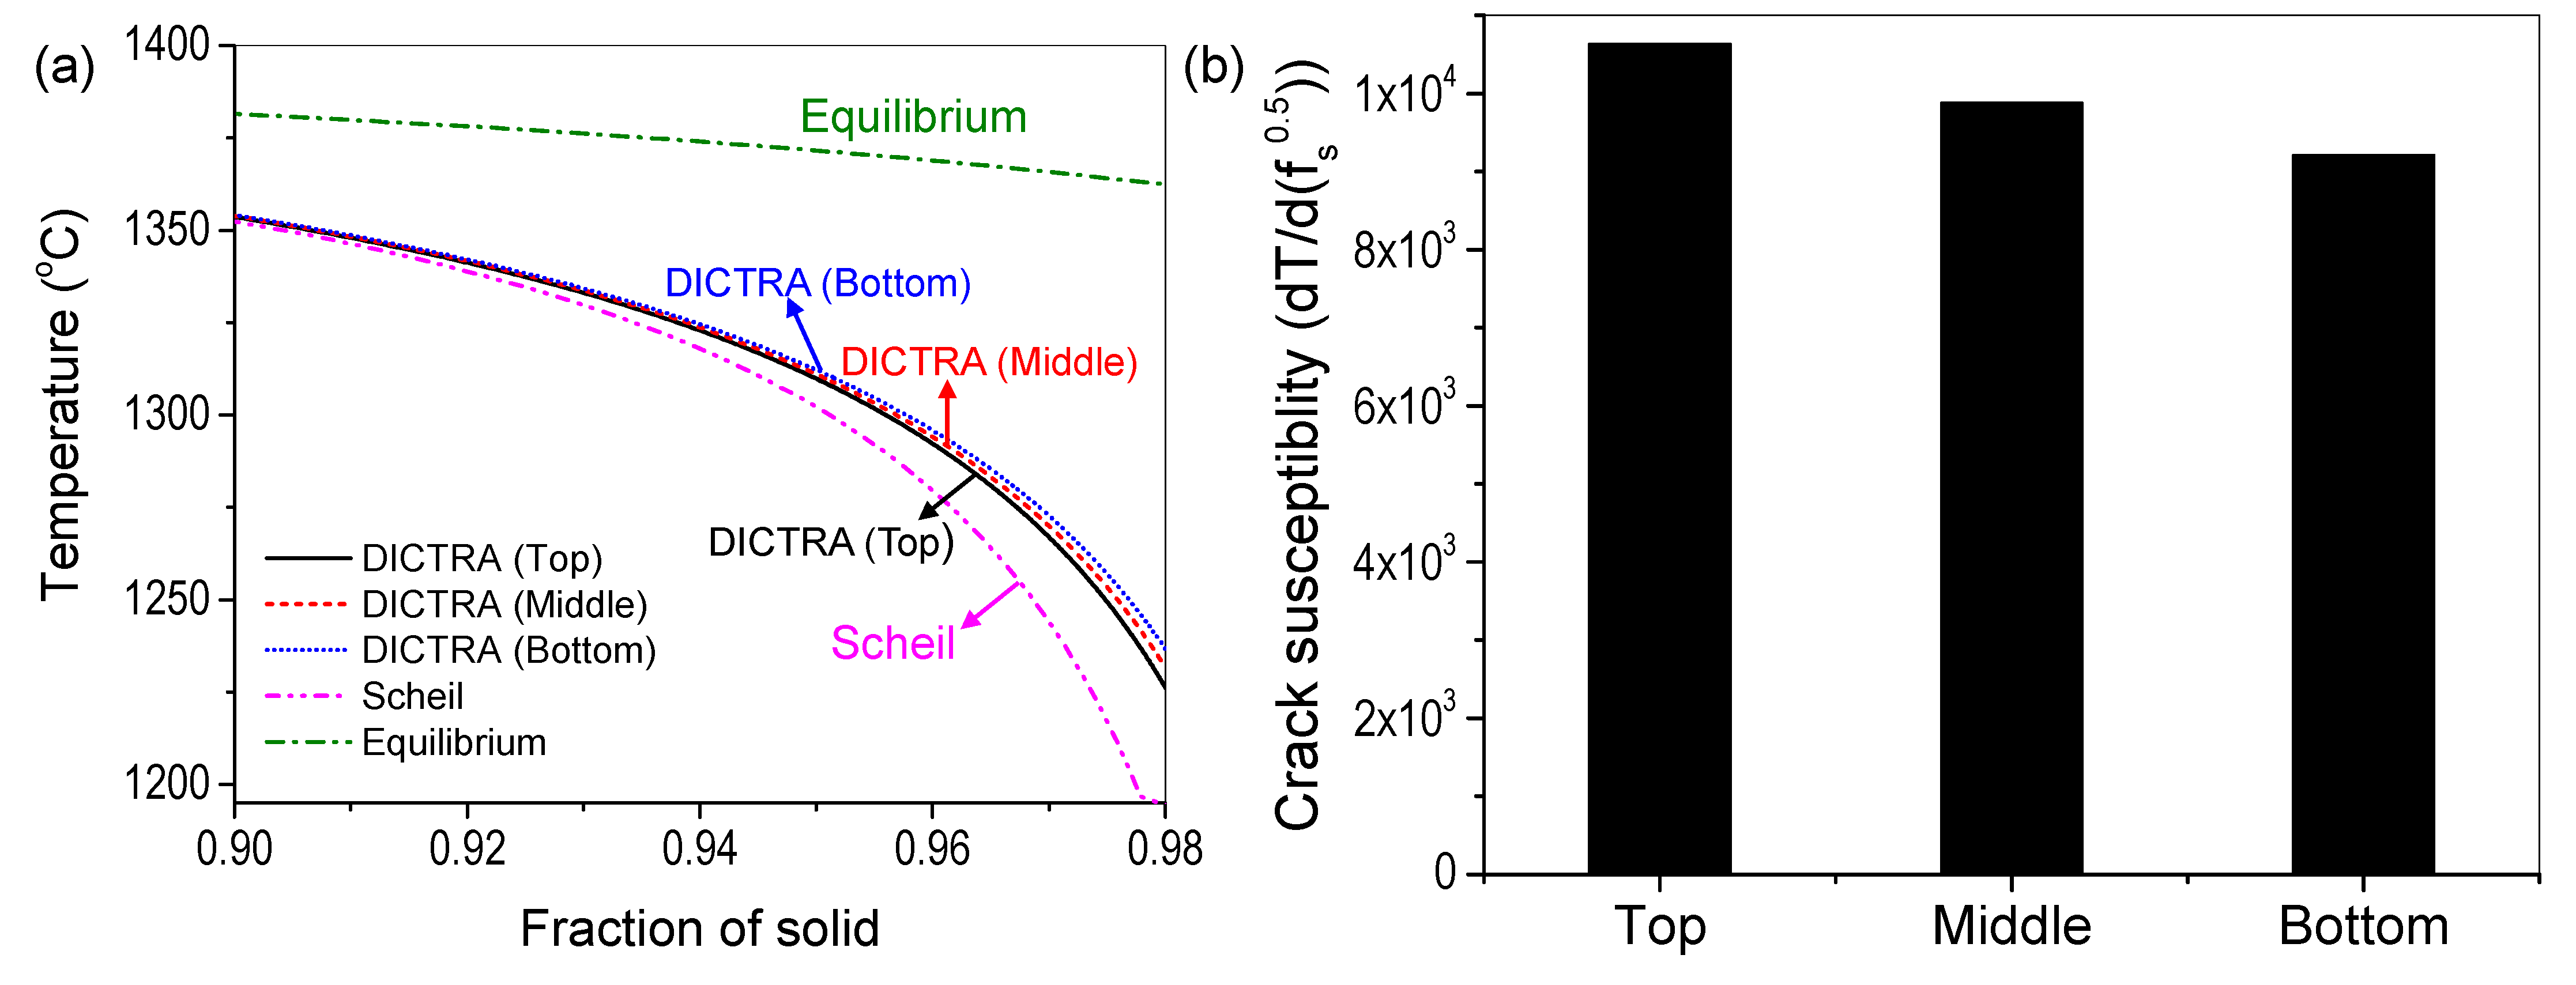
The temperature vs. solid fraction curves, obtained using DICTRA simulation for different locations shown in Figure 7a, were compared with the prediction using the Scheil modeling and equilibrium calculations for the alloy containing 26 wt.% P91, with the composition listed in Table 1. The solidus temperature varied significantly as the calculation method varied, mainly because of the difference in cooling rate assumed for different calculations. The cooling rate assumed in the equilibrium calculation was the least, with complete diffusion in both solid and liquid during solidification, due to which the solidus temperature was the highest amongst the different calculation methods. On the other hand, the Scheil model showed the lowest solidus temperature since it assumed a faster cooling rate with complete diffusion in the liquid and negligible diffusion in the solid. The solidus temperatures calculated using the one-dimensional DICTRA simulations were in between the equilibrium and Scheil calculations, since the cooling rate was intermediate. Moreover, it could be seen that the solidus temperature increased from the top to bottom sections, as the cooling rate increased. The solidification cracking susceptibility was taken as the maximum in the slope of the temperature vs. fraction of solid curve () obtained using the DICTRA simulations, as per the Kou criterion from various sample locations as shown in Figure 7b. The cracking susceptibility was the highest in the top portion of the sample with the highest cooling rate. Solidification cracking susceptibility decreased as the cooling rate decreased in the middle and bottom portions. The calculated solidification cracking susceptibility also correlated well with the cracking behavior characterized from different sample portions (Figure 2).
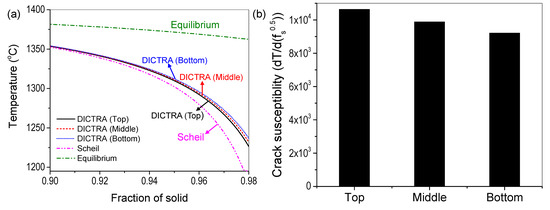
Figure 7.
(a) Temperature vs. fraction of solid curves obtained using equilibrium, DICTRA and Scheil calculations at the end of solidification showing the difference in solidus temperatures at ~98% solid fraction and (b) solidification cracking susceptibility calculated from different locations of the sample using the Kou criterion coupled with DICTRA calculations.
4. Discussion
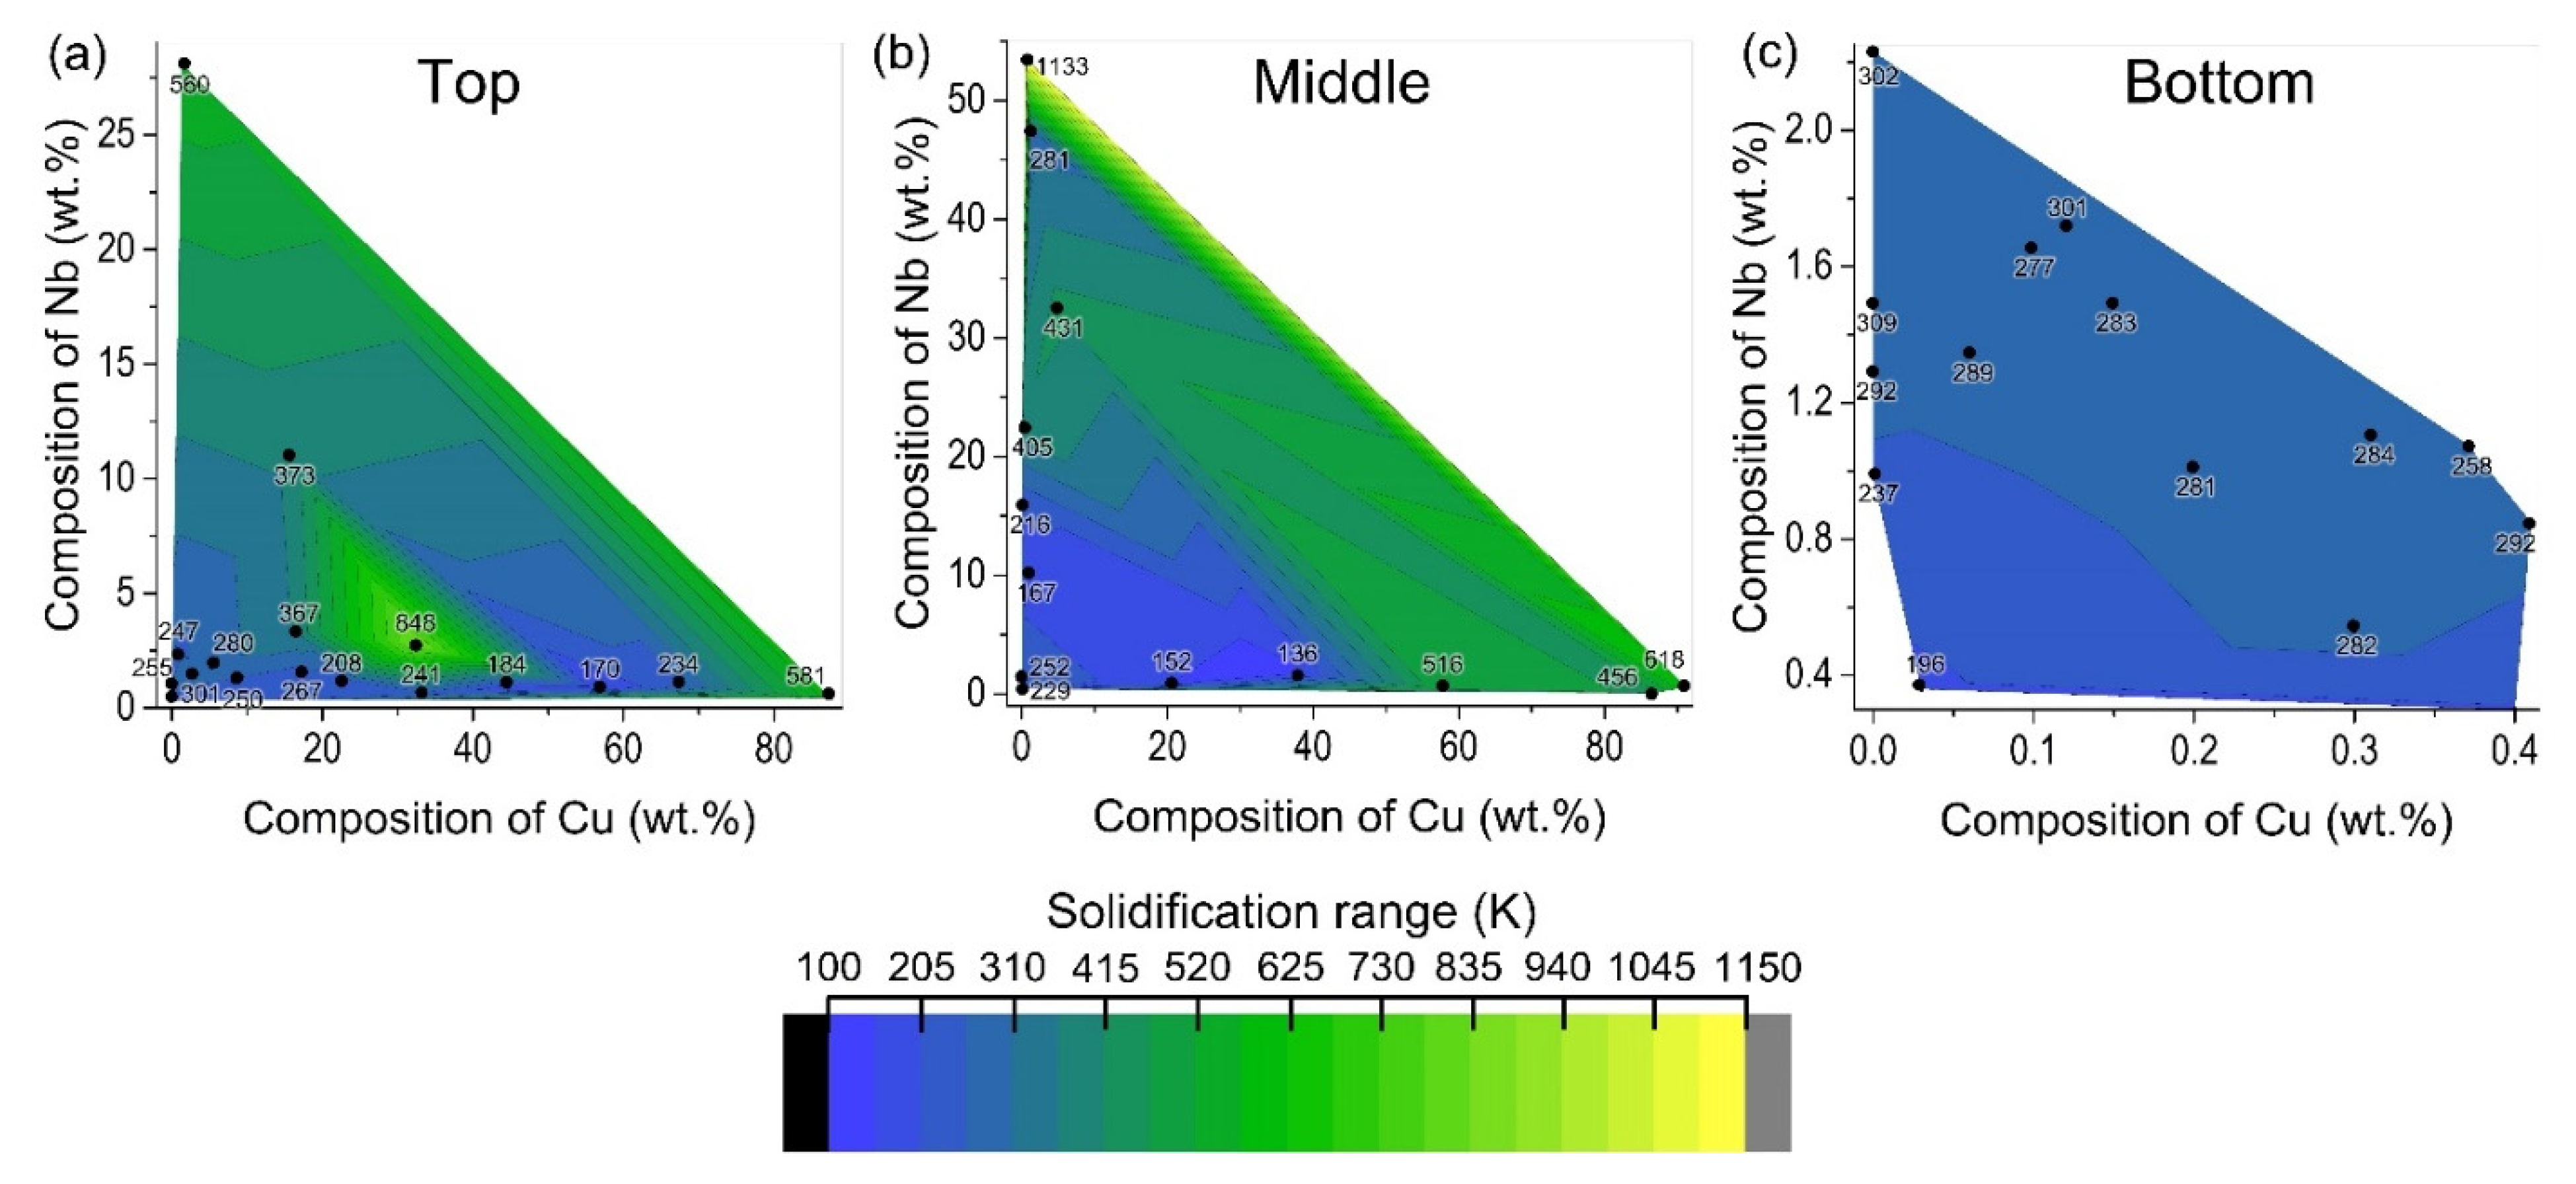
From the above-mentioned results, it is evident that the solidification cracking susceptibility is highly location-specific for the 26 wt.% P91 sample fabricated using WAAM. It is also clear that the cooling rate plays a major role in inducing the location-specific cracking behavior, since the top portion with the highest cooling rate had the longest crack. In addition, a difference in the extent of segregation of minor alloying elements such as Nb and Cu was also observed in different portions of the sample. However, the role of segregation on the solidification behavior needs to be probed further to identify their role in the location-specific cracking behavior. Therefore, the composition from several points within and around the cracks was measured using EDS from different sample locations and used as input for Scheil simulations. The solidification range calculated for each point from different locations are shown in Figure 8. From these EDS measurements it was observed that there was a varying degree of enrichment of Nb and Cu, compared to the nominal composition of these elements for the 26 wt.% P91 graded alloy, as listed in Table 1. In comparison with the top and middle part, the bottom region had the lowest enrichment of Nb (nearly 2.5 wt.%) and Cu (~0.4 wt.%), along with a lower solidification range, i.e., the temperature difference between liquidus and solidus. However, in the top and middle regions, the enrichment of Cu and Nb rose rapidly. The composition of Cu was found to be up to 87 wt.% in both the regions, while the extent of enrichment of Nb was lesser in the top region (~27 wt.%) in comparison with the middle region (~56 wt.%), which correlated well with the composition maps for Nb from these regions. Moreover, it was observed that the enrichment of Nb and Cu was likely to increase the solidification range. The increase in solidification range due to the increase in Nb content was more pronounced than the segregation of Cu. As the Nb content reached close to 60 wt.%, the solidification range was as high as 1133 K; as the Cu content became higher, the solidification range was up to 681 K. It is to be noted that the effect of other minor alloying elements, such as Mo and Ti, also played a role, although they were not as noticeable as Nb. For instance, in the top region, a wide solidification range (848 K) was observed at a point where the Cu content was intermediate (~30 wt.%) in comparison with the maximum enrichment, while the Nb and Mo content was almost equal (~2.5 wt.%). It was also observed that Mo affects the solidification range significantly if it is equal to the composition of Nb along with higher Cu content. This proves that the effect of Mo is not as significant as Nb in affecting the solidification range.
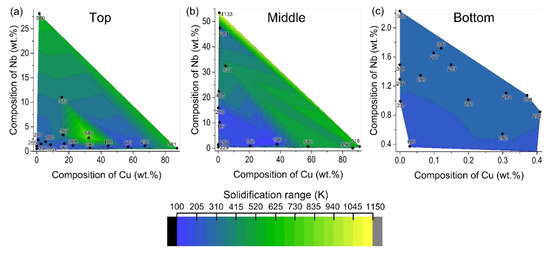
Figure 8.
Solidification ranges obtained using Scheil simulations as a function of Nb and Cu content from different points at (a) bottom, (b) middle and (c) top regions of the 26 wt.% P91 build.
A higher solidification range is known to affect printability during AM by inducing solidification cracks. According to the generalized theory for cracking proposed by Borland [37], solidification occurs in several stages. In the initial stage, the liquid and solid phases are continuous to accommodate relative movement. Furthermore, the dendrites grow and get interlocked while the liquid can move, thus, healing the cracks that form in this stage. Towards the end of solidification, the dendrites are completely grown and obstruct the liquid flow into the interdendritic regions to compensate for the shrinkage and strain. Hence, if an external stress is applied that exceeds the tolerance limit, cracking occurs, which cannot be backfilled by the liquid. If the solidification range is relatively higher, the number of interlocked dendrites that form at the later stage of solidification is higher, and hence, there will be more hindrance for the liquid to get backfilled [38]. The reduction of solidus temperature leading to an increase in the solidification range due to the segregation of Cu and Nb can be attributed to the formation of solidification cracks in the 26 wt.% P91 build. Although copper is added for solid solution strengthening effects, it is known to segregate in grain boundaries, leading to a reduction in hot malleability and creep ductility in Ni-base superalloys [39]. Long-term diffusion annealing is known to eliminate the segregation of copper. However, in the WAAM process, since sufficient time is not provided for the copper to dissolve and redistribute into the matrix owing to the faster cooling rate, the segregation is expected to be observed. In addition, Nb is known to segregate in the intergranular regions in Ni-base superalloys with moderately high Nb content (>1 wt.%). Hence, segregation of Cu and Nb is inevitable due to their ability to get enriched in grain boundaries and intergranular regions, respectively.
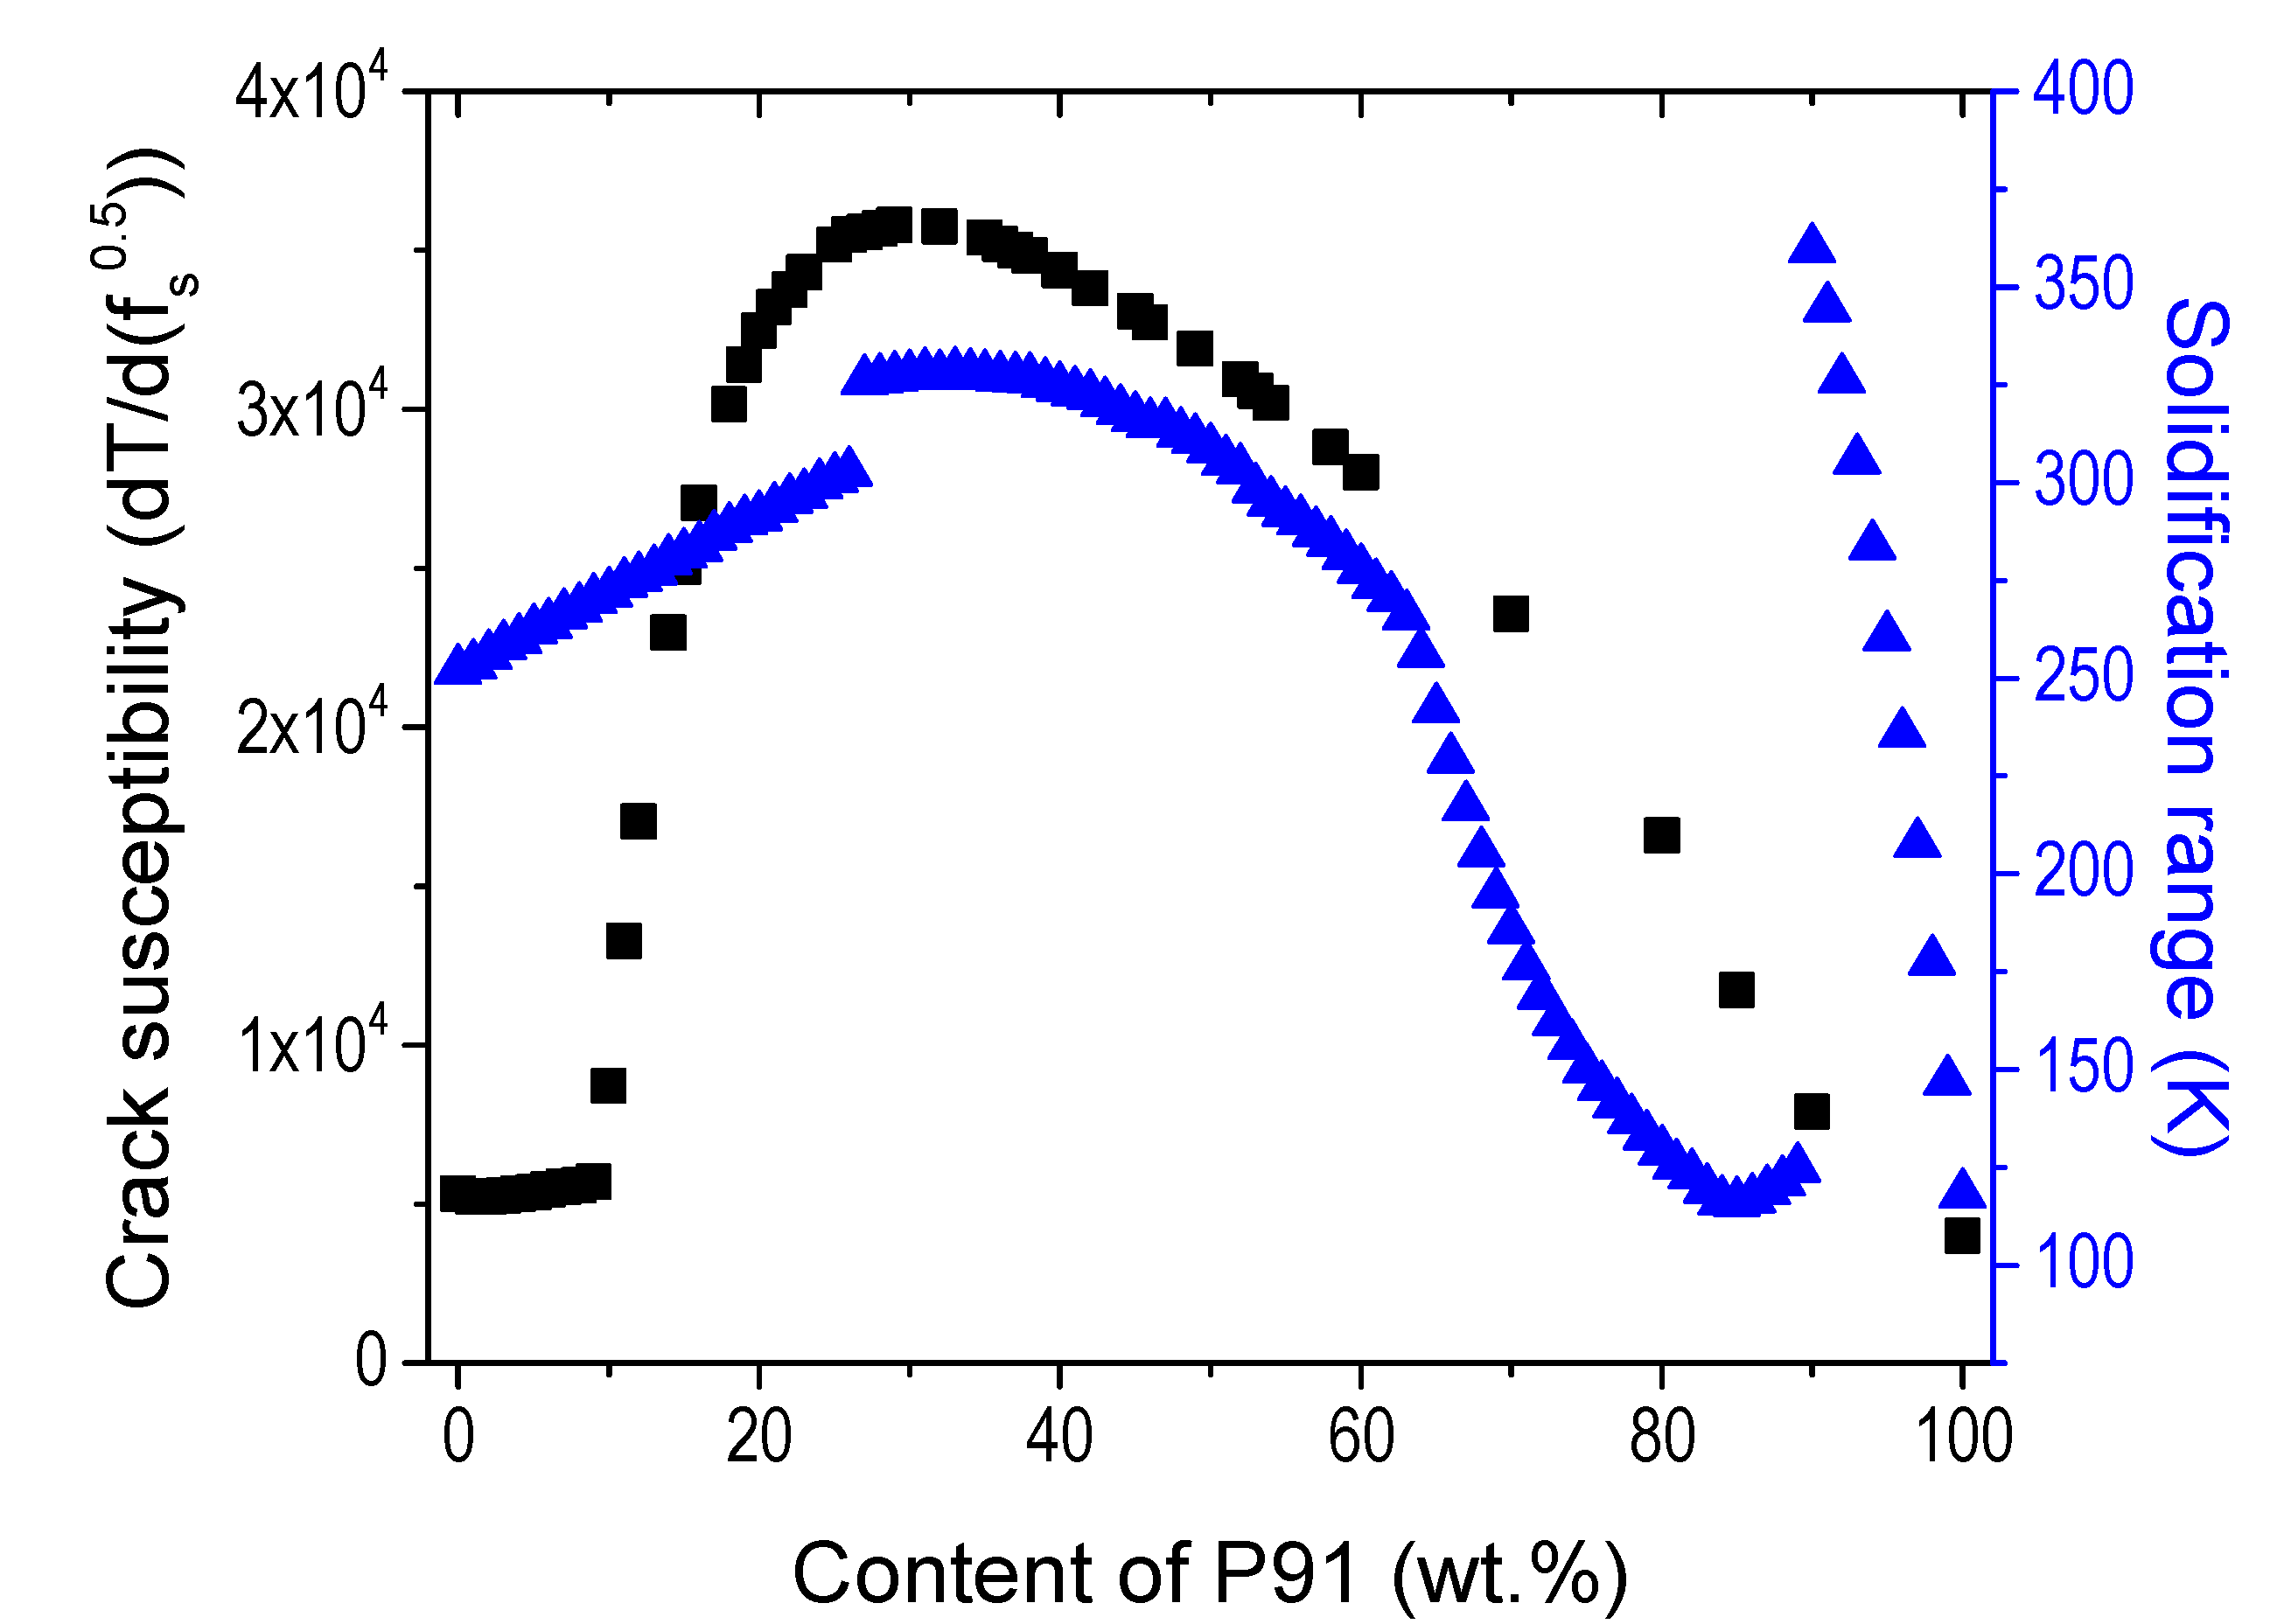
To mitigate location-specific solidification cracking in fabricating graded alloys from P91 to Inconel 740H using WAAM, the following solutions are suggested to obtain a crack-free build. Solidification characteristics such as the solidification range as well as the overall solidification cracking susceptibility should be considered as the primary factors when evaluating printability. Although alloy entropy may help to stabilize the microstructure, it does not have a direct influence on preventing crack formation, and thus should be considered with other design factors during the interlayer design for joining P91 steel with the 740H superalloy. Figure 9 represents the overall solidification cracking susceptibility using the Kou criterion and the freezing range computed using the outputs from Scheil calculations performed for the mixed compositions between P91 steel and 740H superalloy in steps of 1 wt.%. In this case, the maximum slope was calculated from the temperature vs. fraction of solid curve obtained from Scheil simulation for each alloy composition to apply the Kou criterion. From this plot, evidently, the overall solidification cracking susceptibility is highest around 26 wt.% P91. Moreover, there is an abrupt increase in the freezing range close to that composition. This proves that even though the calculated entropy for 26 wt.% P91 may be the highest, the solidification characteristics of this alloy are not conducive to being fabricated using WAAM. Thus, a careful analysis of the important attributes during solidification, such as freezing range and overall solidification cracking susceptibility, needs to be accounted for during the design of interlayers for joining dissimilar materials using AM. It is to be noted that, although segregation is one of the major factors that affect the cracking behavior, the overall solidification range is also equally important. The segregation behavior along with the freezing range will influence the solidification cracking susceptibility. From Figure 9, it is clearly evident that the freezing range of pure Inconel 740H is much lower than the 26 wt.% P91 graded alloy. It is well known that the smaller the freezing range, the lower will be the solidification cracking susceptibility. Hence, in Inconel 740H, although the Nb segregates and forms the Laves phase in the interdendritic region (as observed from our previous work), the lower freezing range does not allow it to form cracks. Hence, it is clearly evident that a complex interplay between the solidification range and segregation behavior influences the solidification cracking susceptibility.
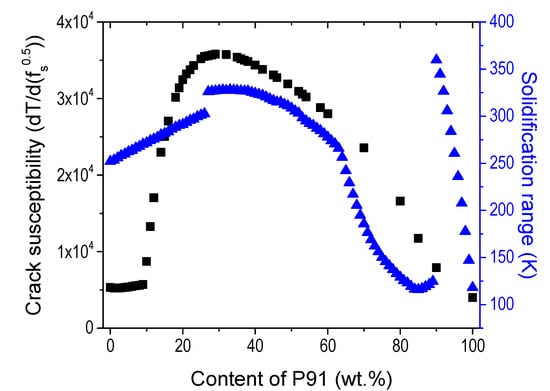
Figure 9.
Overall solidification cracking susceptibility determined using Kou criterion and freezing range calculated using Scheil simulations for different mixed compositions between P91 steel and 740H superalloy.
Another possible method to minimize the formation of cracks in the 26 wt.% P91 alloy is to alter the printing strategy. During the fabrication using the WAAM technique, the interpass temperature was maintained as 175 °C, i.e., before the deposition of every layer the previous layer was cooled to 175 °C. The interpass temperature directly influences the solidification rate of each new deposited layer. A low interpass temperature will result in a high cooling rate along with the inability to accommodate the internal stresses that form during solidification, leading to the formation of solidification cracks [40]. Therefore, if the interpass temperature is increased (i.e., if the interpass time is decreased) during the deposition of each layer, the cooling rate decreases, which will reduce the solidification cracking. In this case, a longer cooling time will give enough duration for the strains to be accommodated to avoid cracking. In addition, increasing the cooling time will provide sufficient time for the minor alloying elements such as copper to re-distribute into the matrix and avoid enrichment in grain boundaries causing intergranular solidification cracks. However, the dilution between the subsequent layers that will affect the build height will increase if the interpass temperature increases. Hence, an optimum interpass temperature that does not allow considerable dilution between the layers needs to be identified for obtaining crack-free builds without losing dimensional accuracy.
5. Conclusions
In this work, location-specific solidification cracking susceptibility has been investigated using an ICME approach for an alloy fabricated using WAAM with mixed composition between P91 steel and 740H superalloy for the first time. Based on the analysis presented above, the significant outcomes from this study can be summarized as follows.
- The total entropy calculated using the CALPHAD method and the configurational entropy was the highest for 26 wt.% P91 alloy amongst the mixed compositions between P91 steel and 740H superalloy. It was fabricated using WAAM with a twin-wire feeder for maintaining the required composition and the interpass temperature was maintained to be 175 °C. This alloy was designed to act as a potential interlayer for joining P91 steel and 740H superalloy using AM.
- The 26 wt.% P91 alloy has a single-phase FCC structure with intergranular cracks of varying lengths in the top and middle portions of the build and no cracks in the bottom region. The extent of segregation of minor alloying elements such as Nb and Cu were different within/around the cracks in the top and middle portions of the sample.
- The cooling rate decreased and the SDAS increased from the top to bottom portion of the build. The solidification cracking susceptibility deduced using the Kou criterion coupled with DICTRA simulations was the highest for the top, and lowest for the bottom region. The calculated solidus temperatures using DICTRA from different regions were intermediate between the Scheil and equilibrium calculations.
- The enrichment of Cu (~87 wt.%) and Nb (~27 to 56 wt.%) was more pronounced in the top and middle regions in comparison with the bottom part of the sample, leading to suppression of the solidus temperature and an increase in the solidification range which, in turn, increased the solidification cracking susceptibility.
- The overall solidification cracking susceptibility was highest for the 26 wt.% P91 amongst the mixed composition between P91 steel and 740H superalloy and an abrupt increase in freezing range was observed at that composition. In order to mitigate solidification cracking, a different alloy with a lower freezing range as well as solidification cracking susceptibility needs to be chosen and the printing strategy needs to be altered by increasing the interpass temperature to decrease the cooling rate. The choice of alloy composition, as well as the deposition strategy, is important for achieving a crack-free build using WAAM.
Author Contributions
Conceptualization, W.X.; methodology, W.X.; software, N.S. and X.W.; validation, S.S., N.S. and X.W.; formal analysis, S.S., N.S. and X.W.; investigation, S.S., N.S., X.W., M.A.K. and W.X.; resources, W.X. and M.A.K.; data curation, S.S., N.S. and X.W.; writing—original draft preparation, S.S.; writing—review and editing, S.S., N.S., X.W., M.A.K. and W.X.; visualization, S.S., N.S. and X.W.; supervision, W.X.; project administration, W.X.; funding acquisition, W.X. and M.A.K. All authors have read and agreed to the published version of the manuscript.
Funding
This research was funded by National Energy Technology Laboratory, Department of Energy, United States, grant number DE-FE0031637. N.S. is supported by a NASA Space Technology Research Fellowship, Grant: 80NSSC19K1142.
Institutional Review Board Statement
Not applicable.
Informed Consent Statement
Not applicable.
Data Availability Statement
Not applicable.
Acknowledgments
S.S. acknowledges Lauren Wewer for her assistance in sample preparation through the Mascaro Centre for Sustainable Innovation (MCSI) summer internship program.
Conflicts of Interest
The authors declare no conflict of interest. This report was prepared as an account of work sponsored by an agency of the United States Government. Neither the United States Government nor any agency thereof, nor any of their employees, makes any warranty, express or implied, or assumes any legal liability or responsibility for the accuracy, completeness, or usefulness of any information, apparatus, product, or process disclosed, or represents that its use would not infringe privately owned rights. Reference herein to any specific commercial product, process, or service by trade name, trademark, manufacturer, or otherwise does not necessarily constitute or imply its endorsement, recommendation, or favoring by the United States Government or any agency thereof. The views and opinions of authors expressed herein do not necessarily state or reflect those of the United States Government or any agency thereof.
References
- Abd El-Azim, M.E.; Ibrahim, O.H.; El-Desoky, O.E. Long term creep behaviour of welded joints of P91 steel at 650 °C. Mater. Sci. Eng. A 2013, 560, 678–684. [Google Scholar] [CrossRef]
- De Barbadillo, J.J.; Baker, B.A.; Virginia, W. Microstructure stability of Alloy 740H and its effect on material properties. In Proceedings of the ASME Symposium on Elevated Temperature Application of Materials for Fossil, Nuclear and Petrochemical Industries, Seattle, WA, USA, 25–27 March 2014; pp. 1–13. [Google Scholar]
- George, E.P.; Raabe, D.; Ritchie, R.O. High-entropy alloys. Nat. Rev. Mater. 2019, 4, 515–534. [Google Scholar] [CrossRef]
- Tsai, M.-H.; Yeh, J.-W. High-Entropy Alloys: A Critical Review. Mater. Res. Lett. 2014, 2, 107–123. [Google Scholar] [CrossRef]
- Miracle, D.B.; Senkov, O.N. A critical review of high entropy alloys and related concepts. Acta Mater. 2017, 122, 448–511. [Google Scholar] [CrossRef] [Green Version]
- Zhang, Y.; Zuo, T.T.; Tang, Z.; Gao, M.C.; Dahmen, K.A.; Liaw, P.K.; Lu, Z.P. Microstructures and properties of high-entropy alloys. Prog. Mater. Sci. 2014, 61, 1–93. [Google Scholar] [CrossRef]
- Gorsse, S.; Hutchinson, C.; Gouné, M.; Banerjee, R. Additive manufacturing of metals: A brief review of the characteristic microstructures and properties of steels, Ti-6Al-4V and high-entropy alloys. Sci. Technol. Adv. Mater. 2017, 18, 584–610. [Google Scholar] [CrossRef] [Green Version]
- Imran, M.K.; Masood, S.H.; Brandt, M.; Bhattacharya, S.; Mazumder, J. Direct metal deposition (DMD) of H13 tool steel on copper alloy substrate: Evaluation of mechanical properties. Mater. Sci. Eng. A 2011, 528, 3342–3349. [Google Scholar] [CrossRef]
- Domack, M.S.; Baughman, J.M. Development of nickel-titanium graded composition components. Rapid Prototyp. J. 2005, 11, 41–51. [Google Scholar] [CrossRef]
- Sahasrabudhe, H.; Harrison, R.; Carpenter, C.; Bandyopadhyay, A. Stainless steel to titanium bimetallic structure using LENSTM. Addit. Manuf. 2015, 5, 1–8. [Google Scholar] [CrossRef]
- Zhou, X.; Tian, Q.; Du, Y.; Zhang, Y.; Bai, X.; Zhang, Y.; Zhang, H.; Zhang, C.; Yuan, Y. Investigation of the effect of torch tilt and external magnetic field on arc during overlapping deposition of wire arc additive manufacturing. Rapid Prototyp. J. 2021, 27, 24–36. [Google Scholar] [CrossRef]
- Tang, S.; Wang, G.; Song, H.; Li, R.; Zhang, H. A novel method of bead modeling and control for wire and arc additive manufacturing. Rapid Prototyp. J. 2021, 27, 311–320. [Google Scholar] [CrossRef]
- Fang, X.; Ren, C.; Zhang, L.; Wang, C.; Huang, K.; Lu, B. A model of bead size based on the dynamic response of CMT-based wire and arc additive manufacturing process parameters. Rapid Prototyp. J. 2021, 27, 741–753. [Google Scholar] [CrossRef]
- Kulkarni, J.D.; Goka, S.B.; Parchuri, P.K.; Yamamoto, H.; Ito, K.; Simhambhatla, S. Microstructure evolution along build direction for thin-wall components fabricated with wire-direct energy deposition. Rapid Prototyp. J. 2021, 27, 1289–1301. [Google Scholar] [CrossRef]
- Chen, X.; Fu, Y.; Kong, F.; Li, R.; Xiao, Y.; Hu, J.; Zhang, H. An in-process multi-feature data fusion nondestructive testing approach for wire arc additive manufacturing. Rapid Prototyp. J. 2021. ahead-of-print. [Google Scholar] [CrossRef]
- Zhao, Y.; Li, K.; Gargani, M.; Xiong, W. A comparative analysis of Inconel 718 made by additive manufacturing and suction casting: Microstructure evolution in homogenization. Addit. Manuf. 2020, 36, 101404. [Google Scholar] [CrossRef]
- Sargent, N.; Jones, M.; Otis, R.; Shapiro, A.A.; Delplanque, J.-P.; Xiong, W. Integration of Processing and Microstructure Models for Non-Equilibrium Solidification in Additive Manufacturing. Metals 2021, 11, 570. [Google Scholar] [CrossRef]
- Jimenez, X.; Dong, W.; Paul, S.; Klecka, M.A.; To, A.C. Residual Stress Modeling with Phase Transformation for Wire Arc Additive Manufacturing of B91 Steel. JOM 2020, 72, 4178–4186. [Google Scholar] [CrossRef]
- Kou, S. A criterion for cracking during solidification. Acta Mater. 2015, 88, 366–374. [Google Scholar] [CrossRef]
- Kou, S. Solidification and liquation cracking issues in welding. JOM 2003, 55, 37–42. [Google Scholar] [CrossRef]
- Eskin, D.G.; Suyitno; Katgerman, L. Mechanical properties in the semi-solid state and hot tearing of aluminium alloys. Prog. Mater. Sci. 2004, 49, 629–711. [Google Scholar] [CrossRef]
- Prokhorov, N.N. Resistance to hot tearing of cast metals during solidification. Russ. Cast. Prod. 1962, 2, 172–175. [Google Scholar]
- Feurer, U. Mathematical model by the hot cracking tendency of binary aluminum alloys. Giessereiforschung 1976, 28, 75–80. [Google Scholar] [CrossRef]
- Nasresfahani, M.R.; Niroumand, B. A New Criterion for Prediction of Hot Tearing Susceptibility of Cast Alloys. Metall. Mater. Trans. A 2014, 45, 3699–3702. [Google Scholar] [CrossRef]
- Rappaz, M.; Drezet, J.-M.; Gremaud, M. A new hot-tearing criterion. Metall. Mater. Trans. A 1999, 30, 449–455. [Google Scholar] [CrossRef]
- Ploshikhin, V.; Prikhodovsky, A.; Makhutin, M.; Ilin, A.; Zoch, H.-W. Integrated Mechanical-Metallurgical Approach to Modeling of Solidification Cracking in Welds. In Hot Cracking Phenomena in Welds; Böllinghaus, T., Herold, H., Eds.; Springer: Berlin/Heidelberg, Germany, 2005; pp. 223–244. ISBN 978-3-540-27460-5. [Google Scholar]
- Malekshahi Beiranvand, Z.; Malek Ghaini, F.; Naffakh Moosavy, H.; Sheikhi, M.; Torkamany, M.J. An Analytical Model for Prediction of Solidification Cracking Susceptibility in Aluminum Alloys Taking into Account the Effect of Solidification Rate. Metall. Mater. Trans. A 2019, 50, 2835–2846. [Google Scholar] [CrossRef]
- Kou, S. A Simple Index for Predicting the Susceptibility to Solidification Cracking. Weld. J. 2015, 94, 374–388. [Google Scholar]
- Chen, Q.; Sundman, B. Computation of Partial Equilibrium Solidification with Complete Interstitial and Negligible Substitutional Solute Back Diffusion. Mater. Trans. 2002, 43, 551–559. [Google Scholar] [CrossRef] [Green Version]
- Giorjao, R.; Sutton, B.; Ramirez, A. New Composition Based Technique for Solidification Cracking Resistance Evaluation. Metall. Mater. Trans. A 2021, 52, 2512–2521. [Google Scholar] [CrossRef]
- Cao, Y.; Wei, H.L.; Yang, T.; Liu, T.T.; Liao, W.H. Printability assessment with porosity and solidification cracking susceptibilities for a high strength aluminum alloy during laser powder bed fusion. Addit. Manuf. 2021, 46, 102103. [Google Scholar] [CrossRef]
- Hyer, H.; Zhou, L.; Mehta, A.; Park, S.; Huynh, T.; Song, S.; Bai, Y.; Cho, K.; McWilliams, B.; Sohn, Y. Composition-dependent solidification cracking of aluminum-silicon alloys during laser powder bed fusion. Acta Mater. 2021, 208, 116698. [Google Scholar] [CrossRef]
- Dovgyy, B.; Simonelli, M.; Pham, M.-S. Alloy design against the solidification cracking in fusion additive manufacturing: An application to a FeCrAl alloy. Mater. Res. Lett. 2021, 9, 350–357. [Google Scholar] [CrossRef]
- Tinoco, J.; Fredriksson, H. Solidification of a Modified Inconel 625 Alloy under Different Cooling Rates. High Temp. Mater. Process. 2004, 23, 13–24. [Google Scholar] [CrossRef]
- Calcagnotto, M.; Ponge, D.; Demir, E.; Raabe, D. Orientation gradients and geometrically necessary dislocations in ultrafine grained dual-phase steels studied by 2D and 3D EBSD. Mater. Sci. Eng. A 2010, 527, 2738–2746. [Google Scholar] [CrossRef]
- Sridar, S.; Zhao, Y.; Xiong, W. Cyclic re-austenitization of copper-bearing high-strength low-alloy steels fabricated by laser powder bed fusion. Mater. Charact. 2020, 166, 110437. [Google Scholar] [CrossRef]
- Borland, J.; Younger, R. Some aspects of cracking in welded Cr-Ni austenitic steels. Br. Weld. J. 1960, 7, 22–59. [Google Scholar]
- Yan, F.; Yan, J.; Linder, D. Understanding Hot Cracking of Steels during Rapid Solidification: An ICME Approach. Mater. Proc. 2021, 3, 30. [Google Scholar] [CrossRef]
- Jena, A.K.; Chaturvedi, M.C. The role of alloying elements in the design of nickel-base superalloys. J. Mater. Sci. 1984, 19, 3121–3139. [Google Scholar] [CrossRef]
- Gokuldoss, P.K.; Kolla, S.; Eckert, J. Additive Manufacturing Processes: Selective Laser Melting, Electron Beam Melting and Binder Jetting—Selection Guidelines. Materials 2017, 10, 672. [Google Scholar] [CrossRef] [Green Version]


Publisher’s Note: MDPI stays neutral with regard to jurisdictional claims in published maps and institutional affiliations. |
© 2022 by the authors. Licensee MDPI, Basel, Switzerland. This article is an open access article distributed under the terms and conditions of the Creative Commons Attribution (CC BY) license (https://creativecommons.org/licenses/by/4.0/).