Article

Hardness Evolution of Solution-Annealed LPBFed Inconel 625 Alloy under Prolonged Thermal Exposure

1
Department of Applied Science and Technology, Politecnico di Torino, Corso Duca degli Abruzzi 24, 10129 Turin, Italy
2
Center for Sustainable Future Technologies CSFT@Polito, Istituto Italiano di Tecnologia, Via Livorno 60, 10144 Turin, Italy
3
Center of Integrated Additive Manufacturing (IAM), Politecnico di Torino, Corso Castelfidardo, 51, 10138 Torino, Italy
4
Consorzio Interuniversitario Nazionale per la Scienza e Tecnologia dei Materiali (INSTM), Via G. Giusti 9, 50121 Firenze, Italy
*
Author to whom correspondence should be addressed.
Metals 2022, 12(11), 1916; https://doi.org/10.3390/met12111916
Submission received: 11 October 2022 / Revised: 3 November 2022 / Accepted: 5 November 2022 / Published: 9 November 2022

Abstract

:
Thanks to its high weldability, Inconel 625 (IN625) can be easily processed by laser powder bed fusion (LPBF). After production, this alloy is typically subjected to specific heat treatments to design specific microstructure features and mechanical performance suitable for various industrial applications, including aeronautical, aerospace, petrochemical, and nuclear fields. When employed in structural applications, IN625 can be used up to around 650 °C. This limitation is mainly caused by the transformation of metastable γ″ phases into stable δ phases occurring under prolonged thermal exposure, which results in drastically reduced ductility and toughness of the alloy. Because the microstructure and mechanical properties change during thermal exposure, it is essential to study the material simulating possible service temperatures. In the current study, LPBFed IN625 samples were solution-annealed and then subjected to thermal exposure at 650 °C for different times up to 2000 h. The characterization focused on the evolution of the main phases, γ″ and δ phases, and their influence on the hardness evolution. The microstructure and hardness of the heat-treated LPBFed IN625 samples were compared with data related to the traditionally processed IN625 alloy (e.g., wrought state) reported in the literature.

1. Introduction

Inconel 625 (IN625) is a Ni-based superalloy, solid solution strengthened mainly by the presence of Mo and Nb [1,2]. This alloy has been widely used in several fields due to its excellent characteristics, including high corrosion and oxidation protection for elevated thermal exposures in harsh environments as well as good tensile properties at high temperatures [1,3]. In particular, this alloy has been used for aeronautical, aerospace, petrochemical, and nuclear applications. For instance, IN625 can be used for reactor-core and control-rod components in pressurized water reactors as heat exchanger tubes in ammonia crackers plants. Moreover, this alloy can be employed for the plugs for the exhaust parts in new generations of civil aero engines [4,5].
Under thermal exposures, the microstructure of IN625 alloy undergoes the formation or growth of new phases and possible recrystallization phenomena, thus involving a modification of its mechanical properties. For instance, the formation of new phases commonly provokes a tensile strength increment coupled with a ductility decrease. For this alloy, the primary precipitates are the body-centered tetragonal γ″ (Ni3Nb), which is a metastable phase and tends to evolve in the stable orthorhombic δ (Ni3Nb) phase under prolonged thermal exposures over 600 °C, Laves Phases (Cr,Fe,Ni)2(Si,Ti,Nb,Mo) with a hexagonal structure, and different kinds of carbides such as MC, M6C, and M23C. The formation of Laves and δ phases can drastically degrade the ductility of the material [1,6].
Regarding additive manufacturing (AM), laser powder bed fusion (LPBF) represents one of the most used processes for producing IN625 alloy. LPBF allows for the fabrication of complex shape components, and also for materials difficult to machine, such as Ni-based superalloys [7,8,9].
Nowadays, the major studies on LPBFed IN625 have been related to process parameter optimization and the effect of post-heat treatments to improve the mechanical performance of the alloy [2,10,11,12,13,14,15]. The literature on LPBFed IN625 already pointed out that the thermal history induced by the LPBF process involves a different microstructure compared with the traditional processes [16,17,18]. Therefore, the microstructure and mechanical properties evolution under thermal exposures should be well understood due to its main applications at intermediate and high temperatures.
For traditionally processed IN625 (e.g., wrought and heat-treated), there are various studies on the microstructure evolution associated with prolonged thermal exposures [4,5,19,20]. Shankar et al. [4] examined samples of ammonia cracker tubes made of IN625 after service condition for prolonged times at 600 °C for around 60,000 h, showing the increment of tensile strength coupled to the ductility reduction due to phases formation such as γ″ phase. The same alloy presented the formation of δ phases after thermal aging at 650 °C for over 200 h. They also reported that solution annealing at 1150 °C for 30 min effectively dissolved most of the phases except for the Nb-rich MC carbides. Suave et al. [5,6] investigated in-depth the formation and evolution of the δ and γ″ phases for different temperatures up to 2000 h, proposing a time-temperature–transformation (TTT) diagram. They identified the primary formation of γ″ phase between 550 and 750 °C as well as the predominant formation of δ phases between 650 and 900 °C, also reporting the micro-hardness evolution of the alloy under different thermal exposures. For instance, a thermal exposure at 650 °C involved a drastic micro-hardness improvement up to 1000 h due to the γ″ phase formation. Afterward, prolonged thermal exposures over 1000 h provoked the transformation of the intragranular γ″ phase into δ phases, resulting in a slight micro-hardness reduction. Malej et al. [19] reported a similar micro-hardness trend for hot-rolled IN625 at 650 °C up to 2000 h, revealing micro-hardness improvement up to 1000 h and then a slight micro-hardness reduction for 2000 h, due to the high quantity of δ phases transformed from the γ″ phases.
Regarding LPBFed IN625 alloy, in a previous study by the research group [21], the microstructural evolution of IN625 in the as-built and solution-annealed states subjected to various heat treatments for 200 h was studied. It was observed that solution annealing is essential to guarantee a homogenous formation of phases throughout the alloy and that the kinetics of phase formation is different with respect to the as-fabricated LPBF samples. Gola et al. [22] investigated the microstructural evolution of post-annealed LPBF IN625 alloy under aging at 600 °C up to 500 h, showing progressive precipitation of γ″ particles without the formation of δ phases. Moreover, Stoudt et al. [18] reported that LPBFed IN625 presented a faster δ phase kinetic formation with respect to its wrought version under thermal exposures.
The limited literature on prolonged thermal exposures of LPBFed IN625 points out that in-depth investigations should be performed on this topic. For this reason, the current study focuses on the impact of prolonged thermal exposure of LPBFed IN625 alloy on the microstructure and hardness evolution. The samples were solution-treated to have a homogeneous microstructure suitable for high-temperature applications and then exposed to 650 °C for different holding times up to 2000 h. This temperature is commonly considered the maximum operative temperature of IN625 for structural applications when high mechanical properties are required. This temperature should involve the precipitation of the γ″ and δ phases, representing the key phases governing the microstructure and mechanical properties of the alloy.

2. Materials and Methods

In this study, samples were produced out of gas-atomized Inconel 625 powders supplied by EOS GmbH. The powder chemical composition, in agreement with UNS N06625 and expressed in weight percentage, is reported in Table 1.
As visible in Figure 1a, particles were mostly spherical and the particle size distribution, with corresponding D10, D50, and D90 values (Figure 1b), is typical for AM applications.
An EOSINT M270 Dual Mode version, equipped with a Yb-fiber laser, was used to produce cubic samples measuring 15 mm per side. The building chamber was kept under argon protection to avoid oxidation during the LPBF process. The parameters used for building the sample were: a laser power of 195 W, a scan speed of 1200 mm/s, a hatching distance of 0.09 mm, and a layer thickness of 20 µm. With these parameters, sample building was performed using the EOS scanning strategy involving a 67° laser beam scanning rotation between consecutive layers. These parameters allowed the production of dense samples (relative density close to 100%), as reported in a previous investigation [23]. Afterward, the samples were removed from the building platform via electro-discharging machining. Then, the samples were solution-annealed at 1150 °C for 2 h and water quenched. This is a standard heat treatment for IN625 components, which operate at high temperatures [24]. Finally, the extended thermal exposure test was carried out on the samples heat-treated at 650 °C for a holding time of up to 2000 h with intermediate observation steps after 200, 400, 600, 1000, and 1500 h. Each prolonged thermal exposure was performed on two samples.
The samples were cut along the building direction, and then metallographic preparation was performed by grinding the surfaces with SiC sandpaper and final polishing with diamond suspensions. Secondly, the samples were chemically etched with Kalling N°2 for microstructural observation.
The shapes and dimensions of the grains were observed using a LOM-LEICA DMI 5000 M and a Leica MEF4 optical microscopes (Leica, Wetzlar, Germany). Finally, the phase formations were observed by a SEM-Zeiss EVO 15 scanning electron microscope and a FESEM Zeiss Merlin field emission scanning electron microscope (Zeiss, Oberkochen, Germany).
Collected micrographs were processed with ImageJ, open-source software dedicated to image analysis, allowing the measurement of γ″ and δ phases. Five SEM images were used to determine δ phases and to give a statistically meaningful particle assessment. At least 500 precipitates per image were evaluated. The distinction between the two phases was based on the measurement of particle aspect ratio; more precisely, particles with an aspect ratio higher than four were considered δ needles.
On the other hand, the γ″ phases present very small dimensions, and therefore, high magnification FESEM images were collected, and 100 γ″ particles were analyzed for each condition. The identification was performed considering that the γ″ phase exhibits a spherical or elliptical shape, as reported in the literature. The identification of δ and γ″ phases based on their morphology was already reported in the literature [5,6,21].
XRD analyses were performed to study the γ matrix lattice parameter variations due to the microstructure evolution. The instrument used for this purpose is an XRD diffractometer-X-Pert Philips (Malvern Panalytical B.V., Almelo, Netherlands). The measures of the lattice parameter of the γ matrix for the various conditions were obtained from the 2θ angle measures corresponding to the diffraction pattern peak positions. Finally, the hardness was tested by means of Brinell hardness measurements HBW2.5/62.5 using an EMCO TEST M4U durometer (EMCO-TEST Prüfmaschinen GmbH, Kuchl, Austria), according to the ASTM E10 standard. Ten indentations per sample were performed on the XZ cross-section.

3. Results and Discussion

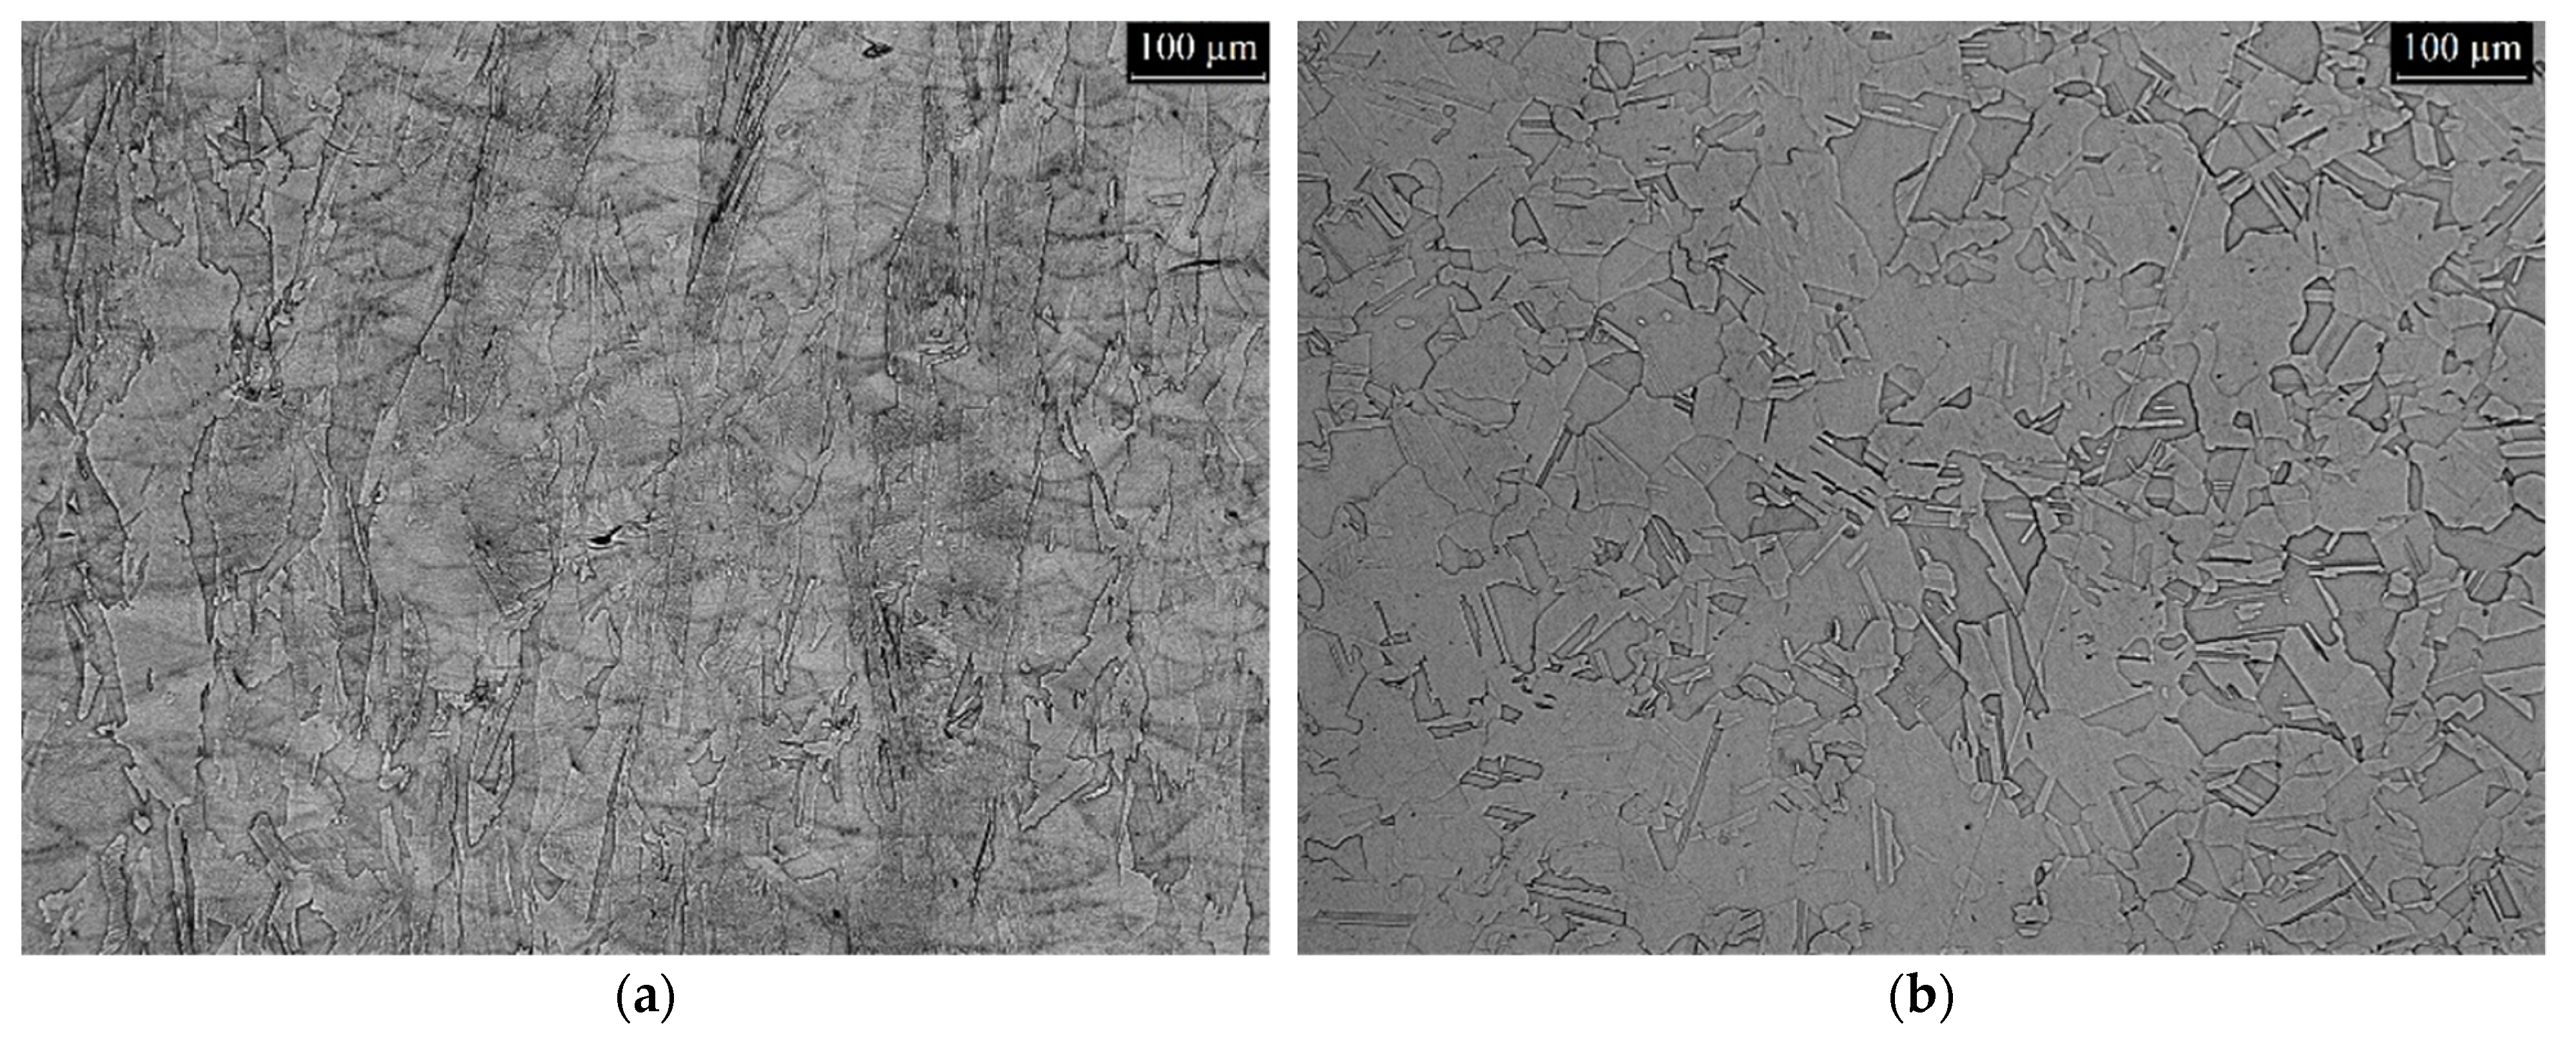
3.1. Microstructure of the Initial Conditions

The as-built IN625 samples revealed the melt pools and columnar grains orientated along the building direction (Figure 2a). These features were eliminated using the high-temperature solution-annealing treatment at 1150 °C for 2 h, which also started a recrystallization process. After solution annealing, the grains showed equiaxed shapes with average dimensions of around 80 µm, even if some smaller or bigger grains could be detected throughout the material (Figure 2b).
As demonstrated in Figure 2, a solution-annealing treatment is essential to dissolve the dendritic structures of the as-built material and to homogenize it. In addition, this heat treatment generates an isotropic structure thanks to the elimination of columnar grains, typical of the as-fabricated LPBF state. Further details about the microstructure characteristics of the as-built and solution-annealed conditions are reported in other scientific papers [12,23].

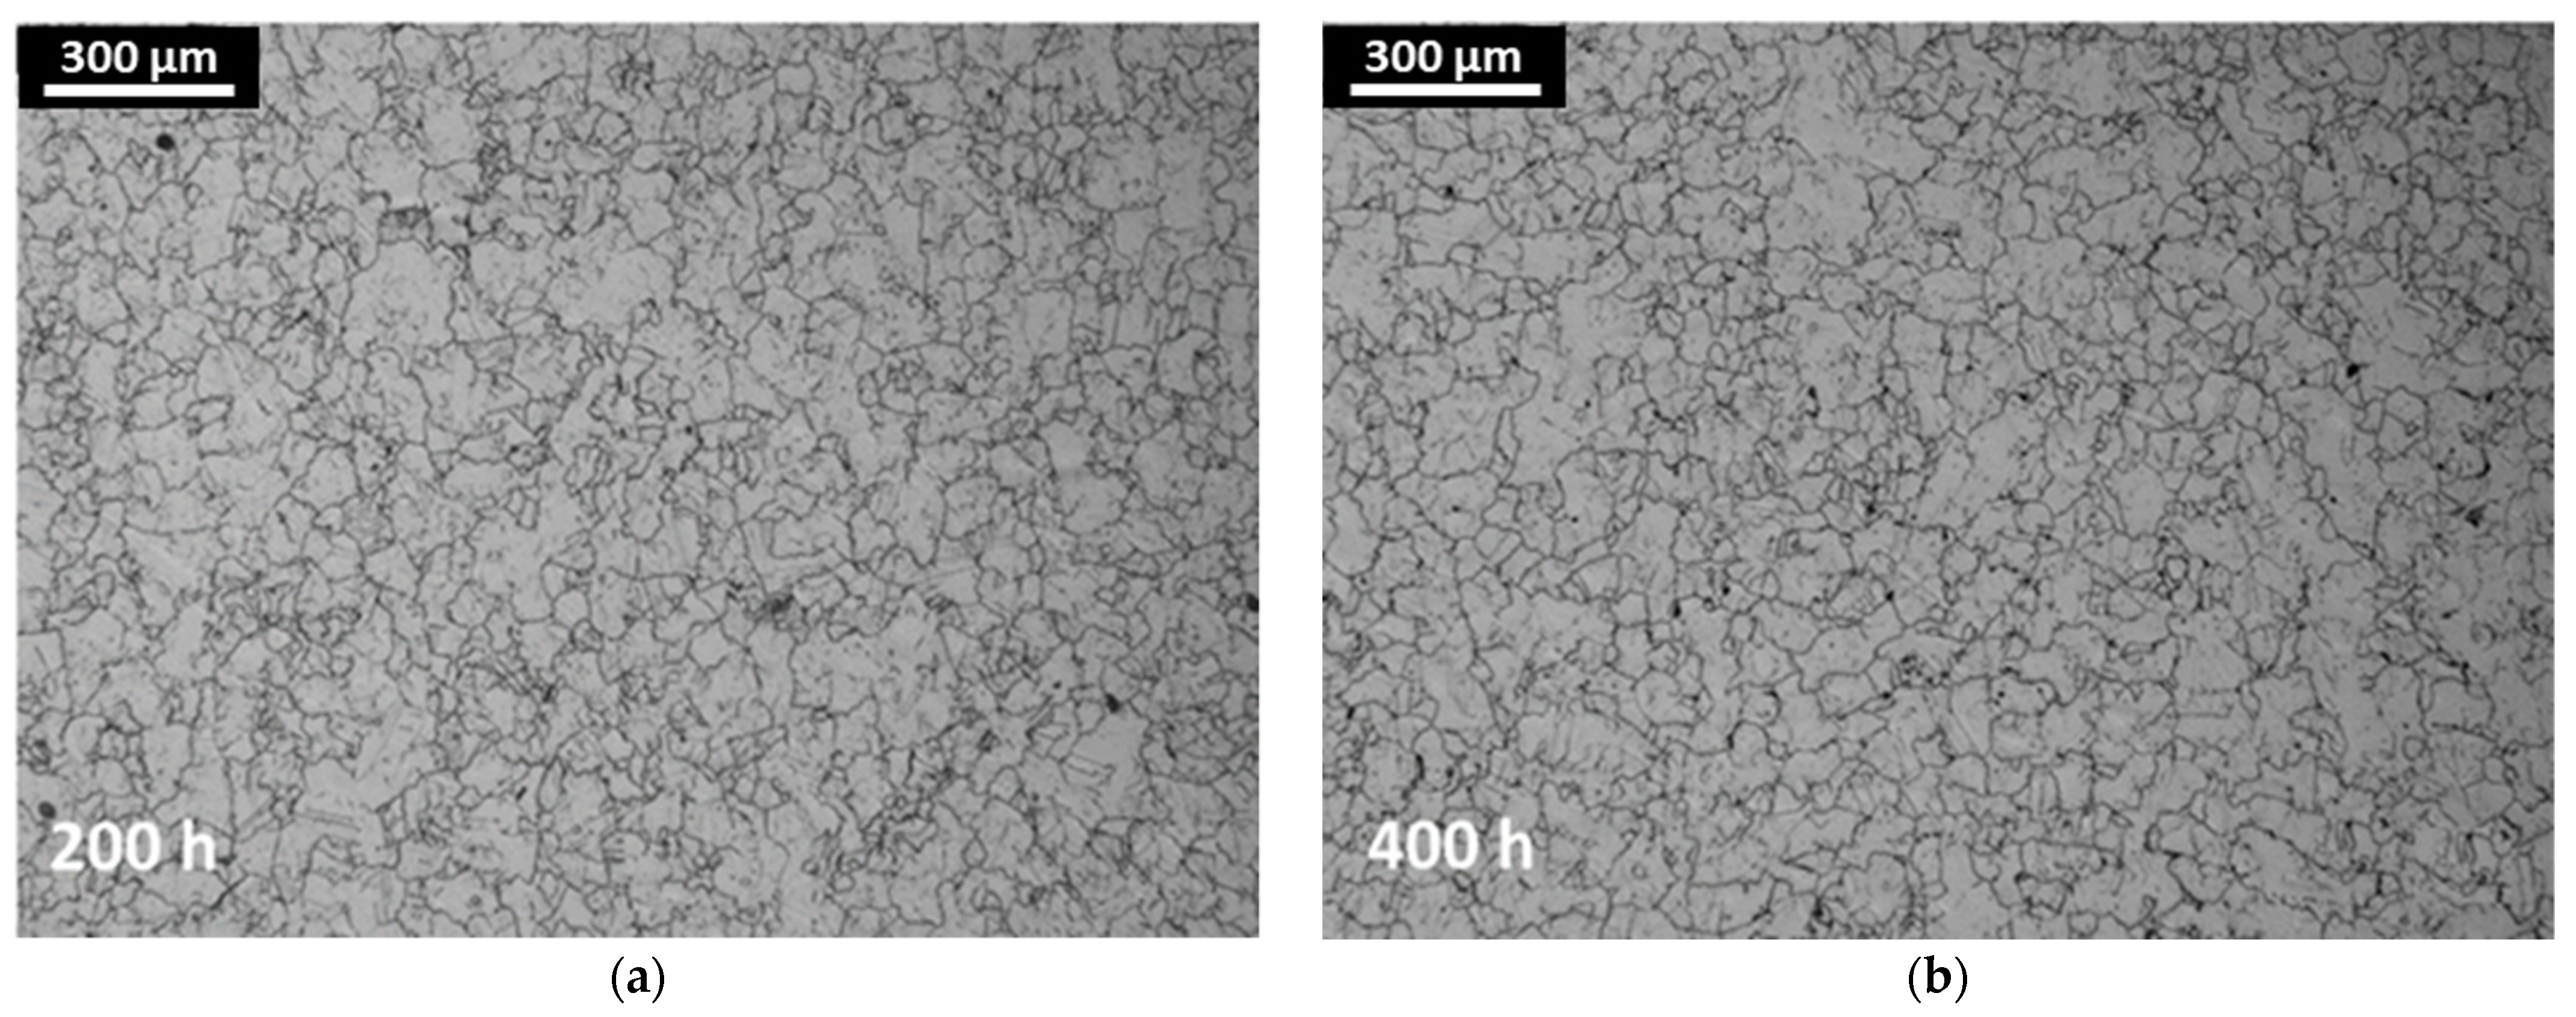
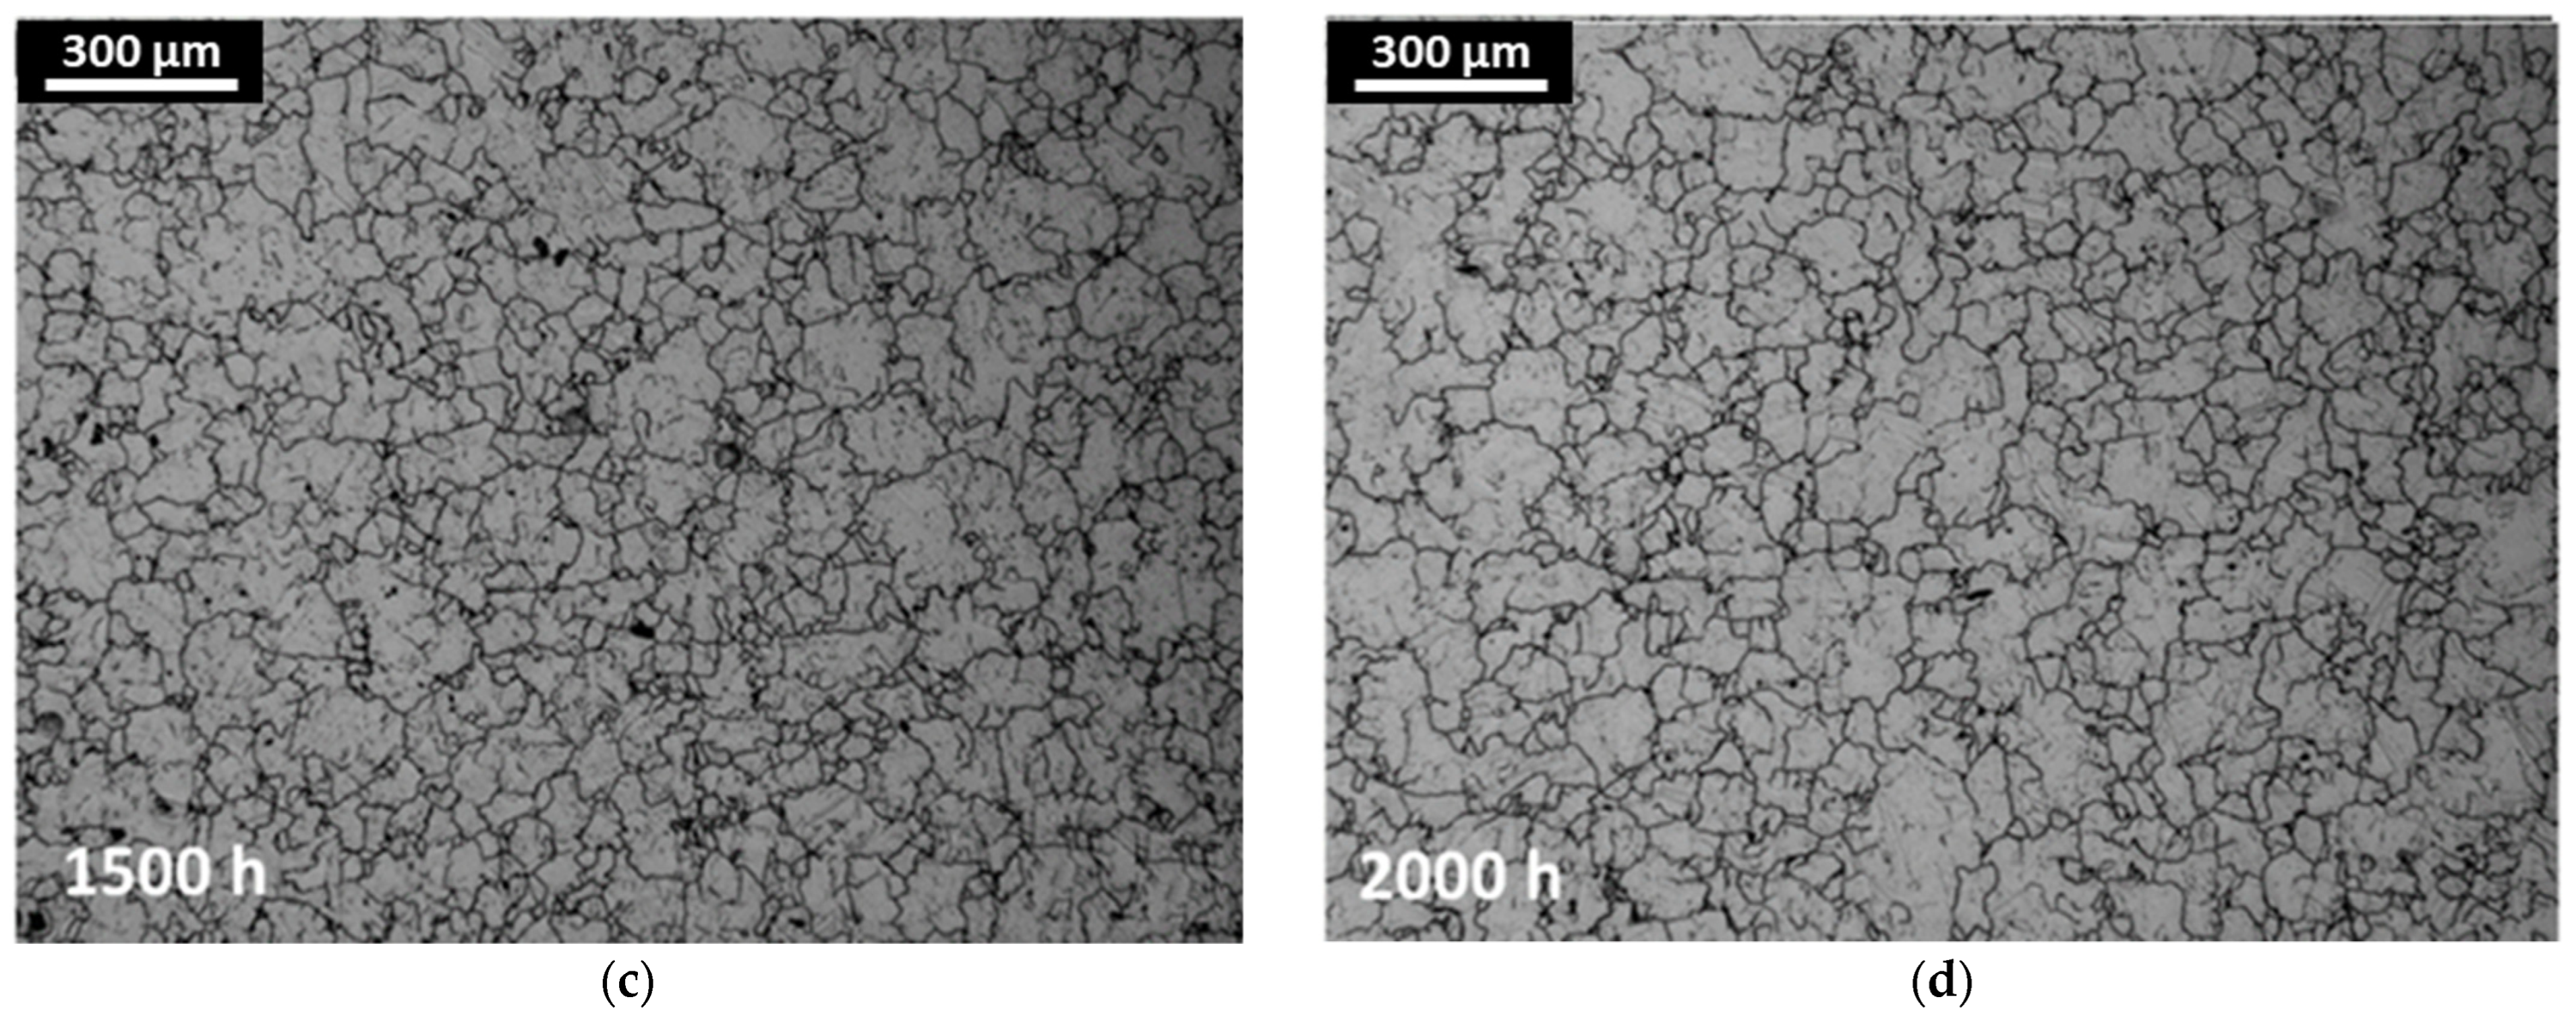
3.2. Microstructure Evolution under Thermal Exposure

Figure 3 shows how the microstructure evolves during thermal exposure at low magnification with a LOM.
The micrographs demonstrate two phenomena: the exposure did not alter the grain size, which remains the same over time with an average grain size of around 80 µm (Table 2). Nonetheless, the grain boundaries became progressively more evident as the etching was more efficient in dissolving the material.
The precipitation of secondary phases at the grain boundary could be the root hypothesis to explain this condition, which will be further discussed in the following paragraphs.

3.2.1. Evolution of δ Phases under Thermal Exposures

In Figure 4, it is possible to observe the microstructural evolution of LPBFed IN625 as the exposure time increases, or more specifically, after being exposed for 200, 400, 1500, and 2000 h, respectively. The phase formation and growth were assessed considering the experimental results and the TTT diagram consultable in the literature [1,25,26].
The etching was particularly severe at the grain boundaries. This fact was initially observed in the LOM pictures (Figure 3) and can be explained considering that the Nb diffusion is faster along the grain boundaries than within the grains. This condition allowed faster precipitation of the δ phase, depleting the surrounding area from alloying elements such as Nb, making these regions more prone to corrosion. After 200 h, the δ phase is visible only in the grooves provoked by the chemical etching (Figure 4a). Moreover, the etchant allows the observation of carbides inside the grains.
The needle-like δ phase is considerably larger in the grain boundaries, starting to form a film around the grains after 400 h (Figure 4b). This is because the growth of these particles is considerably faster than those of the γ″ phase and carbides, which are relatively stable. Moreover, some small needle-like δ phases became visible even within the grains.
Figure 4c displays LPBFed IN625 after 1500 h of thermal exposure. The intergranular δ phases presented a size similar to the previous condition. On the other hand, the intragranular γ″ phases started transforming into δ phases, reaching average dimensions of around 1 µm.
Finally, Figure 4d shows the final microstructure after 2000 h of thermal exposure. The fraction and the size of δ phases within the grains increased considerably since the γ″ phases continued to transform towards δ phases. The δ phases tend to cover the grain boundaries similarly to the previous step, also showing intragranular δ phases that reach the grain boundary.
In Figure 5, the evolution of the δ particles is summarized, separating them depending on nucleation and growth site. When particles were located at the grain boundary, they were referred to as GBP particles, whereas intragranular particles were labeled as IGP.
The chart shows the length change of the major axis of δ particles, modeled as elliptical particles. The most evident difference is the delay between the formation of δ phases in these two areas of the material. More specifically, the precipitation of the δ phases within the grain requires ca. 400 h before becoming appreciable due to a much slower diffusion rate of Nb in the grain lattice. Also quite evident is the difference in the size of the δ phases, from the micrographs and the chart. Furthermore, the faster Nb diffusion rate at the grain boundaries actively promotes the coarsening of δ particles at the grain boundaries, which is expected to be detrimental to the corrosion resistance and ductility of IN625. Finally, the plateau-like plots also indicate a substantial slowing in the particle coarsening after 400 and 1500 h, respectively.
For IN625 in the wrought state, the initial formation of intergranular δ phases was also reported after 200 h, whereas the transformation of the intragranular δ phase can occur after around 1000 h [4,6,19]. Therefore, these results indicate that the microstructure evolution is consistent with the traditional wrought version of the material.

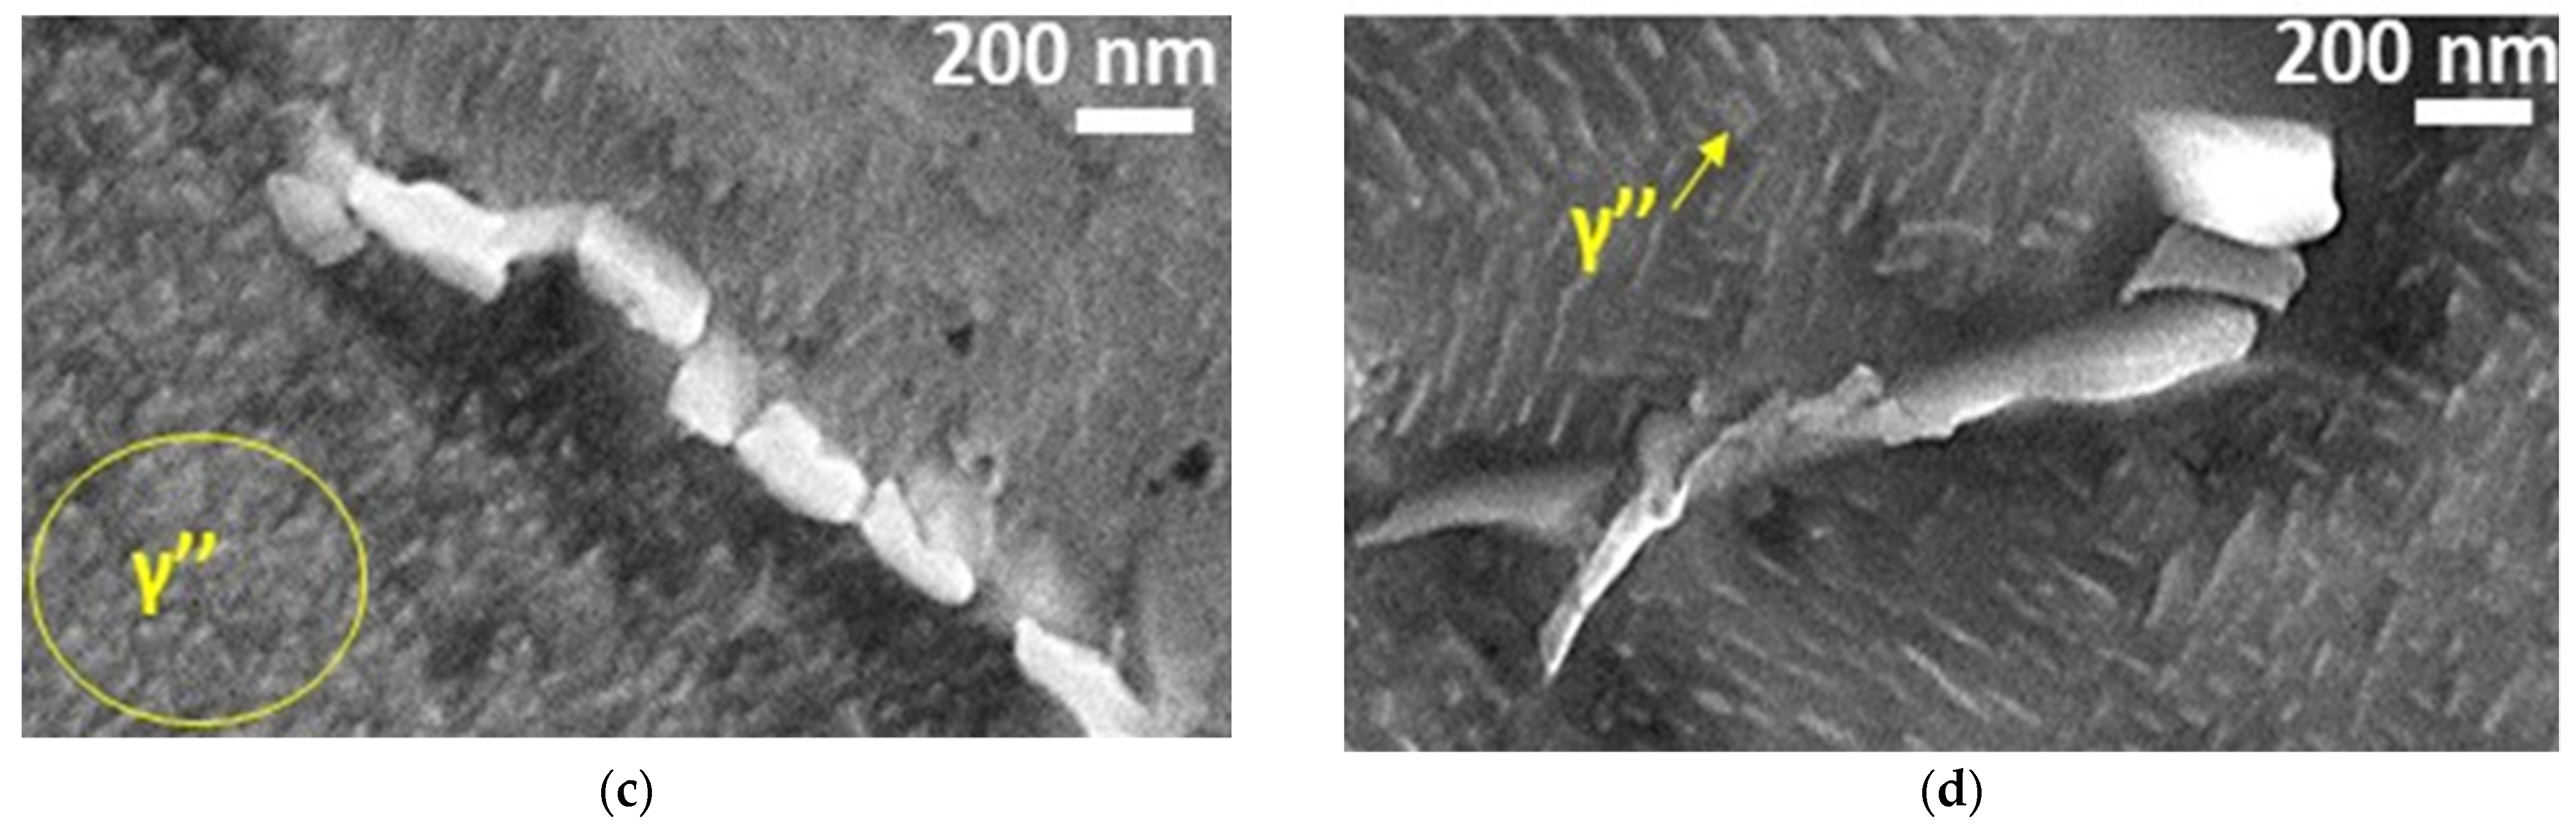
3.2.2. Evolution of γ″ Phase under Thermal Exposure

FESEM images at high magnification were acquired to observe the γ″ particles, which are well-known for being extremely small, i.e., with a diameter of less than 100 nm, as shown in Figure 6.
After 200 h (Figure 6a), the elliptical γ″ phase presented an average dimension of 31 ± 9 nm and then eventually coarsened to 46 ± 15 nm after 400 h (Figure 6b). Afterward, the intragranular γ″ phase started to transform into δ phases for 1000 and 2000 h (Figure 6c,d). This phenomenon was also reported in the literature for thermal exposure at 650 °C for traditional IN625 alloy [6,19] The dimensions of γ″ phase was 77 ± 20 nm and 83 ± 22 nm for 1000 and 200 h, respectively. These dimensions are also consistent with the work of Suave et al. [6] showing γ″ particles with dimensions of 67.4 nm and 93.5 nm in the wrought IN625 condition after thermal exposures for 1002 and 2012 h at the same temperature, respectively.
The homogenous distribution of the γ″ phases throughout the material highlights that the solution-annealing treatment effectively homogenizes the chemical composition and the LPBF material.

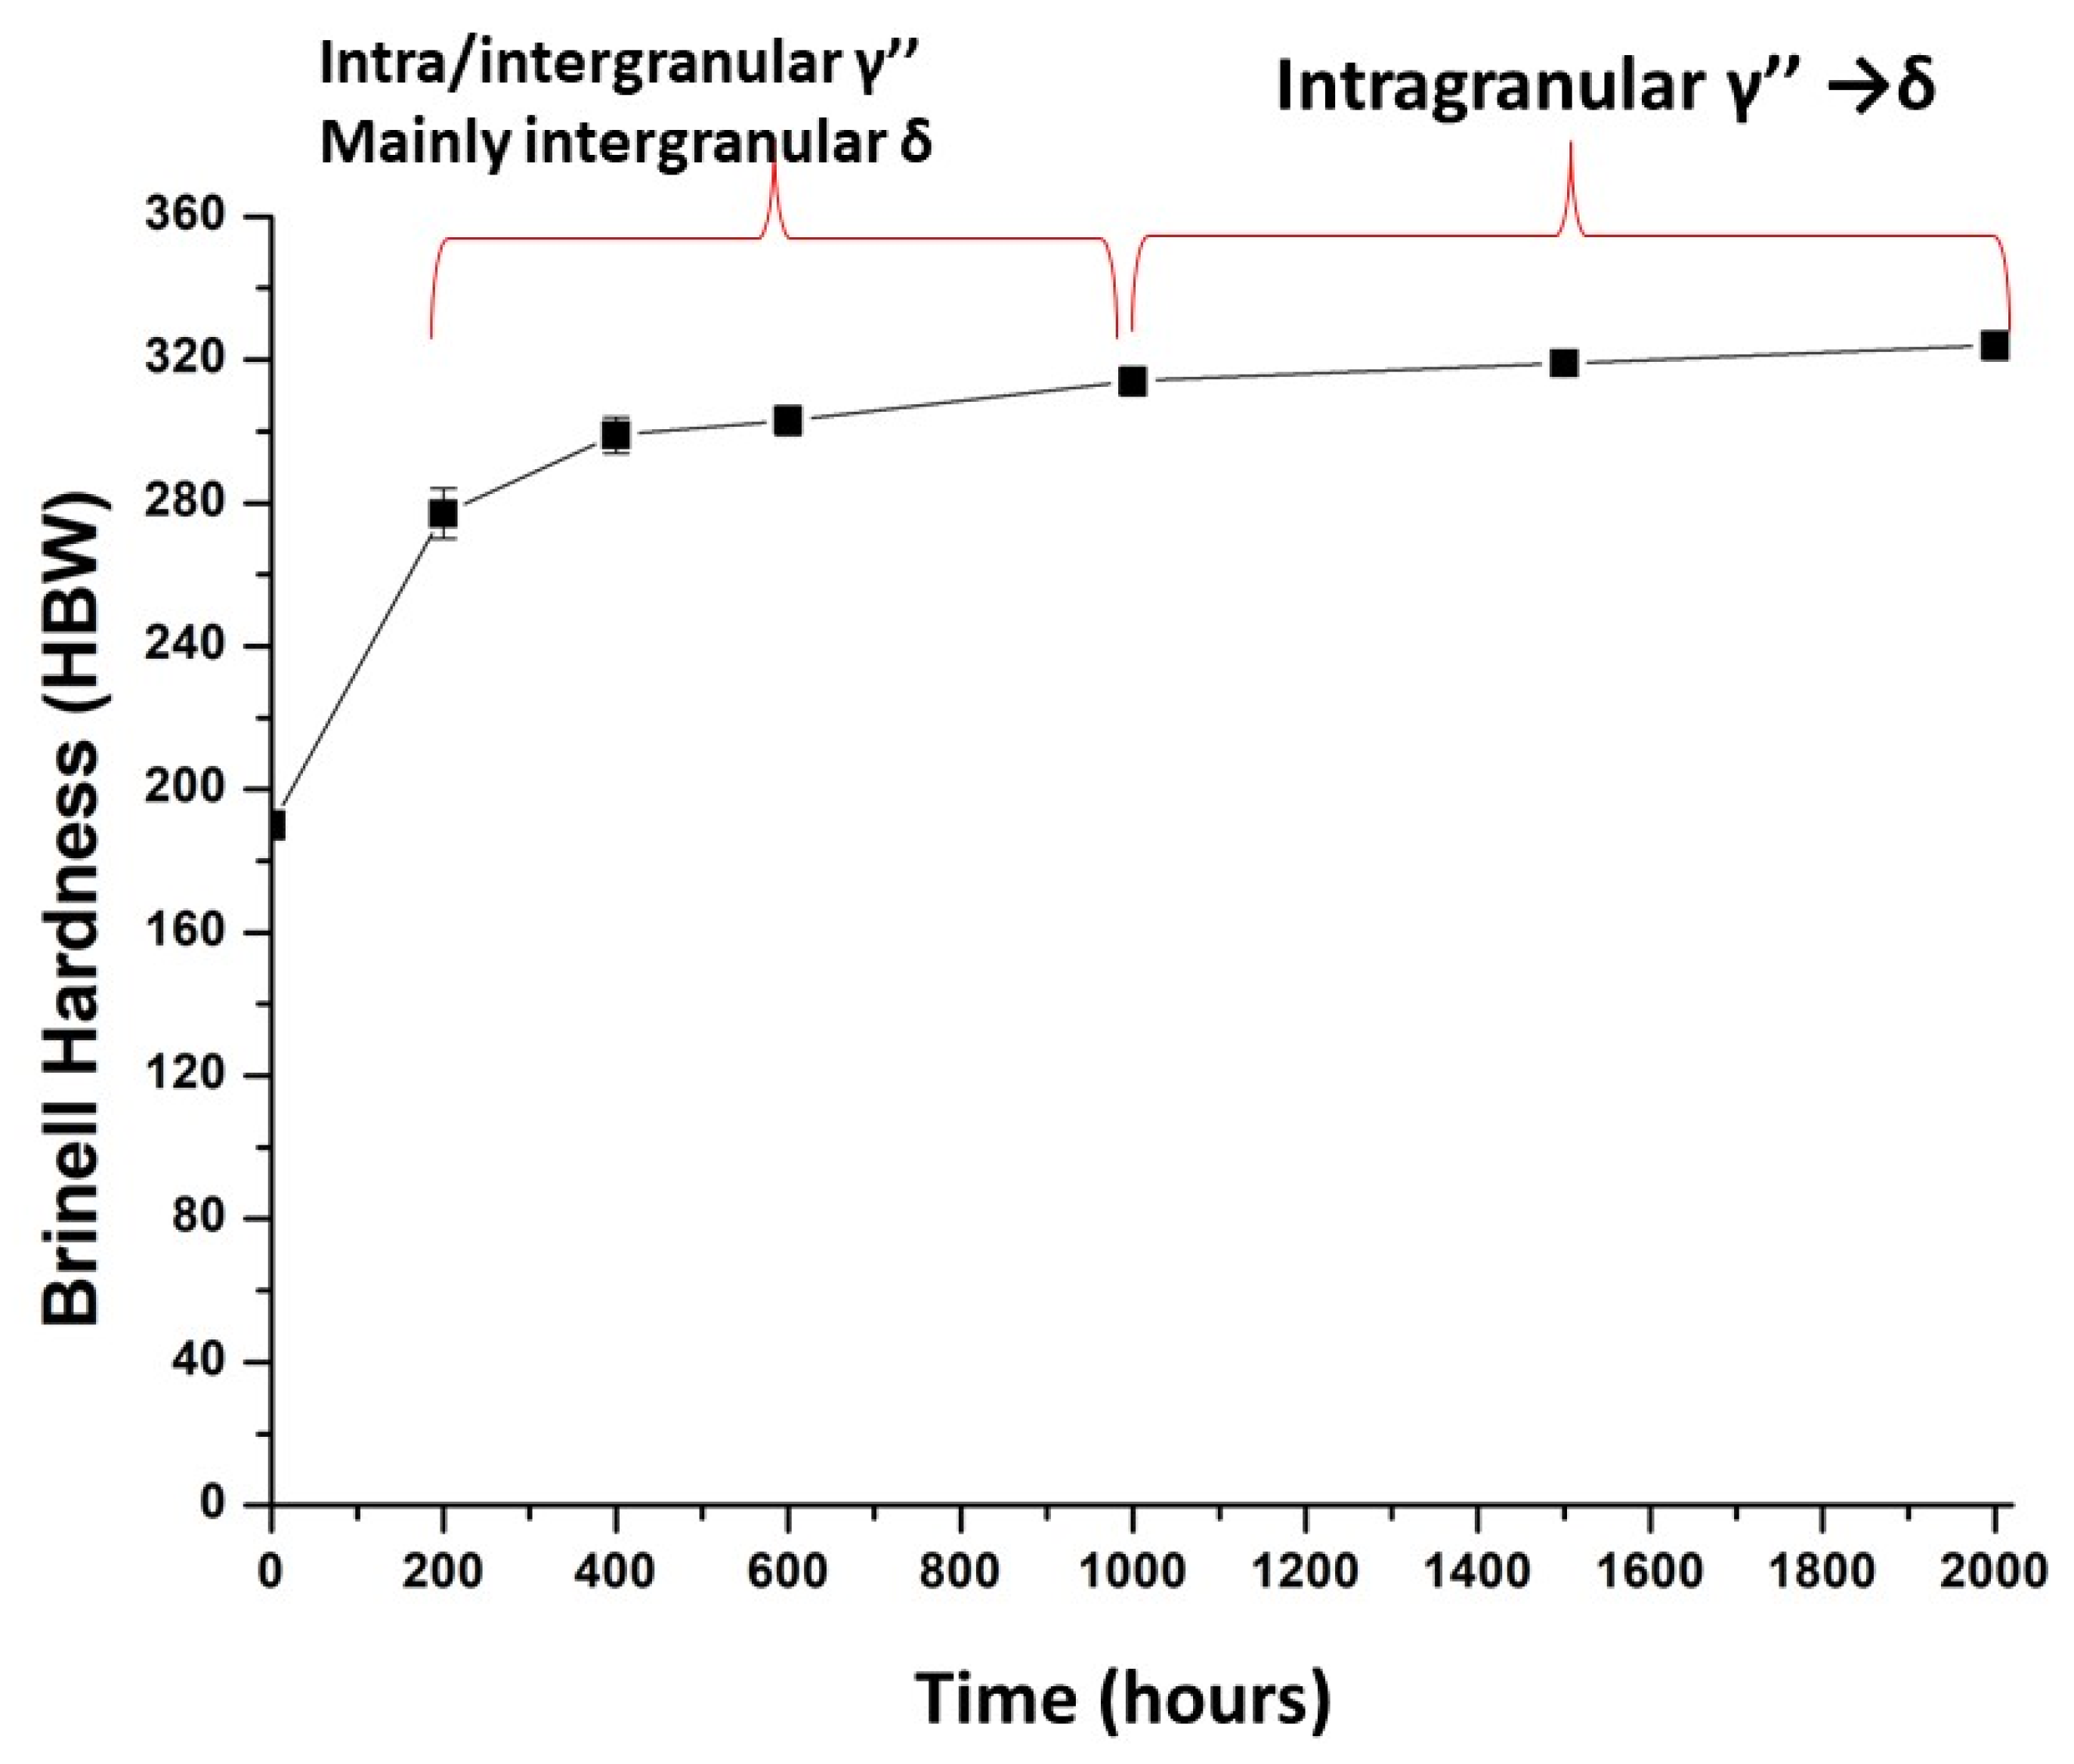
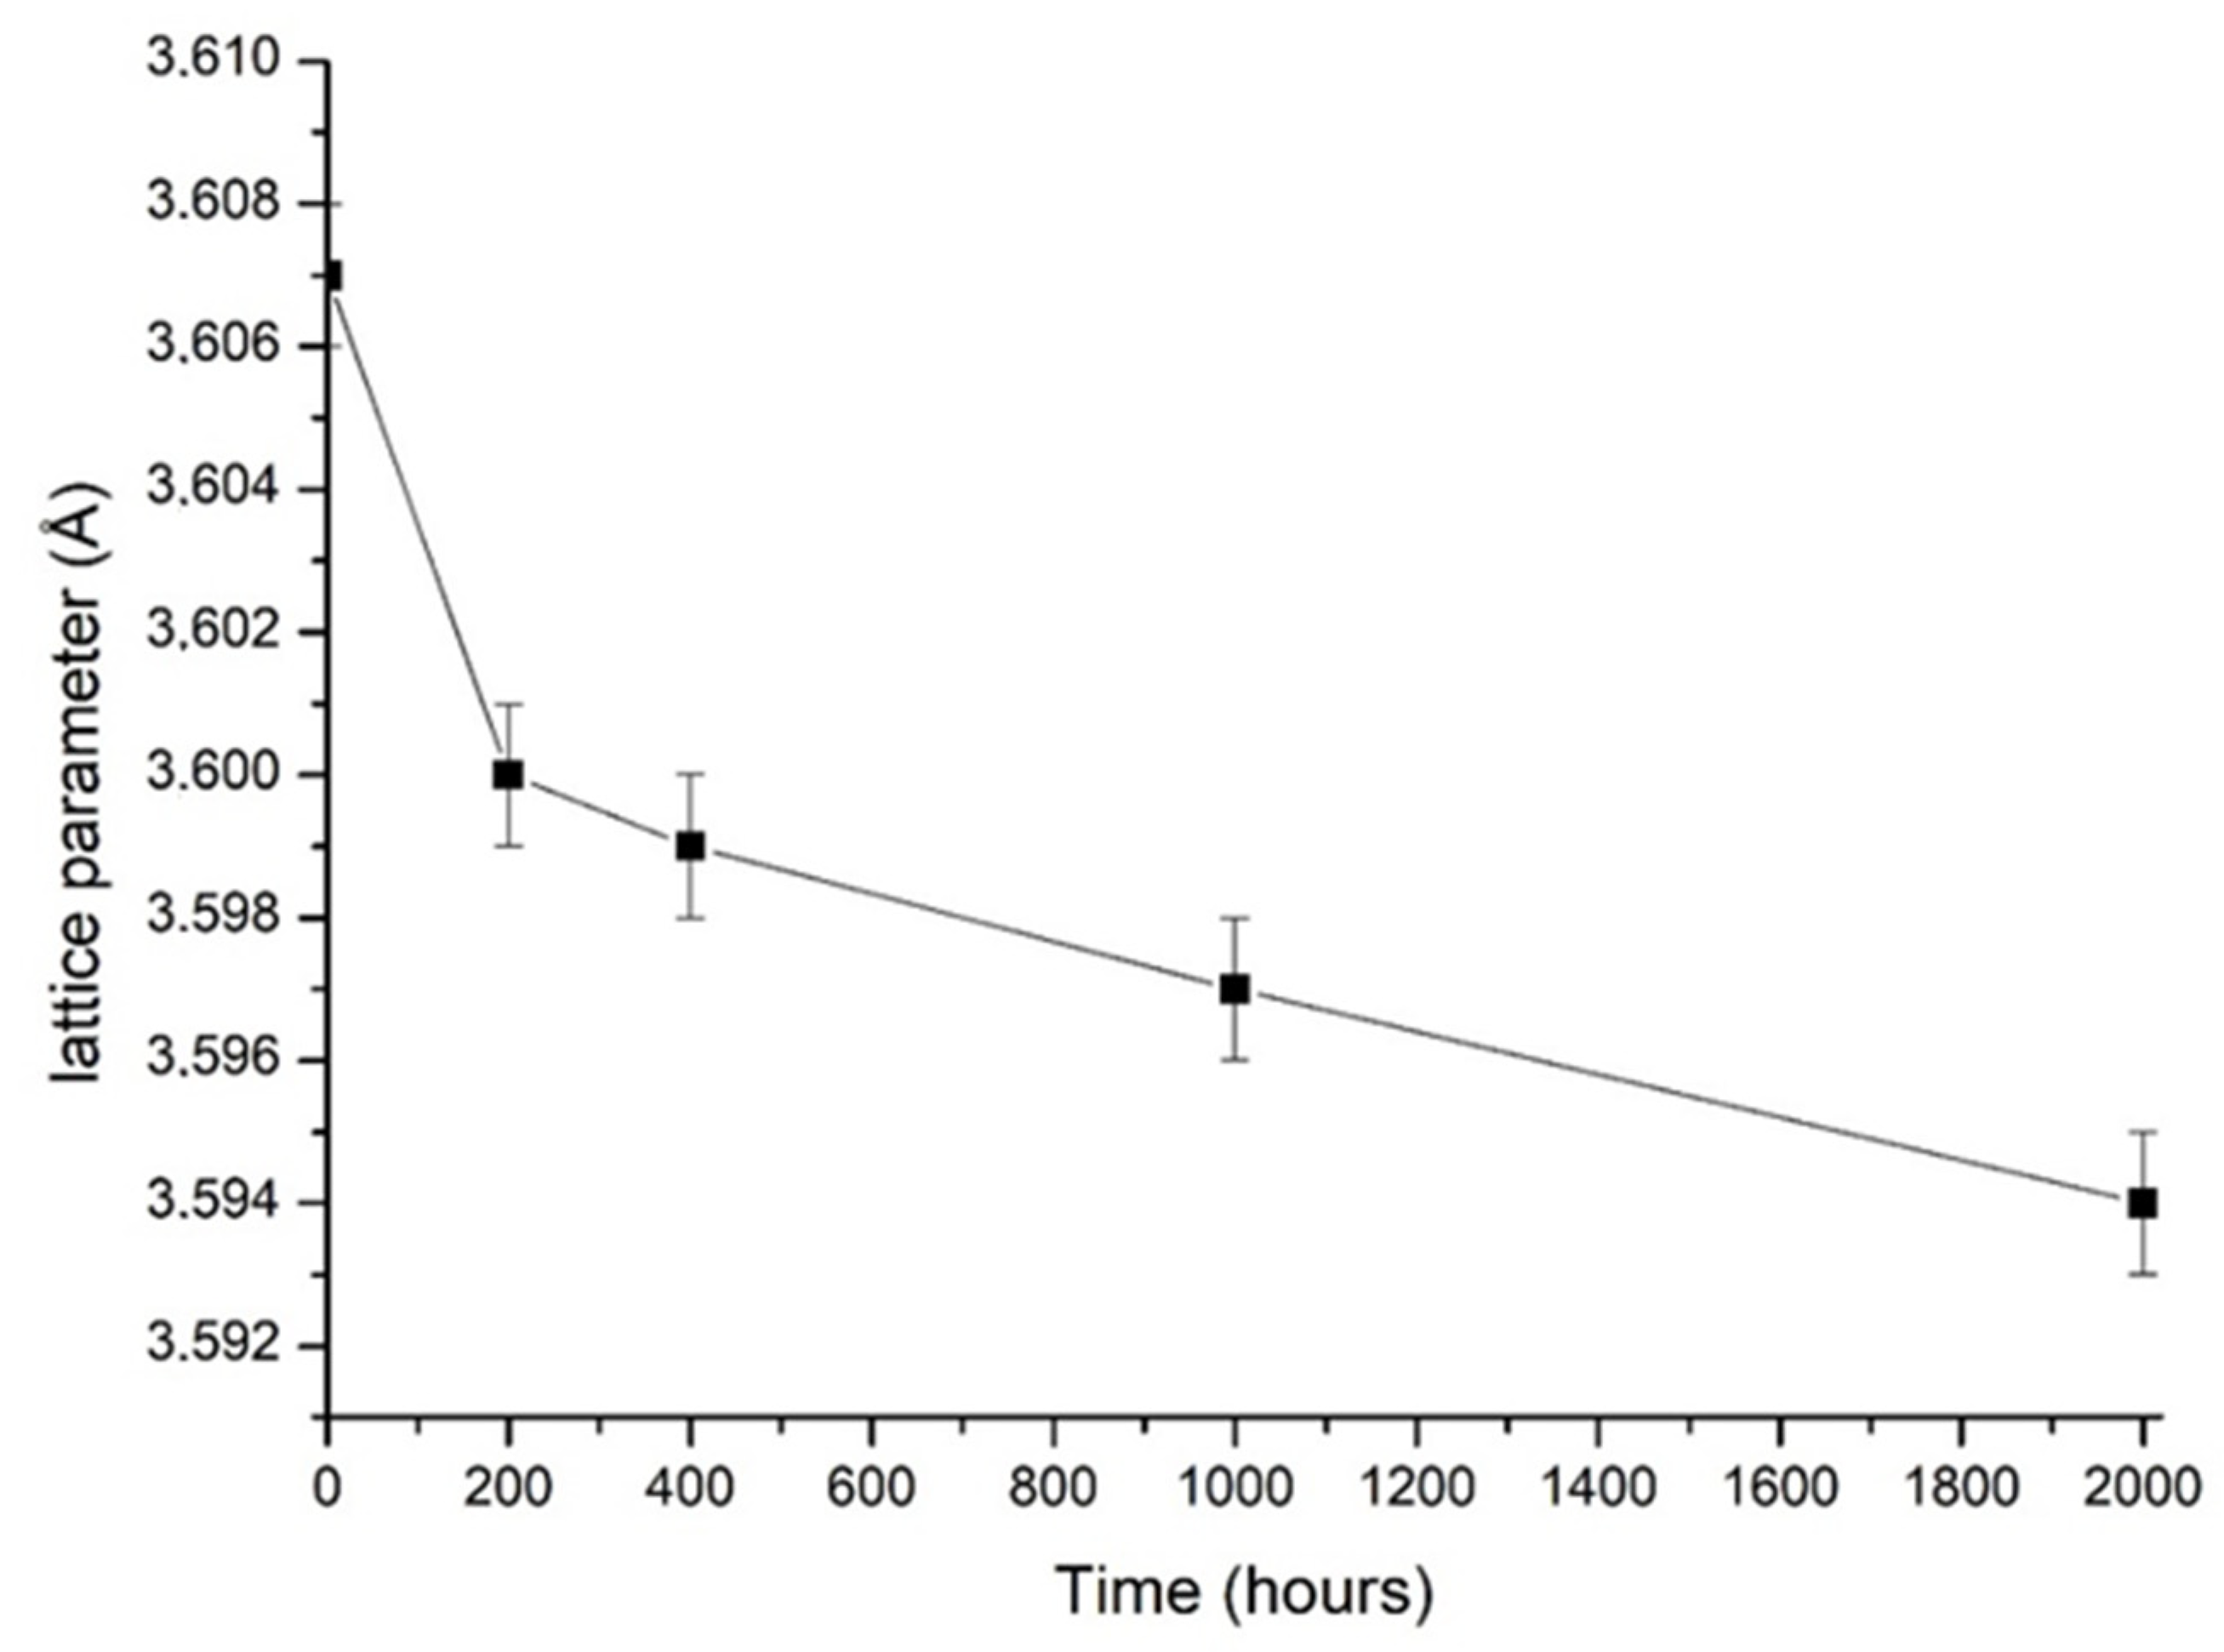
3.3. Hardness and γ Lattice Parameter Evolution

The hardness evolution is attributed to the formation of phases during prolonged thermal exposure at 650 °C (Figure 7). The abundant formation of the strengthening γ″ phases resulted in a drastic hardness improvement, which reached a value of 277 HBW after 200 h, i.e., corresponding to a 45% increment from the initial solution-annealed condition. After this step, hardness slowly increased due to the formation of new γ″ phases and the growth of δ phases along the grain boundaries up to around 1000 h, reaching a value of 314 HBW. After 1000 h, there was still a limited hardness enhancement associated with the intragranular γ″ transformation into δ phases, thus reaching a value of 324 HBW for 2000 h of treatment.
The strengthening effect of the δ phase is considerably less effective than that from γ″ phases. Nevertheless, the δ phase volume fraction rapidly increased during the long exposure, which is thought to have strongly contributed to the final hardness increment of the material.
The results can be compared with the hardness evolution of hot-rolled IN625 alloy under prolonged thermal exposures for different temperatures up to 1000 h [20]. The solution-annealed state was characterized by a hardness level of 232 HBW, meaning that hardness was slightly higher with respect to the starting condition presented in this study. This difference is more likely attributed to the heat treatment used for the hot-rolled material. More specifically, Kohler [20] used a lower temperature and a shorter time during solution annealing, i.e., 1120 °C and 50 min, whereas in the current study, 1150 °C and 2 h were used. For the hot-rolled condition, thermal exposure was performed at 600 and 700 °C for 1000 h, which increased hardness to 311 and 296 HBW, depending on the exposure temperature. These values are close to the value obtained for the prolonged thermal exposed LPBFed IN625 conditions for 1000 h in the current study (314 HBW).
The lattice parameters of the γ matrix of the solution-annealed LPBF condition presented the largest lattice parameters (Figure 8), which is in line with the value reported for the solution-annealed IN625 in the literature [27]. The thermal exposure involved a reduction of the γ lattice parameter (Figure 8), which is mainly caused by the depletion of Ni and Nb used for the formation and growth of γ″ and δ phases from the γ matrix.
This lattice parameter reduction was marked from 0 to 200 h. Then, in the 200–2000 h range, the lattice parament tended to decrease more slowly. The strong variation in the γ lattice parameter revealed that the more extensive formation of the γ″ phases occurred during the first 200 h. Later, γ″ particle growth became the leading phenomenon rather than its precipitation. Therefore, the further reduction of the γ lattice parameter can be chiefly associated with the growth of the γ″ phase and the formation of the stable δ phase.
Moreover, the intense precipitation of the γ″ phase complies with the greatest hardness increment observed during the initial 200 h. Other studies published on heat-treated superalloys reported the reduction of the γ matrix lattice parameter due to the formation of phases under thermal exposures [2,11].

4. Conclusions

The study focuses on the microstructure and hardness evolution of solution-annealed LPBFed IN625 samples due to the formation and growth of γ″ and δ phases under prolonged thermal exposure at 650 °C up to 2000 h. The main conclusions can be drawn:
  • The thermal exposure did not activate the grain size growth in the material. For this reason, all the microstructure and hardness modifications were ascribed to newly formed phases.
  • The formation of γ″ phases drastically increased the hardness, reducing the lattice parameters of the γ matrix after only 200 h. Afterward, the hardness slowly increased with time up to 2000 h. This is mainly attributed to the γ″ phase transformation into intergranular and intragranular δ phases, which have less of a strengthening effect than the γ″ particles.
  • The formation of δ phases appeared along the grain boundaries after 200 h of thermal exposure. Moreover, intragranular δ phases could be observed after 1000 and 2000 h of thermal exposure. This is mainly caused by the transformation of γ″ phases into δ phases. The δ phases presented larger dimensions along the grain boundaries than inside the grains due to the faster Nb diffusion in these areas.
These results indicate that the microstructure evolution is consistent with the traditional heat-treated wrought version of the material.

Author Contributions

Conceptualization, F.M., G.M., E.B., A.A., P.F., D.U. and S.B.; methodology, F.M., G.M., E.B., A.A., P.F., D.U. and S.B.; validation, F.M., G.M. and E.B.; investigation, F.M.; data curation, F.M., G.M. and E.B.; writing—original draft preparation, F.M.; writing—review and editing, G.M. and E.B.; visualization, F.M.; supervision, G.M., E.B., A.A., D.U. and S.B.; funding acquisition, P.F. All authors have read and agreed to the published version of the manuscript.

Funding

This research received no external funding.

Data Availability Statement

The data presented in this study are available on request from the corresponding author.

Conflicts of Interest

The authors declare no conflict of interest.

References

  1. Floreen, S.; Fuchs, G.E.; Yang, W.J. The Metallurgy of Alloy 625. In Superalloys 718, 625, 706 and Various Derivatives; Loria, E.A., Ed.; The Minerals, Metals & Materials Society: Pittsburgh, PA, USA, 1994; pp. 13–37. [Google Scholar]
  2. Li, S.; Wei, Q.; Shi, Y.; Zhu, Z.; Zhang, D. Microstructure Characteristics of Inconel 625 Superalloy Manufactured by Selective Laser Melting. J. Mater. Sci. Technol. 2015, 31, 946–952. [Google Scholar] [CrossRef]
  3. Paul, C.P.; Ganesh, P.; Mishra, S.K.; Bhargava, P.; Negi, J.; Nath, A.K. Investigating Laser Rapid Manufacturing for Inconel-625 Components. Opt. Laser Technol. 2007, 39, 800–805. [Google Scholar] [CrossRef]
  4. Shankar, V.; Bhanu Sankara Rao, K.; Mannan, S.L. Microstructure and Mechanical Properties of Inconel 625 Superalloy. J. Nucl. Mater. 2001, 288, 222–232. [Google Scholar] [CrossRef]
  5. Suave, L.M.; Bertheau, D.; Cormier, J.; Villechaise, P.; Soula, A.; Hervier, Z.; Laigo, J. Impact of Microstructural Evolutions during Thermal Aging of Alloy 625 on Its Monotonic Mechanical Properties. MATEC Web Conf. 2014, 14, 21001. [Google Scholar] [CrossRef] [Green Version]
  6. Suave, L.M.; Cormier, J.; Villechaise, P.; Soula, A.; Hervier, Z.; Bertheau, D.; Laigo, J. Microstructural Evolutions during Thermal Aging of Alloy 625: Impact of Temperature and Forming Process. Metall. Mater. Trans. A Phys. Metall. Mater. Sci. 2014, 45, 2963–2982. [Google Scholar] [CrossRef]
  7. Ezugwu, E.O. Key Improvements in the Machining of Difficult-to-Cut Aerospace Superalloys. Int. J. Mach. Tools Manuf. 2005, 45, 1353–1367. [Google Scholar] [CrossRef]
  8. Attallah, M.M.; Jennings, R.; Wang, X.; Carter, L.N. Additive Manufacturing of Ni-Based Superalloys: The Outstanding Issues. MRS Bull. 2016, 41, 758–764. [Google Scholar] [CrossRef]
  9. Herzog, D.; Seyda, V.; Wycisk, E.; Emmelmann, C. Additive Manufacturing of Metals. Acta Mater. 2016, 117, 371–392. [Google Scholar] [CrossRef]
  10. Inaekyan, K.; Kreitcberg, A.; Turenne, S.; Brailovski, V. Microstructure and Mechanical Properties of Laser Powder Bed-Fused IN625 Alloy. Mater. Sci. Eng. A 2019, 768, 138481. [Google Scholar] [CrossRef]
  11. Kreitcberg, A.; Brailovski, V.; Turenne, S. Elevated Temperature Mechanical Behavior of IN625 Alloy Processed by Laser Powder-Bed Fusion. Mater. Sci. Eng. A 2017, 700, 540–553. [Google Scholar] [CrossRef]
  12. Kreitcberg, A.; Brailovski, V.; Turenne, S. Effect of Heat Treatment and Hot Isostatic Pressing on the Microstructure and Mechanical Properties of Inconel 625 Alloy Processed by Laser Powder Bed Fusion. Mater. Sci. Eng. A 2017, 689, 1–10. [Google Scholar] [CrossRef]
  13. Carter, L.N.; Wang, X.; Read, N.; Khan, R.; Aristizabal, M.; Essa, K.; Attallah, M.M. Process Optimisation of Selective Laser Melting Using Energy Density Model for Nickel Based Superalloys. Mater. Sci. Technol. 2016, 32, 657–661. [Google Scholar] [CrossRef]
  14. Fang, X.Y.; Li, H.Q.; Wang, M.; Li, C.; Guo, Y.B. Characterization of Texture and Grain Boundary Character Distributions of Selective Laser Melted Inconel 625 Alloy. Mater. Charact. 2018. [Google Scholar] [CrossRef]
  15. Li, C.; White, R.; Fang, X.Y.; Weaver, M.; Guo, Y.B. Microstructure Evolution Characteristics of Inconel 625 Alloy from Selective Laser Melting to Heat Treatment. Mater. Sci. Eng. A 2017, 705, 20–31. [Google Scholar] [CrossRef]
  16. Lass, E.A.; Stoudt, M.R.; Katz, M.B.; Williams, M.E. Precipitation and Dissolution of δ and Γ″ during Heat Treatment of a Laser Powder-Bed Fusion Produced Ni-Based Superalloy. Scr. Mater. 2018, 154, 83–86. [Google Scholar] [CrossRef]
  17. Lindwall, G.; Campbell, C.E.; Lass, E.A.; Zhang, F.; Stoudt, M.R.; Allen, A.J.; Levine, L.E. Simulation of TTT Curves for Additively Manufactured Inconel 625. Metall. Mater. Trans. A 2019, 50, 457–467. [Google Scholar] [CrossRef] [Green Version]
  18. Stoudt, M.R.; Lass, E.A.; Ng, D.S.; Williams, M.E.; Zhang, F.; Campbell, C.E.; Lindwall, G.; Levine, L.E. The Influence of Annealing Temperature and Time on the Formation of δ-Phase in Additively-Manufactured Inconel 625. Metall. Mater. Trans. A 2018, 49A, 3028–3037. [Google Scholar] [CrossRef] [Green Version]
  19. Malej, S.; Medved, J.; Tehovnik, F.; Godec, M. Microstructural Evolution of Inconel 625 During Thermal Aging. Metabk 2017, 56, 319–322. [Google Scholar]
  20. Kohler, M. Effect of the Elevated-Temperature-Precpitation in Alloy 625 on Properties and Microstructure. In Superalloys 718, 625, 706 and Various Derivatives; Loria, E.A., Ed.; TMS (The Minerals, Metals & Materials Society): Pittsburgh, PA, USA, 1991; pp. 363–374. [Google Scholar]
  21. Marchese, G.; Bassini, E.; Parizia, S.; Manfredi, D.; Ugues, D.; Lombardi, M.; Fino, P.; Biamino, S. Role of the Chemical Homogenization on the Microstructural and Mechanical Evolution of Prolonged Heat-Treated Laser Powder Bed Fused Inconel 625. Mater. Sci. Eng. A 2020, 796, 140007. [Google Scholar] [CrossRef]
  22. Gola, K.; Dubiel, B.; Kalemba-Rec, I. Microstructural Changes in Inconel 625 Alloy Fabricated by Laser-Based Powder Bed Fusion Process and Subjected to High-Temperature Annealing. J. Mater. Eng. Perform. 2020, 29, 1528–1534. [Google Scholar] [CrossRef] [Green Version]
  23. Marchese, G.; Parizia, S.; Rashidi, M.; Saboori, A.; Manfredi, D.; Ugues, D.; Lombardi, M.; Hryha, E.; Biamino, S. The Role of Texturing and Microstructure Evolution on the Tensile Behavior of Heat-Treated Inconel 625 Produced via Laser Powder Bed Fusion. Mater. Sci. Eng. A 2020, 769, 138500. [Google Scholar] [CrossRef]
  24. Donachie, M.J.; Donachie, S.J. Superalloys: A Technical Guide, 2nd ed.; ASM International: Materials Park, OH, USA, 2002; ISBN 0871707497. [Google Scholar]
  25. Suave, L.M.; Cormier, J.; Bertheau, D.; Villechaise, P.; Soula, A.; Hervier, Z.; Hamon, F. High Temperature Low Cycle Fatigue Properties of Alloy 625. Mater. Sci. Eng. A 2016, 650, 161–170. [Google Scholar] [CrossRef]
  26. Shoemaker, L.E. Alloys 625 and 725: Trends in Properties and Applications. In Superalloys 718, 625, 706 and Derivatives 2005; Loria, E.A., Ed.; TMS (The Minerals, Metals & Materials Society): Pittsburgh, PA, USA, 2005; pp. 409–418. [Google Scholar]
  27. Rai, S.K.; Kumar, A.; Shankar, V.; Jayakumar, T.; Rao, K.B.S.; Raj, B. Characterization of Microstructures in Inconel 625 Using X-Ray Diffraction Peak Broadening and Lattice Parameter Measurements. Scr. Mater. 2004, 51, 59–63. [Google Scholar] [CrossRef]
Figure 1. SEM image of the powder (a) and particle size distribution (b), where is reported the volume distribution (red line) and the cumulative one (blue line).
Metals 12 01916 g001
Figure 2. LOM images of the chemical etched IN625: (a) in the as-fabricated version, (b) in the solution-annealed condition.
Metals 12 01916 g002
Figure 3. LOM pictures of samples after (a) 200, (b) 400, (c) 1500, and (d) 2000 h. Grain boundaries become more evident as the thermal exposure time increases.
Metals 12 01916 g003aMetals 12 01916 g003b
Figure 4. SEM images of the detailed analysis of the grain boundaries after thermal exposure at 650 °C for: (a) 200, (b) 400, (c) 1500, and (d) 2000 h.
Metals 12 01916 g004
Figure 5. Evolution of δ phase precipitation along the grain boundaries (GBP) and inside the grains (IGP) evaluated by image analysis.
Metals 12 01916 g005
Figure 6. FESEM images of samples after (a) 200, (b) 400, (c) 1000, and (d) 2000 h of prolonged thermal exposure.
Metals 12 01916 g006aMetals 12 01916 g006b
Figure 7. Hardness evolution of the solution-annealed LPBFed IN625 for different times at 650 °C.
Metals 12 01916 g007
Figure 8. Lattice parameter of the γ matrix under prolonged thermal exposure at 650 °C.
Metals 12 01916 g008
Table 1. Chemical composition of powders according to manufacturer datasheet.
Element (%)CrMoNbFeTi and AlCoCTaSi and MnP and S
Amount (w%)20–238–103.15–4.15<5<0.4<1<0.1<0.05<0.5<0.015
Table 2. Average grain size measurement with the exposure time.
Exposure Time (h)Average Grain Size (µm)
20081 ± 24
200083 ± 26
Publisher’s Note: MDPI stays neutral with regard to jurisdictional claims in published maps and institutional affiliations.

