Article

Novel Zr-Rich Alloys of Ternary Ti-Zr-Nb System with Large Superelastic Recovery Strain

1
National University of Science and Technology “MISIS”, 119049 Moscow, Russia
2
Laboratory of Mechanics of Bulk Nanomaterials, St. Petersburg State University, 199034 St. Petersburg, Russia
3
A.V. Shubnikov Institute of Crystallography, FSRC “Crystallography and Photonics” RAS, 119333 Moscow, Russia
*
Author to whom correspondence should be addressed.
Metals 2022, 12(2), 185; https://doi.org/10.3390/met12020185
Submission received: 23 December 2021 / Revised: 13 January 2022 / Accepted: 14 January 2022 / Published: 19 January 2022
(This article belongs to the Special Issue Novel Shape Memory Alloys)

Abstract

:
Four novel superelastic alloys, Ti-41Zr-12Nb, Ti-42Zr-11Nb, Ti-43Zr-10Nb, Ti-44Zr-10Nb (at.%), were obtained and studied in terms of their microstructure and mechanical properties. The obtained alloys were subjected to thermomechanical treatment, providing alloys with a pronounced superelastic behavior. Materials phase composition and microstructure were studied using XRD and SEM methods. Based on the XRD results, maximum lattice strains in the 011 β direction were calculated as 5.9%, 6.3%, 7.5%, and 7.2% for Ti-41Zr-12Nb, Ti-42Zr-11Nb, Ti-43Zr-10Nb, and Ti-44Zr-10Nb alloys, respectively. Mechanical properties of the thermomechanically-treated alloys were studied by Vickers microhardness testing, static tensile testing, and superelastic mechanical cycling. The maximum superelastic recovery strains attained at room temperature was 3.7%, 1.9%, 3.2%, and 3.0% for the Ti-41Zr-12Nb, Ti-42Zr-11Nb, Ti-43Zr-10Nb, and Ti-44Zr-10Nb alloys, respectively. Ti-41Zr-12Nb alloy demonstrated the highest ductility, with relative elongation to failure of over 20%, combined with the total recovery strain of more than 6%. Obtained results indicate that Ti-41Zr-12Nb is one the most promising alloys of the Ti-Zr-Nb system, with quite perfect superelastic behavior at room temperature.

1. Introduction

The creation of completely biocompatible metallic materials is one of the most promising areas of modern materials science [1,2]. The demand for such materials is growing since the percentage of the elderly population of the Earth is increasing, and, accordingly, the number of people more susceptible to various bone injuries is increasing [3,4,5,6]. In the reconstruction of bone tissues, a special role is assigned to metallic biomaterials. One of the most popular bone replacement materials is titanium. Displaying biochemical inertness due to a stable surface oxide film, it, nevertheless, does not meet the requirements of modern medicine in terms of biomechanical compatibility [7,8,9]. On the other hand, Ti-Ni, discovered back in the 1960s, has excellent biomechanical compatibility with bone tissue but is not suitable for long-term use in the body, since Ni can cause an adverse effect [10,11,12,13,14,15,16].
The metallic material designed for bone replacement should meet the biomechanical compatibility requirements. It suggests that the mechanical properties of the implant are close to those of the replaced bone tissue. For this reason, special attention is paid to superelastic alloys capable of accumulating significant deformation reversibly [17]. In particular, Ti-Nb- and Ti-Zr-based shape memory alloys (SMA) are the most attractive due to their unique combination of high corrosion resistance, low Young’s modulus, and superelastic mechanical behavior, which make them a promising material for biomedical devices [18,19,20,21,22].
Recently, novel Ti-Zr-Nb alloys with high Zr concentration (41 at.% Zr combined with 8–10 at.% Nb) were designed due to the possibility of reaching theoretical recovery strain limits as high as 8% [23,24,25]. Among known issues hindering the development of these alloys is the requirement of optimum phase composition at room temperature (RT) to demonstrate pronounced superelastic behavior. It was proven earlier that Ti-41Zr-10Nb alloy, despite its high transformation strain, suffers from the stable martensite at RT, which leads to a considerable residual strain [26]. One approach to solve this problem is to introduce additional alloying elements, such as Sn, ensuring desired phase composition and, hence, high functional properties [27,28,29]. Another approach is to tune chemical composition within the ternary Ti-Zr-Nb system. It was suggested that increasing Zr and/or Nb contents of the Ti-41Zr-10Nb alloy by 1–3 at.% would be beneficial for its superelastic behavior at RT [26]. Therefore, this work is aimed at the study of structure and functional properties of novel higher Zr- or Nb-alloyed Ti-41Zr-12Nb, Ti-42Zr-11Nb, Ti-43Zr-10Nb, and Ti-44Zr-10Nb SMAs. It was expected that the varying of Zr/Nb ratio should help to find the optimum phase composition, resulting in better superelasticity at RT.

2. Materials and Methods

2.1. Melting

Alloys with the following chemical composition were investigated: Ti-41Zr-12Nb (41–12), Ti-42Zr-11Nb (42–11), Ti-43Zr-10Nb (43–10), and Ti-44Zr-10Nb (44–10), all in at.%. The 150 g ingots were obtained by vacuum arc remelting technique with a non-consumable tungsten electrode. Prior to melting process, the working chamber was evacuated by mechanical pump and turbomolecular pump down to 10−3 Pa. After that, inert gas (argon) was introduced into the chamber. Argon atmosphere was used as working atmosphere for electric arc and also to prevent the increase of impurities and oxidation of the material. To improve the quality of the ingots, each of them was obtained with five consequent remelts. For quality assessment of the obtained ingots impurities, content was analyzed using the high-temperature gas extraction technique (TC-600, Leco, Geleen, The Netherlands). The results of the analysis are listed in Table 1.
The obtained results demonstrate that impurities level is low; thus, mechanical properties of the alloys are affected by this factor.

2.2. Samples Preparation

For the EDS and metallography analyses, three samples were prepared from each ingot (from the lower, middle, and upper parts), in the shape of a rectangular plate with 2 × 3 × 8 mm3 dimensions. All samples were mirror-polished using SiC abrasive papers (P320-P4000) and etched in an 1% HF:3% HNO3:6% H2O solution. For XRD analysis, rectangular plates with 2 × 5 × 10 mm3 dimensions were prepared. For microstructure analysis by SEM, polishing with SiC abrasive paper, MD-Chem fabric and diamond suspension, ion etching using SC-2100 SEMPrep ion milling system, and plasma cleaning were implemented.

2.3. Thermomechanical Treatment

To obtain more equilibrium microstructure and avoid casting defects of the ingot, a homogenization annealing was implemented. The ingot was heated to a temperature of 950 °C in a tubular furnace with a protective argon atmosphere, annealed for 1 h, and then water-quenched. To obtain pronounced superelasticity at RT, the following thermomechanical treatment (TMT) regime was used: cold rolling (CR) with a true strain e = 0.3 and post-deformational annealing (PDA) at 550 °C (30 min) in an argon atmosphere, followed by water quenching. It was shown previously that such TMT provides an optimum superelastic behavior [26].

2.4. Microstructure and Chemical Composition Studies

The microstructure of all samples after homogenization was studied using an optical microscope BX51, Olympus (Tokyo, Japan). The chemical composition of the alloy was investigated by Energy Dispersive Spectroscopy (EDS) using an X-Max detector (Oxford Instruments, Abingdon, UK) and a JEOL 5600F (Tokyo, Japan) scanning electron microscope (see Supplementary Materials). Microstructure after TMT was investigated by scanning electron microscopy (SEM) and electron back-scattered diffraction (EBSD) using the FEI Scios DualBeam system (Hillsboro, OR, USA). For EBSD mapping, the beam voltage and current were equal to 30 kV and 3.2 nA. The orientation maps were calculated using the TSL OIM data collection TM software and then processed by TSL Oim Analysis software 7.2.1 (Leicester, UK).
The XRD experiment after TMT was carried out at RT using a DRON-3 diffractometer (Saint-Petersburg, Russia) with an accelerating voltage of 52 kV and a current of 32 mA, with C u K α radiation and a wavelength of 0.154178 nm with a 0.05° 2θ step and an exposure time of 5 s. The maximum transformation lattice strain, which is a theoretical limit for the recovery strain, was calculated in accordance with Reference [30], as follows:
ε m a x = b α a β 2 a β 2 .
The β-phase BCC lattice parameter a β was determined from the 110 β X-ray line angular position, and the α -phase orthorhombic lattice parameter b α , from 020 α angular position.
DSC analyses was conducted using Mettler Toledo equipment (Columbus, OH, USA) and STARe software (Columbus, OH, USA). Mass of the sample for DSC analysis was 24 g. Obtained results are given in Supplementary Materials.

2.5. Mechanical Tests

Static and cyclic tensile tests of the alloys were carried out along the rolling direction on a universal machine, INSTRON 5966 (Instron, Buckinghamshire, UK). Samples (50 × 1.5 × 1 mm3) with a gauge length of 30 mm were prepared by an electrical discharge machine (EDM). The following testing mode was used: loading the sample up to 0.5% of tensile strain in the first cycle, unloading sample to zero stress, and then increasing loading by additional 0.5% of the gauge length with each subsequent cycle, until the sample fails. It has been shown [29] that this mode is an optimum to study the superelastic behavior, maximum recovery strain, and the evolution of the superelastic loop as the strain increases. Static tensile tests were carried out at a strain rate of 0.05 mm/s at RT. Figure 1 shows a typical superelastic curve obtained after the cyclic tensile test and a set of stress and strain parameters used to characterize the mechanical behavior of SMA, such as transformation yield stress σ t r , dislocation yield stress σ d , superelastic recovery strain ε r S E , elastic recovery strain ε r e l , total recovery strain ε r t o t , residual strain ε f , and superelastic plateu strain ε p l . In the case when σ t r and σ d were not clearly separated, an apparent yield stress σ y was determined instead. Results of the additional mechanical testing with a larger strain in a single cycle are given in Supplementary Materials.
The Vickers hardness (HV0.2) was measured at 8 different points of each sample.

3. Results and Discussion

3.1. Microstructure

A typical SEM micrograph of the structure of the material after homogenization is shown in Figure 2. After homogenization, the microstructure of all alloys was represented by relatively large equiaxed grains of β-phase, with a mean size of about 500 microns.
The results of XRD study after TMT are presented in Figure 3. The main phase constituent of all studied alloys after TMT is a high-temperature metastable β-phase with low distinguishable martensite traces (Figure 3a). The absence of a large amount of martensite at RT after TMT indicates that the starting temperature M s of the forward martensitic transformation β α is around RT, which is beneficial for superelastic properties at body temperature.
It should be also noted that the integrated intensity of 200 β in the case of the 41–12 alloy is abnormally high. In fact, the I (110)/I (200) ratios are: 1.8, 3.9, 3.7, and 4.4 for 41–12, 42–11, 43–10, and 44–10, respectively. It has been demonstrated previously [31] that such enhancement of 200 β intensity might be due to {001}|<110>β texture formation having a pronounced positive effect on the superelastic behavior of the material. To induce and stabilize the martensite phase at RT, in accordance with Reference [20], samples of all alloys were subjected to additional slight plastic deformation by CR with a 10% thickness reduction. XRD results after TMT and additional deformation of 10% are presented in Figure 3b. Note that the additional plastic deformation of 10% was not enough to obtain sufficient intensity of the 020 α X-ray in 41–12 alloy (see Supplementary Materials). Therefore, 20% of additional plastic deformation was applied instead.
It can be seen from XRD data that the additional deformation led to the formation and stabilization of the martensite in all studied alloys, especially in alloys with lower Nb content, as follows: the highest amount of α″-phase after additional CR was found in 44/43–10 alloys, followed by 42–11 and 41–12 (Figure 3b). This trend indicates different stability of the parent β-phase in these alloys and allows us to deduce their relative M s temperatures in the order of decrease as follows: 44/43–10 → 42–11 → 41–12. It means that the Nb content has a primary role in regulating phase composition and M s temperature of the studied system.
The obtained data allowed us to calculate the maximum transformation lattice strains ε m a x , i.e., the recovery strain crystallographic limits for the studied alloys. It should be noted that the calculation was performed in the single-crystal approximation and characterized a theoretically possible maximum of the recovery strain upon a transformation of the BCC single crystal of the β-phase into the orthorhombic single crystal of the α″ martensite. Table 2 shows the lattice parameters and the maximum transformation lattice strains in 011 β direction of the studied alloys.
It follows from Table 2 that, as Nb content decreases, theoretical recovery strain gradually rises, even though the net content of the β-stabilizing components remains roughly the same in all alloys. On the contrary, an increase in the zirconium content leads to larger transformation strain values. This was mentioned in Reference [26] and requires additional consideration.
The microstructure of all studied materials after TMT is quite similar which is expected for solid solution systems with such close chemical compositions and the same TMT processing. Typical SEM electron images of the microstructure after TMT and results of their analysis are given in Figure 4 for the 43–10 alloy.
The microstructure is represented mainly by initial not recrystallized large grains containing deformation bands (Figure 4a). Crystallographic orientation maps vividly demonstrate that new small (≤10 µm diameter) recrystallized are present, as well (Figure 4b). A more thorough investigation of the area containing small, recrystallized grains reveals that they are located mainly closer to deformation bands (Figure 4c). Such areas appear to be preferential sites for recrystallization due to the increased density of lattice defects (dislocations). The grain sizes histogram has a bimodal character, with larger sizes attributed to the initial grains, while smaller sizes (<10 μm) are attributed to new recrystallized grains. The misorientation angle histogram (Figure 4f) reveals that a majority of the boundaries are characterized by low-angle misorientation, which indicates that the polygonization process took place in the dislocation substructure of the initial grains. Subgrains can indeed be distinguished in Figure 4d. This suggestion is further supported by the grain boundaries rotation angle map, revealing an extensive network of the low-angle boundaries (Figure 4d). The length of the low-angle boundaries is approximately 4.5 times higher as compared to the high-angle boundaries. It can be concluded that a mixed partially recrystallized/polygonized structure was formed in the studied alloys as the result of TMT.

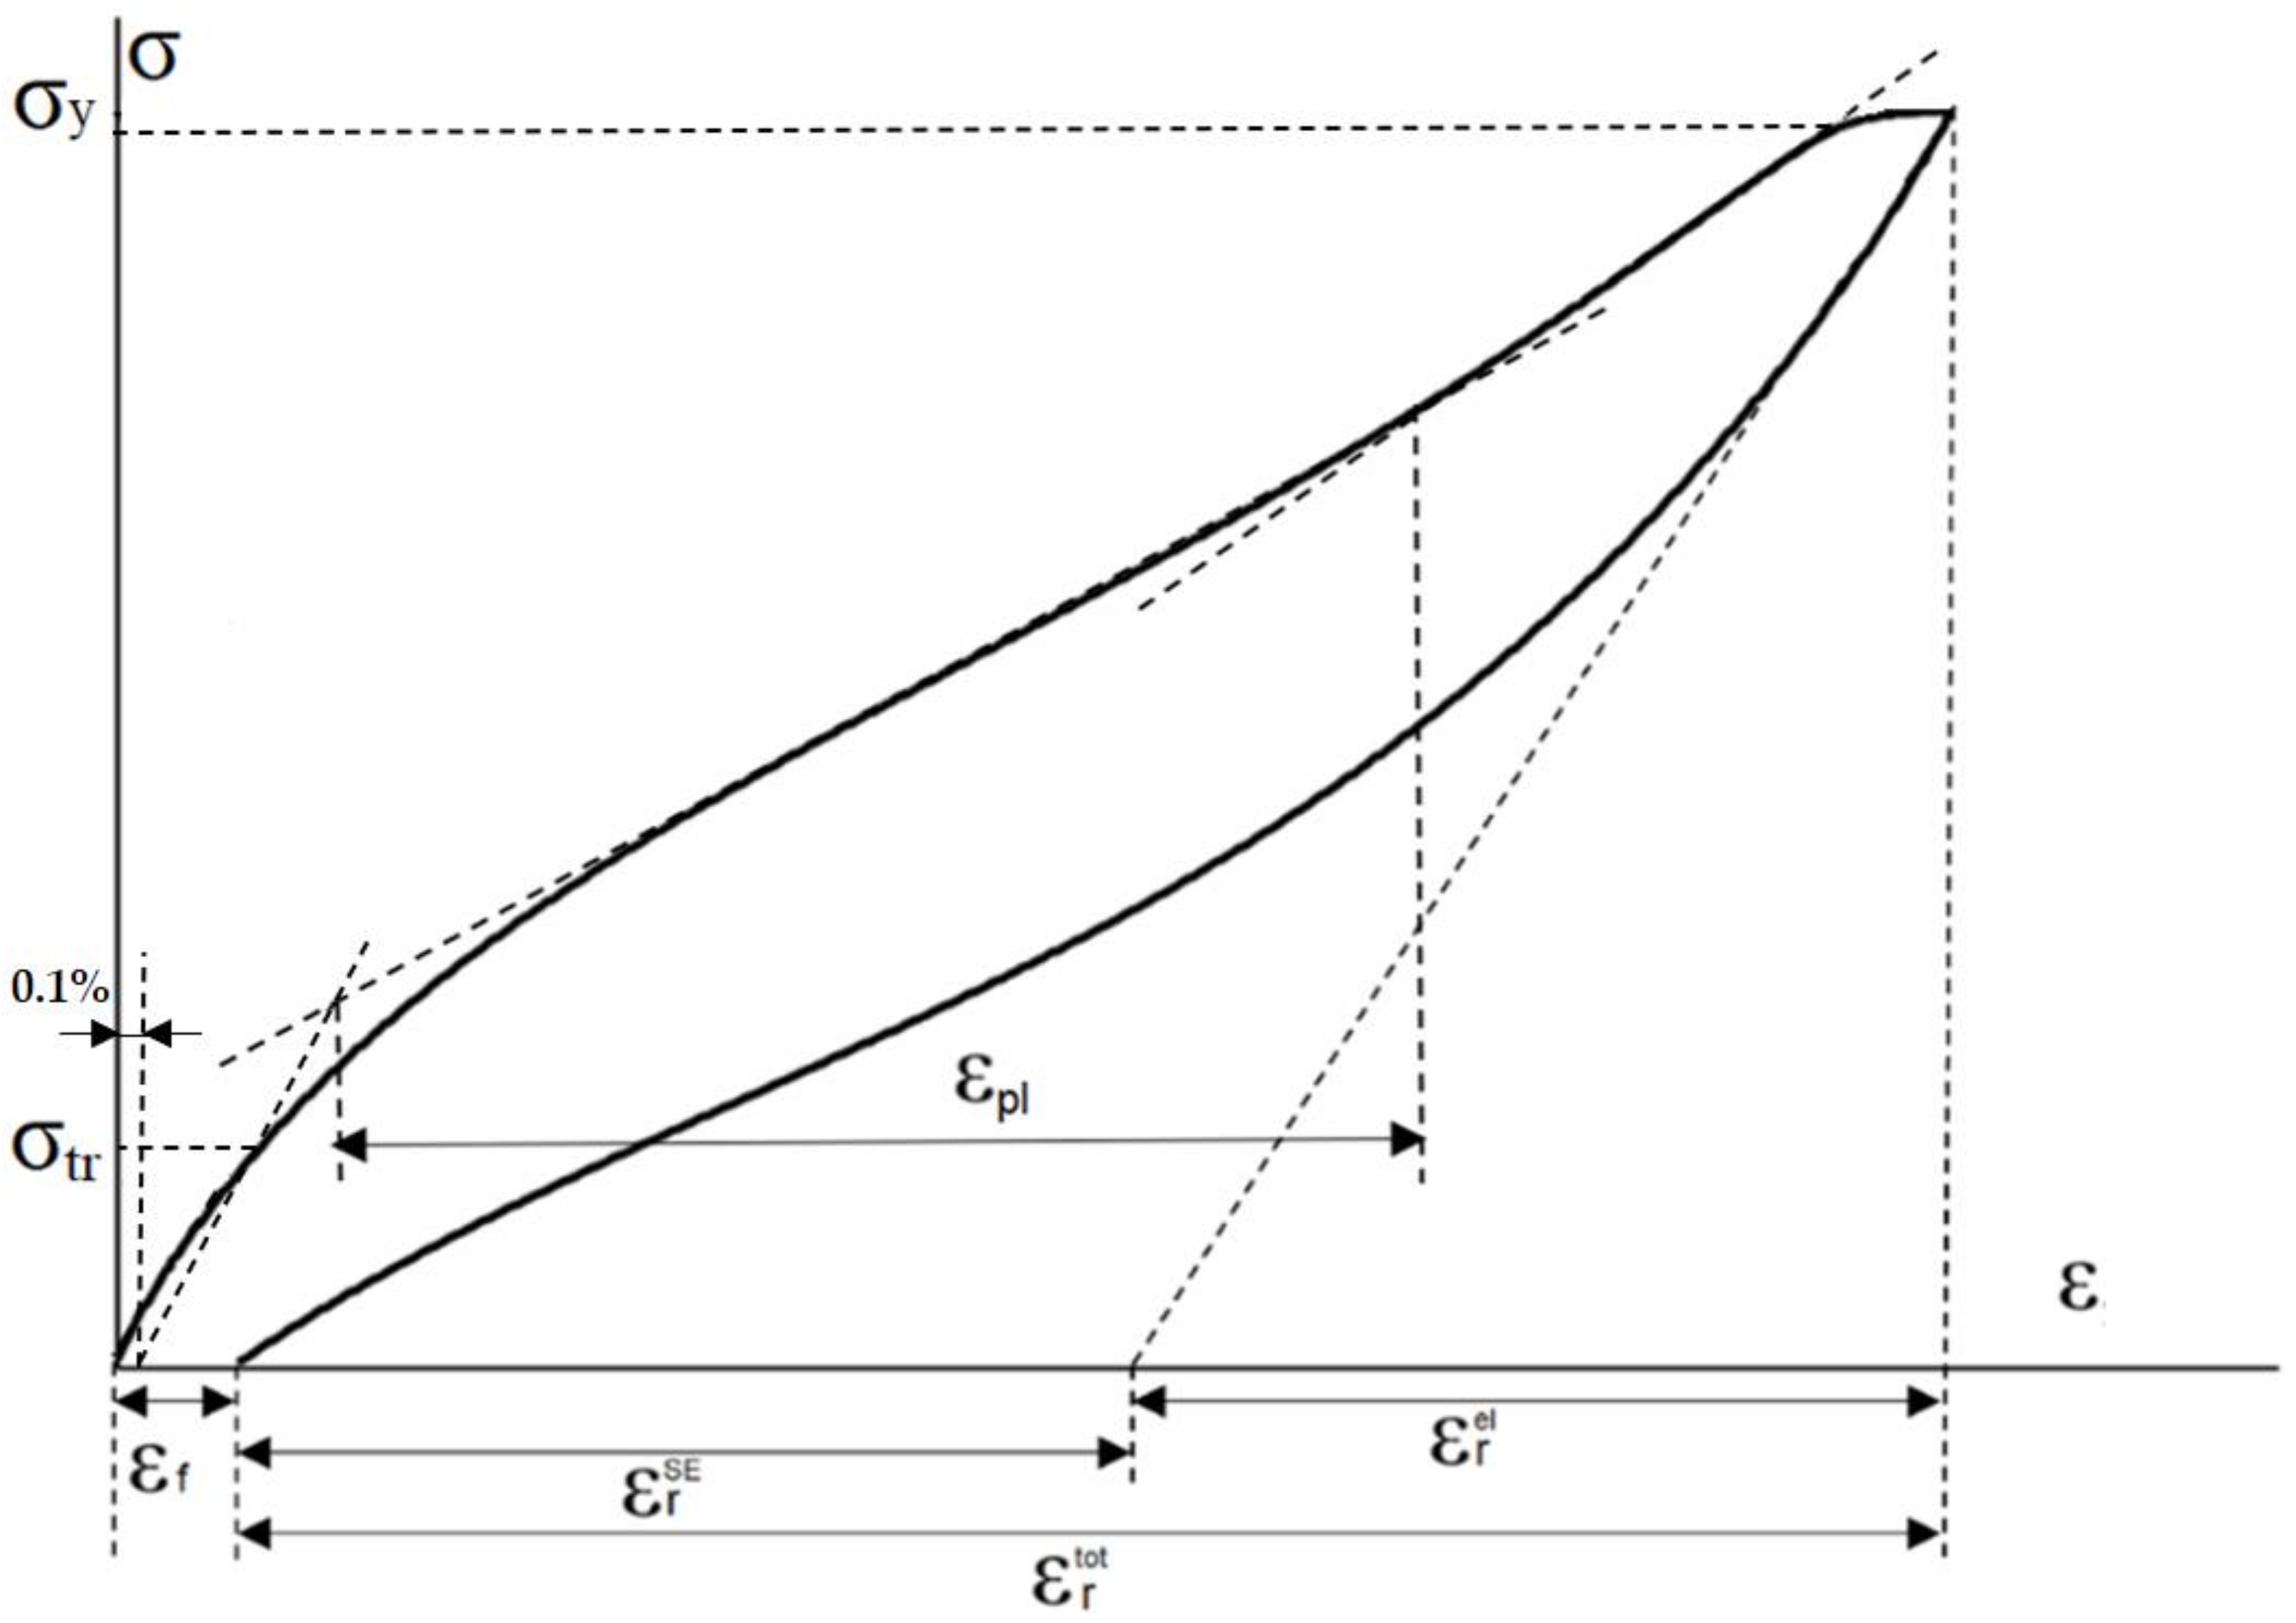
3.2. Mechanical Tests

Results of static tensile tests are shown in Figure 5.
Mechanical properties of the studied materials are listed in Table 3. Tensile tests show that all studied alloys demonstrate reasonable UTS values of about 400 MPa and a pronounced ductility (Table 3). It is worth noting that higher relative elongation values (over 20%) are ascribed to the materials with a more stable β-phase. It should be also noted that 41–12 and 43–10 alloys show a pronounced martensitic transformation plateau (εpl), highlighting their predisposition to superelastic behavior. Microhardness values lay in the range from 205 to 220 HV0.2. Such low hardness of the alloys after TMT points to inclination for martensitic transformation under stress [32]. For 41–12 and 43–10 alloys, transformation σ t r and dislocation σ d yield stresses are well distinguished, while, for 44–10 and 42–11, only apparent yield stress σ y can be measured (Table 3).
To study the functional properties of the alloys, superelastic cyclic tensile tests were carried out. Based on the obtained stress-strain curves (Figure 6), the following dependencies of superelastic recovery strain ε r S E , elastic recovery strain ε r e l , residual strain ε f , and total recovery strain ε r t o t on the cycle number N are plotted in Figure 7. Since transformation and dislocation yield stresses are clearly distinguished in cyclic tensile tests, we can plot their dependencies on a number of cycles. Note that distinguished difference between σ t r and σ d can only be observed starting from the 4th cycle of testing.
The values of the superelastic recovery strain are approximately two times lower than the calculated values of the transformation strain. Such a decrease is explained by the fact that the transformation strain is calculated in the single crystal approximation. Thus, it does not consider the presence of variously oriented grains and boundaries in the polycrystalline material. All studied alloys demonstrate pronounced superelastic behavior at RT with a large total recovery strain of 4 to 6% (Figure 7c). Elastic recovery strain has nearly linear dependence on the cycle number (Figure 7b). Superelastic recovery strain increases rapidly with the cycle number, reaches a maximum at about 14–18 cycle, and then gradually declines (Figure 7a). Such behavior is typical of superelastic alloys [33]. It reflects the fact that the superelastic deformation mechanism is triggered from the very beginning of the testing. This leads to quite perfect superelastic behavior of the materials, which is confirmed by insignificant (<0.1%) residual strains in the cycle (Figure 7d). Nonetheless, at a certain point of testing (~6th cycle for 42–11, 9th and 10th cycles for 43–10 and 44–10, and 11th cycle for 41–12), degradation of the superelastic behavior occurs. The following suggestion could be made to explain the observed difference in superelastic behavior of the studied materials: two factors to be considered are high theoretical recovery strain limit and parent phase stability. In the case of the higher theoretical recovery strain limit (Ti-43Zr-10Nb and Ti-44Zr-10Nb), realization of even a small portion would lead to a quite high superelastic recovery strain. On the other hand, a more stable parent phase (Ti-41Zr-12Nb alloy) is apparently beneficial for more complete realization of the theoretical recovery strain (presumably due to prevention of residual martensite formation upon deformation). In this case, relatively low properties of the Ti-42Zr-11Nb alloy are due to a lower theoretical recovery strain limit (as compared to Ti-43/44Zr-10Nb) and decreased parent β-phase stability (as compared to Ti-41Zr-12Nb). Note that superelastic recovery strain can still increase, but residual strain rises, as well, indicating that plastic deformation takes place. Participation of the plastic deformation increases rapidly, and the superelastic recovery strain reaches its limit: 3.7% for 41–12, 3.2% for 43–10, 3.0 for 44–10, and 2.1% for 42–11. The alloy 41–12, with the highest superelastic recovery strain of 3.7%, also demonstrates the largest total recovery strain of over 6%, while involving of plastic deformation starts at a higher cycle number for this alloy as compared to other alloys. As for the transformation yield stress, its value decreases during mechanical cycling of the material, while yield stress increases via dislocation hardening mechanism (Figure 8).
It should be noted that 41–12 demonstrated the lowest theoretical recovery strain which is associated with larger Nb content, which, nonetheless, allowed this alloy to demonstrate its more complete realization reflected in quite perfect superelastic behaviour and superelastic recovery strain of 3.7% (total recovery strain over 6%) compared to previously investigated Ti-18Zr-14/15Nb (superelastic recovery strain 3.0%) and Ti-41Zr-10Nb (superelastic recovery strain 0.8%) [26]. The combination of the factors explaining such phenomenon could be as follows: quite large theoretical recovery strain, optimal phase composition at RT, and presumably crystallographic texture. As for the latter, enhanced functional properties of the Zr-enriched alloys are often ascribed to sharp crystallographic texture {001}|<110>β. For Ti-24Zr-10Nb-2Sn, total recovery strain of over 6% was achieved [34]. Even larger values (over 7%) were measured for Ti-(40–50)Zr-8Nb-2Sn after the same texture was formed in the material after TMT [29]. So, texture role in undeniably high, although it is only one of the possible ways to increase material functional properties, as it was demonstrated that comparable recovery strains can be achieved for the Ti-Zr-Nb alloy without pronounced texture.
It should be mentioned that it is important to study functional fatigue life and its dependence on the enhanced superelastic recovery strain of the developed materials. This is the task for the upcoming research. Nonetheless, it can be suggested that developing a more appropriate TMT scheme will allow achieving even higher functional properties for the Ti-41Zr-12Nb alloy.

4. Conclusions

The structure, mechanical, and functional properties of Ti-Zr-Nb system alloys were studied, with four novel compositions: Ti-41Zr-12Nb, Ti-42Zr-11Nb, Ti-43Zr-10Nb, and Ti-44Zr-10Nb (at.%). The following findings are highlighted:
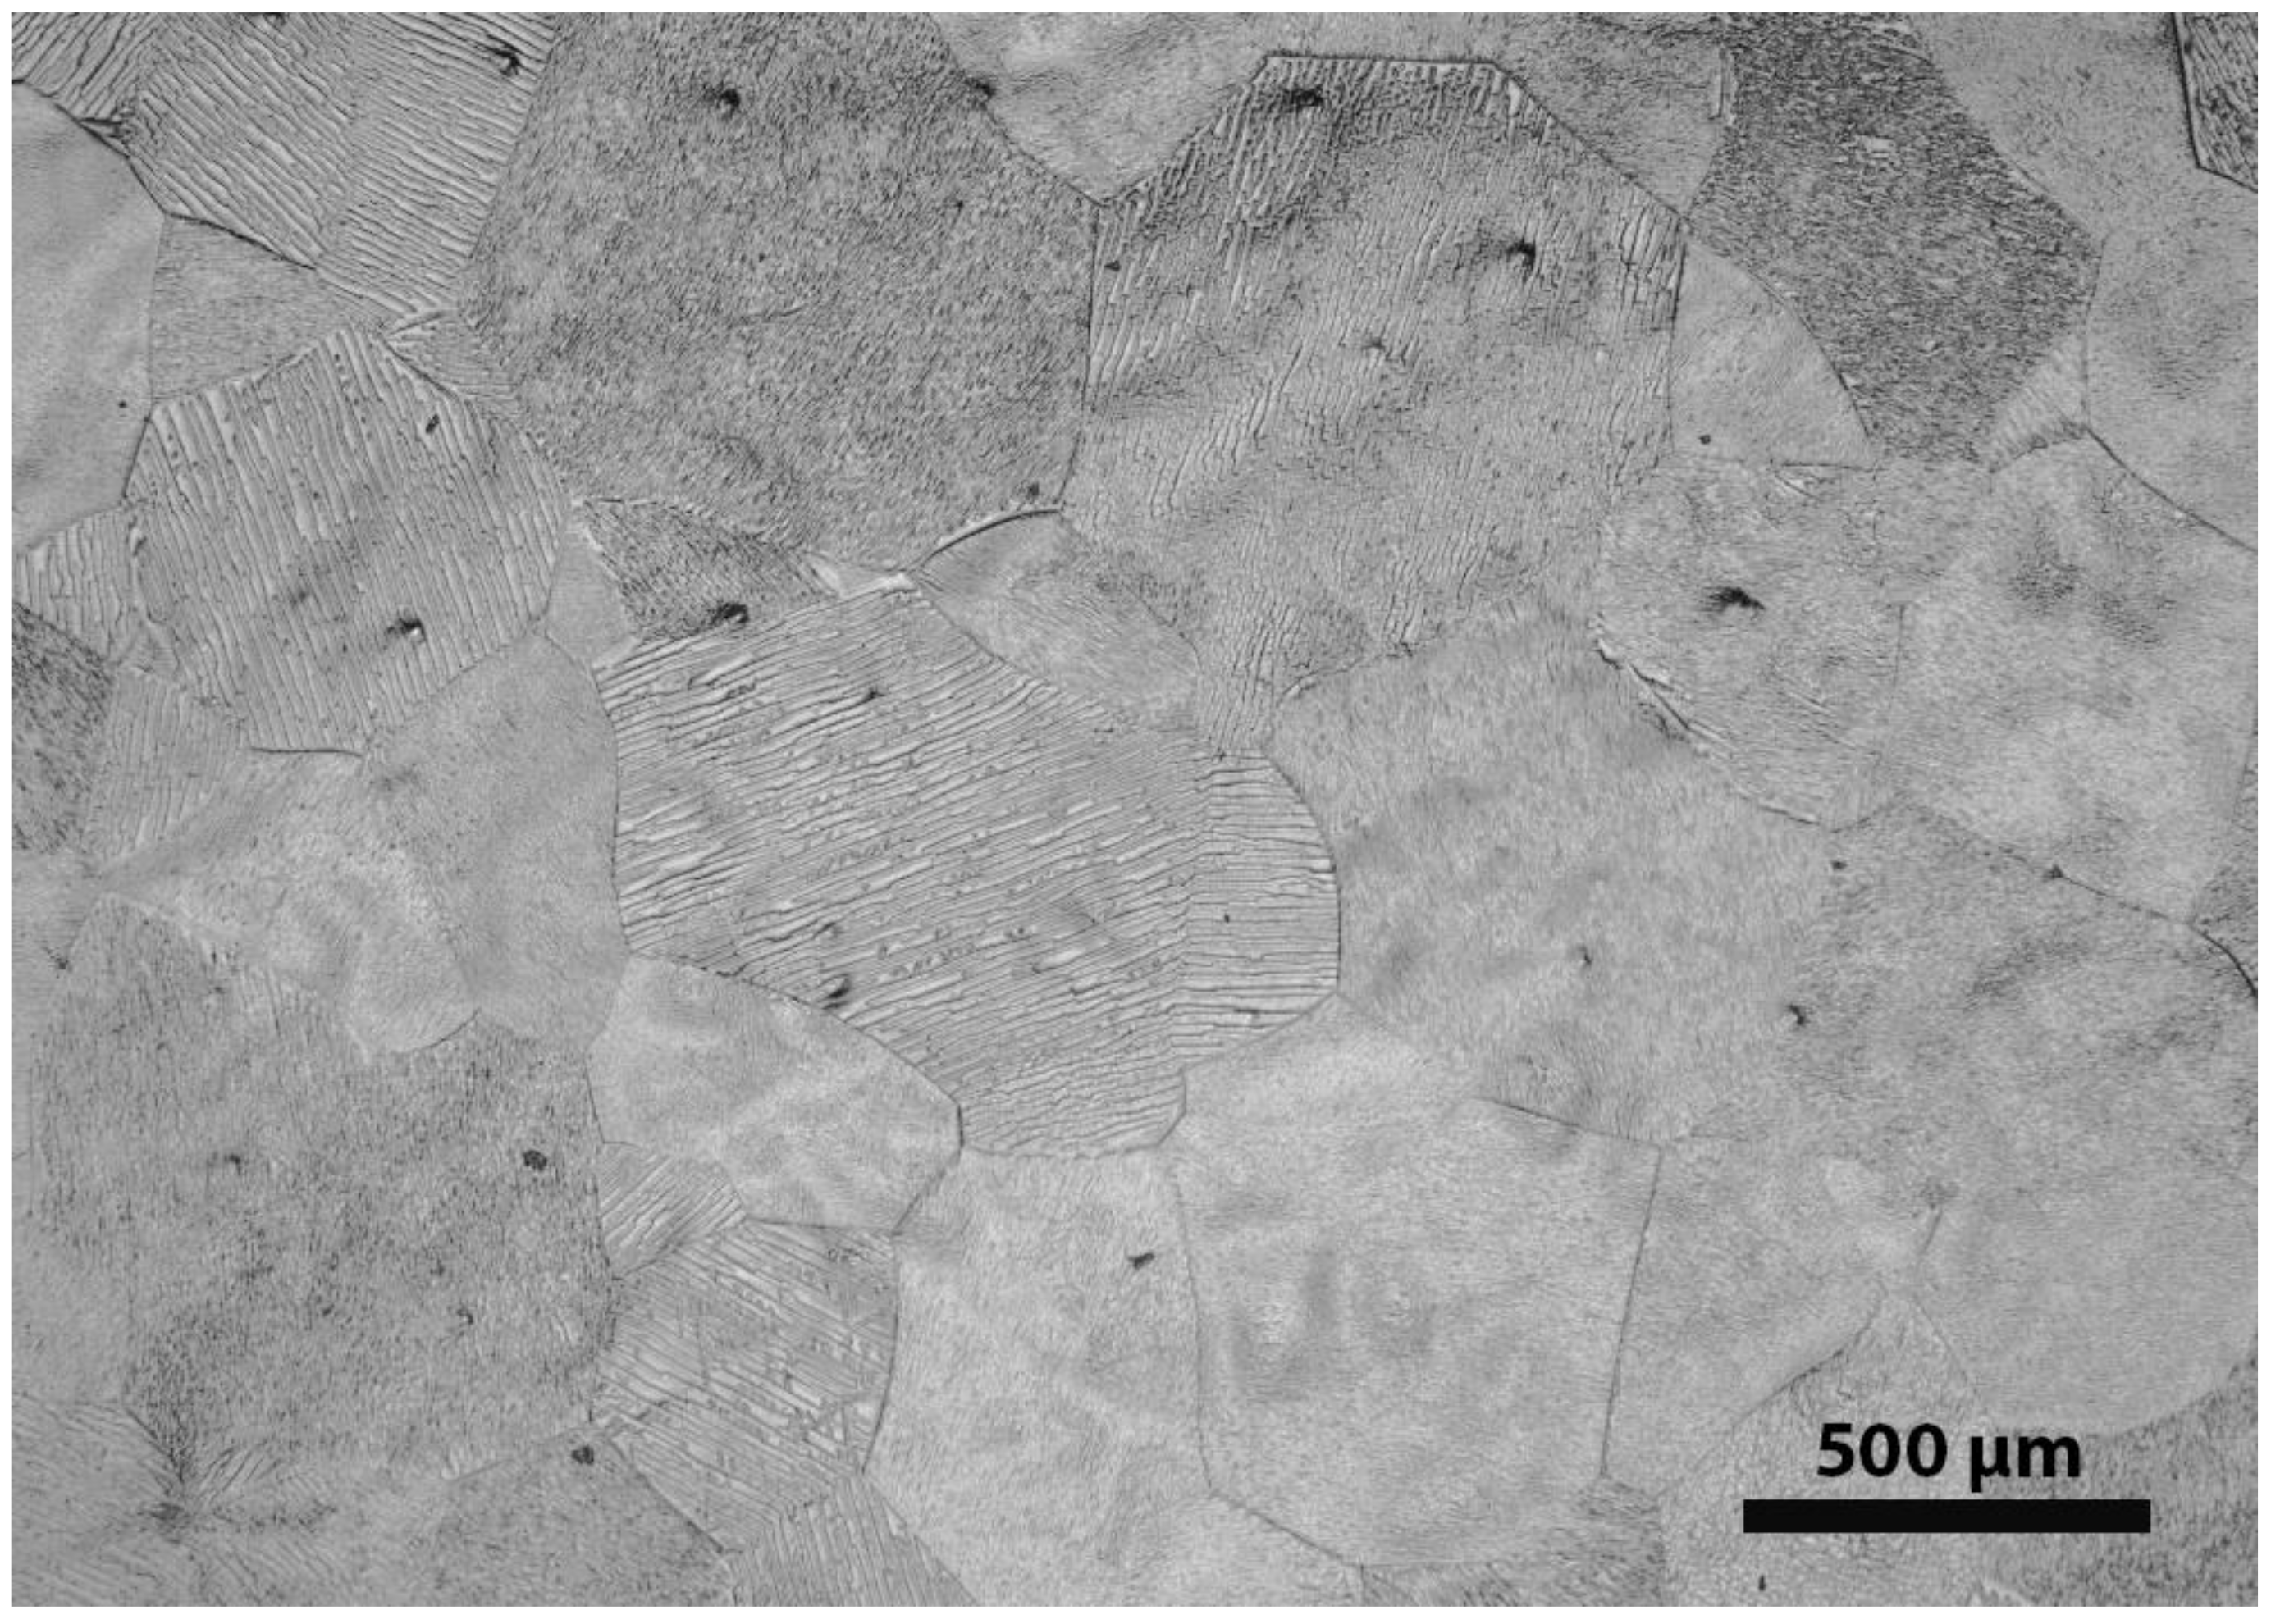
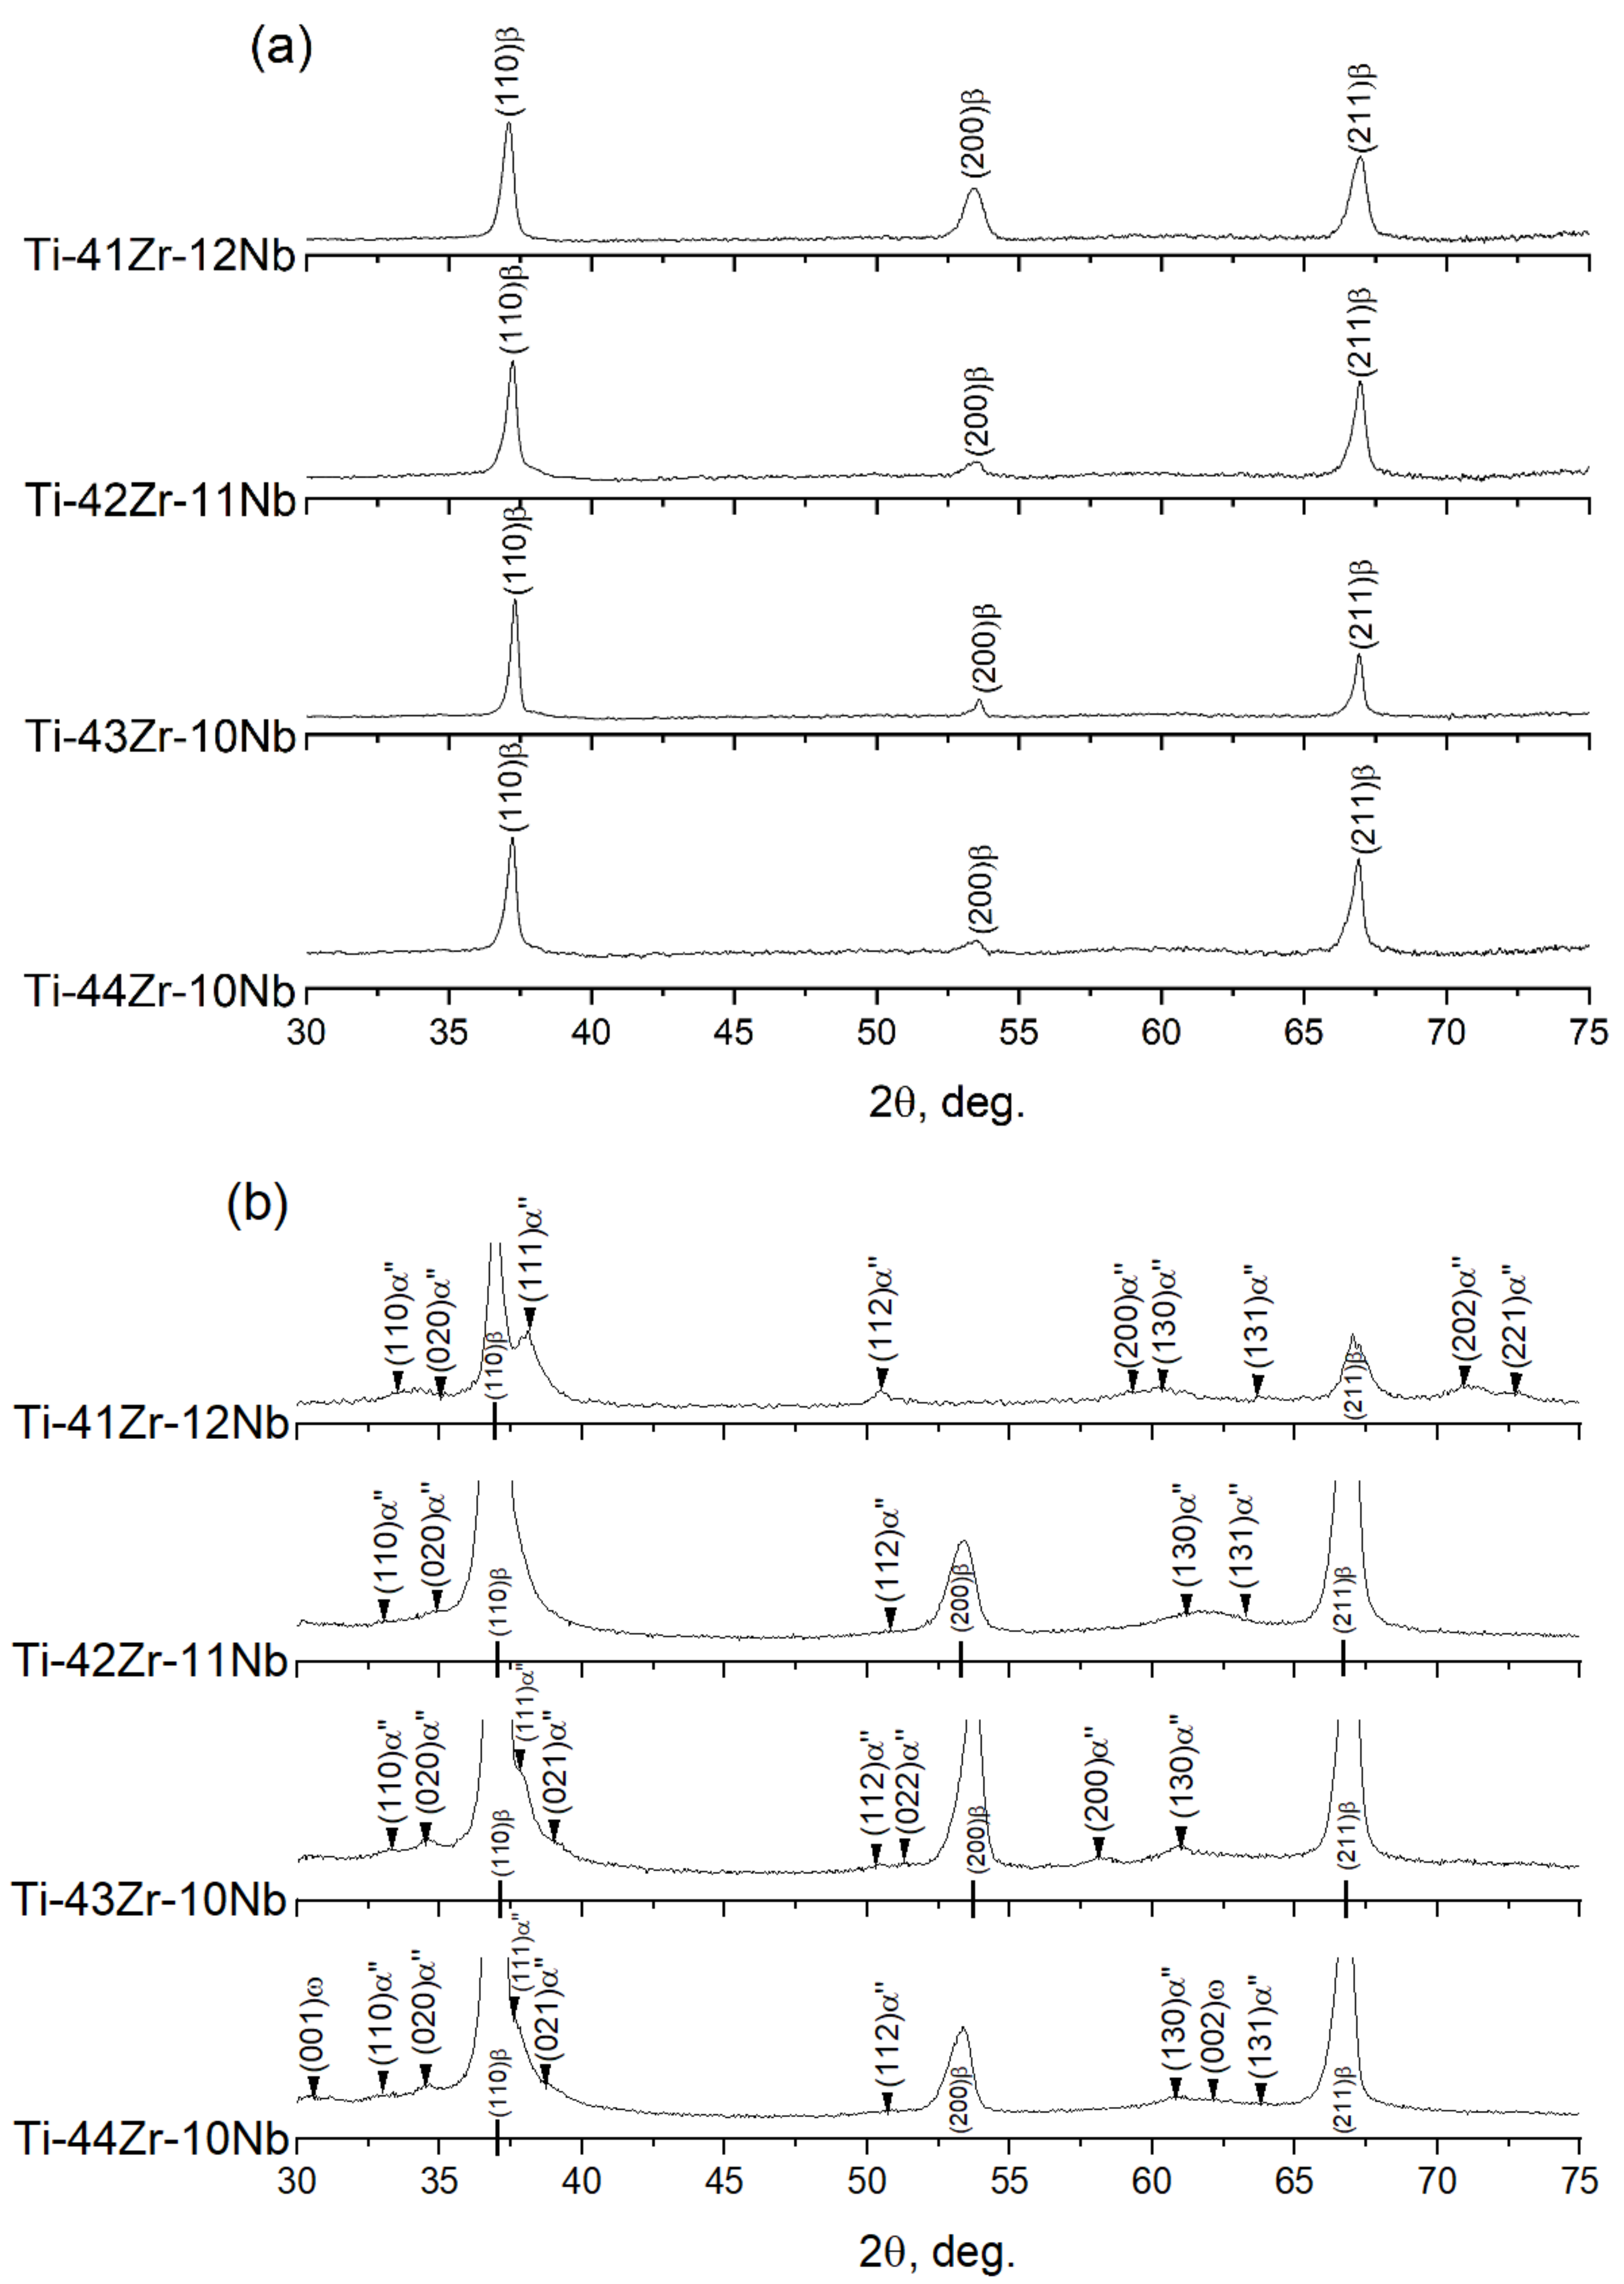
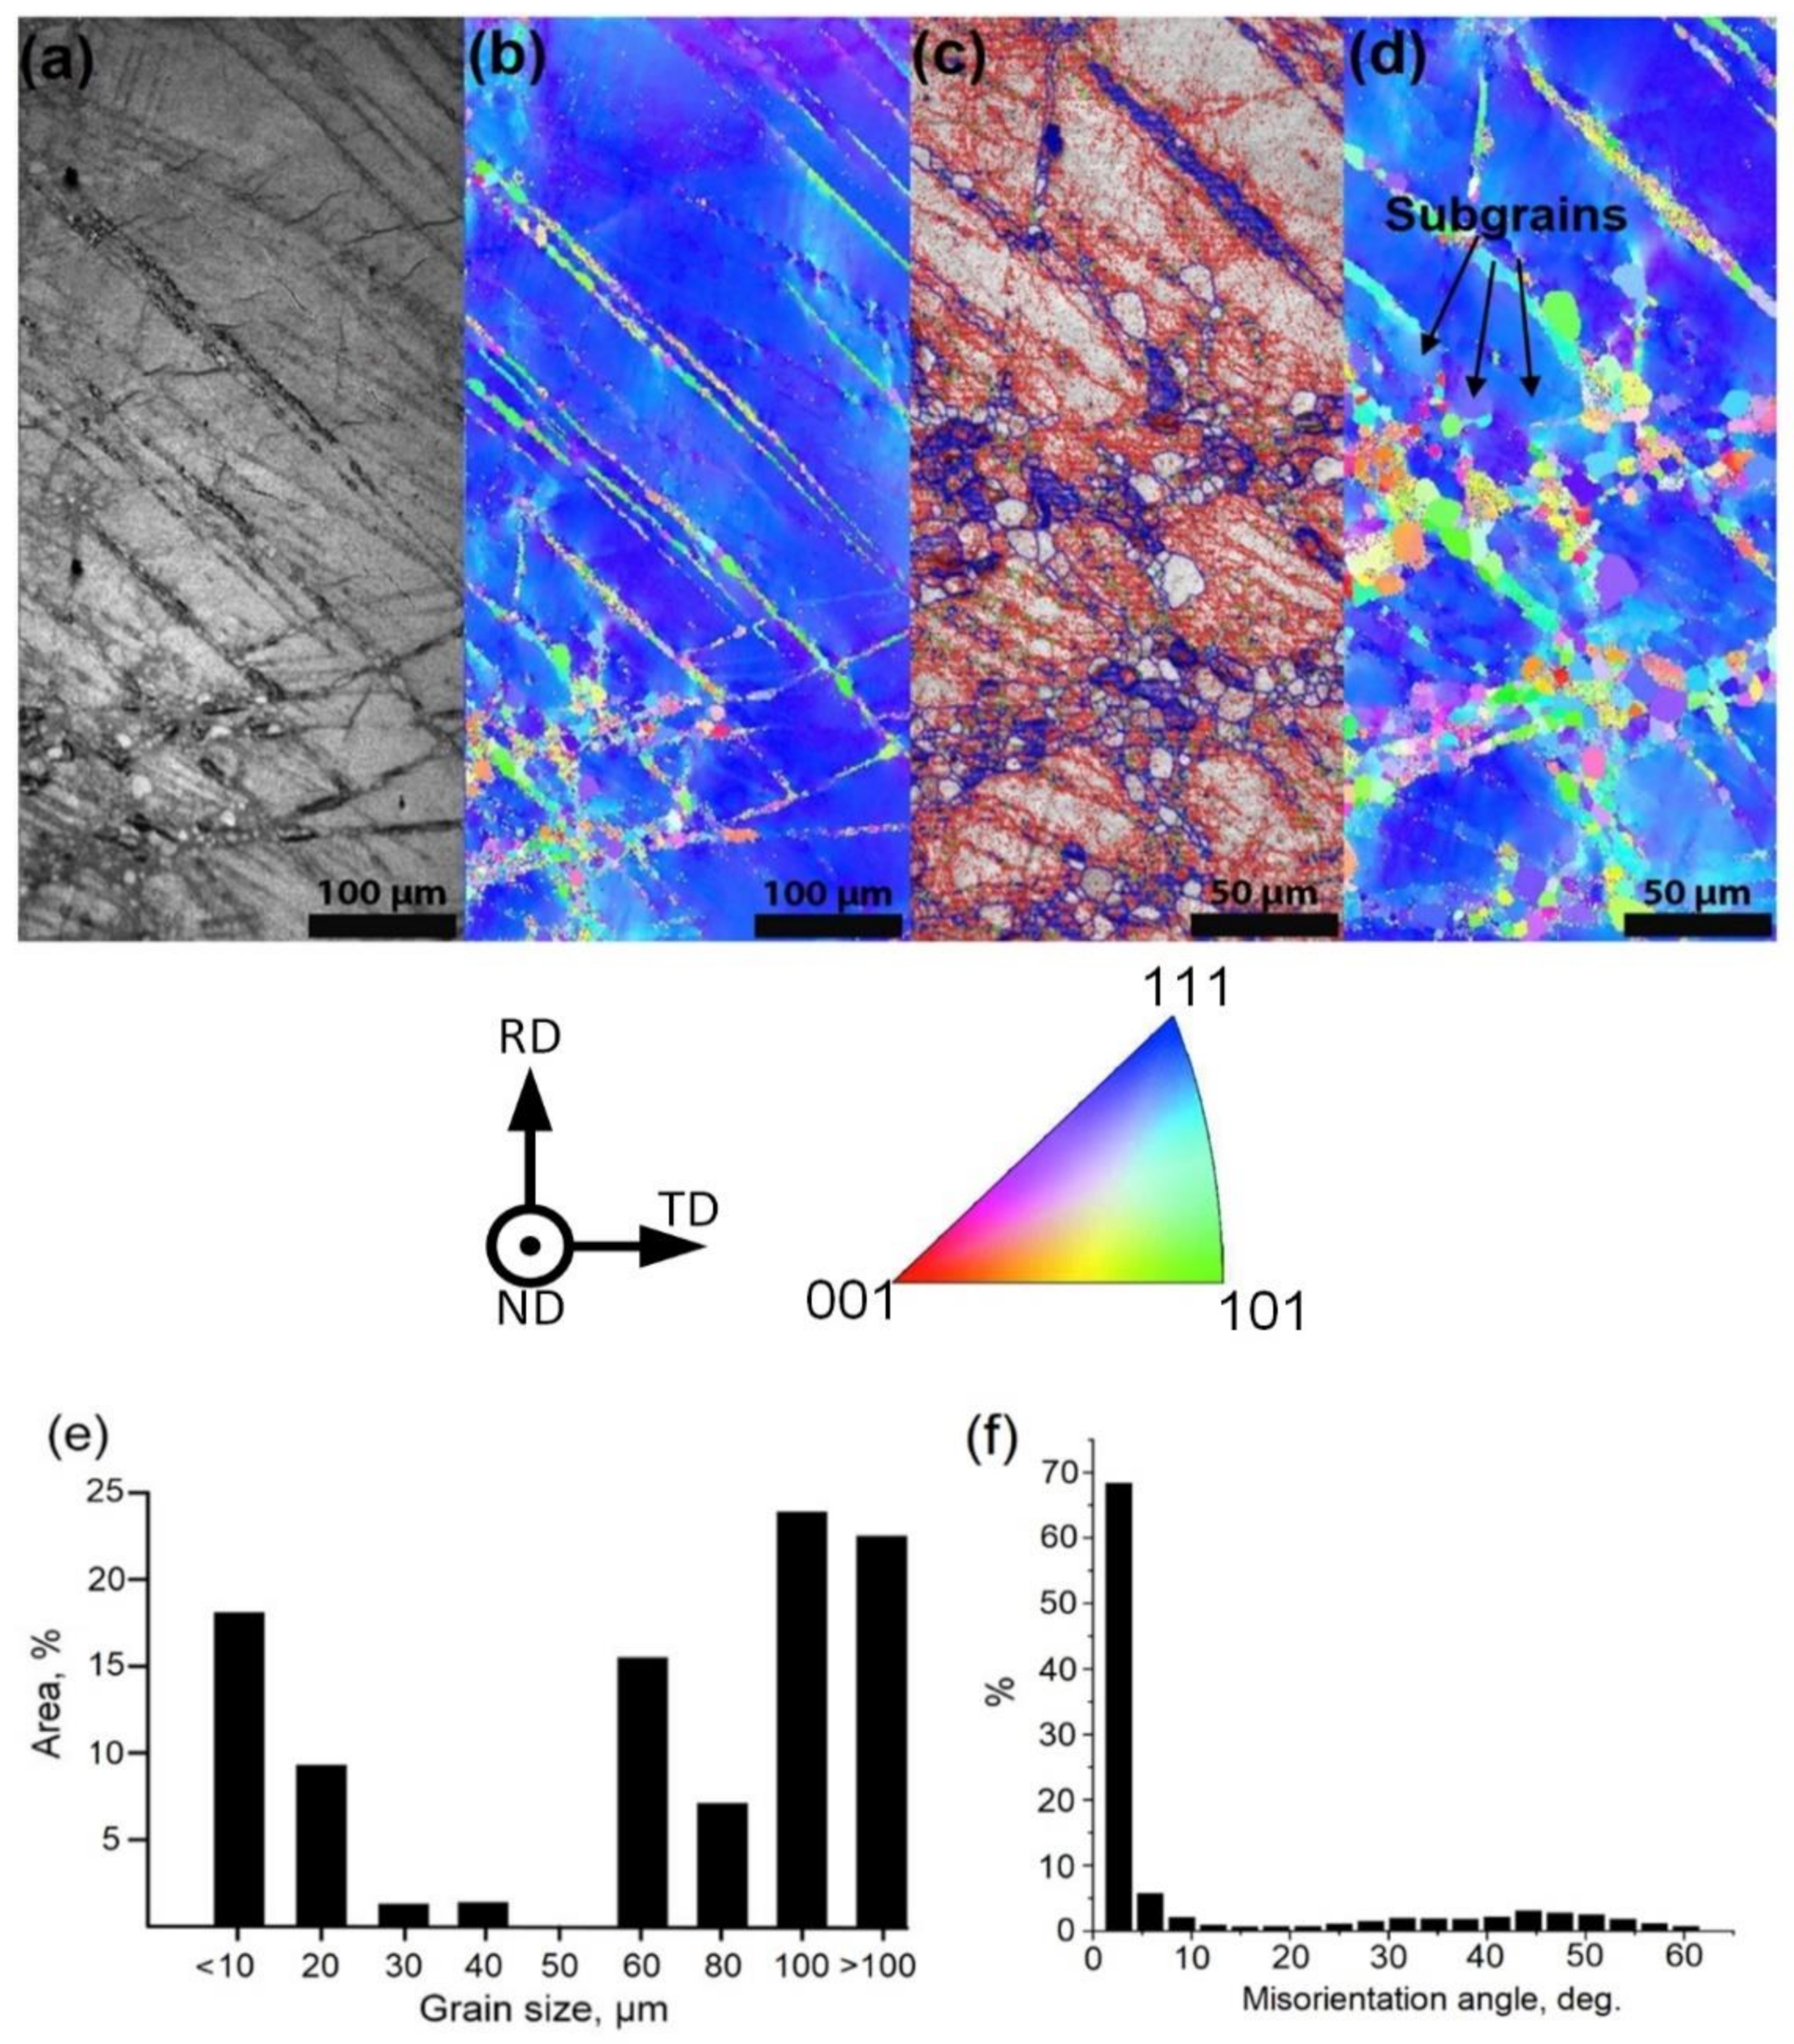
  • All alloys subjected to an optimum thermomechanical treatment were in a high-temperature metastable β-phase state at room temperature. The microstructure of studied materials after TMT is characterized as mixed polygonized dislocation substructure and partially recrystallized grain structure. The absence of a noticeable amount of martensite phase indicates that the Ms temperature of all alloys is near or somewhat below RT.
  • The theoretical recovery strain limits in the direction [011]β calculated from X-ray diffractograms are 5.9%, 6.3%, 7.5%, and 7.2% for Ti-41Zr-12Nb, Ti-42Zr-11Nb, Ti-43Zr-10Nb, and Ti-44Zr-10Nb, respectively. The differences in the calculated values are mainly associated with different Nb content in the studied alloys.
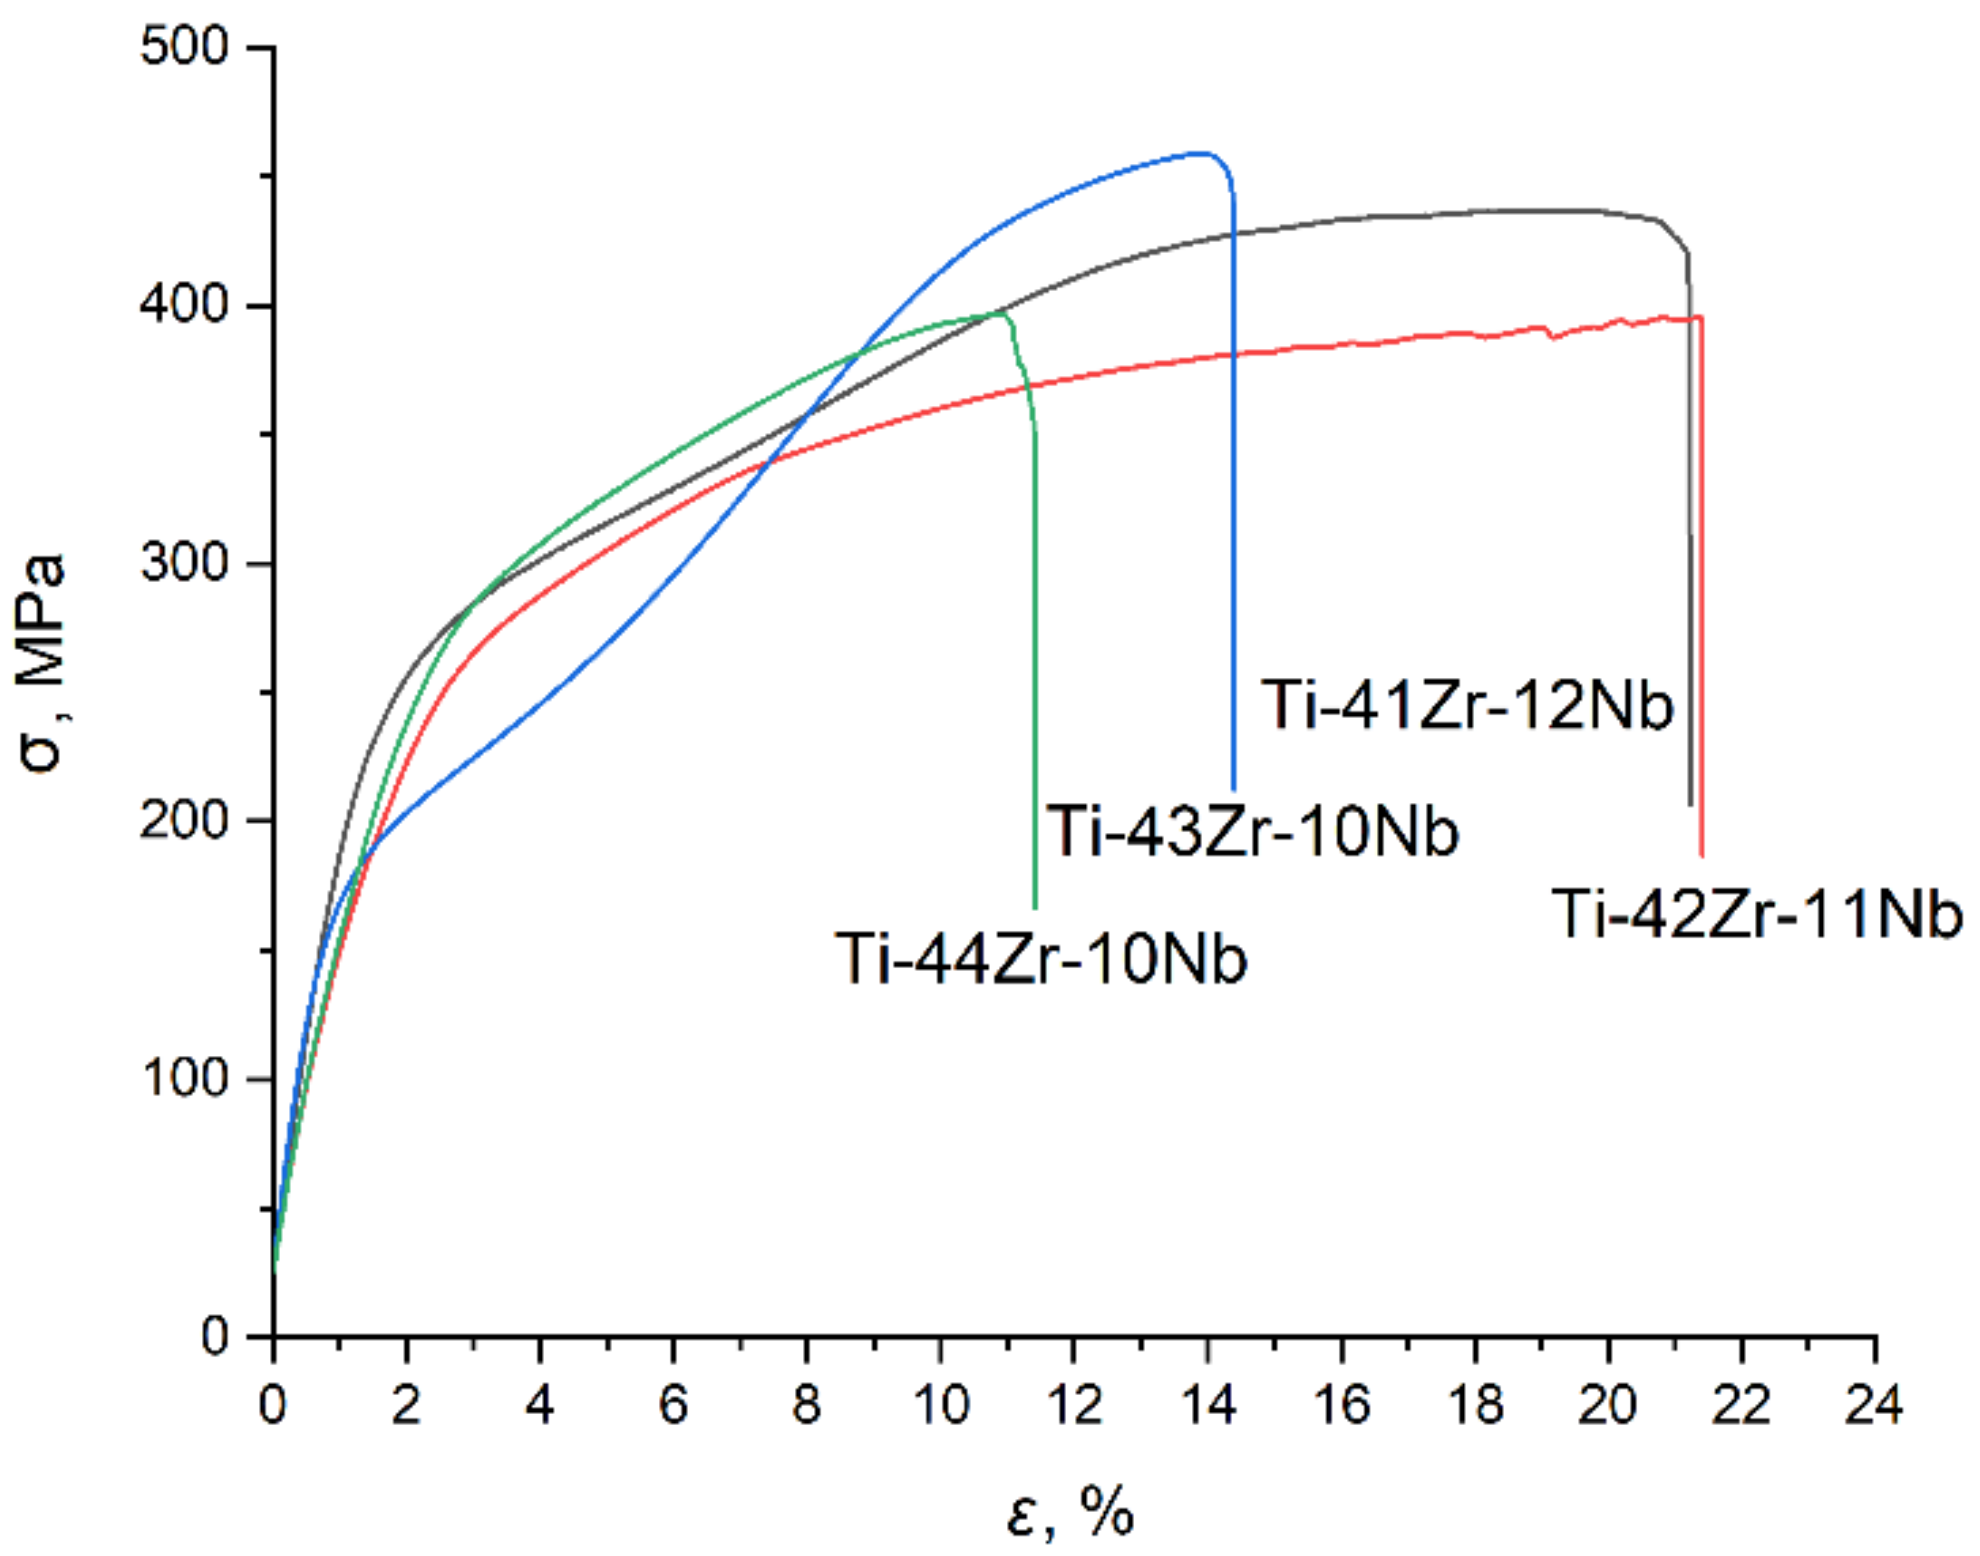
  • UTS values of all studied alloys are near 400 MPa, and relative elongation value exceeds 20%, in the case of Ti-41Zr-12Nb and Ti-42Zr-11Nb, highlighting their enhanced ductility. Low microhardness values of about 200 HV0.2 confirms that all studied alloys are in a pre-martensitic state.
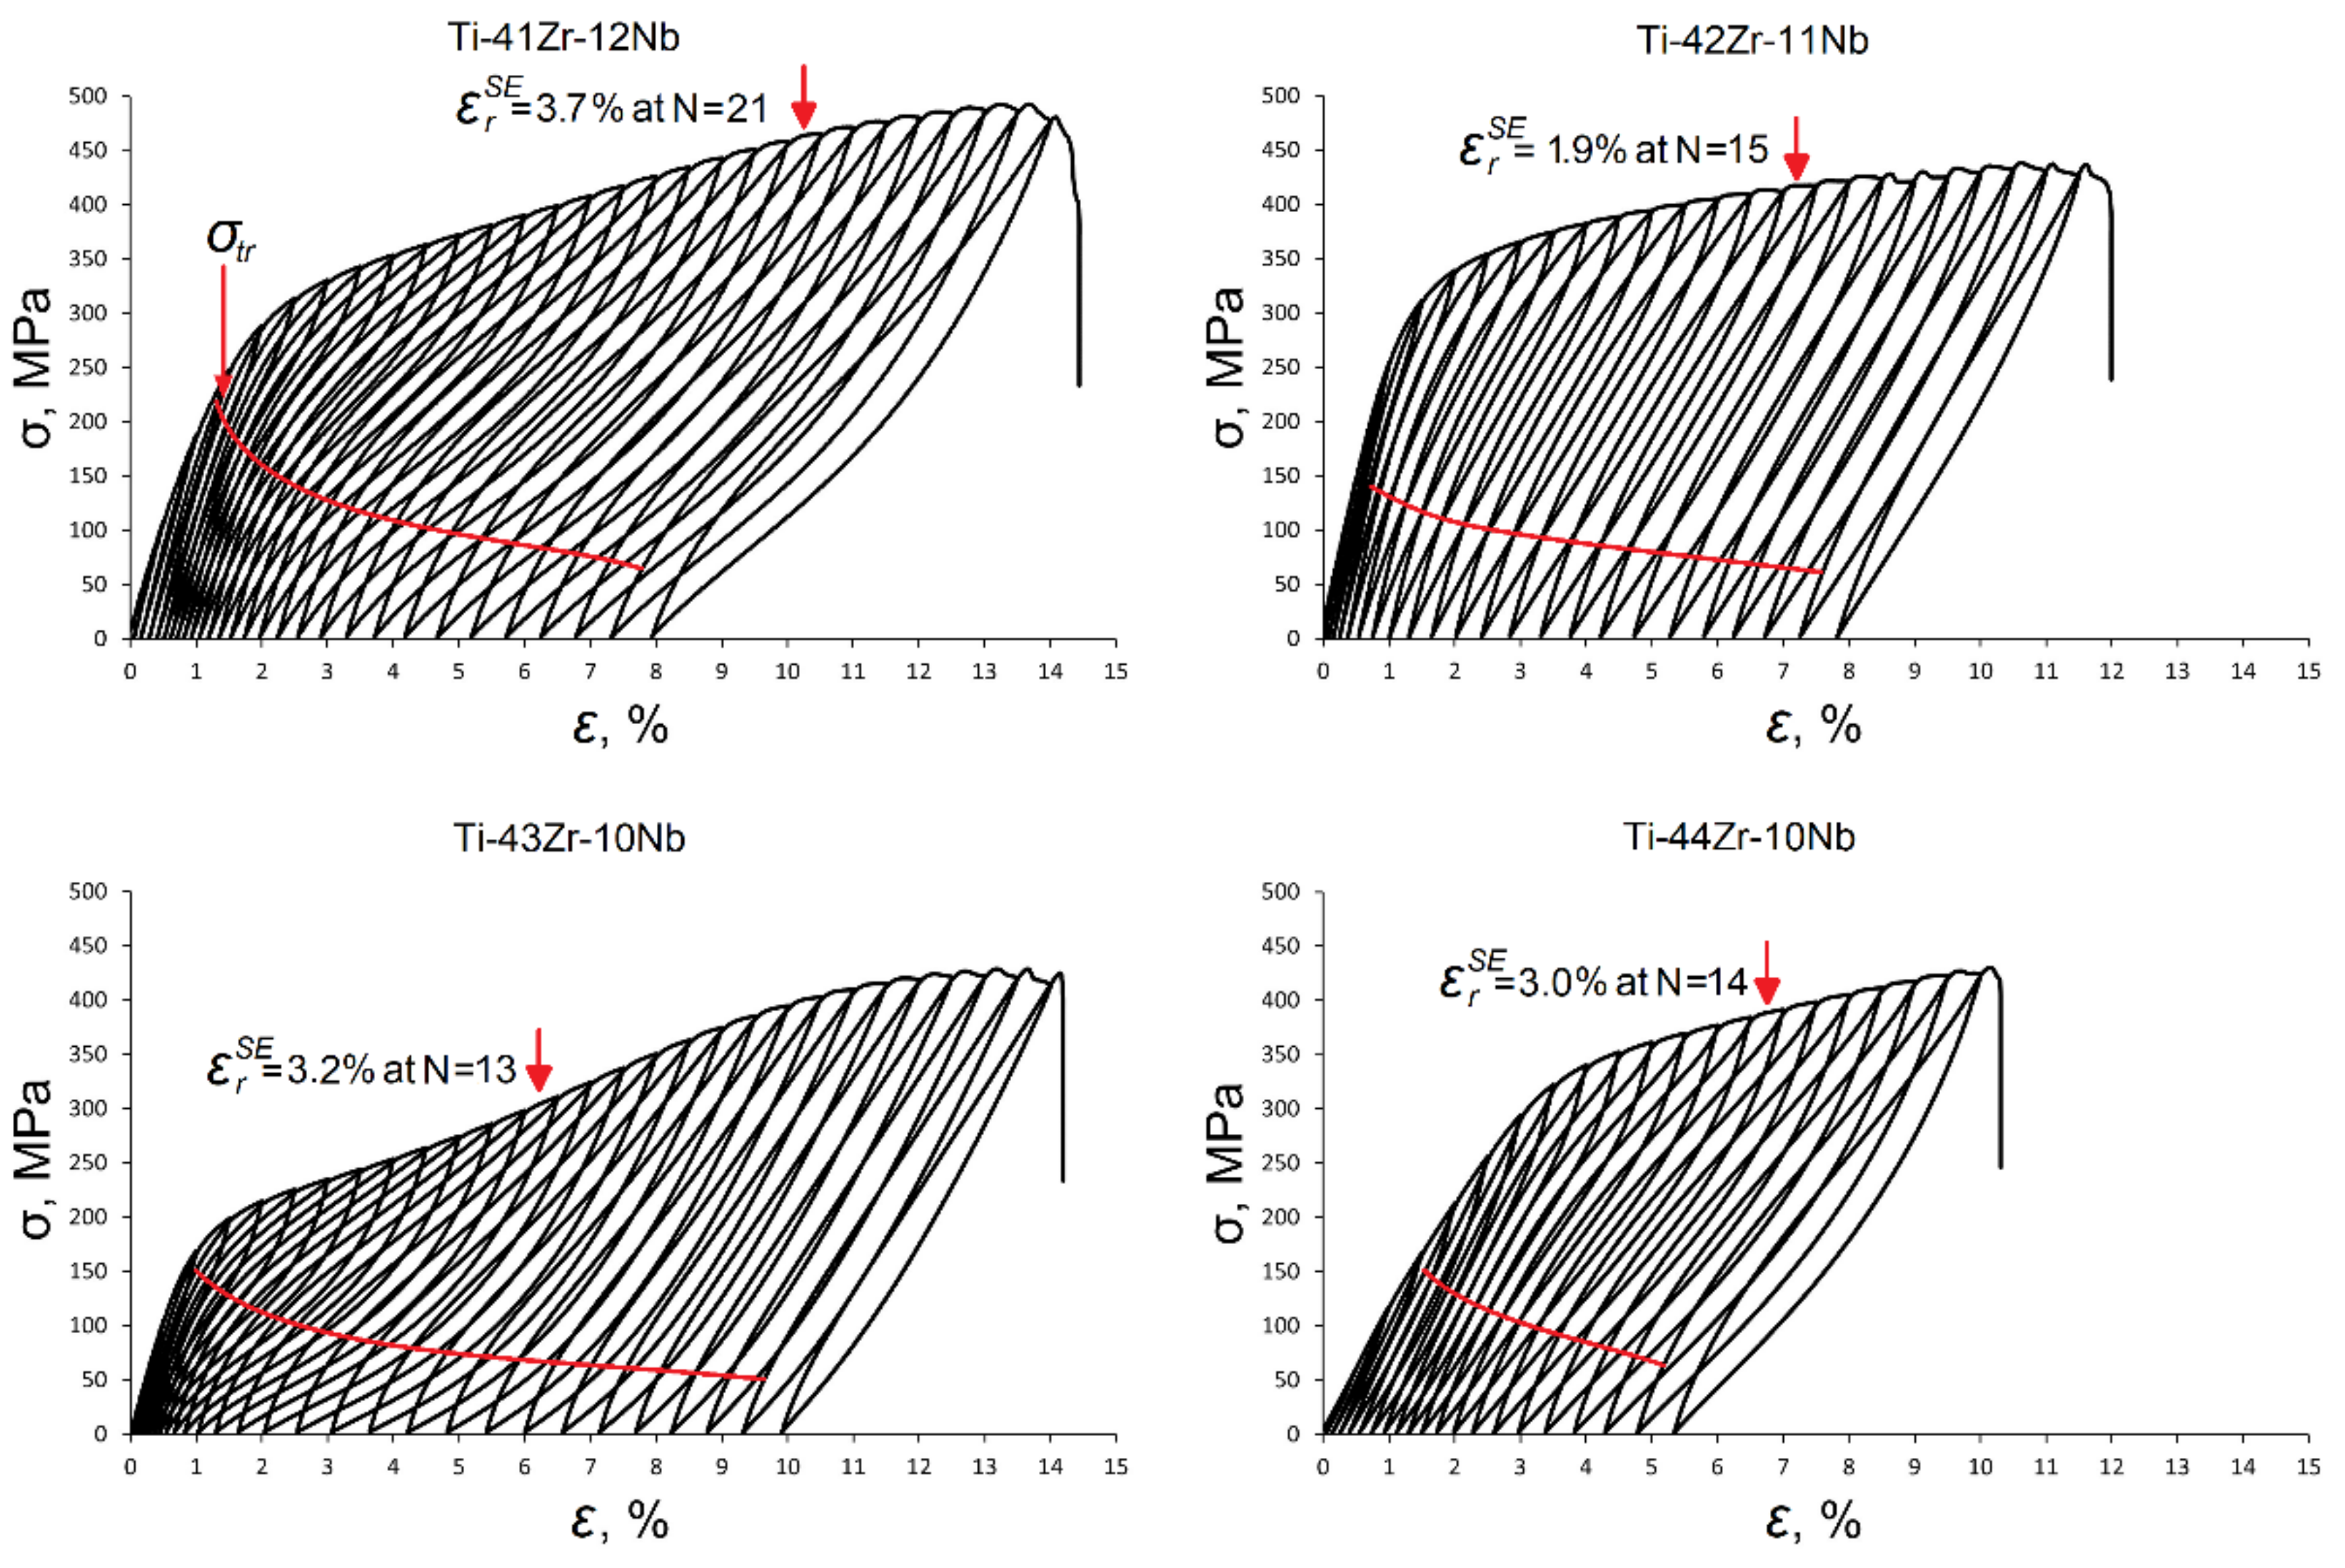
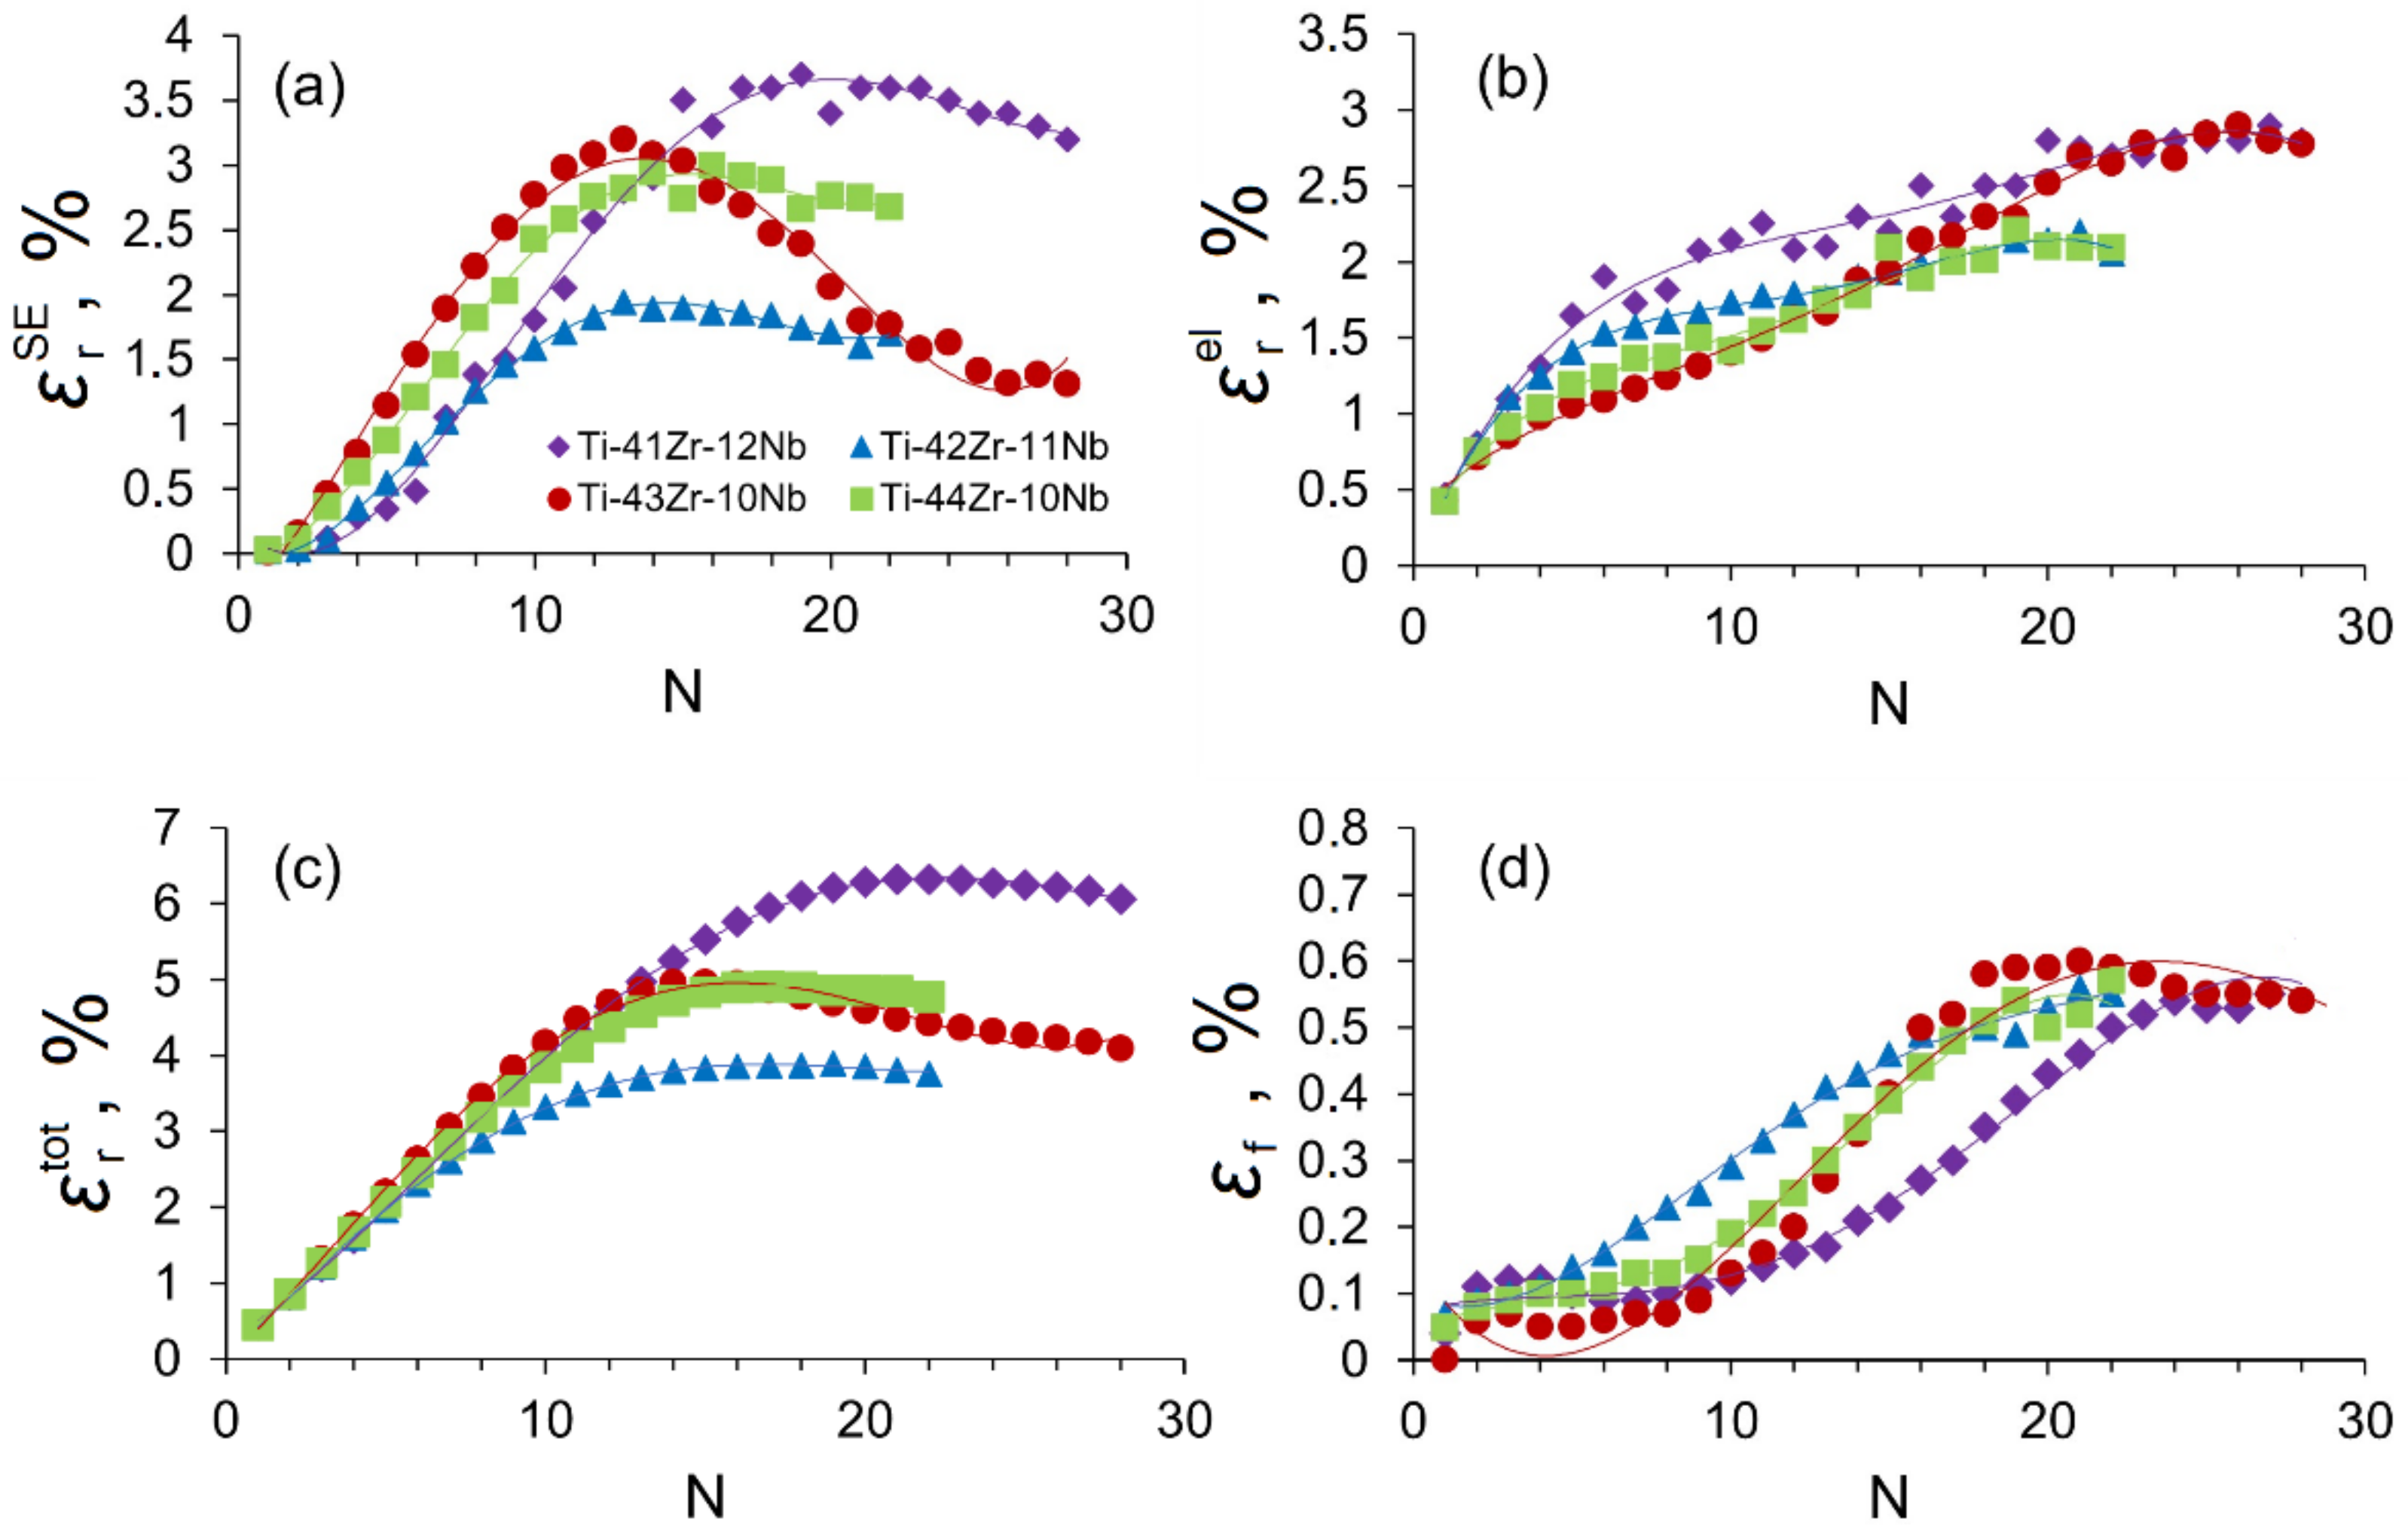
  • All studied alloys demonstrate pronounced superelastic behavior at RT during mechanical testing. The superelastic recovery strains are 3.7%, 1.9%, 3.2%, and 3.0% for Ti-41Zr-12Nb, Ti-42Zr-11Nb, Ti-43Zr-10Nb, and Ti-44Zr-10Nb alloys, respectively. Such high superelastic recovery strain and total recovery strain over 6%, along with relative elongation to failure over 20%, allow us to consider the Ti-41Zr-12Nb alloy as one of the most promising superelastic alloys of the Ti-Zr-Nb system.

Supplementary Materials

The following supporting information can be downloaded at: https://www.mdpi.com/article/10.3390/met12020185/s1, Figure S1: Chemical composition of the Ti-42Zr-11Nb alloy; (a) electron image, (b) EDS spectra, (c) elemental maps; Figure S2: XRD profile of 41–12 alloy after TMT and additional CR of 10%; Figure S3: DSC curves for the studied alloys after TMT; Figure S4: Stress-strain curves of the obtained alloys loaded up to 6% of tensile deformation; Table S1: Comparison of nominal and actual chemical compositions.

Author Contributions

Investigation, writing—original draft preparation, D.B.; investigation, A.B., N.A. and T.T.; conceptualization, investigation, writing—review and editing, A.K.; writing—review and editing, S.P. All authors have read and agreed to the published version of the manuscript.

Funding

The work was carried out with the support of the Ministry of Science and Higher Education of the Russian Federation in the framework of the State Task (project code 0718-2020-0030). SEM study was supported by the Ministry of Science and Higher Education of the Russian Federation and performed by N.A. Arkharova using the equipment of the Shared Research Center FSRC “Crystallography and Photonics” of the Russian Academy of Sciences.

Institutional Review Board Statement

Not applicable.

Informed Consent Statement

Not applicable.

Data Availability Statement

Not applicable.

Conflicts of Interest

The authors declare no conflict of interest. The funders had no role in the design of the study; in the collection, analyses, or interpretation of data; in the writing of the manuscript, or in the decision to publish the results.

References

  1. Machado, L.G.; Savi, M.A. Medical applications of shape memory alloys. Braz. J. Med. Biol. Res. 2003, 36, 683–691. [Google Scholar] [CrossRef] [PubMed]
  2. Cui, C.; Hu, B.; Zhao, L.; Liu, S. Titanium alloy production technology, market prospects and industry development. Mater. Des. 2011, 32, 1684–1691. [Google Scholar] [CrossRef]
  3. Murray, C.J.L.; Vos, T.; Lozano, R.; Naghavi, M.; Flaxman, A.D.; Michaud, C.; Ezzati, M.; Shibuya, K.; Salomon, J.A.; Abdalla, S.; et al. Disability-adjusted life years (DALYs) for 291 diseases and injuries in 21 regions, 1990–2010: A systematic analysis for the Global Burden of Disease Study 2010. Lancet 2012, 380, 2197–2223. [Google Scholar] [CrossRef]
  4. Stewart Williams, J.; Kowal, P.; Hestekin, H.; O’Driscoll, T.; Peltzer, K.; Yawson, A.; Biritwum, R.; Maximova, T.; Salinas Rodríguez, A.; Manrique Espinoza, B.; et al. Prevalence, risk factors and disability associated with fall-related injury in older adults in low- and middle-incomecountries: Results from the WHO Study on global AGEing and adult health (SAGE). BMC Med. 2015, 13, 147. [Google Scholar] [CrossRef] [PubMed] [Green Version]
  5. Rack, H.J.; Qazi, J.I. Titanium alloys for biomedical applications. Mater. Sci. Eng. C 2006, 26, 1269–1277. [Google Scholar] [CrossRef]
  6. Kurtz, S.; Ong, K.; Lau, E.; Mowat, F.; Halpern, M. Projections of Primary and Revision Hip and Knee Arthroplasty in the United States from 2005 to 2030. J. Bone Jt. Surg. 2007, 89, 780–785. [Google Scholar] [CrossRef]
  7. Carter, D.R.; Caler, W.E.; Spengler, D.M.; Frankel, V.H. Fatigue Behavior of Adult Cortical Bone: The Influence of Mean Strain and Strain Range. Acta Orthop. Scand. 1981, 52, 481–490. [Google Scholar] [CrossRef] [PubMed] [Green Version]
  8. Kuhn, J.L.; Goldstein, S.A.; Choi, R.; London, M.; Feldkamp, L.A.; Matthews, L.S. Comparison of the trabecular and cortical tissue moduli from human iliac crests. J. Orthop. Res. 1989, 7, 876–884. [Google Scholar] [CrossRef] [Green Version]
  9. Long, M.; Rack, H.J. Titanium alloys in total joint replacement—A materials science perspective. Biomaterials 1998, 19, 1621–1639. [Google Scholar] [CrossRef]
  10. Stohs, S. Oxidative mechanisms in the toxicity of metal ions. Free Radic. Biol. Med. 1995, 18, 321–336. [Google Scholar] [CrossRef] [Green Version]
  11. Sunderman, F.W., Jr. Carcinogenicity of metal alloys in orthopedic prostheses: Clinical and experimental studies. Fundam. Appl. Toxicol. 1989, 13, 205–216. [Google Scholar] [CrossRef]
  12. Yamamoto, A.; Honma, R.; Sumita, M. Cytotoxicity evaluation of 43 metal salts using murine fibroblasts and osteoblastic cells. J. Biomed. Mater. Res. 1998, 39, 331–340. [Google Scholar] [CrossRef]
  13. Hartwig, A. Carcinogenicity of metal compounds: Possible role of DNA repair inhibition. Toxicol. Lett. 1998, 102, 235–239. [Google Scholar] [CrossRef]
  14. Yamamoto, A.; Kohyama, Y.; Hanawa, T. Mutagenicity evaluation of forty-one metal salts by theumu test. J. Biomed. Mater. Res. 2002, 59, 176–183. [Google Scholar] [CrossRef]
  15. Beyersmann, D.; Hartwig, A. Carcinogenic metal compounds: Recent insight into molecular and cellular mechanisms. Arch. Toxicol. 2008, 82, 493–512. [Google Scholar] [CrossRef]
  16. Biesiekierski, A.; Wang, J.; Gepreel, M.A.-H.; Wen, C. A new look at biomedical Ti-based shape memory alloys. Acta Biomater. 2012, 8, 1661–1669. [Google Scholar] [CrossRef]
  17. Yoneyama, T.; Mayazaki, S. Shape Memory Alloys for Biomedical Applications; Woodhead Publishing: Sawston, UK, 2009; Available online: https://books.google.ru/books?id=MvqIvAEACAAJ (accessed on 5 April 2021).
  18. Zhukova, Y.S.; Pustov, Y.A.; Konopatsky, A.S.; Filonov, M.R. Characterization of electrochemical behavior and surface oxide films on superelastic biomedical Ti–Nb–Ta alloy in simulated physiological solutions. J. Alloys Compd. 2014, 586, S535–S538. [Google Scholar] [CrossRef]
  19. Zhukova Yu, S.; Pustov, Y.A.; Konopatsky, A.S.; Filonov, M.R.; Prokoshkin, S.D. Electrochemical Behavior of Novel Superelastic Biomedical Alloys in Simulated Physiological Media Under Cyclic Load. J. Mater. Eng. Perform. 2014, 23, 2677–2681. [Google Scholar] [CrossRef]
  20. Konopatsky, A.S.; Dubinskiy, S.M.; Zhukova, Y.S.; Sheremetyev, V.; Brailovski, V.; Prokoshkin, S.D.; Filonov, M.R. Ternary Ti-Zr-Nb and quaternary Ti-Zr-Nb-Ta shape memory alloys for biomedical applications: Structural features and cyclic mechanical properties. Mater. Sci. Eng. A 2017, 702, 301–311. [Google Scholar] [CrossRef]
  21. Peter, I. Investigations into Ti-Based Metallic Alloys for Biomedical Purposes. Metals 2021, 11, 1626. [Google Scholar] [CrossRef]
  22. Arias-González, F.; Rodríguez-Contreras, A.; Punset, M.; Manero, J.M.; Barro, Ó.; Fernández-Arias, M.; Lusquiños, F.; Gil, F.J.; Pou, J. In-Situ Laser Directed Energy Deposition of Biomedical Ti-Nb and Ti-Zr-Nb Alloys from Elemental Powders. Metals 2021, 11, 1205. [Google Scholar] [CrossRef]
  23. Li, Y.; Cui, Y.; Zhang, F.; Xu, H. Shape memory behavior in Ti–Zr alloys. Scr. Mater. 2011, 64, 584–587. [Google Scholar] [CrossRef]
  24. Kim, H.Y.; Fu, J.; Tobe, H.; Kim, J.; Miyazaki, S. Crystal Structure, Transformation Strain, and Superelastic Property of Ti–Nb–Zr and Ti–Nb–Ta Alloys. Shape Mem. Superelasticity 2015, 1, 107–116. [Google Scholar] [CrossRef] [Green Version]
  25. Qu, W.; Sun, X.; Yuan, B.; Xiong, C.; Zhang, F.; Li, Y.; Sun, B. Microstructures and phase transformations of Ti-30Zr-xNb (x = 5, 7, 9, 13 at.%) shape memory alloys. Mater. Charact. 2016, 122, 1–5. [Google Scholar] [CrossRef]
  26. Konopatsky, A.; Sheremetyev, V.; Dubinskiy, S.; Zhukova, Y.; Firestein, K.; Golberg, D.; Filonov, M.; Prokoshkin, S.; Brailovski, V. Structure and Superelasticity of Novel Zr-Rich Ti-Zr–Nb Shape Memory Alloys. Shape Mem. Superelasticity 2021, 7, 304–313. [Google Scholar] [CrossRef]
  27. Fu, J.; Yamamoto, A.; Kim, H.Y.; Hosoda, H.; Miyazaki, S. Novel Ti-base superelastic alloys with large recovery strain and excellent biocompatibility. Acta Biomater. 2015, 17, 56–67. [Google Scholar] [CrossRef]
  28. Li, S.; Choi, M.; Nam, T. Role of fine nano-scaled isothermal omega phase on the mechanical and superelastic properties of a high Zr-containing Ti–Zr–Nb–Sn shape memory alloy. Mater. Sci. Eng. A 2020, 782, 139278. [Google Scholar] [CrossRef]
  29. Li, S.; Nam, T. Superelasticity and tensile strength of Ti-Zr-Nb-Sn alloys with high Zr content for biomedical applications. Intermetallics 2019, 112, 106545. [Google Scholar] [CrossRef]
  30. Zhukova, Y.S.; Petrzhik, M.I.; Prokoshkin, S.D. Estimation of the crystallographic strain limit during the reversible β ⇄ α″ martensitic transformation in titanium shape memory alloys. Russ. Metall. 2010, 2010, 1056–1062. [Google Scholar] [CrossRef]
  31. Kim, H.Y.; Miyazaki, S. Martensitic Transformation and Superelastic Properties of Ti-Nb Base Alloys. Mater. Trans. 2015, 56, 625–634. [Google Scholar] [CrossRef] [Green Version]
  32. Brailovski, V.; Prokoshkin, S.; Terriault, P.; Trochu, F. (Eds.) Shape Memory Effects: Shape Memory Alloys: Fundamentals, Modeling and Applications; ETS Publications: Montreal, QC, Canada, 2003; pp. 115–130. Available online: https://books.google.ru/books?id=CP_6PQAACAAJ (accessed on 22 March 2021).
  33. Fu, J.; Kim, H.Y.; Miyazaki, S. Effect of annealing temperature on microstructure and superelastic properties of a Ti-18Zr-4.5Nb-3Sn-2Mo alloy. J. Mech. Behav. Biomed. Mater. 2017, 65, 716–723. [Google Scholar] [CrossRef] [PubMed]
  34. Pavón, L.L.; Cuellar, E.L.; Hernandez, S.V.; Moreno-Cortez, I.E.; Kim, H.Y.; Miyazaki, S. Effect of heat treatment condition on microstructure and superelastic properties of Ti24Zr10Nb2Sn. J. Alloys Compd. 2019, 782, 893–898. [Google Scholar] [CrossRef]
Figure 1. Schematic representation of measurements of loading-unloading diagram parameters.
Metals 12 00185 g001
Figure 2. Microstructure of 43–10 alloy after homogenization.
Metals 12 00185 g002
Figure 3. XRD profiles of all obtained samples after TMT (a) and after additional CR (b).
Metals 12 00185 g003
Figure 4. Image quality map (a), crystallographic orientation maps (b,d) (the same place under different magnifications), grain boundaries rotation angle map (low-angle boundaries are in red and high-angle boundaries are in blue) (c), grain sizes histogram (e), and grain/subgrain boundaries misorientation angle histogram (f) for the 43–10 alloy after TMT.
Metals 12 00185 g004
Figure 5. Stress-strain diagrams obtained during static tensile testing of the studied alloys.
Metals 12 00185 g005
Figure 6. A typical set of stress-strain curves obtained during superelastic cycling of all the studied alloys.
Metals 12 00185 g006
Figure 7. Superelastic recovery strain (a), elastic recovery strain (b), total recovery strain (c), and residual strain (d) in each cycle versus number of cycles.
Metals 12 00185 g007
Figure 8. Transformation yield stress (a) and dislocation yield stress (b) versus number of cycles.
Metals 12 00185 g008
Table 1. Impurities content, mass. %.
AlloysO, %N, %C, %S, %H, %
41–120.17 ± 0.002<0.0010.030 ± 0.002<0.0010.004 ± 0.0004
42–110.21 ± 0.002<0.0010.037 ± 0.002<0.0010.009 ± 0.0004
43–100.17 ± 0.002<0.0010.025 ± 0.002<0.0010.008 ± 0.0004
44–100.18 ± 0.002<0.0010.033 ± 0.002<0.0010.004 ± 0.0004
Table 2. Theoretical recovery strain limits.
Alloys b α ,   nm a β 2 ,   nm ε [011], %
41–120.51490.48485.9 ± 1.0
42–110.51630.48526.3 ± 1.0
43–100.52130.48467.5 ± 0.2
44–100.52140.48587.2 ± 0.2
Table 3. Mechanical properties of the studied alloys.
AlloysUTS, MPa σ t r , Mpa σ y , Mpa σ d , Mpa εpl, %δ, %Hardness, HV 0.2
41–124352664166.022.4206 ± 11
42–11395262n/a23.5231 ± 7
43–104581714034.714.4232 ± 12
44–10396266n/a11.4217 ± 7
Publisher’s Note: MDPI stays neutral with regard to jurisdictional claims in published maps and institutional affiliations.

