Abstract
In terms of steel alloying elements, generally, nickel is used as an austenite stabilizing element to increase the toughness of steel. The low temperature materials, such as nickel alloy steels with a nickel content of 3.5% to 9%, stainless steel and Invar, show excellent toughness at low (173 K) and cryogenic (108 K) temperatures. In particular, in the shipbuilding industry, it is mainly used for liquefied ethane and Liquefied Natural Gas (LNG) carriers, and research on low-temperature steels are attracting attention again as regulations on environmental issues are strengthened in recent years. Therefore, in this study, fatigue and fracture performances of nickel alloy steel containing 9% or less among nickel alloy steels are evaluated. Moreover, we assess the Fatigue Ductile to Brittle Transition (FDBT) of nickel alloy steels based on crack tip opening displacement (CTOD). In order to discuss the fatigue and fracture performances of nickel alloy steels, microstructure analysis carried out. As a result, CTOD and Fatigue Crack Growth Rate (FCGR) of nickel alloy steels increases as nickel contents increase. In addition, FDBT of 9% nickel alloy steel is the lowest compared to other nickel alloy steels.
1. Introduction
Nickel is one of the most utilized and important major industrial metals. In terms of steel alloying elements, nickel is used as an austenite stabilizing element to increase the toughness of steel [1,2]. The low temperature materials, such as nickel alloy steels with a nickel content of 3.5% to 9%, stainless steel and Invar, show excellent toughness at low (173 K) and cryogenic (108 K) temperatures.
As shown in Table 1, nickel alloy steels (from 3.5% to 9%) can be employed at various temperatures depending on nickel content [3]. That is, in the shipbuilding industry, it is mainly used for liquefied ethane and liquefied natural gas (LNG) carriers. In addition, as regulations on environmental issues have been strengthened in recent years, LNG demand and the use of nickel steel have increased [4]. Accordingly, the studies for fatigue and fracture performances of nickel alloy steel are steadily progressing [2,5,6,7].

Table 1.
Various temperature application of nickel alloy steel (Data from: [3]).
1.1. Prior Work of Fatigue and Fracture Performances for Nickel Alloy Steels
Kim et al. investigated the fatigue performances (S-N curves and FCGR) of 7% nickel alloy steels [5]. This research began with a comprehensive review of the fatigue performances of 7% and 9% nickel alloy steels that are widely used for LNG storage tanks. As a result, the fatigue performances of 7% nickel alloy steels are similar to those of 9% nickel alloy steel. Yoo et al. assessed fatigue and fracture performance of 9% nickel alloy steel [6]. In case of fatigue crack growth rate (FCGR), the value C increased as temperature decreased. Therefore, it was observed that fatigue crack initiation retarded as temperature decreased. Furuya et al. evaluated the fracture toughness of thermo-mechanical controlled process (TMCP) treated 6% nickel alloy steel [7]. It was demonstrated that the critical crack tip opening displacement (CTOD) of TMCP 6% nickel alloy steel was almost equivalent to that of 9% nickel alloy steel. Khodir et al. investigated the microstructures and mechanical properties of weld metals of high strength steels having 3% to 9% nickel contents [2]. As shown in Figure 1, the results showed that the fraction of retained austenite and prior austenite grain size increase as nickel contents increase.
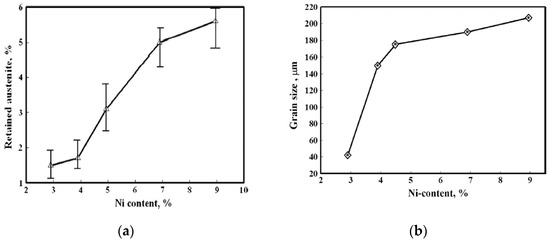
Figure 1.
The effects of nickel contents: (a) Amount of retained austenite; (b) Prior austenite grain size. Reprinted with permission from ref. [2]. Copyright 2021 Elsevier.
Unfortunately, the existing literatures have not been studied on the ductile to brittle transition temperature (DBTT) in terms of fatigue and fracture. Therefore, it is necessary to evaluate research about DBTT of nickel alloy steels, which is high toughness at cryogenic temperature, in terms of fatigue and fracture.
1.2. Fatigue Ductile to Brittle Transition (FDBT) Temperature
Paris et al. argued that the log-log curve of da/dN—ΔK showed the characteristics of fatigue crack growth in metals. They found that log-log line in linear region can appear in the form of a power function, and can be expressed as follows [8]:
where, is fatigue crack growth rate, ΔK is stress intensity factor, C and m are materials constants from the experiment.
Below the certain temperature, the slope of da/dN—ΔK curve is steep. That is, the acceleration of fatigue crack growth may be faster as of the certain temperature (ductile to brittle). A ductile to brittle transition of fatigue has been called the Fatigue Ductile–Brittle Transition (FDBT) [9]. To assess the FDBT temperature, Tobler et al. have plotted the fracture toughness and the Paris law exponent (m) [10]. As shown in Figure 2, it shows that the slope of the da/dN—ΔK curve increases while the value decrease as of the FDBT temperature.
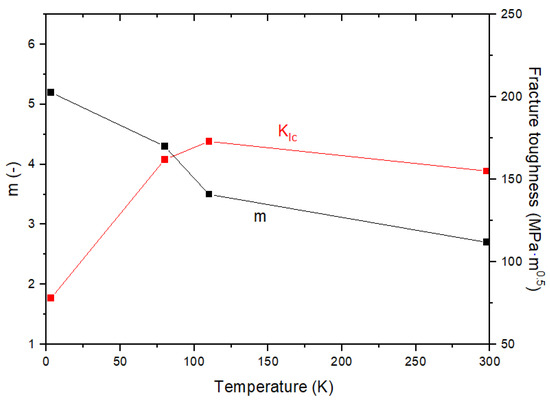
Figure 2.
Relationship of m– with low temperature for 9% nickel alloy steel Reprinted with permission from ref. [9]. Copyright 2021 Elsevier.
1.3. Fracture Toughness ( and CTOD)
Irwin and Williams defined the polar coordinate system with the origin at the crack tip for a through-thickness crack (Mode-I) in an infinite plate subjected to remote tensile stress σ, and expressed the stress field as follows [11,12]:
where, is stress tensor, r and are the polar coordinate. In addition, is angular stress function and is that explains the intensity of stress singularity at the crack tip in Mode I. Irwin et al. expressed the plastic zone size of the crack tip in Mode-I under the plane stress condition as follows [13,14].
where, is the 0.2% offset yield stress. Equation (3) estimates accurate results only for fully elastic materials. If two differently configured and loaded cracks in an elastic material have the same , then the stress field in Equation (2) and the plastic zone size in Equation (3) give the same results [15]. Therefore, the stress intensity factor is a unique measure value of the stress and strain at the elastic crack tip, and failure can be expected when reaches the critical value. In the elastic fracture criterion, is a material parameter known as fracture toughness that describes a material’s resistance to failure.
As mentioned above, are only valid if nonlinear material deformation is limited to a small scale near the crack tip. Therefore, Wells proposed another important fracture mechanics parameter, as called the CTOD in order to extend the elastic stress intensity factor approach to elastic-plastic yield conditions [16]. Using Irwin’s estimate of the plastic region size and the elastic displacement solution in the presence of a central crack in an infinite plate, the CTOD was approximated as:
The failure criteria based on CTOD assume that failure occurs when the measured CTOD is met or exceeds the critical . In addition, the displacement criterion in Equation (4) is the same as the K criterion under the condition of linear elastic crack. Using the plane stress strip yield model proposed by Dugdale for fully plastic materials, Goodier et al. and Stone found a more accurate representation of the CTOD for a central cracked infinite plate under tensile conditions [17,18,19].
When the applied stress is less than the yield stress, Equation (5) is expressed as follows:
Equation (6) is the same as Equation (4) in which the factor 4/π is omitted. The discovery of Equation (5) has led to a wide range of applications using CTOD in elastic-plastic fracture mechanics analysis since the 1960s.
1.4. Scope and Aim of This Paper
Nickel is widely used as an austenite stabilizing element in terms of alloying elements, and nickel steel is well known for its excellent toughness in a cryogenic environment. In addition, as the demand for LNG increases, interest in fatigue and fracture performances of nickel alloy steel at low and cryogenic temperatures is increasing. The aim of this study is to assess fatigue and fracture performances of nickel alloy steels with different nickel contents both at room (298 K) and cryogenic temperatures. In order to discuss the fatigue and fracture performances of nickel alloy steels, microstructure analysis carried out. Moreover, we assess the Fatigue Ductile to Brittle Transition (FDBT) of nickel alloy steels.
2. Materials and Methods
2.1. Materials
Before the summary of results for fatigue and fracture performances, the chemical composition of nickel alloy steels is presented in Table 2. In this study, the materials used in the critical CTOD and FCGR tests were 3.5Ni and 9Ni.

Table 2.
Chemical composition of nickel alloy steels (wt. %) (Data from: [20,21,22]).
The mechanical properties of nickel alloy steels are summarized in Table 3. The mechanical properties of 3.5Ni were obtained by this study and those of other nickel alloy steels were extracted from the literature [20,21,22]. The variation of yield and tensile strengths with respect to various nickel contents is shown in Figure 3. As the nickel content increases, it shows a tendency to increase yield and tensile strengths.

Table 3.
Mechanical properties of nickel alloy steels (Data from: [20,21,22]).
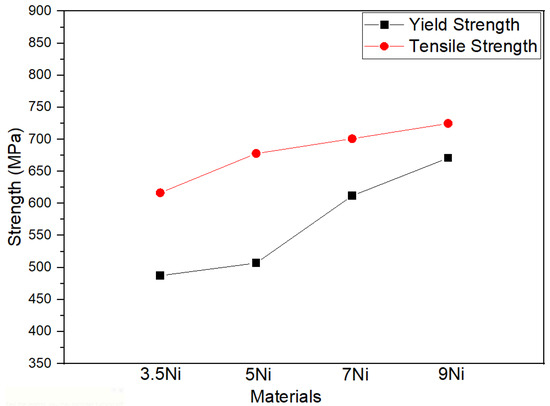
Figure 3.
Variation of mechanical properties of nickel alloy steels.
2.2. Test Condition
The critical CTOD tests are performed according to BS 7448. The geometry of compact tension (CT) specimen is given in Figure 4. Alternative specimens may have 2 ≤ W/B ≤ 4 but with no change in other proportions [23]. The width, W, is 30 mm, the thickness, B, is 15 mm.
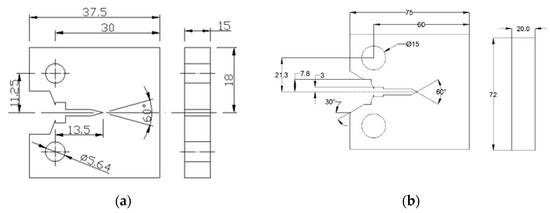
Figure 4.
Specimen design of the critical CTOD test: (a) 3.5Ni; (b) 9Ni (Unit: mm).
The geometry of the standard CT specimen is given in Figure 5. In case of CT specimens, it is recommended that the thickness be within the range W/20 ≤ B ≤ W/4 due to limitations such as specimen buckling and through-thickness crack-curvature considerations [24]. Before conducting the FCGR tests, fatigue pre-crack of 3mm was inserted in all specimens. Then FCGR tests were performed by applied condition, such as at room and cryogenic temperatures at stress ratio of 0.1 with sinusoidal frequency of 10 Hz. The test equipment used for the critical CTOD and FCGR tests was a servo hydraulic testing machine (Instron 8803, INSTRON, High Wycombe, UK) with the maximum load capacity of ±500 kN. In addition, the cryogenic temperature was controlled by the cryogenic chamber (ILWON FREEZER, Namyangju-si, Korea). Test temperatures were maintained by liquid nitrogen gas inlet-outlet control system (ILWON FREEZER, Namyangju-si, Korea).
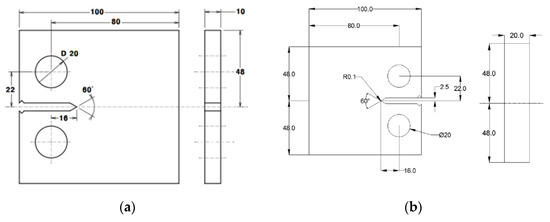
Figure 5.
Specimen design of FCGR test: (a) 3.5Ni; (b) 9Ni (Unit: mm).
3. Results
3.1. Fracture Performance (CTOD)
The critical CTOD values of 3.5Ni and 9Ni are compared with other nickel alloy steels both at room and cryogenic temperatures [20,21,22]. In case of 3.5Ni, the critical CTOD test perform at cryogenic temperature in order to compare critical CTOD values of other nickel alloy steels. As shown Figure 6, the critical CTOD values of nickel alloy steels increase as nickel contents increase. It is well known that nickel contribute to stabilization for austenite, and the critical CTOD value increase as amount of retained austenite increase [1,2,25,26]. Therefore, the critical CTOD value is influenced by nickel contents.
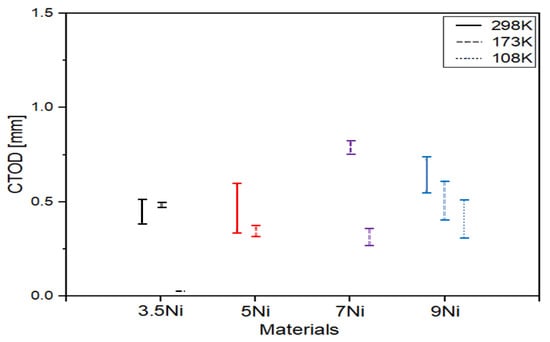
Figure 6.
Comparison of the critical CTOD values for nickel alloy steels with different nickel contents (Black color: 3.5Ni, Red color: 5Ni, Purple color: 7Ni and Blue color: 9Ni).
3.2. Fatigue Performance (FCGR)
FCGR of various nickel alloy steels in Paris region are illustrated in Figure 7 [27]. All FCGR data are summarized in terms of stress intensity factor range between 20 and 50 . As shown in Figure 7a, the fatigue crack growth rate of nickel alloy steels decreases as nickel contents increase. In terms of FCGR, the start point, which is the linear crack growth according to ΔK of 9Ni, is lower than that of 3.5Ni at room temperature. Therefore, FCGR of nickel alloy steels increase while nickel content increase as shown in Figure 7a. At low and cryogenic temperatures, FCGR of 7Ni is the lowest compared to other nickel alloy steels as presented in Figure 7b,c. In addition, Figure 7c shows that FCGR of 3.5Ni appeared abnormally fast compared to other nickel alloy steels. This result is indicated that the fatigue crack growth characteristic of 3.5Ni become brittleness at cryogenic temperature. In Section 4, these results are analyzed in terms of microstructural and FDBT temperature.
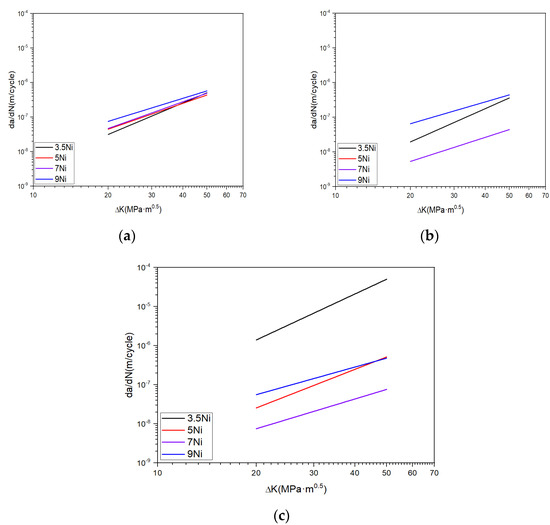
Figure 7.
Comparison of da/dN—ΔK curves of various nickel alloy steels: (a) 298 K; (b) 173 K; (c) 108 K.
In cases of the low nickel content in the nickel alloy steel, the factor m, the slope of the FCGR, increases further with decreasing temperature in comparison with the high nickel content of the nickel alloy steel. At the same temperature, the factor m increases as nickel contents decrease. These tendencies are illustrated in Figure 8a. As shown in Figure 8b, material constants from FCGR are observed to locate within a single line except some data. With regard to the heat treatment process in nickel alloy steels, 3.5Ni, 5Ni and 9Ni preform quenching and tempering (Q-T). According to Figure 8b, the Q-T treated steels have linear relationship between Log C and m irrespective of temperature. Therefore, it is possible that the relationship between Log C and m can predict FCGR of Q-T treated nickel alloy steels. The simple mathematical model of material constants and nickel contents (N) are as follows:
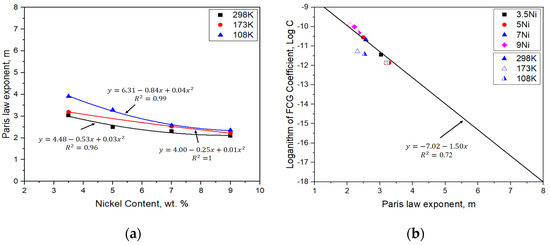
Figure 8.
Relationship of material constants in Paris equation from FCGR: (a) 3.5Ni; (b) 9Ni.
Figure 9 presents da/dN—ΔK curves of nickel alloy steel against the design curve suggested by BS 7910 [28]. Material constants for nickel alloy steel are summarized in Table 4. With the fixed slope of 3.0, material constant, C, of 9Ni is the highest compared to other nickel alloy steels. However, C value of 9Ni has about 58% lower than that in BS 7910 [28]. This implies that the C value in BS 7910 is very conservative to reflect the material constant associated FCGR of nickel alloy steels in efficient manner.
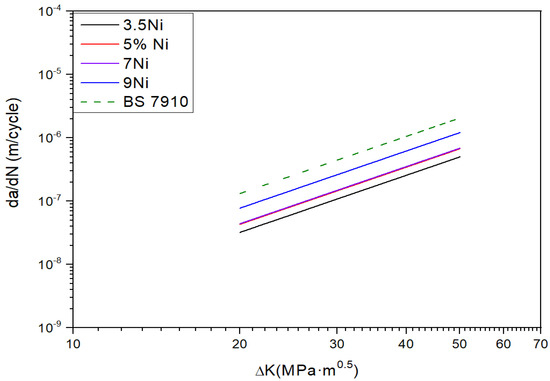
Figure 9.
Comparison of FCGR for nickel alloy steels against BS7910 with the fixed slope of 3.0.

Table 4.
Comparison of material constants for various nickel alloy steels.
4. Discussion
4.1. Microstructure Analysis
In this study, Figure 10 presents the dimple structure of fracture surface in order to discuss the fracture characteristic of nickel alloy steels. The dimple size of 3.5Ni is smaller than that of 9Ni as shown in Figure 10a,b. It is found that the dimple size is influenced by nickel contents. In terms of Figure 10b,c, the dimple size after the critical CTOD test at cryogenic temperature is smaller than that at room temperature. Therefore, the tendency of fracture toughness by nickel contents is reasonable according to analysis of dimple size.
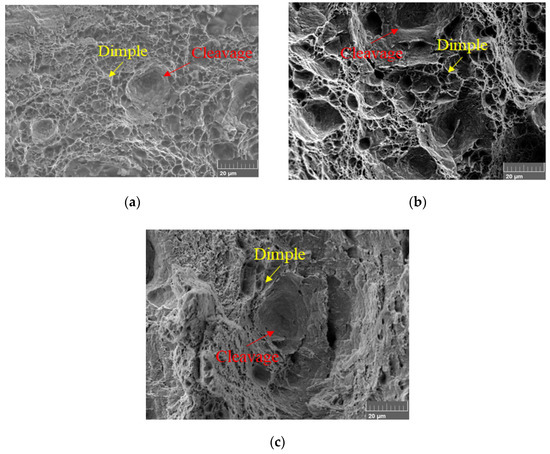
Figure 10.
Dimple size by SEM images: (a) 3.5Ni at 298 K; (b) 9Ni at 298 K; (c) 9Ni at 108 K.
Figure 11 presents the fatigue striations of 3.5Ni and 9Ni by scanning electron microscope (SEM) image [29]. As a results, the fatigue striation spacing of 3.5Ni is narrower than that of 9Ni. It is expected that FCGR of 9Ni is fast compared to 3.5Ni based on the fatigue striation spacing. As shown in Figure 11c, it was confirmed that Fatigue striation is hardly found in the fracture surface after the FCGR test of 3.5Ni at cryogenic temperature. Therefore, the FCGR of 3.5Ni at cryogenic temperature may be analyzed through fatigue striation. In addition, FCGR of nickel alloy steels obtained from this study are reasonable according to existing paper and microstructure analysis.
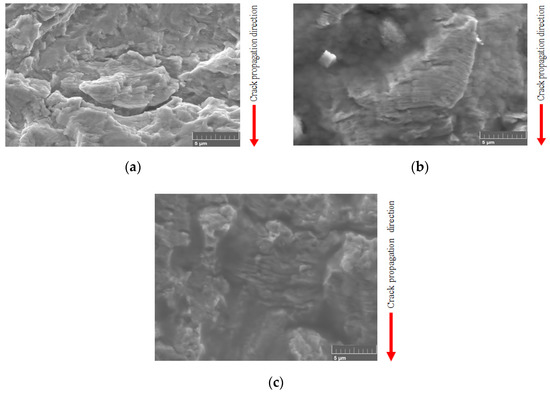
Figure 11.
Fatigue striation of nickel alloy steels after FCGR test: (a) 3.5Ni at 298 K; (b) 9Ni at 298 K; (c) 3.5Ni at 108 K.
As mentioned above, it is confirmed that the growing prior austenitic grain size led to increase the fraction of retained austenite [2]. In addition, it is well known that the fracture toughness increases while the fraction of retained austenite increases [30]. As shown in Figure 12, the relationship between prior austenite grain size and FCGR was confirmed by existing paper. In case of the region of low ΔK, FCGR increases and decreases as prior austenite grain size increases [31].
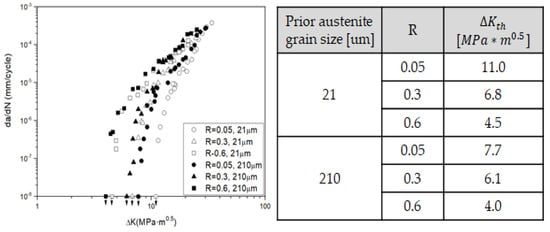
Figure 12.
The influence of prior austenite grain size on FCGR (Data from: [31]).
To analyze fatigue and fracture performance, we observe the microstructure of nickel alloy steels. For microstructure analysis, a small part of nickel alloy steels were soaked in 3% Nital etchant. Microstructure is observed by optical microscopy (OM). Figure 13 present the microstructure of 3.5Ni and 9Ni. The prior austenite grain size is calculated according to ASTEM E112 [32]. The prior austenite grain size of 9Ni is about 3 factor longer than that of 3.5Ni. Therefore, fatigue and fracture performances of nickel alloy steels increases when the prior austenite grain size increases. The prior austenite grain sizes of nickel alloy steels are summarized in Table 5.
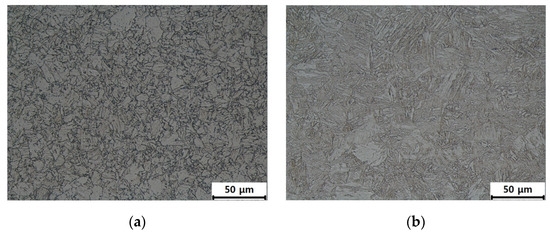
Figure 13.
Microstructure of nickel alloy steels: (a) 3.5Ni; (b) 9Ni.

Table 5.
Comparison of prior austenite grain diameter for nickel alloy steels.
4.2. FDBT Temperatures for Nickel Alloy Steels
As mentioned above, Tobler et al. found the FDBT temperature of 9Ni based on -m relationship [10]. However, since is a suitable fracture toughness parameter in the elastic fracture mechanics, it is necessary to derive the FDBT temperature on the basis of the relationship of the critical CTOD-m for high toughness materials to which elastic-plastic fracture mechanics is applied. In addition, in order to obtain an FDBT temperature suitable for nickel steel, a comparison of the FDBT temperature derived based on and the critical CTOD is required. In this study, we compare to the critical CTOD and the Paris law exponent (m) on the same plot. As shown in Figure 14, the critical CTOD values decrease and m increase as temperature decrease. In case of m value, the variation of 9Ni is more stable than that of 3.5Ni. In addition, the FDBT temperature by the critical CTOD decreases as amount of nickel contents increase. Based on FDBT temperature by the relationship of the critical CTOD-m, no brittle failure exists in the fatigue and fracture performances of the nickel alloy steels at the actual operating temperature.
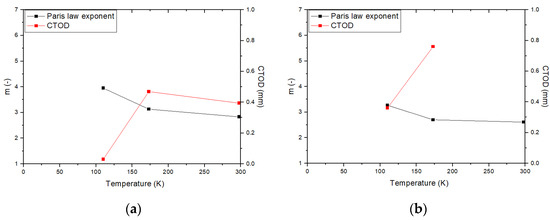
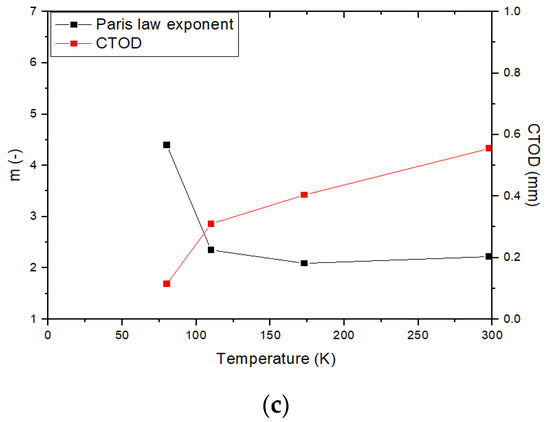
Figure 14.
Comparison of m–the critical CTOD relationship: (a) 3.5Ni; (b) 7Ni; (c) 9Ni.
In order to compare FDBT temperatures of nickel alloy steels based on the relationship of -m, values for nickel alloy steel are obtained using the conversion equation given in BS7910 [28]:
where, E is elastic modulus, δ is the critical CTOD, ν is poisson’s ratio and n is Equation (11):
where, is tensile stress. Figure 15 shows -m relationship for nickel alloy steels according to various temperatures. FDBT temperatures of various nickel alloy steels are summarized in Table 6. To verify the validity of the derived results, it was confirmed that the FDBT temperature of 9Ni was similar to the FDBT temperature suggested by Tobler et al. as shown in Figure 15c [10]. In Figure 15, the FDBT temperatures by are lower than thoes by the critical CTOD. Wells confirmed that the plastic deformation (blunting effect) of the crack tip is proportional to the toughness value of the material [33]. For high toughness materials, it can be inferred that , a fracture toughness parameter based on elastic fracture mechanics, does not accurately reflect the plastic deformation at the crack tip and strain hardening effect. Therefore, the FDBT temperature by may inaccurately predict the actual brittleness temperature of the material in a cryogenic environment, leading to a situation in which the structure is operated in a condition vulnerable to brittleness.
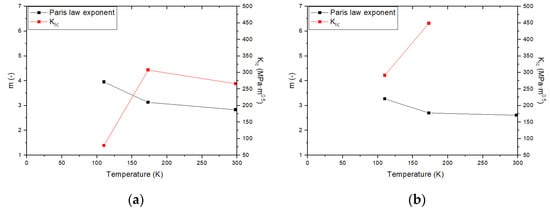
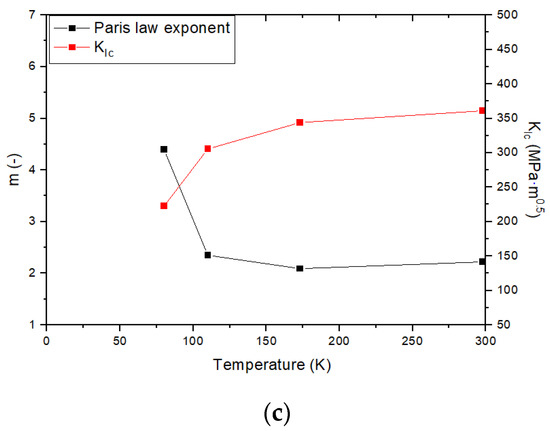
Figure 15.
Comparison of m– relationship: (a) 3.5Ni; (b) 7Ni; (c) 9Ni.

Table 6.
FDBT temperatures of nickel alloy steels.
5. Conclusions
The aim of this study is to assess fatigue and fracture performances of nickel alloy steels with different nickel contents both at room and cryogenic temperatures. Based on the results from this study, the following conclusions are drawn:
- The critical CTOD values of nickel alloy steels increase as nickel contents increase. It is well known that nickel contribute to stabilization for austenite, and the critical CTOD value increase as amount of retained austenite increase. Therefore, the critical CTOD value is influenced by nickel contents.
- The FCGR of nickel alloy steels increase while nickel content increase. In cases of the low nickel content in the nickel alloy steel, the factor m, the slope of the FCGR, increases further with decreasing temperature in comparison with the high nickel content of the nickel alloy steel. In addition, the factor m increases as nickel contents decrease at the same temperature. The material constants from FCGR are observed to locate within a single line except some data.
- The dimple size of 3.5Ni is smaller than that of 9Ni. In addition, the dimple size after the critical CTOD test at cryogenic temperature is smaller than that at room temperature. Therefore, the tendency of fracture toughness by nickel contents is reasonable according to analysis of dimple size. In case of fatigue striation, 3.5Ni is narrower than 9Ni. It is expected that FCGR of 9Ni is fast compared to 3.5Ni based on the fatigue striation spacing. Therefore, FCGR of nickel alloy steels obtained from this study are reasonable according to existing paper and microstructure analysis.
- Based on FDBT temperature by the relationship of the critical CTOD-m, no brittle failure exists in the fatigue and fracture performances of the nickel alloy steels at the actual operating temperature. The FDBT temperature by the critical CTOD and decreases as amount of nickel contents increase. In addition, the FDBT temperatures by are lower than thoes by the critical CTOD. The different criterion for fracture toughness parameters lead to this discrepancy. For high toughness materials, it can be inferred that , a fracture toughness parameter based on elastic fracture mechanics, does not accurately reflect the plastic deformation at the crack tip and strain hardening effect.
Author Contributions
Conceptualization, J.Y.P. and M.H.K.; methodology, J.Y.P.; validation, J.Y.P., B.K.K. and D.G.N.; formal analysis, J.Y.P.; investigation, J.Y.P.; writing—original draft preparation, J.Y.P.; writing—review and editing, M.H.K.; visualization, J.Y.P.; supervision, J.Y.P.; project administration, J.Y.P.; funding acquisition, B.K.K. and D.G.N. All authors have read and agreed to the published version of the manuscript.
Funding
This research received no external funding.
Data Availability Statement
The data presented in this study are available on request from the corresponding author.
Acknowledgments
This study has been conducted with the support of the Korea Institute of Industrial Technology as “Development of wear-resistant hardfacing materials and processes for NPP valve seat and disc (141571933, 20206500000020)”.
Conflicts of Interest
The authors declare no conflict of interest.
References
- Ahssi, M.A.M.; Erden, M.A.; Acarer, M.; Çuğ, H. The Effect of Nickel on the Microstructure, Mechanical Properties and Corrosion Properties of Niobium–Vanadium Microalloyed Powder Metallurgy Steels. Materials 2020, 13, 4021. [Google Scholar] [CrossRef] [PubMed]
- Khodir, S.; Shilbayanagi, T.; Takahashi, M.; Abdel-Aleem, H.; Ikeuchi, K. Microstructural Evolution and Mechanical Properties of High Strength 3–9% Ni-steel Alloys Weld Metals Produced by Electron Beam Welding. Mater. Des. 2020, 60, 391–400. [Google Scholar] [CrossRef]
- International Association of Classification Societies. Requirement Concerning Materials and Welding; International Association of Classification Societies: London, UK, 2015. [Google Scholar]
- Revised MARPOL Annex VI, Amendments to the Annex of the Protocol of 1997 to Amend the International Convention for the Prevention of Pollution from Ships; International Maritime Organization: London, UK, 2016.
- Kim, Y.W.; Oh, D.J.; Lee, J.M.; Noh, B.J.; Sung, H.J.; Ando, R.; Matsumoto, T.; Kim, M.H. An Experimental Study for Fatigue Performance of 7% Nickel Steels for Type B Liquefied Natural Gas Carriers. J. Offshore Mech. Arct. Eng. 2016, 138, 1–6. [Google Scholar] [CrossRef]
- Yoo, C.H.; Kim, K.S.; Choung, J.M.; Kim, S.H.; You, W.H. An Experimental Study on Behaviors of IMO Type B CCS Materials at Room and Cryogenic Temperatures. In Proceedings of the ASME 2011 30th International Conference on Ocean, Offshore and Arctic Engineering, Rotterdam, The Netherlands, 19–24 June 2011. [Google Scholar]
- Furuya, H.; Saitoh, N.; Takahashi, Y.; Kurebayashi, K.; Kayamori, Y.; Inoue, T.; Uemori, R.; Okushima, M. Development of 6% Nickel Steel for LNG Storage Tanks. In Proceedings of the ASME 2011 30th International Conference on Ocean, Offshore and Arctic Engineering, Rotterdam, The Netherlands, 19–24 June 2011. [Google Scholar]
- Paris, P.C.; Erdogan, F. A Critical Analysis of Crack Propagation Laws. J. Basic Eng. 1960, 85, 528–534. [Google Scholar] [CrossRef]
- Walters, C.L.; Alvaro, A.; Maljaars, J. The effect of low temperatures on the fatigue crack growth of S460 structural steel. Int. J. Fatigue 2016, 82, 110–118. [Google Scholar] [CrossRef]
- Tobler, R.L.; Cheng, Y.W. Midrange fatigue crack growth data correlations for structural alloys at room and cryogenic temperatures. Fatigue Low Temp. 1985, 16, 5–30. [Google Scholar]
- Irwin, G.R. Analysis of Stresses and Strains Near the End of a Crack Traversing a Plate. J. Appl. Mech. 1957, 24, 361–364. [Google Scholar] [CrossRef]
- Williams, M.L. On the Stress Distribution at the Base of a Stationary Crack. J. Appl. Mech. 1957, 24, 109–114. [Google Scholar] [CrossRef]
- Irwin, G.R.; Kies, J.A.; Smith, H.I. Fracture Strengths Relative to Onset and Arrest of Crack Propagation. Proceeding Am. Soc. Test. Mater. 1958, 57, 640–660. [Google Scholar]
- Irwin, G.R. Plastic zone near a crack and fracture toughness. In Proceedings of the 7th Sagamore Ordnance Materials Conference, New York, NY, USA, 16–19 August 1960. [Google Scholar]
- Xian, K.Z.; James, A.J. Review of Fracture Toughness (G, K, J, CTOD, CTOA) Testing and Standardization. Eng. Fract. Mech. 2012, 85, 1–46. [Google Scholar]
- Wells, A.A. Application of fracture mechanics at and beyond general yielding. Br. Weld. J. 1963, 10, 563–570. [Google Scholar]
- Dugdale, D.S. Yielding of steel sheets containing slits. J. Mech. Phys. Solids 1960, 8, 100–108. [Google Scholar] [CrossRef]
- Goodier, J.N.; Field, F.A. Plastic Energy Dissipation in Crack Propagation; Drucker, D.C., Gilman, J.J., Eds.; The Fracture of Solids: New York, NY, USA, 1963; pp. 103–118. [Google Scholar]
- Burdekin, F.M.; Stone, D.E.W. The crack opening displacement approach to fracture mechanics in yielding materials. J. Strain Anal. Eng. Des. 1966, 1, 145–153. [Google Scholar] [CrossRef]
- Hyundai Heavy Industries Co., Ltd. Mechanical and Fatigue Properties at Room and Cryogenic Temperatures for 9% Ni Steel; Technical report; Hyundai Heavy Industries Co., Ltd.: Ulsan, Korea, 2012.
- Scheid, A.; Felix, L.M.; Martinazzi, D.; Renck, T.; Kwietniewski, C.E.F. The Microstructure Effect on the Fracture Toughness of Ferrite Ni-alloyed Steels. Mater. Sci. Eng. A 2016, 661, 96–104. [Google Scholar] [CrossRef]
- Park, J.Y.; Lee, J.M.; Kim, M.H. An Investigation of the Mechanical Properties of a Weldment of 7% Nickel Alloy Steels. Metals 2016, 6, 285. [Google Scholar] [CrossRef] [Green Version]
- BS 7448; British Standard. Method for Determination of Critical CTOD and Critical J Values of Metallic Materials. The British Standards Institution: London, UK, 1991.
- ASTM E647; Standard Test Method for Measurement of Fatigue Crack Growth Rates. American Society for Testing and Materials: West Conshohocken, PA, USA, 2013.
- Pistorius, P.C.; Toit, M.D. Low-Nickel Austenitic Stainless Steels: Metallurgical Constraints. In Proceedings of the Twelfth International Ferroalloys Congress, Helsinki, Finland, 6–9 June 2010. [Google Scholar]
- Jang, J.I.; Yang, Y.C.; Kim, W.S.; Kwon, D.G. Evaluation of Cryogenic Fracture Toughness in SMA-Welded 9% Ni Steels through Modified CTOD Test. Met. Mater. 1997, 3, 230–238. [Google Scholar] [CrossRef]
- Mchenry, H.I.; Reed, R.P. Fracture Behavior of the Heat-Affected Zone in 5% Ni Steel Weldments. Weld. Res. Suppl. 1977, 4, 104–112. [Google Scholar]
- BS 7910; Guide to Methods for Assessing the Acceptability of Flaws in Metallic Structures. British Standards Institution: London, UK, 2013.
- Park, J.J.; Kim, M.H. Investigation of Fatigue and Fracture Characteristics for Low-Temperature Metals considering the Effects of Various Alloying Components. Weld. World 2020, 64, 1691–1702. [Google Scholar] [CrossRef]
- Strife, J.R.; Passoja, D.E. The Effect of Heat Treatment on Microstructure and Cryogenic Fracture Properties in 5Ni and 9Ni Steel. Metall. Trans. A 1980, 11, 1341–1350. [Google Scholar] [CrossRef]
- Murakami, R.; Akizono, K. Influence of Prior Austenite Grain Size and Stress Ratio on Near Threshold Fatigue Crack Growth Behavior of High Strength Steel. J. Soc. Mater. Sci. 1980, 29, 1011–1017. [Google Scholar] [CrossRef]
- ASTM E112; Standard Test Methods for Determining Average Grain Size. American Society for Testing and Materials: West Conshohocken, PA, USA, 2010.
- Wells, A.A. Unstable Crack Propagation in Metals: Cleavage and Fast Fracture. In Proceedings of the Crack Propagation Symposium, Cranfield, UK, 26–28 September 1961. [Google Scholar]
Publisher’s Note: MDPI stays neutral with regard to jurisdictional claims in published maps and institutional affiliations. |
© 2022 by the authors. Licensee MDPI, Basel, Switzerland. This article is an open access article distributed under the terms and conditions of the Creative Commons Attribution (CC BY) license (https://creativecommons.org/licenses/by/4.0/).