Review

Corrosion Monitoring in Atmospheric Conditions: A Review

Department of Metallic Construction Materials, University of Chemistry and Technology Prague, Technopark Kralupy, Nám. G. Karse 7, 278 01 Kralupy nad Vltavou, Czech Republic
*
Author to whom correspondence should be addressed.
Metals 2022, 12(2), 171; https://doi.org/10.3390/met12020171
Submission received: 23 December 2021 / Revised: 11 January 2022 / Accepted: 12 January 2022 / Published: 18 January 2022
(This article belongs to the Special Issue Corrosion and Protection of Metallic Materials)

Abstract

:
A variety of techniques are available for monitoring metal corrosion in electrolytes. However, only some of them can be applied in the atmosphere, in which case a thin discontinuous electrolyte film forms on a surface. In this review, we describe, evaluate and compare both traditional and state-of-the-art real-time corrosion monitoring techniques to identify those suitable for atmospheric conditions. For atmospheric corrosion monitoring (ACM), electrochemical impedance spectroscopy (EIS), electrochemical noise (EN), electrical resistance (ER) probes, quartz crystal microbalance (QCM), radio-frequency identification sensors (RFID), fibre optic corrosion sensors (FOCS) and respirometry, the underlying principles, characteristics and application examples are described, and their advantages and drawbacks outlined. Finally, the techniques are compared in terms of their sensitivity, ease of setup, data processing, ability to identify underlying corrosion mechanisms and applicability in different fields of atmospheric corrosion protection and research.

1. Introduction

The atmospheric corrosion of metallic materials has huge financial, environmental and cultural implications. In 2016, the Association for Material Protection and Performance (AMPP) published the International Measures of Prevention, Application, and Economics of Corrosion Technologies (IMPACT) report, which estimated the global cost of corrosion to be equivalent to 3.4% of the global Gross Domestic Product. They calculated that by using the available corrosion control techniques, it would be possible to save between 15 and 35% of the total corrosion cost [1]. Alongside financial losses, undetected corrosion can cause sudden industrial and transport failures that may result in environmental catastrophes and hazards that endanger health and lives. Furthermore, corrosion is known to induce irreversible damage in, or even destruction of, unique cultural artefacts.
Atmospheric corrosion is a complex process of interaction between materials and the environment. Environmental corrosivity is dependent on various parameters, including relative humidity (RH), temperature (T) and air pollutant concentrations. Thus, understanding the corrosion of metallic materials requires detailed knowledge of these parameters and their effect on the underlying corrosion processes [2]. The main tools used to assess environmental corrosiveness, corrosion progression, material corrosion behaviour and the effects of coatings and inhibitors, involve cumulative or real-time monitoring of corrosion rates and environmental parameters, and frequent equipment inspections. This review is focused on real-time corrosion monitoring, which we define as a long-term instantaneous measuring of parameters directly linked to corrosion loss.
Many real-time corrosion monitoring techniques have been developed for monitoring of metal corrosion in electrolytes. However, their applicability is limited under atmospheric conditions, under which a thin electrolyte layer is formed on a metallic surface. This limitation particularly relates to electrochemical methods that require a conductive connection between the electrodes. Modified electrochemical and non-electrochemical real-time corrosion monitoring techniques have been developed for use in both indoor and outdoor atmospheres. Such techniques are designed to meet the requirements of easy measurement and data interpretation, direct corrosion rate determination, rapid responses to changes in corrosivity and wide applicability in environments with different influences on corrosivity [3]. In the last decade, these techniques have evolved, but no paper summarizing the developments has been published.
In this review, the following techniques are covered: electrochemical noise (EN), electrochemical impedance spectroscopy (EIS), quartz crystal microbalance (QCM), electrical resistance (ER) probes, galvanic corrosion sensors (also called atmospheric corrosion monitor, ACM), fibre optic corrosion sensors (FOCS), radio-frequency identification (RFID) sensors and respirometry. As papers reviewing the setups and applications of EN, EIS and QCM were published recently, these techniques are only described briefly, and more detailed studies are cited. Particular attention is paid to ER probes and ACM sensors, which have not been reviewed in recent years, and to FOCS, RFID and respirometry, which were only designed in the last decade. The state-of-the-art developments and potential issues associated with each of these techniques are explored in detail. The exposure of metallic coupons is often used for corrosivity classification and other corrosion studies. Although this technique does not provide real-time data, it is commonly used as a reference technique and is therefore also briefly introduced in this review. Finally, the key parameters of the techniques, including sensitivity, data processing procedure and applicability in different environments, are summarised for quick and easy reference.

2. Corrosion Coupons

The mean corrosion rate can be evaluated from mass loss, mass gain or coulometric reduction of corrosion products after exposure of metal coupons in corrosive environments.
Generally, the mass loss procedure is used for the assessment of outdoor corrosivity, whereas mass gain is evaluated for coupons exposed indoors [4]. Mass loss data are obtained by removing corrosion products after exposure mechanically, chemically or both. Procedures of corrosion products removal are standardised for iron, copper, aluminium, magnesium, lead, nickel, zinc, tin and their alloys [5]. A pickling solution usually comprises an aggressive component for corrosion products dissolution and a corrosion inhibitor limiting the rate of uncorroded metal dissolution [6]. The situation in which corrosion products are totally removed, leaving uncorroded metal unaffected, is ideal but seldom achieved. For this reason, pickling is done in time intervals to differentiate a rapid mass decrease due to prevailing dissolution of corrosion products from a slower mass decrease linked to uncorroded metal loss [7]. The average corrosion rate vcorr,avg in mm per year is then calculated according to equation:
v c o r r ,   a v g = 87.6 Δ m ρ · A · t
where Δm is mass loss in mg, ρ is metal density in g cm−3, A is coupon area in cm2 and t is exposure time in hours. Other units for Δm, ρ, A and t would change the value of the constant [7].
The mass gain approach requires all corrosion products to stay on the surface after exposure. This measurement is non-destructive and can be realised in situ. However, a mass increase can be caused by humidity sorption and dust deposition, along with formation of corrosion products [8].
Determination of corrosion rate by electrolytic cathodic reduction is standardised for silver and copper [9]. This technique is based on the cathodic reduction of corrosion products in an electrochemical cell under constant current, with the electrode potential being recorded as a function of time. The corrosion rate vcorr,avg is then calculated according to Faraday’s law [9]:
v c o r r ,   a v g = i · t r e d · M n · F · t
where i is current density [mA m−2], tred is total time for corrosion products reduction [s], M is metal relative molecular mass, n is its valence (1 for silver, 1 or 2 for copper), F is Faraday’s constant and t is exposure time in years. Copper corrosion products with copper in both +1 and +2 valence states may be present, leading to the difficulties in the measured potential’s interpretation.
The benefits of the coupon method are its low price and the possibility of exposing them in any media and conditions. Corrosion morphology can be studied and corrosion products analysed to understand the corrosion mechanism. Good reproducibility of 3–5% was reported [6]; however, it can be lower in weakly corrosive environments or after short exposure times. Coupons can be stressed, welded or covered with protective layers to examine stress corrosion, compare the corrosion behaviour of welded and non-welded materials or evaluate protective layer’s effectiveness.
The main disadvantage of the technique is the fact that a long-time exposure is usually needed to obtain reliable corrosion rate values using coupons. Current standards require at least 1 month, and more commonly 1 year, of exposure for corrosivity classification using coupons both indoors and outdoors [10,11]. For non-standardised tests, the exposure duration must be adequate to the corrosion loss. As a rule of thumb for the test duration, it was proposed that the exposure time in hours should equal to 50/vcorr,avg [7]. Chemical cleaning may also affect the measurement precision, especially if only a small amount of corrosion products is formed [6]. Another principal limitation of the coupon technique is the impossibility to derive how the corrosion rate changed in time; i.e., it cannot be considered as a real-time method.

3. Real-Time Corrosion Monitoring

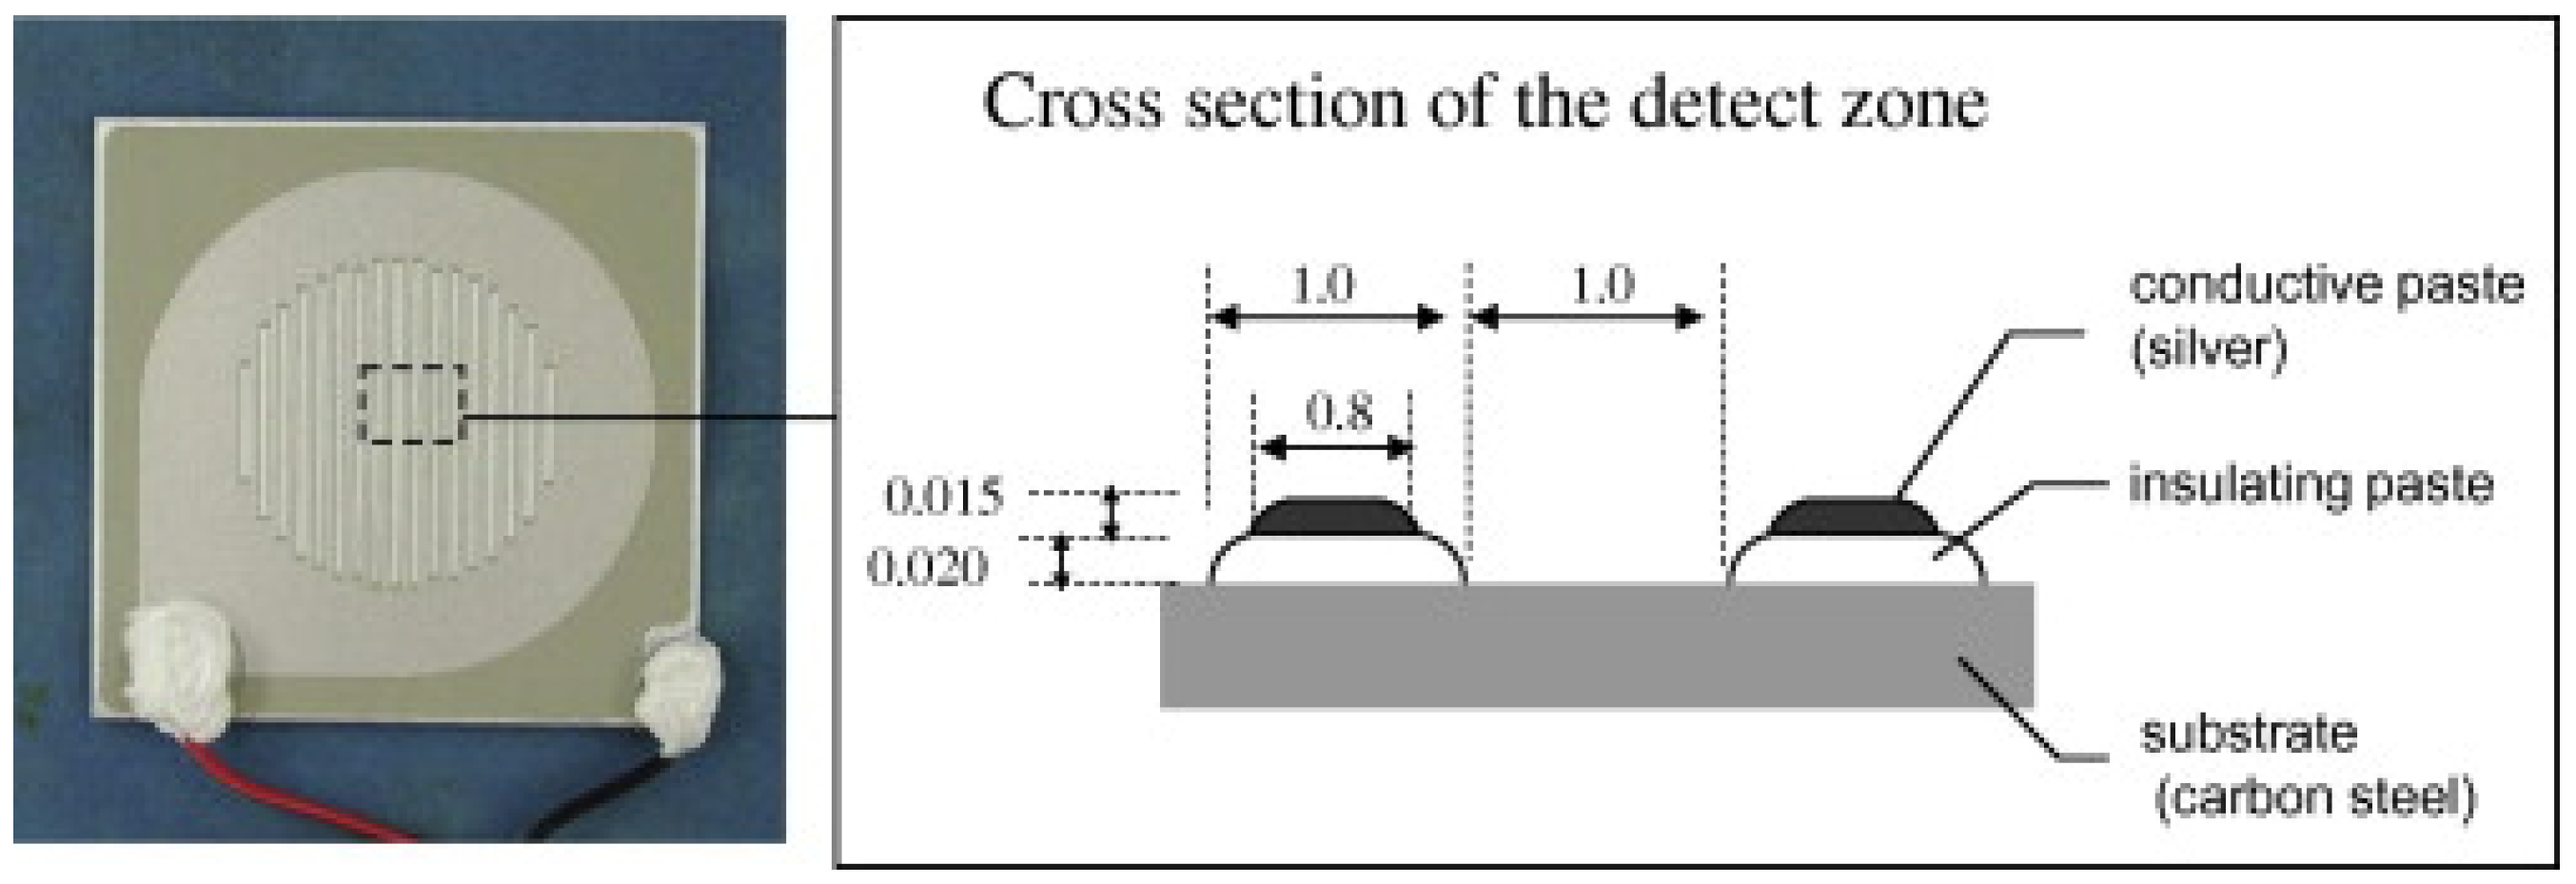
3.1. Galvanic Corrosion Sensor, Atmospheric Corrosion Monitor

When two dissimilar metals are immersed in a conductive solution or electrically connected with a surface electrolyte layer, the potential difference between them leads to galvanic current generation [12]. This is the principle of galvanic corrosion sensors.
The first attempts to quantify atmospheric corrosion using galvanic sensors were made in the late 1950s. In 1956, Tomashov et al. monitored the surface moisture using a sensor that consisted of alternating electrodes of iron or copper coupled with zinc or aluminium [13]. Shortly after in 1958, Sereda [14] determined the time of wetness by measuring the current between a platinum foil and a zinc panel. Later, Sereda et al. developed a miniature galvanic sensor consisting of copper or zinc paired with gold [15]. In 1994, Motoda et al. [16,17] reported on a Fe/Ag galvanic sensor termed the atmospheric corrosion monitor (ACM).
An ACM is in principle composed of two different metal electrodes initially insulated from each other, as shown in Figure 1. One metal is a noble metal acting as a cathode (gold, copper), and the second one is the metal of interest (iron, zinc, aluminium, copper), which corrodes during the measurement and thus becomes an anode. At high relative humidity [18], a thin conductive layer of moisture and environmental pollutants condenses on the electrodes. The electrolyte connects the electrodes, and galvanic current is generated and can be measured by a galvanometer or zero resistance ammeter (ZRA). A galvanic sensor can thus be used as a dew detector, time of wetness meter and moisture sensor [13,19]. The galvanic current is also proportional to corrosion current in reactions with the cathodic current being under diffusion control [18]. It is thus related to the corrosion rate and conductance of the water film. A good correlation between the galvanic current and the corrosion rate of steel and zinc was reported [20].
Although galvanic coupling with the noble cathode accelerates anodic metal corrosion, Pei et al. calculated the influence of the galvanic cell for a carbon steel/copper coupling, and reported the effect to be less than 10% of the natural steel corrosion rate [22]. Based on this finding, the authors considered the corrosion status of steel in ACM cell to be basically the same as that of steel coupons exposed in parallel [22]. Electrodes of identical dimensions were used in this study (see Figure 2). The effect of the galvanic cell is expected to be lower if a smaller cathode and larger anode are connected.
The ACM data interpretation requires careful consideration of rainfall, dew and corrosion products’ formation effects [20,24]. Condensation and precipitation induce extra current, which does not corresponding to a corrosion rate increase, and has to be corrected. Several approaches are applied to determine the current thresholds which indicate dew and rainfall. As the rainfall causes a large and rapid current increase, the conventional method defines the rainfall start as the value of current exceeding the threshold defined for the given sensor and being doubled in 10 min starting from the non-rainfall conditions [24,25,26]. The rainfall end is defined as the time when the output falls to less than a half of its previous value, or below the threshold [25,26]. The high outputs related to rainfall are multiplied with a correction coefficient also known as a cell factor or a conversion factor AQ [24,25,26].
Cao et al. determined a cell factor value by comparing the ACM data and the mass loss of simultaneously exposed coupons according to the equation [27]:
A Q = Δ m A C M Δ m c o u p o n s
where ΔmACM is weight loss obtained by integration of ACM current, and Δmcoupons is the weight loss of simultaneously exposed coupons.
They reported the cell factor being almost constant over time at a single test site but different among test sites [27]. The average cell factor value was used for signal correction at one site. The authors supposed the cell factor to be higher in more polluted areas and proposed a corrosivity classification based on ACM current and cell factor values. However, the cell factor of 0.2 is frequently used as the conventional one regardless of a test site, as it provides a good correlation between the ACM and coupon data [26].
The described rainfall correction without data pre-analysis was claimed to cause corrosion rate underestimation, as many ACM outputs are considered to be related to rainfall and subjected to the cell factor multiplication [24]. Fuse et al. exposed mock pipes with ACMs in a coastal environment, recording RH, T and precipitation and evaluating the sea salt deposition in parallel [24]. Based on the daily salt deposition estimation and RH, a new ACM data pre-processing procedure with consecutive rainfall/dew/dry classification was proposed. The error caused by incorrect rainfall corrections was reduced by approximately half and the corrosion rate divergence by up to 40% compared to the conventional approach.
During measurements in the atmosphere, uneven distribution of current and potential and the fact that the chemical composition in a thin liquid layer changes with its thickness make the ACM data difficult to interpret [28]. Along with the data processing uncertainties, a drawback of the ACM is its reliance on the electrolyte layer’s presence. When the electrolyte is too resistive or discontinuous, the measurement is interrupted, while the corrosion process subsists [29,30]. Similarly, if the insulating material between the electrodes is hydrophobic to any degree, the electrolyte may not spread across [13]. Pei et al. calculated the lowest steel corrosion rate detectable by carbon steel/Cu ACM as 60 g m−2 a−1, which corresponds to C2 corrosivity classification according to ISO 9223:2012 [22]. According to Huang et al., the output signal is difficult to differentiate from noise due to difficulties with the electrolyte layer formation in weakly corrosive environments, as the sensor is dry, and practically random current readings induced by the power-line interference of the surrounding equipment and apparatus are recorded [30]. The authors noticed the signal intensity was dependent on the sensor size, and improved the Fe/Zn sensor design and the measurement setup by adding a large resistor in parallel and recording the voltage outputs instead of galvanic current to reduce the noise when the sensor was dry and maintain good sensitivity when the sensor was wet.
Generally, the data processing includes recording of galvanic current as the measurement output, correction of the rainfall and dew effect in the signal and correlation between the signal and mass loss of coupons or environmental parameters (T, RH, pollutants).
The practical applications of ACMs in recent years were primarily focused on corrosion monitoring during field exposure tests and accelerated corrosion tests (ACTs) and constructing prediction models based on the obtained data. Ahn et al. obtained a good linear correlation between the mass loss of carbon and weathering steel and the ACM current output during exposure in a salt spray ACT. Based on the correlation, a prediction model was proposed and verified [20]. To et al. applied ACMs to study the effects of Cl, SO42− and NO3-containing artificial rain on the corrosion of copper, iron, zinc and aluminium [19,31]. The authors reported high sensitivity of Fe/Ag and Zn/Ag sensors. Being sensitive to the presence of Cl and NO3, but not SO42−, Al/Ag sensors were proposed for use as pollutant indicators. Cu/Ag sensors had low corrosion rates in all environments and were thus recommended to be utilised as the time of wetness meters. Mizuno et al. installed a carbon steel/Ag ACM sensor and bare carbon steel and hot-dip galvanised steel samples in various parts of a vehicle to study T, RH and salt deposition effects [21]. The authors calculated corrosion rates of bare and zinc coated steel from a linear correlation between the ACM output and mass loss and used them to predict the component service life. Pei et al. used carbon steel/Cu sensors shown in Figure 2 to monitor the impact of environmental parameters outdoors [22]. T, RH and rainfall were found to be the main factors affecting corrosion. Together with the ACM measurements and rust formation parameters, these data served as input into a random forest machine learning model for the corrosion rate prediction [23]. The authors reported a high prediction accuracy of 94.7% of the model. In another study, the group applied hidden Markov models to establish a relationship between the ACM current output and environmental parameters [32]. They proposed a corrosion index as a combination of environmental variables for air corrosivity quantification and corrosion prediction.
Goidanich et al. proposed a sensor based on the galvanic principle to monitor the corrosion of gilded bronze objects in museums [33]. Bronze substrate was separated from a golden layer by corrosion products (patina) to simulate the actual state of historical gilded bronze objects and to avoid short circuits between the gilding and substrate. The authors reported stable and reliable behaviour by the sensors, and their ability to measure even under 15% RH [33].
A commercial device for corrosivity assessment using Fe/Ag and Zn/Ag sensors, along with T and RH sensors, is offered by Ueda Industry [34]. The monitoring unit is a battery powered device capable of direct data collection for 1 year with 10 min measurement frequency. Outputs from up to 20 measuring devices are collected wirelessly by another unit, enabling remote access to the measured data.

3.2. Electrochemical Impedance Spectroscopy

Electrochemical impedance spectroscopy (EIS) is a non-destructive monitoring technique used for studying processes at the electrolyte/metal interface. It provides information about a corrosion mechanism and protective effectiveness of coatings. Application of EIS in the field of corrosion was introduced by Epelboin et al. in 1981 [35] and significantly broadened during the last decades. Although EIS under atmospheric conditions is limited due to the necessity of an electrolyte, it has been utilised in numerous corrosion studies performed in the atmosphere in the last few years.
EIS allows to study capacitive, inductive and diffusion processes taking place in an electrochemical cell. The measurement is based on the application of a low amplitude alternation potential wave (usually 10–20 mV) on the top of corrosion potential in an electrochemical cell and recording the current flowing through the cell. Electrochemical impedance, Z, as a parameter analogical to electrical resistance in systems with complex behaviour, which cannot be described with the Ohm’s law, is measured [6]. Detailed descriptions of the EIS fundamentals and measurement results’ representations can be found elsewhere—for example, in [36].
Two or three-electrode setups are utilised for the EIS measurements. The three-electrode system consists of a reference (RE), counter (CE; inert) and working electrode (WE; a tested material). The two-electrode arrangement includes WE and a single RE/CE electrode; both electrodes can be made of the same material [37,38]. Electrochemical probes or electrochemical sensors can be applied for the measurements. Probes incorporate WE with flat and open surfaces made of the material of interest embedded in an insulating material, together with RE and CE (or a single RE/CE for two-electrode systems) and connected with an electrolyte layer. Unlike probes, sensors do not incorporate WE and consist of CE and RE placed above the surface under investigation that act as WE [37]. Sensors are not suitable for long-term monitoring, but they allow for in-situ measurements on real objects, whereas probes may not respond to the structure and corrosion behaviour of real surfaces.
Presence of an electrolyte is required to conductively connect the electrodes. In atmospheric corrosion studies, the connection may be realised in two ways. The first relies on the presence of a thin surface electrolyte layer on a probe surface with no additional electrolyte applied. The system is not greatly disturbed by the measurement, and corrosion proceeds under real atmospheric conditions. However, under relatively dry conditions the electrolyte layer is thin and discontinuous, and the measurement may be interrupted [37]. In the second approach, a filter paper soaked with an electrolyte (NaCl, Na2SO4) or gel electrolyte is placed between the electrochemical sensor and studied surface, and provides a good electrical connection [37,39]. However, it will affect the environment and may accelerate corrosion [37]. Xia et al. focused on the electrochemical probes and sensors used for EIS and EN measurements, describing in detail the underlying principles and discussing the suitability of different setups [37]. More recently, they discussed setups and applications of electrochemical monitoring methods, including EIS and EN for corrosion monitoring in the field [40].
The data are analysed by fitting to equivalent circuits as analogues that reproduce the target system’s electrical properties [41]. The circuits contain elements such as resistors, capacitors and inductors combined in both series and parallel. As chemical processes usually exhibit more complex behaviour (for example, in cases of inhomogeneous current distribution, diffusion, surface roughness or coating non-uniformness), some specific elements are introduced, including constant phase element (CPE), double-layer capacitance and Warburg impedance [36]. Basic understanding of a system is thus required for correct fitting and data analysis. In the first step, the measuring cell is simulated and the influence of each part with the known impedance behaviour is guessed. The model is then corrected to fit the data accurately.
An important element of fitting models used for the corrosion rate estimation is the charge transfer resistance Rct (or polarisation resistance Rp). It may be assumed, in approximation, that Rct−1 (Rp−1) is inversely proportional to the corrosion current density icorr according to Stern–Geary equation:
i c o r r = B R c t
where B is β a β c 2.3   β a β c , βa and βc being anodic and cathodic Tafel slopes. The charge transfer resistance or polarisation resistance reciprocal Rct−1 (Rp−1) are thus often used as the corrosion rate indexes [36]. According to Liao et al. and Pan et al., Rct is more correlated with corrosion rate than Rp as it is determined from faradaic processes of the change-transfer controlled corrosion only. Moreover, when impedance response displays more than one constant or diffusion, an erroneous corrosion rate is obtained by calculating Rp [42,43]. However, Ma et al. observed similar trends for Rct−1 and Rp−1 while studying zinc corrosion under 40–100% RH in the presence of NaCl particles, and validated the calculated values with the average corrosion rate obtained from the mass loss [44].
The impedance is typically measured in the frequency range of 1 mHz to 100 kHz, acquiring 3 to 10 points per decade [36]. Nishikata et al. proposed the impedance measurement in two frequency points instead of the whole frequency spectrum to make the measurement less time-consuming and requiring a simpler instrumentation [45,46]. They found that Rp can be calculated from subtracting impedance at high frequency from impedance at low frequency. In reference [47], the authors assessed corrosion of nickel-containing steels in marine atmospheres at 10 kHz and 10 mHz and calculated thickness loss from Rp according to the Stern–Geary equation assuming B = 0.020 V reported previously for aqueous solutions.
Compared to bulk electrolytes, the electrical resistance of thin electrolyte layers formed under atmospheric conditions is extremely high. High ohmic drop and non-uniform current (potential) distribution over a working electrode lead to serious errors of electrochemical measurements. To avoid these limitations, the transmission-line (TML) model was proposed by Nishikata et al. to describe the equivalent circuit of a metal/thin electrolyte film interface and the uneven current distribution over the electrode surface using frequency dependency on phase shift θ [46]. They found that the current distribution remains uniform in the low-frequency range as θ exceeds −45° on a θ-log f plot, and the constant phase element is α = 1. Thus, the charge transfer resistance can be accurately determined in the low-frequency range, and the corrosion current can be calculated according to the Stern–Geary equation [48]. Fulfilment of these conditions depends on electrolyte layer’s thickness and electrode geometry. For very small electrodes of 0.01 cm, uniform current distribution was observed, even under very thin electrolyte layers. For an electrode of 1 cm, the corrosion current can be accurately calculated for the ≥10 µm thick electrolyte. Under electrolyte layers of ≥100 µm thickness, even current distribution was observed, even at high frequencies [46,49]. Therefore, for the systems with θ not exceeding −45°, even under low frequencies, the authors recommended the use of electrodes with smaller dimensions, which allows one to measure impedance under very thin electrolyte layers. Under controlled laboratory conditions during wet/dry cycles or after depositing thin electrolyte layers, the described principle was applied to study the corrosion mechanisms of carbon [38,50], weathering [45,51,52,53], stainless steel [46,49,54,55], zinc-coated steel [56,57,58,59,60], zinc [61], tin [62], copper and bronze [42,43,46,49,63,64], aluminium [65] and aluminium alloys coupled with high strength steel [66,67,68]. Nishikata et al. monitored the corrosion of weathering steels with and without nickel on two bridges, and observed a non-proportional correlation between the impedance at low frequencies and average corrosion current density obtained by mass loss of coupons exposed in parallel [69]. The authors assumed that abnormally high capacitance of rust and uneven current distribution arising from extremely small amounts of electrolyte in rust were the reasons for Stern–Geary equation invalidity. The difference between the corrosion rates of the materials on two bridges was estimated from the mass losses as threefold, which was reflected by the impedance measurements. However, the difference between the corrosion rates of weathering steels with and without nickel, estimated as 1.1–1.3 fold, was not detectable by EIS. The authors suggested the reciprocal of impedance at low frequency to be recorded as an instantaneous corrosion rate indicator and to be validated using another technique.
As the fabrication of small electrodes might be problematic, and it is difficult to achieve even current distribution at high solution resistance, such as in an ultra-thin electrolyte layer or a dilute electrolyte layer. Shi et al. proposed a curve-fitting method to determine the TML equivalent circuit parameters and calculate Rct even under non-uniform current distributions [48]. The model was used by Ito et al. to study the influence of carbon steel sample orientation during the neutral salt spray test [70].
To assess the limitation of EIS caused by discontinuous electrolyte layer formation under low RH and to determine atmospheric conditions that yield reliable EIS data, Li et al. studied the responses of weathering steel electrodes under 5–100% RH in the presence of NaCl [71]. According to their results, the electrolyte layer was discontinuous up to 30% RH, and the EIS spectra reflected the character of the electrode; in the range of 40–60% RH, the spectra corresponded to the surface electrolyte conductivity while no corrosion process was taking place; and finally, at the RH above 70%, NaCl dissolved on the surface, causing the corrosion rate to increase, and the corrosion rate was evaluated as Rct−1 [71]. It should be noticed, however, that the corrosion rate might remain non-null, even under lower RH, due to the formation of soluble salts with a low deliquescence point [29] which is not detectable by EIS.
A portable EIS instrument based on a digital signal processor was developed to study the protective effectiveness of coatings on metallic historical artefacts by Angelini et al. [72]. In their later works, the authors proposed a low-cost Arduino-based instrument and an electrochemical cell for in situ measurements [39,73]. The instrumentation was utilised to assess the protective effectiveness of corrosion products on an iron bar chain exposed in a cathedral and on a weathering steel sculpture exposed outdoors [74]. However, the device has not been utilised for direct corrosion rate monitoring.

3.3. Electrochemical Noise

Electrochemical noise (EN) is a term generally used to describe the current or potential fluctuation that occurs on a corroding electrode. EN is produced by processes causing corrosion (or by other electrochemical reactions) due to random ion movements and cooperative phenomena (e.g., pit nucleation [12,75]), and thus indicates changes in thermodynamic and kinetic states of a metal/electrolyte interface [76]. Corrosion and corrosion-related processes known to induce EN include nucleation, pit and stress corrosion cracks’ growth and propagation, passive film formation and growth, hydrogen bubble nucleation, growth and detachment, abrasion, diffusion, high-temperature, microbial corrosion and uniform corrosion [75].
Although any measurement of corroding electrode potential implicitly includes EN detection, it was firstly seen as a source of information rather than a measurement error in 1968 by Iverson, who recorded electrochemical potential noise (EPN) [77]. The first electrochemical current noise (ECN) measurement was performed by Stewart and Williams in 1992 [78]. Eden et al. patented a three electrode arrangement for simultaneous electrochemical potential and current noise measurement [79].
In the potentiostatic EPN measurement mode, a potential difference is measured between two identical corroding electrodes or between a corroding electrode and a low-noise reference electrode. In the galvanostatic ECN mode, the current between two identical electrodes is recorded. These modes are not widely used for corrosion monitoring, as an electrode is polarised and EPN and ECN cannot be measured synchronously [28]. In the case of simultaneous potential and current noise measurement, the ECN is measured as a current between two working electrodes using a ZRA as shown in Figure 3, and the potential of the electrode couple is compared with the potential of a reference or third working electrode [12,28]. Generally, EPN is related to the corrosion mechanism, while ECN indicates its rate [28].
The electrochemical resistance noise Rn is defined as the potential noise’s standard deviation σV divided by the current noise’s standard deviation σI [76]:
R n = σ V σ I
Rn is proportional to corrosion rate and correlates with polarisation resistance Rp determined by linear polarisation resistance (LPR) [80].
As a reliable RE is required for the setup containing two WE and an RE, this method is more frequently used in laboratories. The similar three-electrode setup is more frequently applied in a field [12]. Asymmetric multielectrode systems with WE and CE having a different electrochemical state are also commonly used. The electrodes can be made of different materials or made of the same material but have different surface areas [28]. Theoretical principles, electrode designs and different setups of the EN technique were summarised and discussed by Ma et al. [28]. Xia et al. reviewed EN instrumentation and experimental setups [81], theoretical aspects of quantitative EN analysis and modelling [82] and probes for EN [37].
Potentially, the corrosion mechanism can be derived from EN data without establishing an electrochemical model in advance. However, data processing makes their correct interpretation problematic, and the correct method for the corrosion mechanism determination is not easy to foresee [12]. Different approaches were proposed, including electrochemical resistance in the time domain [83], fast Fourier transformation in the frequency domain [84,85], energy distribution from wavelet transform, fractal geometry [86], average charge in each event and frequency of events derived from the shot noise theory, correlation dimensions by the phase space methods [75] and artificial neural networks [87]. A detailed discussion of EN data interpretation can be found in [82].
EN is the only electrochemical technique that does not disturb the system during measurements [86,87,88]. It is easy to set up and is suitable for in situ measurements [89].
Similarly to EIS, the conductive connection between electrodes is crucial for EN [89]. It can be provided by using filter paper or a cloth soaked in a salt solution, but corrosion acceleration caused by the solution cannot be excluded [89]. Another approach is to consider the corrosion rate to be negligible when the sensor is dry [76]. Ma et al. applied EPN and ECN in parallel with T and RH recording to investigate urban atmosphere aggressiveness against heat-resistant T91 and low-carbon Q235B steels [89]. The authors observed very low fluctuations of ECN and EPN, around 0 nA and 0 mV, respectively, and concluded that the corrosion rate of steel was low during dry periods when RH was lower than 65%. However, further corrosion during the drying phase and an effect of a discontinuous electrolyte layer on the measurement cannot be excluded. This fact also limits the EN applications indoors.
Xia et al. used a similar three-electrode setup to monitor field-exposed steels in an offshore atmosphere [90]. A good correlation between Rn and mass loss was obtained. However, the authors emphasised the fact that rust-layer formation may affect the corrosion detection during long-time exposures in aggressive coastal atmospheres. In their later work, the authors pointed out the importance of future studies being focused on field EN measurements at low RH below 40%, which were expected to be challenging due to extremely high instrument resolution required [91].

3.4. Electrical Resistance Probes

Sensors based on electrical resistance measurement have been used since the 1950s to monitor corrosion in atmospheres, solutions, soils and concrete [12]. The technique is standardised [92]. A metallic sensor made of a wire, tube, loop, thin sheet or strip shape is exposed, and its electrical resistance is recorded. Thin film probes are preferably utilised in atmospheric conditions because of their high sensitivity [12].
The principle is in the electrical resistance evolution of conductor R as a function of its resistivity ρ and geometrical parameters (length l, width w and thickness t) according to the equation [93]:
R = ρ l w × t
The sensing element’s resistance is measured by detecting a potential (voltage) drop while a small current is applied according to the Ohm’s law. The current is required to be very low so as not to affect sensor temperature [94]. The four-point probe method is used to increase the measurement accuracy [95]. It can be applied as a Wheatstone bridge comparing the unknown resistance of a sample with the resistance of three standards, or the probe voltage under a constant current can be recorded [96]. Conversely, Li et al. applied a potential difference of 20 mV across a steel sensor while continuously recording the current output [3].
For the given resistivity and sensor geometry with w ˃˃ t, resistance is inversely proportional to the sensor thickness. While the thin metal track (sensitive part of the sensor) corrodes, its resistance increases proportionally to the thickness loss. Resistance depends linearly on temperature according to Equation (7), where RT is resistance of the metal track at a given temperature, R0 is the initial resistance of the metal track, ΔT is the difference between the initial and given temperature and α is the temperature coefficient of the material [97].
R T = ( 1 + α Δ T ) R o
Since α is difficult to determine precisely for thin foils and changes due to corrosion, a reference part of a sensor is used for compensation of the temperature effect instead. The reference part is protected against corrosion, and its resistance thus depends on temperature fluctuations only. The corrosion depth CD of the sensing part is then calculated according to [93]:
C D = t i n i t ( R r e f , i n i t R s e n s , i n i t R r e f R s e n s )
where tinit is the initial thickness of a metal track; Rref,init and Rsens,init are the initial reference and sensing part resistance values; and Rref and Rsens are actual values of the reference and sensing part resistance.
The slope of CD dependency on time is the corrosion rate of the sensor sensitive part. The absolute CD and corrosion rate can be determined at any given time point [3].
ER sensors are relatively simple to install and operate, and require low maintenance. The data are easy to interpret without special knowledge and provide real-time information [12]. ER probes are recommended for detection of corrosion onset [98]. The lifetime and sensitivity of ER sensors depend on their geometry. The greater the thickness of a sensor, the longer its lifetime and response time, and the lower its sensitivity [3,6]. It is thus possible to select an optimal sensor geometry to meet lifetime and sensitivity requirements. However, some preliminary information about the environment corrosivity is needed to select a sensor properly. Sensors with thicknesses from tens to hundreds of nanometres are used indoors with corrosivity starting at IC1 according to ISO 11844. Outdoors, the sensor thickness varies from micrometres to hundreds of micrometres [98]. Naturally, the sensitivity also depends on the resolution of the instrument used to perform the resistance measurement [99].
Contrary to electrochemical methods, the ER technique does not require an electrolyte film to be present on the investigated surface, and is thus suitable for measurements at low RH [95,98].
As the recorded resistance is governed by a location of the sensing part with the smallest residual cross-sectional area, the technique is highly sensitive to the presence of localised corrosion. This is avoided for metals prone only to uniform corrosion in any given environment, and ER probes were thus traditionally used for uniform corrosion detection. The appearance of non-uniform corrosion that can be recognised by a sudden sharp thickness loss was claimed to lead to underestimation or overestimation of the real corrosion rate [12,29,100]. However, in last few years, the ability of ER probes to detect maximum CD attracted more attention. Prosek et al. used ER sensors and coupons to study the behaviour of zinc and carbon steels in different phases of an automotive ACT VDA 233-102. For both materials, the sensors showed higher corrosion rates, as they detected maximum corrosion depth, in contrast to coupons, which assessed mean corrosion depth. The authors emphasised that the maximum corrosion depth is important from a practical point of view and is often used as the main parameter defining corrosion degradation of automotive materials [101]. Diler et al. applied the ER method for the assessment of aluminium corrosion during a chloride ACT [29]. Localised corrosion, i.e., pitting, intergranular corrosion and exfoliation, typically occurs on aluminium alloys in the presence of chlorides. Although the CD calculated from the ER probes was not in agreement with the mean CD obtained by post mortem cross-sectioning, the good reproducibility of the former parameter was in contrast with the large deviation of the latter one. The authors proposed that the ER sensors could level the localised corrosion effect through a large surface evaluation compared to cross-sections, and verified this hypothesis using finite element modelling [29]. Li et al. presented a steel thin film ER (TFER) sensor of two specific patterns, one with a single wide metal track and another with ten narrow tracks, as shown in Figure 4. The single-line sensor underestimated the corrosion rate after the appearance of pits. The response of the multi-line sensor enabled them to differentiate uniform corrosion and pitting [3].
The formation of conductive corrosion products (e.g., Fe2S, PbS, Fe3O4, MnO2) or conductive deposits can also lead to incorrect results [6]. Errors typically occur after half of the sensor’s thickness (one quarter of the diameter for wire-shaped sensors) is corroded, which limits the probe’s lifetime [12,92]. In environments with significant temperature fluctuations, thermal noise affects the measurement. The reason is the more rapid response of the measuring sensor element to temperature fluctuations compared to the response of the reference element. Different probes are differently sensitive to the thermal noise [92]. Thicker probes, especially tubular-shaped, counteract the effect of temperature better and provide better temperature compensation at the expense of sensitivity [12]. The material used to cover the reference element can also affect the response. However, the temperature noise effect can be partly eliminated with an appropriate signal processing algorithm.
A portable device commercialised first as ECAT and later on as AirCorr was developed by a team of European researches in 2009–2012 within the MUSECORR project [102]. Compared to the previously used sensors, the design was improved by connecting the measuring and reference elements with an H-shaped bridge, as drawn in Figure 5 [103]. This design solved the problem of the metal track corrosion between reference and measuring elements underneath the protective coating [4,98]. The measuring device is battery driven.
Several studies were published within the project, showing the variety of ER probes’ application possibilities. High sensitivities (on the level of 0.1 nm or 1 Å for thin sensors designed for indoor applications; at least 1/1000 of the initial metal track thickness in general), good reproducibility (±20%) and quick response times were reported for the developed Cu, Zn and Ag sensors [2,4,98,102]. Lower reproducibility was shown for Fe and Pb sensors due to localised corrosion [98]. Thin Ag, Cu and Pb sensors were exposed in the indoor environments of two archive buildings [4,102]. In a new archive building, an antifreeze agent containing urea was added to concrete in the upper floors, releasing ammonia to the surrounding environment. Cu and Ag sensors were exposed in lower ammonia-free floors and then moved to the upper floors, where a corrosion rate drop was detected, surprisingly, probably due to the inhibitive effect of urea. Ag and Pb sensors were placed in a historical archive building to assess the air corrosivity changes in time. Pb sensors were used especially due to their sensitivity to organic acids [102]. The technique was applied in culture heritage institutions for assessing environmental conditions in terms of corrosivity classes for copper and silver according to ISO 11844-1 [4,104,105]. Pb sensors were also used to measure environmental aggressiveness and to propose air corrosivity classification for lead [4,105]. The impacts of formic and acetic acids on copper, iron and bronze corrosion were studied to determine the critical concentrations of these pollutants which lead to rapid corrosion rate increases. The critical values were 200 ppb for copper and bronze and 1000 to 1590 ppb for iron at 80% RH [103,106]. Other examples of practical ER applications in cultural heritage institutions and industry were described in [4,94,105].
These ER probes were also used by Vaissiere for the mapping of the corrosion aggressiveness of the panels of new model of car [107] and a corrosion mechanism study of iron and zinc under real atmospheric conditions and ISO 16539 ACT by Omoda et al. [108]. Msallamova et al. used Pb sensors to examine the possible aggressiveness of disinfectants used during historical document restauration against lead seals connected to the documents [109]. The corrosion aggressiveness of volatile organic compounds against lead historical artefacts and the effectiveness of adsorbents and inhibitors for lead protection during storage were studied by the group of Kouřil [110,111,112]. Van den Steen et al. compared the corrosion depth of iron under cyclic VDA 233-102, GMW 14872, Volvo ACT I and Volvo ACTII ACTs measured with an AirCorr logger and simulated data obtained from the Dynamic Electrolyte Film Corrosion (DEFC) model developed by the group [113,114]. Kreislova et al. used Pb, Cu and Ag sensors to assess air corrosivity in a baroque library in Klementinum, Prague, where the a corrosion rate of lead caused by organic acids pollution was detected [115]. Bailey et al. measured the lead corrosion rate in a showcase where thick crystalline corrosion products were observed on lead components of a ship model [116].
Sensors with surface pre-treatments and protective organic and metallic coatings were also tested. Diler et al. exposed zinc galvanised steel sensors, organic coated steel sensors with and without surface defects and bare zinc and iron sensors in the Volvo STD423-0014 ACT to study the corrosion kinetics [93]. Švadlena et al. used Cu sensors galvanically covered with silver to evaluate silver corrosion caused by halides, pseudohalides and thiourea both in saturated solutions and under atmospheric conditions. The sensors were pre-corroded before exposure in the atmosphere in order to model corrosion under deposits [117].
Li et al. presented an automated IoT (Internet of Things) corrosion monitoring device consisting of a sensor connected to a key controlling hardware device which integrates core control, data acquisition, data transmission and a power supply [97]. The data can be stored in a memory card or sent directly to a server via 4G network. A Q235 steel sensor was exposed at a field test site while T, RH and air pollution data (SO2, NO2, solid particles) were recorded. An advanced data processing algorithm was developed to filter the high frequency noise and quasi-periodic signal caused by temperature fluctuations during the day. Finally, the correlations between corrosion and environmental data were studied by applying visualisation and maximal information coefficient (MIC) methods, revealing the leading roles of T and RH in steel corrosion.
Kosec et al. developed a setup for automotive applications with a high strength steel sensor installed in the inner compartment of a vehicle [118]. Very low corrosion rates were measured during summer months. A slight decrease was observed in autumn, and the maximum was reached in winter as a consequence of de-icing salts. Zajec et al. used a similar sensor along with EIS to evaluate low-carbon steel corrosion under coatings in a salt spray ACT and chambers with controlled humidity and SO2 supply [100,119]. They reported a high sensitivity of EIS for coating deterioration detection, whereas ER probes could not detect early stages of coating degradation, but only initiation and propagation of underlying metal corrosion. On the other hand, the authors considered the ER probes to be more reliable for assessing substrate corrosion under the coating, as the thickness loss had a simple relation with the resistance, and no additional modelling was necessary. Therefore, they recommended ER probes for field applications rather than the EIS sensors. Wan et al. used ER and EIS sensors and coupons to monitor Cu corrosion during field exposure and under wet/dry and high/low temperature ACTs [120]. During the field exposure, the corrosion rate measured with ER probes was nearly consistent with that of the coupons. During the ACTs, corrosion rates detected by ER and EIS showed similar trends, but the values measured by the former were much higher compared to those measured with the latter. The authors reported that the EIS sensor failed while measuring under low RH when conductive electrolyte between the electrodes became discontinuous. They concluded the ER method to be more suitable for atmospheric corrosion monitoring, in both field and ACT conditions [120].
Faifer et al. developed Cu sensors produced with printed circuit board (PCB) technology and determined measurement parameters to minimize noise and temperature-caused fluctuations [99]. The total sensor count may be increased up to 40 in the proposed setup. Based on the preliminary tests on pre-corroded Cu sensors, the authors found the setup promising for cultural heritage monitoring.
Few commercial corrosion monitors based on the resistometric principle are available on the market. As described above, the AirCorr system by NKE was developed within the MUSECORR project and is now available in three versions [121]. AirCorr I allows for indoor corrosivity measurements using a thin highly sensitive changeable sensor. AirCorr I Plus measures temperature, RH and corrosivity on two sensors in parallel. AirCorr O measures corrosivity outdoors with a plastic-covered unchangeable thick sensor. The device is portable and uses a battery. Data reading is non-contact but requires an operator’s presence. A wide range of sensor materials is offered, including copper, silver, iron, zinc, lead, aluminium, tin, brass and bronze. Sensors of different thicknesses are available, and the right compromise between service life and sensitivity can be found.
The Environmental Condition Monitoring System (ECM) by Rohrback Cosasco Systems is a device for measuring temperature, RH and differential pressure, and for corrosivity detection [122]. Corrosivity measurement is performed simultaneously with 250 nm Cu and Ag sensors for indoor corrosivity classification and corrosion rate determination, with a declared sensitivity of 1 nm thickness loss [123]. Carbon steel sensors of 100 and 200 µm thickness are also available [124]. Copper and silver sensors were used to assess indoor corrosivity in museums and homes [94,104,125]. Chico et al. used carbon steel sensors to assess indoor and outdoor air corrosivity at a nuclear power plant [126]. ‘t Hart used both the ECM with a Ag 250 nm sensor and an OnGuard Purafil QCM sensor (see chapter 3.5) to determine the corrosion rates of silver in four cultural heritage institutions in Belgium [127]. A steady corrosion build-up was measured with the ER sensors in contrast with the incidental trend of the QCM measurement. The authors also noticed that the ER technique was more sensitive, whereas corrosion depth ˂ 8 Å (0.8 nm) was not detectable by the QCM.
The Surveyor Plus device by Circul–Aire provides measurements of temperature, RH and indoor atmospheric corrosivity against copper and silver [128]. Identical parameters can be monitored by Viledon ChemWatch from Freudenberg Filtration Technologies [129]. Along with corrosion rate determination, Cu and Ag sensors are declared to indicate the presence of corrosive gases in concentrations from low ppb. The data can be transferred to a personal computer (PC), control station or smartphone with LAN, Wi-Fi or Bluetooth. A combination of air filtration and ChemWatch monitoring systems was recommended to be used to control filtration efficiency in switching and control rooms [130].

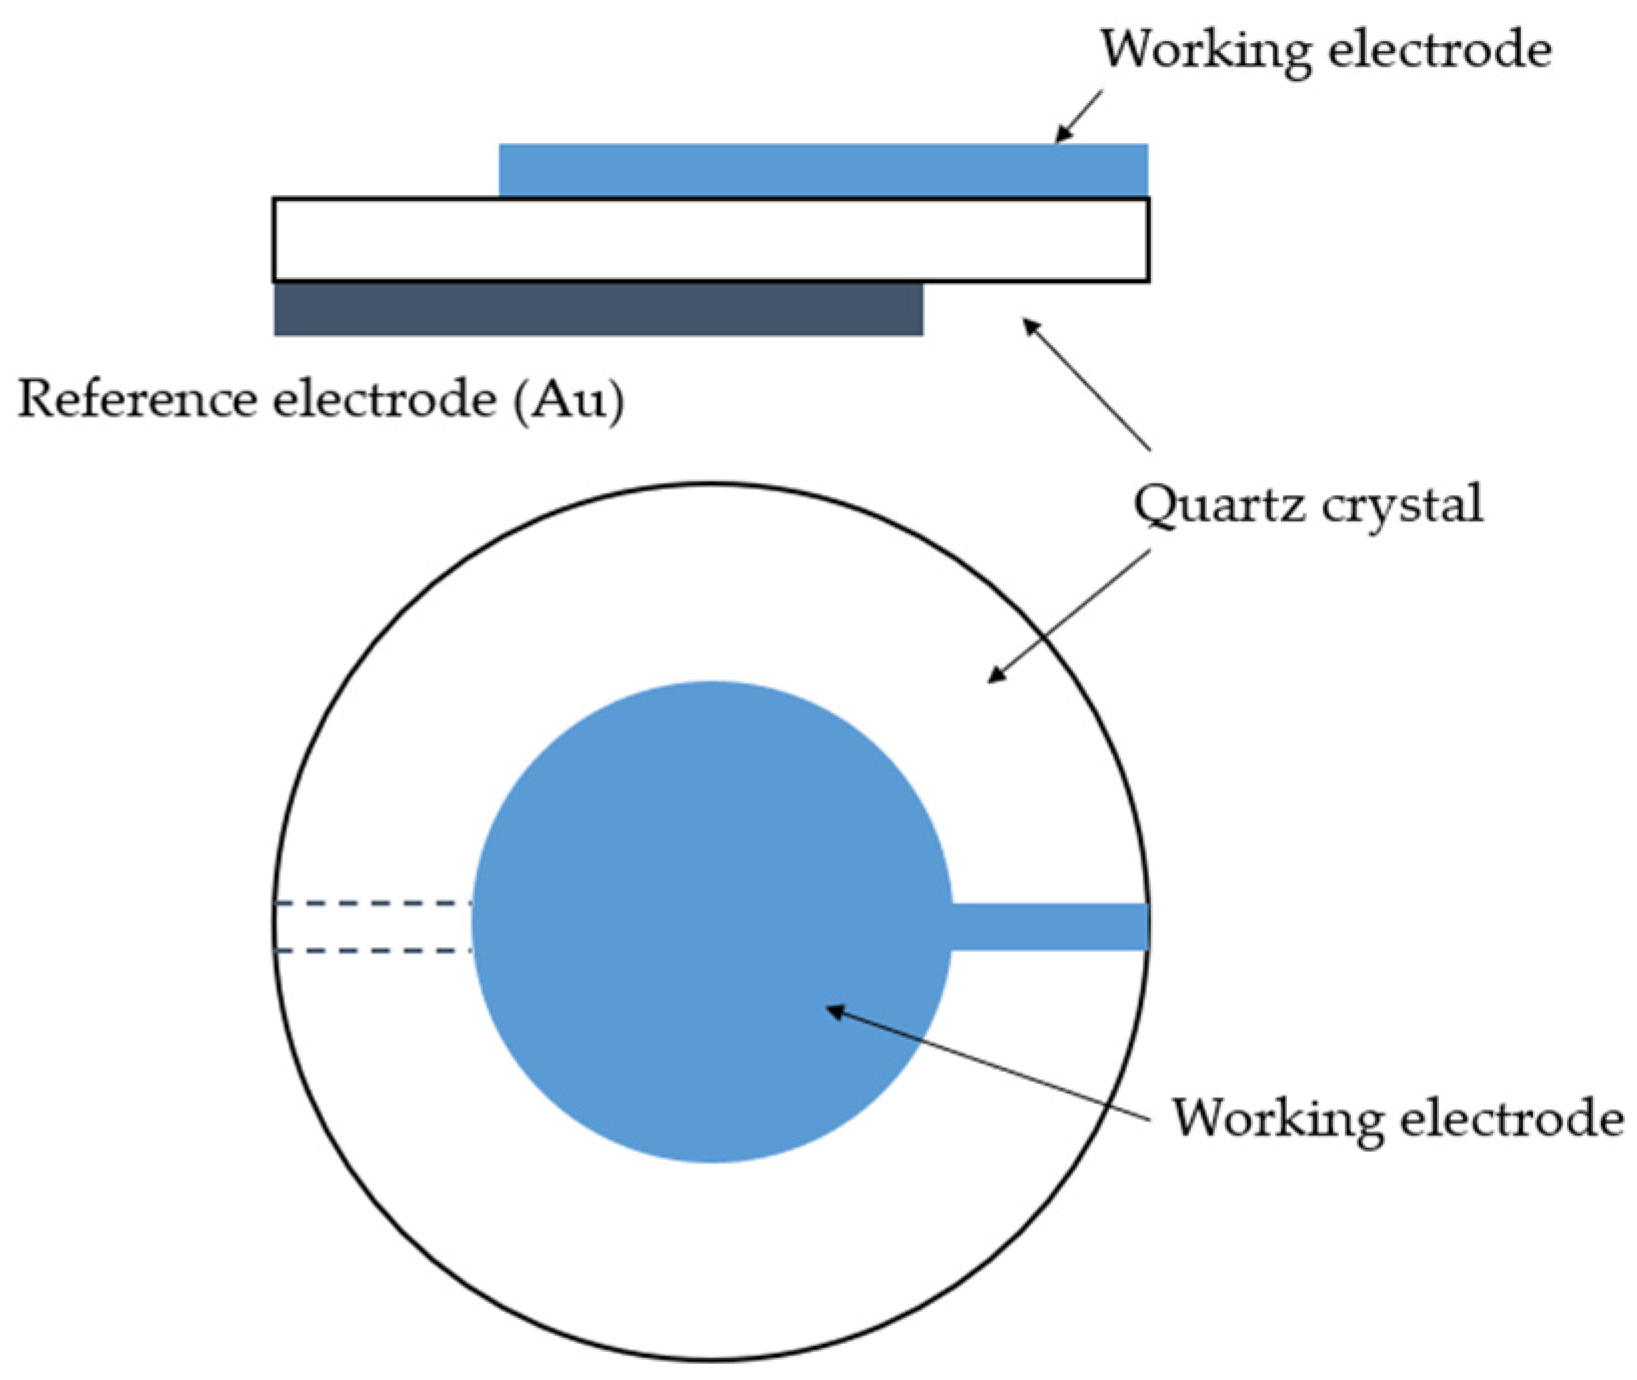
3.5. Quartz Crystal Microbalance

The quartz crystal microbalance (QCM) is a mass sensor first suggested for this purpose by Sauerbrey in 1958 [131]. It has been developed for corrosion monitoring in 1990s’ [132,133,134]. The technique is standardised [135].
QCM consists of a thin plate of a single-crystal quartz with two electrodes affixed on each side of the plate (Figure 6). The crystal is made of SiO2 [12]. It has piezoelectric properties; i.e., it can generate electric potential as a response to applied pressure [12]. The material of interest is applied onto the crystal, which oscillates at its resonance frequency [8]. Any mass change in the oscillating device leads to a change in the oscillation frequency, which can be measured very precisely. For small mass changes, the frequency change is linearly dependent on the mass, and is converted into a mass change according to the Sauerbrey equation [131]:
Δ f 0 = 2 f 0 2 μ q ρ q Δ m
where Δf0 is a frequency shift, f0 is a frequency of the mode, µq is a shear modulus, ρq is density and Δm is a mass change per area. The equation is valid for small mass changes, when the difference in acoustic impedance between the quartz and deposit can be disregarded [131]. AT-cut resonators with the lowest temperature coefficients of the frequency are used [136]. QCM principles, history and examples of applications both in atmospheres and solutions were described in detail by Petrunin et al. [136].
The QCM’s sensitivity is extremely high, with mass change detection working in the nanogram range with a millisecond resolution [137]. In situ corrosion, surface oxidation, adsorption/desorption, metal plating, etching, moisture accumulation and other processes can be studied with the QCM [12,131]. The QCM detects the metal mass increase caused by the formation of corrosion products on its surface as a consequence of the exposure in a corrosive environment.
However, the mass changes can be caused not only by the formation of corrosion products, but also by other processes, including deposition of dust and sorption of water, with these effects being difficult to distinguish [8]. Additional surface sensitive analyses have to be applied along with the QCM to obtain information about surface chemistry and topographical changes [131,136]. Another approach is a simplification, when the other factors affecting sensor weight, except corrosion, are supposed to be constant during an experiment [138]. Still, the real corrosion rate can be underestimated or overestimated due to the changing dust and water deposition. Along with the mass change, stress, temperature and pressure can also affect the crystal oscillation frequency. All these parameters should be controlled during the measurement, and the calibration of a coated crystal and the instrumentation is required [131,135]. For example, Hoseinpoor et al. reported that temperature fluctuations of ±0.25 °C affect the QCM data while measuring extremely low mass changes in the nanogram range [139]. The authors expected the sensitivity toward temperature fluctuations to decrease with increasing mass changes.
QCM sensors are not compatible with highly corrosive environments [29]. The structure of a thin metallic film usually deposited by physical vapour deposition is different from the structure of industrial materials. Ehahoun thus suggested gluing a foil made of a studied material directly to the crystal [140]. The sensitivity of this sensor is obviously low compared to sensors with deposited thin films.
Fujii et al. monitored T, RH and the corrosion rates of copper, silver and cobalt in an electrical control unit room of a steelmaking plant. Based on QCM data, concentrations of SO2, NO2 and H2S in the atmosphere were calculated. There were good correlations between the calculated and measured values for NO2 and H2S. The estimated values of SO2 concentration did not correspond with the measured ones because of an inaccurate calculation [138]. Due to its high sensitivity, a QCM combined with analytical techniques was used for short-term monitoring of initial stages of copper and silver corrosion under controlled laboratory conditions [141,142,143,144,145,146,147]
In addition to the frequency change monitoring, a QCM with dissipation monitoring (QCM-D) includes the detection of energy dissipation (damping of oscillation) by simultaneously measuring a dissipation factor D. QCM-D is used for systems that show significant deviations from the Sauerbrey equation. These deviations can be caused by the following mechanisms: (1) a soft and sufficiently thick absorbed layer (viscoelastic layers composed of highly hydrated polymers or biomolecular structures) may deform during the sensor shear oscillations, which causes internal friction of the layer; (2) surface topography changes from very smooth to very rough or vice versa; (3) loosely attached particles present on the surface can slip and give rise to friction losses [148,149]. QCM-D thus provides information about both mass and mechanical properties of the surface layer. For corrosion studies, this approach has been so far used only during laboratory investigations of initial copper oxidation [139,150].
Odlyha et al. used a Pb-coated QCM to monitor the corrosion of lead within organ pipes in two churches [151]. The sensors were later applied for microclimate monitoring within test and historical frames [152]. Agbota et al. designed a wireless device consisting of up to eight QCM sensors along with T and RH sensors for environmental monitoring in cultural heritage institutions [153].
OnGuard Smart is a commercially available device based on the QCM principle produced by Purafil for real-time monitoring of air corrosivity towards copper and silver, along with T and RH recording [154]. Cumulative corrosion (the total amount of corrosion products accumulated on a metallic surface) and incremental corrosion (amount of corrosion products accumulated on a metallic surface over a specific time period) are recorded in angstroms, per twenty-four hours. The lifetime of a sensor is 4000 Å (400 nm) of cumulative corrosion. The declared accuracy is ±1% of the full span. Data can be sent to a PC via Ethernet cable or Wi-Fi. OnGuard Lite operates with a silver sensor and provides simple pass/fail indication of air corrosivity with a green/red warning LED [155]. Both devices are designed primarily for corrosion monitoring of industrial electronics, computers, control equipment and artwork.
The Bry-Air Atmospheric Corrosivity Monitor is targeted primarily for applications in IT infrastructure, such as data centres, server rooms and control rooms [156]. Silver and copper sensors are used for corrosivity assessments, and temperature, RH and differential pressure are recorded. The declared accuracy is 1% and the sensor lifetime is up to 4000 Å (400 nm). The device can be connected to a PC via USB port.

3.6. Radio-Frequency Identification Sensors

Radio-frequency identification sensors (RFID) are primarily used for inventory management and product tracking, and their use for corrosion monitoring is a relatively novel approach that has been developed during the last decade.
Basic elements of an RFID system are a reader and a tag. The tag is a transponder with integrated circuits and antenna that can be activated by electromagnetic energy from the reader, and it transmits stored information back. Tags can be active or passive, depending on power supply. Active tags are able to send information themselves and have their own power sources (battery, solar cell, etc.), which makes them larger and more expensive. Passive tags send information as a response to an interrogation of the reader, as their only power source is the electromagnetic field transmitted from the reader. These tags are simpler, cheaper, more reliable and more frequently used [157]. Near-field or far-field coupling techniques can be employed for the reader-tag communication. Low frequency (LF, 120–140 Hz) and high frequency (HF, 13.56 MHz) tags use the near-field coupling technique with the relatively short reading distance of up to 1 m, whereas ultrahigh frequency tags (UHF, 868–928 MHz) use the far-field coupling technique and have the reading distance of few meters or even tens of meters [157,158]. For corrosion measurements, the analogue processing of physical signals related to the reader-tag communication is employed [159]. Applications of RFID antenna sensors for structural health monitoring, including corrosion monitoring and corrosion stress cracking detection, were summarised by Zhang et al. [159].
Dante et al. proposed an RFID sensor based on a shielding effect of a thin conductive (copper or aluminium) layer coated over the antenna, causing a drop in the response signal amplitude or completely blocking the signal [160,161]. As the coating corroded, the signal amplitude increased, enabling the tag to work properly. The arrangement was later improved by He et al. by using carbon steel foils and steel filled composite paints instead of copper and aluminium for the electromagnetic interference shielding [157]. First, the factors affecting the tag response (tag orientation, reading power and distance, metal backing presence) were determined for measurement optimisation [157]. The effect of foil thickness on the signal shielding was studied, showing complete shielding by all tested foils, including the thinnest one of 25 µm. In the presence of chlorides, conversion of conductive metallic iron to poorly conducting corrosion products caused the shielding effect to decrease. A composite iron powder/acrylic resin paint was used as a shielding material and tested in an ACT and atmospheric exposure [162]. However, the data processing algorithm had to be improved for the corrosion rate determination. In addition, the corrosion behaviour of metallic powder is expected to be different from that of a bulk material. The availability of a powder of desired composition might be problematic, and the shielding ability of uncorroded paint is significantly lower than that of an uncorroded iron sheet. More recently, measurements were performed in an ACT using sensors covered with low-carbon steel sheets with artificial defects to simulate pitting corrosion [163]. Pitting corrosion influenced the reading on a short reading distance only. The sensing lifespans of the sensors depended on an initial sheet thickness, as the signal became constant after several cycles of the ACT. Series of sensors were thus proposed to monitor the corrosion rate during the whole ACT. Based on a linear correlation between the signal strength and mass loss of coupons exposed in parallel, a method for corrosion rate evaluation was proposed. However, the described setups are limited by their sensitivity to measurement parameters, such as the distance between the reader and tag, position of the reader and surrounding environment.
To avoid this limitation, Yasri et al. developed chipless UHF corrosion sensors (Figure 7) detecting a frequency shift instead of an amplitude shift [164,165,166]. Each sensor consists of a sensitive resonator (microstrip lines made of the material under investigation) and two isolated cross-polarised monopole antennas (Rx for received and Tx for transmitted signal), and works on retrodiffusion of the interrogation signal. The RF signal is sent from the reader to the tag; then propagates in a RF-sensitive element; and finally returns to the reader. Corrosion of the sensitive elements causes a resonator frequency shift. By interrogating the sensor with a multifrequency signal, a variation in the multi-resonator’s magnitude can be detected.
Zinc RFID corrosion sensors were tested by the group at 97% RH with and without prior chloride contamination [95]. The High Frequency Structural Simulation (HFSS) was employed to simulate the frequency response on uniform and localised corrosion, and the ER measurements were performed on the sensing part of the sensor simultaneously to reflection and transmission parameter detection in the UHF region. The experimental data were in a good agreement with the simulated ones for both uniform and localised zinc corrosion. Uniform zinc corrosion and aluminium pitting were evaluated in the presence of chlorides at 97% RH with the developed resonators and by HFSS simulations [167].
Alamin et al. [158,168] and Sunny et al. [169] assessed the corrosion of coated steel using LF RFID. Their setup used the principle of the tag resonant frequency shifting caused by metallic structures placed near a tag. An eddy current is produced on the metallic surface, creating a secondary magnetic field opposite to the primary magnetic field produced by the reader. As electromagnetic properties (conductivity and permeability) of the material vary in different corrosion stages, as different corrosion products form on the surface, the corrosion stage can be determined by measuring these properties. Zhang et al. used HF RFID sensors operating on a similar principle along with a vector network analyser (VNA) in their study of steel corrosion [170,171]. An RFID tag acted as an exciting coil carrying high-frequency current and generating an electromagnetic field which was influenced by the surrounding material and analysed with the VNA. A 3-D UHF RFID antenna was designed to detect initial stages of steel corrosion [172,173].
The aforementioned studies were performed on pre-corroded samples for corrosion stage differentiation, and the technique has not been further adapted for real-time corrosion monitoring and corrosion rate calculation yet. Passive wireless RFID sensors independent of power supply are inexpensive and easy to install [159], but further development of the technique for atmospheric corrosion monitoring is needed.

3.7. Fibre Optical Corrosion Sensors

Optical fibres have been developed and widely used for many applications in the oil and gas industry; civil engineering structures; health monitoring; and cracks, strain, temperature and pH monitoring during the last few decades. Basically, the technique applies optical fibres made of glass or plastic that carry light through their length and are thus sensitive to any parameter which can modify the intensity, frequency, polarisation or phase of the light [174].
In corrosion monitoring, the research was focused on the utilisation of fibre optical corrosion sensors (FOCSs) to monitoring steel corrosion in concrete and in the oil and gas industry. These FOCSs are briefly described below. Their use in atmospheric corrosion monitoring is expected to be feasible, but detailed information about sensitivity and specifications for monitoring in air is missing. Fibre optical sensors are also widely used to measure environmental parameters affecting corrosion processes, such as pH, temperature and specific chemical compounds. Since these measurements do not provide direct information about corrosion kinetics, they will not be discussed in this review.
Principles and types of the fibre optical sensors in general were reviewed by Sabri et al. [175], and types of FOCSs were discussed by Luo et al. [176]. Three of them may be highlighted, as they are most frequently used for corrosion monitoring: optical fibre sensors based on waveguide theory, fibre Bragg grating sensors and long-period fibre grating sensors.
Optical fibre sensors based on waveguide theory use an optical fibre (polymer-clad silica fibre) with an uncladded section used as a sensing region. The sensing region is modified through deposition of a thin metal layer. While as-received polymer-cladded optical fibres totally reflect the incident light (the light reflectance of the fibre is maximum), metal-coated FOCSs absorb incident light due to an optical phenomenon called surface plasmon resonance. Exposure under corrosive conditions leads to a metal layer thickness decrease. Once the thickness is lower than the wavelength of the incident light, the sensing region of the FOCS begins to reflect light and regains total internal reflection. Depending on dielectric properties of the cladding material, the reflectance change can be gradually measured and related to the corrosion rate [177]. Another possible modification of cladded FOCSs is the deposition of a thin metal film on one end of a fibre. The film reflects the light sent through the fibre from the opposite end. As corrosion occurs, the film’s thickness decreases, causing a drop in the reflected signal [178,179]. Dong et al. tested the direct physical vapour deposition of a thin Fe–C layer on an uncladded fibre and electroplating on intermediate Fe, Au, Ni or Ag layers, reporting that the best quality of Fe–C sensors was produced by electroplating on iron [180,181]. Qiao et al. used electroplating and RF magnetron sputtering for thin Fe–C layer deposition on nickel-phosphorus or copper reflective films [182]. Wang and Huang proposed a FOCS using laser as a light source with a steel film attached to the sensor. They proposed the application of several sensors with different metal film thicknesses to monitor corrosion development over time [183]. Corrosion of a Fe–C thin layer electroplated on an Au intermediate layer on a U-shaped fibre was monitored in NH4Cl solutions of different concentrations by Khorsandi et al., with a second-harmonic laser being used as a light source [184].
Fibre Bragg grating (FBG) sensors reflect a particular wavelength of incoming light that meets the Bragg condition and transmit all others. The Bragg wavelength is defined by a fibre refractive index and a grating pitch, and its shift can be caused by temperature fluctuations or external tension. The formation of voluminous corrosion products on the metallic surface cause an increase on strain. Since the temperature fluctuation’s effect can be eliminated by using a reference fibre or by theoretical calculations based on the knowledge of the fibre’s core material properties, the FBG strain can be evaluated from the wavelength shift and related to corrosion [185]. Geng et al. monitored steel corrosion in concrete by employing a sensitive FBG sensor made of two carbon steel bars and a reference sensor of the same design made of stainless steel [186]. Hu et al. studied the corrosion of a Fe-C coating applied directly on a FBG sensor during immersion into an NaCl solution [187]. Tan et al. employed polydimethyl siloxane (PDMS) coated and uncoated FBG sensors to monitor steel rebar corrosion, and reported higher sensitivity by the PDMS-coated sensor [188,189]. The corrosion rates of steel under polymeric and wire arc-sprayed Al-Zn coatings were measured by Deng et al. using FBG sensors embedded under the coatings [185].
Long-period fibre gratings (LPFG) are typically inscribed in the core of an optical fibre and create a periodic refractive index modulation along the fibre. Since the grating period (≈100–1000 µm) is much larger than visible light’s wavelength, LPFG-coupled light is guided by the core mode to forward-propagating cladding modes at a discrete wavelength and produces a series of attenuation bands in a transmission spectrum due to absorption and scattering. Changes in surrounding media cause a resonant LPFG wavelength shift [190,191]. Huang et al. proposed an LPFG optical sensor covered with iron and silica nanoparticles for iron corrosion monitoring [192]. A good correlation between the wavelength shift and iron nanoparticles corrosion, observed by SEM, was shown. Corrosion rates detected by the sensors were compared to the results of potentiodynamic electrochemical measurements performed on steel bars, showing higher repeatability and reliability of the sensors compared to the potentiodynamic tests [193]. The concept of an LPFG corrosion sensor covered with inner Ag layer and outer Fe-C layer was proposed by Chen et al. [190]. A linear correlation between LPFG and EIS measurements performed in parallel on sensors immersed in NaCl solution was obtained. However, the authors reported a galvanic coupling effect between Ag and steel that accelerated iron corrosion [191].
Recently, Ahmed et al. proposed a micro ring resonator with periodic iron nanodisks in the ring waveguide that detects the refraction index variation as a consequence of the nanodisks’ oxidation [194].
The FOCSs are small, light, flexible, highly sensitive and immune to electromagnetic interference [183]. However, in the field of atmospheric corrosion, more studies are required to show the FOCS’s feasibility for corrosion monitoring.

3.8. Respirometry

Respirometric method consists in parallel monitoring of the main cathodic reactions taking place during atmospheric corrosion, namely, O2 reduction reaction (ORR) and H2 evolution reaction (HER), as they are directly related to the rate of anodic metal oxidation. While oxygen is consumed by ORR, hydrogen is generated in HER. If one of the cathodic reactions can be neglected, i.e., it proceeds at a much lower rate than the other one, simpler volumetric or manometric approaches can be applied. The amount of single gas being consumed or produced can be assessed based on the volume change of gas under constant pressure conditions (volumetric approach) or pressure monitoring in a closed chamber with fixed volume (manometric approach) [195]. If both cathodic reactions are of importance, oxygen or hydrogen concentration have to be followed in addition to pressure or volume changes.
Stratmann and Streckel measured a pressure decrease due to oxygen consumption to assess corrosion properties of pure iron and Fe–Cu alloys under wet/dry conditions [196]. Strebl et al. monitored the H2 evolution rate during atmospheric corrosion of AZ31 and AZ91 magnesium alloys under elevated RH, after pre-contamination with various amounts of NaCl [197,198]. Certain discrepancies between collected H2 and mass loss were observed as a result of the ORR contribution, a competing cathodic reaction. Matthiesen proposed using optical O2 sensors for the monitoring of historical artefacts’ corrosion. As the sensors allow for oxygen concentration measurements through the transparent wall of a closed container, three experimental setups were designed: the first with samples being placed in glass containers; the second using an oxygen barrier film with flexible dimensions for irregularly shaped artefacts; and the third using glass dishes glued to a large artefact’s surface [199]. The approach was successfully applied to assess the effectiveness of historical iron and copper objects conservation [200,201,202,203,204,205,206,207]. However, all these measurements were restricted to the samples that corrode mainly by ORR or mainly by HER, whereas real systems often combine the two cathodic reactions with their contribution varying in time.
More recently, Strebl et al. presented a novel approach which combines ORR and HER monitoring by combining a volumetric or manometric measurement with an oxygen concentration measurement provided by an optical O2 sensor [195,208]. The number of O2 molecules consumed can be then extracted from the total number of gas molecules to get the number of H2 molecules evolved. The setup was tested on AZ91 and AZ31 magnesium alloys, TL094 aluminium alloy, Fe, Cu and Zn under wet/dry conditions after NaCl contamination, both under static conditions in a closed chamber and intermittent-flow conditions, with the chamber being periodically opened and flushed with wet air. A very good correlation between corrosion rate measured with the respirometric method and mass loss was obtained. The technique is suitable for real-time corrosion monitoring in laboratory conditions and allows corrosion mechanism assessment, as the contribution of cathodic reactions in time is monitored and average oxidation state of a metal in corrosion products can be calculated. Further work on the technique optimisation and application for corrosion monitoring in service conditions is expected to be continued.

4. Comparison of Atmospheric Corrosion Monitoring Techniques

Studies applying the real-time atmospheric corrosion monitoring techniques described in the previous sections are summarised in Table 1 in terms of environments, sensing materials, ranges of detected corrosion rates and suitability for localised corrosion detection.
A comparison of the techniques is given in Table 2. In the first column, current applications are described, whereas their potential applications are suggested in the second column based on the operation principle. The sensitivity is defined in general categories for a quick orientation. The number of suppliers of commercial products is an important indicator of the applicability in service. Finally, main advantages and drawbacks of the techniques are summarised in the last two columns.
Metallic coupons are used for both indoor and outdoor corrosivity classification according to several standards. The technique is universal and provides easy-to-interpret results, but the corrosivity assessment using coupons is time-consuming and does not allow for real-time monitoring.
ACM is suitable for outdoor corrosion monitoring and assessment of time of wetness (TOW). The data have been used as an input for prediction models. The measurement is not sensitive to temperature fluctuations and showed a good correlation to mass loss of corrosion coupons. The main disadvantages of the technique are the necessity for the electrolyte presence to provide connection between electrodes, corrosion acceleration of the less noble metal caused by galvanic coupling and unclear data interpretation during rainfall and condensation, when the current output increases steeply. Future development of the technique should aim at the improvement of data interpretation algorithms, particularly for the rainfall effect correction.
Similarly to ACM, EIS and EN techniques require a continuous layer of electrolyte to connect the electrodes to be present on the surface. EIS proved to be able to generate useful laboratory or short-term outdoor data in atmospheric exposure conditions. However, it is not considered to be fit for long-term monitoring due to the complex signal interpretation and insufficient stability. EN has been tested outdoors. The main advantage of this method is its potential for localised corrosion detection and corrosion mechanism assessment, but the interpretation of its data is complex, and there is no generally valid data treatment method allowing for a direct corrosion rate calculation from the measured EN signal. The further development of the EN data processing procedure is thus of great importance.
ER is a universal technique that can be recommended for both indoor and outdoor measurements, as a compromise between sensitivity and lifetime can be found by a correct choice of sensor thickness. Sensors made of a wide range of metals and alloys are available. The method is suitable for long-term monitoring of uniform corrosion, providing direct and easy-to-interpret corrosion loss data. The measurement sensitivity to rapid temperature fluctuations which cannot be fully compensated by the reference part may, however, require additional data processing. Along with thermal noise elimination and filtering, the ability of the technique to detect localized corrosion should be considered as beneficial rather than disadvantageous and quantified in future studies.
QCM is an extremely sensitive technique used for corrosivity classification indoors and for laboratory studies of corrosion mechanisms. Due to its sensitivity to moisture, pollutants’ presence and temperature fluctuations, it is not suitable for exposures in harsh environments.
RFID is a state-of-the-art technique currently under development. It is probable to be applicable for corrosion monitoring in service in the future, especially under conditions which require compact wireless solutions. However, there is no ready-to-use solution available yet, as a number of technical obstacles need to be solved first.
FOCS is a technique potentially feasible for monitoring of atmospheric corrosion, but so far it has been developed and applied only for corrosion monitoring in concrete.
Respirometry is a highly-sensitive method which can provide information about corrosion rate and mechanisms. For these purposes, it has been used within laboratory investigations. The technique was tested as an indicator of historical artefacts’ degradation. It can be difficult to use it for real-time corrosion monitoring due to its sensitivity to RH, temperature and pressure variations, and the necessity of placing the monitored object into a sealed box, or to attach a sealed container to the surface.

5. Conclusions

Techniques used for real-time corrosion monitoring of metallic materials have been reviewed and compared focusing on their use in atmospheric conditions. Based on their key characteristics, such as sensitivity, lifetime, availability and data interpretation complexity, the following conclusions can be drawn.
  • Electrochemical EIS, EN and ACM methods can be recommended for the use under outdoor conditions and in laboratory tests at higher RH when stable electric connection between electrodes in ensured.
  • QCM is a powerful technique for extremely low corrosion rate detection in indoor environments.
  • The ER technique is the most universal corrosion monitoring tool, which can be applied both in high and weakly corrosive environments, depending on the sensor’s thickness.
  • Further development of the state-of-the art RFID, FOCS and respirometric techniques in the field of atmospheric corrosion is expected. At the current stage, it is too early to evaluate their application potential.

Author Contributions

Conceptualization, T.P.; methodology, K.P. and T.P.; validation, T.P.; formal analysis, K.P. and T.P.; investigation, K.P.; resources, K.P. and T.P.; writing—original draft preparation, K.P.; writing—review and editing, T.P.; visualization, K.P. and T.P.; supervision, T.P.; project administration, T.P.; funding acquisition, T.P. All authors have read and agreed to the published version of the manuscript.

Funding

Preparation of the review was funded by the Technological Agency of the Czech Republic (TAČR), grant number FW01010482.

Institutional Review Board Statement

Not applicable.

Informed Consent Statement

Not applicable.

Data Availability Statement

This paper is a review. All used data are publicly available in cited references.

Conflicts of Interest

The authors declare no conflict of interest.

Abbreviations

ACMAtmospheric corrosion monitor
ACTAccelerated corrosion test
AMPPAssociation for Material Protection and Performance
CDCorrosion depth
CECounter electrode
CPEConstant phase element
DEFCDynamic electrolyte film corrosion
ECMEnvironmental condition monitoring
ECNElectrochemical current noise
EISElectrochemical impedance spectroscopy
ENElectrochemical noise
EPNElectrochemical potential noise
ERElectrical resistance
FBGFiber Bragg grating
FOCSFibre optic corrosion sensor
HERH2 evolution reaction
HFHigh frequency
HFSSHigh Frequency Structural Simulation
IMPACTInternational Measures of Prevention, Application, and Economics of Corrosion Technologies
LFLow frequency
LPFGLong-period fibre grating
LPRLinear polarization resistance
MICMaximal information coefficient
ORRO2 oxidation reaction
PCPersonal computer
PCBPrinted circuit board
PDMSPolydimethyl siloxane
QCMQuartz crystal microbalance
QCM-DQuartz crystal microbalance with dissipation monitoring
REReference electrode
RFIDRadio-frequency identification sensors
RHRelative humidity
SEMScanning electron microscope
TTemperature
TREFThin film electrical resistance sensor
TMLTransmission-line model
TOWTime of wetness
UHFUltrahigh frequency
VNAVector network analysis
WEWorking electrode
ZRAZero resistance ammeter

References

  1. Koch, G.; Varney, J.; Thompson, N.; Moghissi, O.; Gould, M.; Payer, J. International Measures of Prevention, Application, and Economics of Corrosion Technologies Study; NACE International: Houston, TX, USA, 2016. [Google Scholar]
  2. Prosek, T.; Kouril, M.; Hilbert, L.R.; Degres, Y.; Blazek, V.; Thierry, D.; Hansen, M. Real time corrosion monitoring in atmosphere using automated battery driven corrosion loggers. Corros. Eng. Sci. Technol. 2008, 43, 129–133. [Google Scholar] [CrossRef]
  3. Li, S.; Kim, Y.G.; Jung, S.; Song, H.S.; Lee, S.M. Application of steel thin film electrical resistance sensor for in situ corrosion monitoring. Sens. Actuators B Chem. 2007, 120, 368–377. [Google Scholar] [CrossRef]
  4. Prošek, T.; Kouřil, M.; Dubus, M.; Taube, M.; Hubert, V.; Scheffel, B.; Degres, Y.; Jouannic, M.; Thierry, D. Real-Time monitoring of indoor air corrosivity in cultural heritage institutions with metallic electrical resistance sensors. Stud. Conserv. 2013, 58, 117–128. [Google Scholar] [CrossRef]
  5. EN ISO 8407. Corrosion of Metals and Alloys—Removal of Corrosion Products from Corrosion Test Specimens; EN ISO: Genève, Switzerland, 2009; p. 8407. [Google Scholar]
  6. Groysman, A. Corrosion Monitoring. Corros. Rev. 2009, 27, 205–343. [Google Scholar] [CrossRef]
  7. Jones, D.A. Principles and Prevention of Corrosion; Prentice Hall: Upper Saddle River, NJ, USA, 1996. [Google Scholar]
  8. Leygraf, C.; Wallinder, I.O.; Tidblad, J.; Graedel, T. Atmospheric Corrosion; John Wiley & Sons: Hoboken, NJ, USA, 2016. [Google Scholar]
  9. ISO 11844-2:2020. Corrosion of Metals and Alloys—Classification of Low Corrosivity of Indoor Atmospheres—Part 2: Determination of Corrosion Attack in Indoor Atmospheres. ISO: Genève, Switzerland, 2020.
  10. ISO 9226:2012. Corrosion of Metals and Alloys—Corrosivity of Atmospheres—Determination of Corrosion Rate of Standard Specimens for the Evaluation of Corrosivity. ISO: Genève, Switzerland, 2012.
  11. ISO 11844-1:2006. Corrosion of Metals and Alloys—Classification of Low Corrosivity of Indoor Atmospheres—Part 1: Determination and Estimation of Indoor Corrosivity. ISO: Genève, Switzerland, 2006.
  12. Yang, L. Techniques for Corrosion Monitoring; Southwest Research Institute: Boca Raton, FL, USA, 2008. [Google Scholar]
  13. Schindelholz, E.; Kelly, R.G. Wetting phenomena and time of wetness in atmospheric corrosion: A review. Corros. Rev. 2012, 30, 135–170. [Google Scholar] [CrossRef]
  14. Sereda, P.J. Atmospheric Factors Affecting the Corrosion of Steel. Ind. Eng. Chem. 1960, 52, 157–160. [Google Scholar] [CrossRef] [Green Version]
  15. Sereda, P.J.; Croll, S.; Slade, H. Measurement of the time-of-wetness by moisture sensors and their calibration. In Atmospheric Corrosion of Metals; ASTM International: West Conshohocken, PA, USA, 1982. [Google Scholar]
  16. Shinohara, T.; Motoda, S.; Oshikawa, W. Evaluation of corrosivity in atmospheric environment by ACM (Atmospheric Corrosion Monitor) type corrosion sensor. In Proceedings of the Pricm 5: The Fifth Pacific Rim International Conference on Advanced Materials and Processing, Pts 1–5, Beijing, China, 2–5 November 2004; Volume 475–479, pp. 61–64. [Google Scholar] [CrossRef]
  17. Motoda, S.-I.; Suzuki, Y.; Shinohara, T.; Kojima, Y.; Tsujikawa, S.; Oshikawa, W.; Itomura, S.; Fukushima, T.; Izumo, S. ACM (Atmospheric Corrosion Monitor) type corrosion sensor to evaluate corrosivity of marine atmosphere. Zair. Kankyo 1994, 43, 550–556. [Google Scholar] [CrossRef]
  18. Aiello, L.; Agarwala, V. Galvanic sensor for monitoring structural damage. Corros. Rev. 2007, 25, 39–50. [Google Scholar] [CrossRef]
  19. To, D.; Shinohara, T.; Umezawa, O. Experimental Investigation on the Corrosivity of Atmosphere through the Atmospheric Corrosion Monitoring (ACM) Sensors. Atmos. Mar. Corros. 2017, 75, 1–10. [Google Scholar] [CrossRef]
  20. Ahn, J.H.; Jeong, Y.S.; Kim, I.T.; Jeon, S.H.; Park, C.H. A Method for Estimating Time-Dependent Corrosion Depth of Carbon and Weathering Steel Using an Atmospheric Corrosion Monitor Sensor. Sensors 2019, 19, 1416. [Google Scholar] [CrossRef] [Green Version]
  21. Mizuno, D.; Suzuki, S.; Fujita, S.; Hara, N. Corrosion monitoring and materials selection for automotive environments by using Atmospheric Corrosion Monitor (ACM) sensor. Corros. Sci. 2014, 83, 217–225. [Google Scholar] [CrossRef]
  22. Zibo Pei, X.C.; Xiaojia, Y.; Qing, L.; Chenhan, X.; Dawei, Z.; Xiaogang, L. Understanding environmental impacts on initial atmospheric corrosion based on corrosion monitoring sensors. J. Mater. Sci. Technol. 2020, 64, 214–221. [Google Scholar] [CrossRef]
  23. Pei, Z.B.; Zhang, D.W.; Zhi, Y.J.; Yang, T.; Jin, L.L.; Fu, D.M.; Cheng, X.Q.; Terryn, H.A.; Mol, J.M.C.; Li, X.G. Towards understanding and prediction of atmospheric corrosion of an Fe/Cu corrosion sensor via machine learning. Corros. Sci. 2020, 170, 108697. [Google Scholar] [CrossRef]
  24. Fuse, N.; Naganuma, A.; Fukuchi, T.; Tani, J.; Hori, Y. Methodology to Improve Corrosion Rate Estimation Based on Atmospheric Corrosion Monitoring Sensors. Corrosion 2017, 73, 199–209. [Google Scholar] [CrossRef]
  25. Kainuma, S.; Yamamoto, Y.; Itoh, Y.; Oshikawa, W. Prediction method for mean corrosion depth of uncoated carbon steel plate subjected to rainfall effect using Fe/Ag galvanic couple ACM-Type corrosion sensor. Zair. Kankyo Corros. Eng. 2011, 60, 497–503. [Google Scholar] [CrossRef] [Green Version]
  26. Kainuma, S.; Sugitani, K.; Itoh, Y.; Kim, I.T. Evaluation Method for Time-dependent Corrosion Behavior of Carbon Steel Plate using Atmospheric Corrosion Monitoring Sensor. Adv. Fract. Damage Mech. Viii 2010, 417, 417–420. [Google Scholar] [CrossRef]
  27. Cao, X.L.; Xiao, Y.D.; Deng, H.D.; Cao, P.J.; Jia, B. Evaluation of Atmospheric Corrosivity by ACM Technique. Proc. Mater. Sci. Forum 2009, 610–613, 3–8. [Google Scholar] [CrossRef]
  28. Ma, C.; Wang, Z.; Behnamian, Y.; Gao, Z.; Wu, Z.; Qin, Z.; Xia, D.-H. Measuring atmospheric corrosion with electrochemical noise: A review of contemporary methods. Measurement 2019, 138, 54–79. [Google Scholar] [CrossRef]
  29. Diler, E.; Peltier, F.; Becker, J.; Thierry, D. Real-time corrosion monitoring of aluminium alloys under chloride-contaminated atmospheric conditions. Mater. Corros. 2021, 72, 1377–1387. [Google Scholar] [CrossRef]
  30. Huang, Y.L.; Yang, D.; Xu, Y.; Lu, D.Z.; Yang, L.H.; Wang, X.T. Field Study of Weather Conditions Affecting Atmospheric Corrosion by an Automobile-Carried Atmospheric Corrosion Monitor Sensor. J. Mater. Eng. Perform. 2020, 29, 5840–5853. [Google Scholar] [CrossRef]
  31. Dara, T.; Shinohara, T.; Umezawa, O. Effects of Anion on the Corrosion Behaviors of Carbon Steel under Artificial Rainfall. In Proceedings of the 9th Pacific Rim International Conference on Advanced Materials and Processing (PRICM9), Kyoto, Japan, 1–8 August 2016; The Japan Institute of Metals and Materials: Sendai, Japan, 2016. [Google Scholar]
  32. Shi, Y.N.; Fu, D.M.; Zhou, X.Y.; Yang, T.; Zhi, Y.J.; Pei, Z.B.; Zhang, D.W.; Shao, L.Z. Data mining to online galvanic current of zinc/copper Internet atmospheric corrosion monitor. Corros. Sci. 2018, 133, 443–450. [Google Scholar] [CrossRef]
  33. Goidanich, S.; Gulotta, D.; Brambilla, L.; Beltrami, R.; Fermo, P.; Toniolo, L. Setup of Galvanic Sensors for the Monitoring of Gilded Bronzes. Sensors 2014, 14, 7066–7083. [Google Scholar] [CrossRef] [Green Version]
  34. Atmospheric Corrosion Monitor. Available online: https://english.uedaindustry.co.jp/product/atmospheric/ (accessed on 21 December 2021).
  35. Epelboin, I.; Gabrielli, C.; Keddam, M.; Takenouti, H. Alternating-current impedance measurements applied to corrosion studies and corrosion-rate determination. In Electrochemical Corrosion Testing; ASTM International: West Conshohocken, PA, USA, 1981. [Google Scholar]
  36. Dillmann, P.; Watkinson, D.; Angelini, E.; Adriaens, A. Corrosion and Conservation of Cultural Heritage Metallic Artefacts; Woodhead Publishing: Philadelphia, PA, USA, 2013. [Google Scholar]
  37. Xia, D.H.; Song, S.Z.; Qin, Z.B.; Hu, W.B.; Behnamian, Y. Review-Electrochemical Probes and Sensors Designed for Time-Dependent Atmospheric Corrosion Monitoring: Fundamentals, Progress, and Challenges. J. Electrochem. Soc. 2019, 167, 037513. [Google Scholar] [CrossRef]
  38. Fu, X.X.; Dong, J.H.; Han, E.H.; Ke, W. A New Experimental Method for in Situ Corrosion Monitoring Under Alternate Wet-Dry Conditions. Sensors 2009, 9, 10400–10410. [Google Scholar] [CrossRef] [PubMed]
  39. Grassini, S.; Corbellini, S.; Parvis, M.; Angelini, E.; Zucchi, F. A simple Arduino-based EIS system for in situ corrosion monitoring of metallic works of art. Measurement 2018, 114, 508–514. [Google Scholar] [CrossRef]
  40. Da-Hai Xia, C.D.; Digby, M.; Sina, J.; Douglas, M.; Jing-Li, L.; Michael, G.; Strebl, M.A.; Weixian, J.; Shizhe, S.; Wenbin, H. Electrochemical measurements used for assessment of corrosion and protection of metallic materials in the field: A critical review. J. Mater. Sci. Technol. 2021, 112, 151–183. [Google Scholar] [CrossRef]
  41. Cano, E.; Lafuente, D.; Bastidas, D.M. Use of EIS for the evaluation of the protective properties of coatings for metallic cultural heritage: A review. J. Solid State Electrochem. 2010, 14, 381–391. [Google Scholar] [CrossRef] [Green Version]
  42. Liao, X.-N.; Cao, F.-H.; Chen, A.-N.; Liu, W.-J.; Zhang, J.-Q.; Cao, C.-N. In-situ investigation of atmospheric corrosion behavior of bronze under thin electrolyte layers using electrochemical technique. Trans. Nonferrous Met. Soc. China 2012, 22, 1239–1249. [Google Scholar] [CrossRef]
  43. Pan, C.; Lv, W.; Wang, Z.; Su, W.; Wang, C.; Liu, S. Atmospheric corrosion of copper exposed in a simulated coastal-industrial atmosphere. J. Mater. Sci. Technol. 2017, 33, 587–595. [Google Scholar] [CrossRef]
  44. Ma, X.M.; Cheng, Q.L.; Zheng, M.; Cui, F.Y.; Hou, B.R. Monitoring Marine Atmospheric Corrosion by Electrochemical Impedance Spectroscopy under Various Relative Humidities. Int. J. Electrochem. Sci. 2015, 10, 10402–10421. [Google Scholar]
  45. Nishikata, A.; Yamashita, Y.; Katayama, H.; Tsuru, T.; Usami, A.; Tanabe, K.; Mabuchi, H. An Electrochemical Impedance Study on Atmospheric Corrosion of Steels in a Cyclic Wet-Dry Condition. Corros. Sci. 1995, 37, 2059–2069. [Google Scholar] [CrossRef]
  46. Nishikata, A.; Ichihara, Y.; Tsuru, T. An application of electrochemical impedance spectroscopy to atmospheric corrosion study. Corros. Sci. 1995, 37, 897–911. [Google Scholar] [CrossRef]
  47. Nishikata, A.; Suzuki, F.; Tsuru, T. Corrosion monitoring of nickel-containing steels in marine atmospheric environment. Corros. Sci. 2005, 47, 2578–2588. [Google Scholar] [CrossRef]
  48. Shi, Y.; Tada, E.; Nishikata, A. A method for determining the corrosion rate of a metal under a thin electrolyte film. J. Electrochem. Soc. 2015, 162, C135–C139. [Google Scholar] [CrossRef]
  49. Nishikata, A.; Ichihara, Y.; Tsuru, T. Electrochemical impedance spectroscopy of metals covered with a thin electrolyte layer. Electrochim. Acta 1996, 41, 1057–1062. [Google Scholar] [CrossRef]
  50. Nishikata, A.; Ichihara, Y.; Hayashi, Y.; Tsuru, T. Influence of electrolyte layer thickness and pH on the initial stage of the atmospheric corrosion of iron. J. Electrochem. Soc. 1997, 144, 1244. [Google Scholar] [CrossRef]
  51. Thee, C.; Hao, L.; Dong, J.H.; Mu, X.; Wei, X.; Li, X.F.; Ke, W. Atmospheric corrosion monitoring of a weathering steel under an electrolyte film in cyclic wet-dry condition. Corros. Sci. 2014, 78, 130–137. [Google Scholar] [CrossRef]
  52. Thee, C.; Hao, L.; Dong, J.H.; Mu, X.; Ke, W. Numerical Approach for Atmospheric Corrosion Monitoring Based on EIS of a Weathering Steel. Acta Met. Sin. Engl. 2015, 28, 261–271. [Google Scholar] [CrossRef]
  53. Thee, C.; Dong, J.; Ke, W. Corrosion monitoring of weathering steel in a simulated coastal-industrial environment. Int. J. Environ. Ecol. Eng. 2015, 9, 587–593. [Google Scholar]
  54. Cruz, R.V.; Nishikata, A.; Tsuru, T. AC impedance monitoring of pitting corrosion of stainless steel under a wet-dry cyclic condition in chloride-containing environment. Corros. Sci. 1996, 38, 1397–1406. [Google Scholar] [CrossRef]
  55. Cruz, R.V.; Nishikata, A.; Tsuru, T. Pitting corrosion mechanism of stainless steels under wet-dry exposure in chloride-containing environments. Corros. Sci. 1998, 40, 125–139. [Google Scholar] [CrossRef]
  56. Katayama, H.; Tay, Y.-C.; AS, V.; Nishikata, A.; Tsuru, T. Corrosion monitoring of Zn and Zn–Al coated steels under wet-dry cyclic conditions using AC impedance method. Mater. Trans. JIM 1997, 38, 1089–1094. [Google Scholar] [CrossRef] [Green Version]
  57. El-Mahdy, G.A.; Nishikata, A.; Tsuru, T. AC impedance study on corrosion of 555%Al-Zn alloy-coated steel under thin electrolyte layers. Corros. Sci. 2000, 42, 1509–1521. [Google Scholar] [CrossRef]
  58. El-Mahdy, G.A.; Nishikata, A.; Tsuru, T. Electrochemical corrosion monitoring of galvanized steel under cyclic wet-dry conditions. Corros. Sci. 2000, 42, 183–194. [Google Scholar] [CrossRef]
  59. Yadav, A.; Nishikata, A.; Tsuru, T. Electrochemical impedance study on galvanized steel corrosion under cyclic wet–dry conditions––influence of time of wetness. Corros. Sci. 2004, 46, 169–181. [Google Scholar] [CrossRef]
  60. Yadav, A.P.; Nishikata, A.; Tsuru, T. Degradation mechanism of galvanized steel in wet–dry cyclic environment containing chloride ions. Corros. Sci. 2004, 46, 361–376. [Google Scholar] [CrossRef]
  61. Somphotch, C.; Hayashibara, H.; Ooi, A.; Tada, E.; Nishikata, A. Corrosion behavior of zinc under thin solution films of different thicknesses. J. Electrochem. Soc. 2018, 165, C590. [Google Scholar] [CrossRef]
  62. Zhong, X.; Zhang, G.; Qiu, Y.; Chen, Z.; Guo, X.; Fu, C. The corrosion of tin under thin electrolyte layers containing chloride. Corros. Sci. 2013, 66, 14–25. [Google Scholar] [CrossRef]
  63. Liao, X.; Cao, F.; Zheng, L.; Liu, W.; Chen, A.; Zhang, J.; Cao, C. Corrosion behaviour of copper under chloride-containing thin electrolyte layer. Corros. Sci. 2011, 53, 3289–3298. [Google Scholar] [CrossRef]
  64. Wan, S.; Hou, J.; Zhang, Z.F.; Zhang, X.X.; Dong, Z.H. Monitoring of atmospheric corrosion and dewing process by interlacing copper electrode sensor. Corros. Sci. 2019, 150, 246–257. [Google Scholar] [CrossRef]
  65. El-Mahdy, G.; Kim, K.B. AC impedance study on the atmospheric corrosion of aluminum under periodic wet-dry conditions. Electrochim. Acta 2004, 49, 1937–1948. [Google Scholar] [CrossRef]
  66. Nishikata, A.; Van Tran, N.; Ooi, A.; Tada, E. (Keynote) EIS Study of Galvanic Corrosion of Al Alloy Coupled with High Strength Steel in Simulated Atmospheres. In Proceedings of the ECS Meeting Abstracts, PRiME 2020 (ECS, ECSJ & KECS Joint Meeting), Online, 4–9 October 2020; p. 1318. [Google Scholar]
  67. Van Tran, N.; Ooi, A.; Tada, E.; Nishikata, A. Galvanic Corrosion of Aluminum Alloy Coupled with Ultra High-Strength Steel Under Thin Chloride Solution Layers. In Proceedings of the ECS Meeting Abstracts, 236th ECS Meeting, Atlanta, GA, USA, 13–17 October 2019; p. 777. [Google Scholar]
  68. Van Tran, N.; Ooi, A.; Tada, E.; Nishikata, A. EIS Characteristics of Galvanic Couple of Aluminum Alloy and High-strength Steel under Thin Solution Films. J. Electrochem. Soc. 2020, 167, 131507. [Google Scholar] [CrossRef]
  69. Nishikata, A.; Zhu, Q.J.; Tada, E. Long-term monitoring of atmospheric corrosion at weathering steel bridges by an electrochemical impedance method. Corros. Sci. 2014, 87, 80–88. [Google Scholar] [CrossRef]
  70. Ito, M.; Ooi, A.; Tada, E.; Nishikata, A. In Situ Evaluation of Carbon Steel Corrosion under Salt Spray Test by Electrochemical Impedance Spectroscopy. J Electrochem. Soc. 2020, 167, 101508. [Google Scholar] [CrossRef]
  71. Li, C.L.; Ma, Y.T.; Li, Y.; Wang, F.H. EIS monitoring study of atmospheric corrosion under variable relative humidity. Corros. Sci. 2010, 52, 3677–3686. [Google Scholar] [CrossRef]
  72. Angelini, E.; Grassini, S.; Corbellini, S.; Ingo, G.M.; De Caro, T.; Plescia, P.; Riccucci, C.; Bianco, A.; Agostini, S. Potentialities of XRF and EIS portable instruments for the characterisation of ancient artefacts. Appl. Phys. A Mater 2006, 83, 643–649. [Google Scholar] [CrossRef]
  73. Angelini, E.; Corbellini, S.; Parvis, M.; Ferraris, F.; Grassini, S. An Arduino-based EIS with a Logarithmic Amplifier for Corrosion Monitoring. In Proceedings of the 2014 IEEE International Instrumentation and Measurement Technology Conference (I2mtc) Proceedings, Montevideo, Uruguay, 12–15 May 2014; pp. 905–910. [Google Scholar]
  74. Angelini, E.; Grassini, S.; Parvis, M.; Zucchi, F. Corrosion Prediction of Metallic Cultural Heritage Assets by EIS. Corros. Sci. Technol. Korea 2019, 18, 121–128. [Google Scholar] [CrossRef]
  75. Xia, D.H.; Song, S.Z.; Wang, J.H.; Shi, J.B.; Bi, H.C.; Gao, Z.M. Determination of corrosion types from electrochemical noise by phase space reconstruction theory. Electrochem. Commun. 2012, 15, 88–92. [Google Scholar] [CrossRef]
  76. Han, L.; Xia, D.H.; Song, S.Z.; Zhang, Z.; Bi, H.C.; Gao, Z.M.; Wang, J.H.; Hu, W.B. Online Monitoring of the Atmospheric Corrosion of Aluminium Alloys Using Electrochemical Noise Technique. Russ. J. Electrochem. 2018, 54, 623–628. [Google Scholar] [CrossRef]
  77. Iverson, W.P. Transient Voltage Changes Produced in Corroding Metals and Alloys. J. Electrochem. Soc. 1968, 115, 617. [Google Scholar] [CrossRef]
  78. Stewart, J.; Williams, D. The initiation of pitting corrosion on austenitic stainless steel: On the role and importance of sulphide inclusions. Corros. Sci. 1992, 33, 457–474. [Google Scholar] [CrossRef]
  79. Eden, D.A.; John, D.G.; Dawson, J.L. Corrosion Monitoring. U.S. Patent 5,139,627, 18 August 1992. [Google Scholar]
  80. Mansfeld, F.; Xiao, H. Electrochemical Noise-Analysis of Iron Exposed to Nacl Solutions of Different Corrosivity. J. Electrochem. Soc. 1993, 140, 2205–2209. [Google Scholar] [CrossRef]
  81. Xia, D.-H.; Behnamian, Y. Electrochemical noise: A review of experimental setup, instrumentation and DC removal. Russ. J. Electrochem. 2015, 51, 593–601. [Google Scholar] [CrossRef]
  82. Xia, D.H.; Song, S.Z.; Behnamian, Y.; Hu, W.B.; Cheng, Y.F.; Luo, J.L.; Huet, F. Review-Electrochemical Noise Applied in Corrosion Science: Theoretical and Mathematical Models towards Quantitative Analysis. J. Electrochem. Soc. 2020, 167, 081507. [Google Scholar] [CrossRef]
  83. Cottis, R.A. Interpretation of electrochemical noise data. Corrosion 2001, 57, 265–285. [Google Scholar] [CrossRef]
  84. Uruchurtu, J.; Dawson, J. Noise analysis of pure aluminum under different pitting conditions. Corrosion 1987, 43, 19–26. [Google Scholar] [CrossRef]
  85. Hladky, K.; Dawson, J. The measurement of corrosion using electrochemical 1f noise. Corros. Sci. 1982, 22, 231–237. [Google Scholar] [CrossRef]
  86. Garcia-Ochoa, E.; Corvo, F. Copper patina corrosion evaluation by means of fractal geometry using electrochemical noise (EN) and image analysis. Electrochem. Commun. 2010, 12, 826–830. [Google Scholar] [CrossRef]
  87. Li, J.; Kong, W.K.; Shi, J.B.; Wang, K.; Wang, W.K.; Zhao, W.P.; Zeng, Z.M. Determination of Corrosion Types from Electrochemical Noise by Artificial Neural Networks. Int. J. Electrochem. Sci. 2013, 8, 2365–2377. [Google Scholar]
  88. Hei, M.; Xia, D.H.; Song, S.Z.; Gao, Z.M. Sensing Atmospheric Corrosion of Carbon Steel and Low-Alloy Steel Using the Electrochemical Noise Technique: Effects of Weather Conditions. Prot. Met. Phys. Chem. Surf. 2017, 53, 1100–1113. [Google Scholar] [CrossRef]
  89. Ma, C.; Song, S.Z.; Gao, Z.M.; Wang, J.H.; Hu, W.B.; Behnamian, Y.; Xia, D.H. Electrochemical noise monitoring of the atmospheric corrosion of steels: Identifying corrosion form using wavelet analysis. Corros. Eng. Sci. Technol. 2017, 52, 432–440. [Google Scholar] [CrossRef]
  90. Xia, D.H.; Song, S.Z.; Jin, W.X.; Li, J.; Gao, Z.M.; Wang, J.H.; Hu, W.B. Atmospheric Corrosion Monitoring of Field-exposed Q235B and T91 Steels in Zhoushan Offshore Environment Using Electrochemical Probes. J. Wuhan Univ. Technol. Mater. Sci. Ed. 2017, 32, 1433–1440. [Google Scholar] [CrossRef]
  91. Xia, D.-H.; Ma, C.; Song, S.; Xu, L. Detection of atmospheric corrosion of aluminum alloys by electrochemical probes: Theoretical analysis and experimental tests. J. Electrochem. Soc. 2019, 166, B1000. [Google Scholar] [CrossRef]
  92. ASTM G96-90(2008). Standard Guide for Online Monitoring of Corrosion in Plant Equipment (Electrical and Electrochemical Methods); ASTM: West Conshohocken, PA, USA, 2008. [Google Scholar] [CrossRef]
  93. Diler, E.; Lédan, F.; LeBozec, N.; Thierry, D. Real-time monitoring of the degradation of metallic and organic coatings using electrical resistance sensors. Mater. Corros. 2017, 68, 1365–1376. [Google Scholar] [CrossRef]
  94. Dubus, M.; Kouril, M.; Nguyen, T.P.; Prosek, T.; Saheb, M.; Tate, J. Monitoring Copper and Silver Corrosion in Different Museum Environments by Electrical Resistance Measurement. Stud. Conserv. 2010, 55, 121–133. [Google Scholar] [CrossRef]
  95. Yasri, M.; Lescop, B.; Diler, E.; Gallee, F.; Thierry, D.; Rioual, S. Fundamental basis of electromagnetic wave propagation in a zinc microstrip lines during its corrosion. Sens. Actuators B Chem. 2016, 223, 352–358. [Google Scholar] [CrossRef]
  96. Dyos, G. The Handbook of Electrical Resistivity: New materials and pressure effects; The Institution of Engineering and Technology: London, UK, 2012. [Google Scholar]
  97. Li, Z.L.; Fu, D.M.; Li, Y.; Wang, G.Y.; Meng, J.T.; Zhang, D.W.; Yang, Z.H.; Ding, G.Q.; Zhao, J.B. Application of An Electrical Resistance Sensor-Based Automated Corrosion Monitor in the Study of Atmospheric Corrosion. Materials 2019, 12, 1065. [Google Scholar] [CrossRef] [Green Version]
  98. Kouřil, M.; Prošek, T.; Scheffel, B.; Dubois, F. High sensitivity electrical resistance sensors for indoor corrosion monitoring. Corros. Eng. Sci. Technol. 2013, 48, 282–287. [Google Scholar] [CrossRef]
  99. Faifer, M.; Goidanich, S.; Laurano, C.; Petiti, C.; Toscani, S.; Zanoni, M. Measurement Setup for the Development of Pre-Corroded Sensors for Metal Artwork Monitoring. In Proceedings of the 2019 IMEKO TC-4, Florence, Italy, 4–6 December 2019; pp. 1–6. [Google Scholar]
  100. Zajec, B.; Leban, M.B.; Lenart, S.; Gavin, K.; Legat, A. Electrochemical impedance and electrical resistance sensors for the evaluation of anticorrosive coating degradation. Corros. Rev. 2017, 35, 65–74. [Google Scholar] [CrossRef]
  101. Prošek, T.; Le Bozec, N.; Thierry, D. Application of automated corrosion sensors for monitoring the rate of corrosion during accelerated corrosion tests. Mater. Corros. 2014, 65, 448–456. [Google Scholar] [CrossRef]
  102. Kouril, M.; Prosek, T.; Scheffel, B.; Degres, Y. Corrosion monitoring in archives by the electrical resistance technique. J. Cult. Herit. 2014, 15, 99–103. [Google Scholar] [CrossRef]
  103. Prosek, T.; Taube, M.; Dubois, F.; Thierry, D. Application of automated electrical resistance sensors for measurement of corrosion rate of copper, bronze and iron in model indoor atmospheres containing short-chain volatile carboxylic acids. Corros. Sci. 2014, 87, 376–382. [Google Scholar] [CrossRef]
  104. Dubus, M.; Prosek, T. Standardized Assessment of Cultural Heritage Environments by Electrical Resistance Measurements. e-PRESERVATIONScience 2012, 9, 67–71. [Google Scholar]
  105. Kouřil, M.; Prošek, T.; Dubus, M.; Taube, M.; Hubert, V.; Scheffel, B.; Degres, Y.; Jouannic, M.; Thierry, D. Korozní monitoring v rukách restaurátorů a konzervátorů/Corrosion monitoring in the hands of restorers and conservators. Koroze A Ochr. Mater. 2012, 56, 67–75. [Google Scholar]
  106. Prosek, T.; Dubois, F.; Kouril, M.; Scheffel, B.; Degres, Y.; Jouannic, M.; Taube, M.; Dubus, M.; Hubert, V.; Thierry, D. Application of Automated Corrosion Sensors for Real-Time Monitoring in Atmospheres Polluted with Organic Acids. In Proceedings of the 18th International Corrosion Congress 2011, Perth, WA, USA, 20–24 November 2011; pp. 1477–1484. [Google Scholar]
  107. Vaissière, L.; Ragazzini, M.; Despert, G.; LeBozec, N.; Thierry, D. Cartography of corrosion aggressivity on vehicle in dynamic corrosion test in Renault. In Proceedings of the EUROCORR, Stockholm, Sweden, 4–8 September 2011. [Google Scholar]
  108. Masataka Omoda, D.M. Nobuyuki Ishikawa Analysis of Corrosion Behaviour of Iron and Zinc in Varioous Atmospheric Environments Using Electrical Resistance Technique. In Proceedings of the Galvatech, 11th International Conference on Zinc and Zinc Alloy Coated Steel Sheet, Tokio, Japan, 12–16 November 2017. [Google Scholar]
  109. Msallamova, S.; Kouril, M.; Strachotova, K.C.; Stoulil, J.; Popova, K.; Dvorakova, P. Historical lead seals and the influence of disinfectants on the lead corrosion rate. Herit. Sci. 2019, 7, 18. [Google Scholar] [CrossRef]
  110. Msallamova, S.; Kouril, M.; Strachotova, K.C.; Stoulil, J.; Popova, K.; Dvorakova, P.; Lhotka, M. Protection of lead in an environment containing acetic acid vapour by using adsorbents and their characterization. Herit. Sci. 2019, 7, 76. [Google Scholar] [CrossRef] [Green Version]
  111. Strachotova, K.C.; Kuchtakova, K.; Kouril, M.; Msallamova, S. Protection of Lead in Acetic Acid Containing Air by Means of Corrosion Inhibitors. In Proceedings of the 27th International Conference on Metallurgy and Materials (Metal 2018), Brno, Czech Republic, 23–25 May 2018; pp. 1045–1050. [Google Scholar]
  112. Strachotová, K.C.; Kouřil, M. Effect of the presence of corrosion products on the corrosion rate of lead during the exposition with paper packaging materials. Koroze A Ochr. Mater. 2018, 62, 87. [Google Scholar] [CrossRef] [Green Version]
  113. Van den Steen, N.; Simillion, H.; Thierry, D.; Deconinck, J. Modeling Film Thicknesses and Estimating Corrosion Depths Under Climate Control. In Proceedings of the ECS Meeting Abstracts, PRiME 2016/230th ECS Meeting, Honolulu, HI, USA, 2–7 October 2016; p. 1319. [Google Scholar]
  114. Van den Steen, N.; Simillion, H.; Thierry, D.; Terryn, H.; Deconinck, J. Comparing Modeled and Experimental Accelerated Corrosion Tests on Steel. J. Electrochem. Soc. 2017, 164, C554–C562. [Google Scholar] [CrossRef]
  115. Kreislova, K.; Fialova, P.; Bohackova, T. Indoor corrosivity in Klementinum baroque library hall. In Prague Structural Studies, Repairs and Maintenance of Heritage Architecture XVII & Earthquake Resistant Engineering Structures XIII; WIT Press: Ashurst Lodge, UK, 2021; p. 123. [Google Scholar]
  116. Bailey, G.; Brian, J.; Champion, C. An investigation into the impact of sealed wooden and acrylic showcases and storage cases on the corrosion of lead objects during long term storage and display. AICCM Bull. 2017, 38, 43–50. [Google Scholar] [CrossRef]
  117. Svadlena, J.; Voracova, E.; Stoulil, J. Corrosion of silver in environment containing halides, pseudohalides, or thiourea. Mater. Corros. Werkst. Und Korros. 2020, 71, 1721–1728. [Google Scholar] [CrossRef]
  118. Kosec, T.; Kuhar, V.; Kranjc, A.; Malnaric, V.; Belingar, B.; Legat, A. Development of an Electrical Resistance Sensor from High Strength Steel for Automotive Applications. Sensors 2019, 19, 1956. [Google Scholar] [CrossRef] [Green Version]
  119. Zajec, B.; Bajt Leban, M.; Kosec, T.; Kuhar, V.; Legat, A.; Lenart, S.; Fifer Bizjak, K.; Gavin, K. Corrosion monitoring of steel structure coating degradation. Teh. Vjesn. 2018, 25, 1348–1355. [Google Scholar]
  120. Shan, W.; LIAO, B.-k.; DONG, Z.-h.; GUO, X.-p. Comparative investigation on copper atmospheric corrosion by electrochemical impedance and electrical resistance sensors. Trans. Nonferrous Met. Soc. China 2021, 31, 3024–3038. [Google Scholar]
  121. AirCorr: Corrosion. Available online: https://nke-instrumentation.com/produit/aircorr-corrosion/ (accessed on 21 December 2021).
  122. ECM™ Environmental Condition Monitoring System. Available online: https://www.cosasco.com/product/ecm-environmental-condition-monitoring-system (accessed on 21 December 2021).
  123. Atmospheric Corrosion Sensor. Available online: https://www.cosasco.com/product/atmospheric-er-corrosion-sensor-610 (accessed on 21 December 2021).
  124. (ER) Electrical Resistance Probes. Available online: https://www.corrosionservice.com/wp-content/uploads/2017/03/COSASCO_ER-Electrical-Resistance-Probes.pdf (accessed on 21 December 2021).
  125. Light, E.; Little, B.; Barclay, M.; Manis, B.; Gay, R.; Bailey, J. Measuring the Corrosivity of Indoor Air. In Proceedings of the Indoor Air 2011, Austin, TX, USA, 5–10 June 2011. [Google Scholar]
  126. Morcillo, M.; Otero, E.; Chico, B.; de la Fuente, D. Atmospheric corrosion studies in a decommissioned nuclear power plant. In Nuclear Power; InTech: Rijeka, Croatia, 2010; pp. 243–265. [Google Scholar]
  127. Hart, L.; Storme, P.; Anaf, W.; Nuyts, G.; Vanmeert, F.; Dorrine, W.; Janssens, K.; de Wael, K.; Schalm, O. Monitoring the impact of the indoor air quality on silver cultural heritage objects using passive and continuous corrosion rate assessments. Appl. Phys. A Mater. 2016, 122, 923. [Google Scholar] [CrossRef]
  128. SURVEYOR PLUS™. Available online: https://circul-aire.com/corrosion-monitoring/surveyor-plus/ (accessed on 21 December 2021).
  129. Since 2015: Viledon ChemWatch. Available online: https://www.freudenberg-filter.com/en/innovations/chemwatch-online-monitoring/ (accessed on 21 December 2021).
  130. Bennett, A. Developments in air & gas filtration technology. Filtr. Separat. 2016, 53, 30–35. [Google Scholar]
  131. Marcus, P.; Mansfeld, F. Analytical Methods in Corrosion Science and Engineering; CRC Press: Boca Raton, FL, USA, 2006; 760p. [Google Scholar]
  132. England, W.G.; Osborne, M.W.; Xiuyi, Z. Applications of a Real-Time Electronic Contact Corrosion Monitor. Adv. Instrum. Control 1991, 46, 929–955. [Google Scholar]
  133. Forslund, M.; Leygraf, C. A quartz crystal microbalance probe developed for outdoor in situ atmospheric corrosivity monitoring. J. Electrochem. Soc. 1996, 143, 839–844. [Google Scholar] [CrossRef]
  134. Forslund, M.; Majoros, J.; Leygraf, C. A sensor system for high resolution in situ atmospheric corrosivity monitoring in field environment. J. Electrochem. Soc. 1997, 144, 2637–2642. [Google Scholar] [CrossRef]
  135. ASTM B808-97(2003). Standard Test Method for Monitoring of Atmospheric Corrosion Chambers by Quartz Crystal Microbalances. ASTM: West Conshohocken, PA, USA, 2003. [CrossRef]
  136. Petrunin, M.A.; Gladkikh, N.A.; Maleeva, M.A.; Yurasova, T.A.; Terekhova, E.V.; Maksaeva, L.B. Application of the quartz crystal microbalance technique in corrosion studies. A review. Int. J. Corros. Scale Inhib. 2020, 9, 92–117. [Google Scholar] [CrossRef]
  137. Baek, Y.; Frankel, G.S. Electrochemical quartz crystal microbalance study of corrosion of phases in AA2024-T3. Corros. Corros. Prot. 2001, 2001, 814–821. [Google Scholar]
  138. Fujii, K.; Ohashi, K.; Hashimoto, T.; Hara, N. Atmospheric Corrosivity Estimation at Electrical Control Unit Room by Multichannel Quartz Crystal Microbalance Corrosion Sensors. Mater. Trans. 2012, 53, 412–416. [Google Scholar] [CrossRef] [Green Version]
  139. Hosseinpour, S.; Schwind, M.; Kasemo, B.; Leygraf, C.; Johnson, C.M. Integration of Quartz Crystal Microbalance with Vibrational Sum Frequency Spectroscopy-Quantification of the Initial Oxidation of Alkanethiol-Covered Copper. J. Phys. Chem. C 2012, 116, 24549–24557. [Google Scholar] [CrossRef]
  140. Ehahoun, H.; Gabrielli, C.; Keddam, M.; Perrot, H.; Cetre, Y.; Diguet, L. Electrochemical quartz crystal microbalance corrosion sensor for solid metals and metal alloys—Application to the dissolution of 304 stainless steel. J. Electrochem. Soc. 2001, 148, B333–B336. [Google Scholar] [CrossRef]
  141. Kleber, C.; Hilfrich, U.; Schreiner, M. In situ QCM and TM-AFM investigations of the early stages of degradation of silver and copper surfaces. Appl. Surf. Sci. 2007, 253, 3712–3721. [Google Scholar] [CrossRef]
  142. Kleber, C.; Wiesinger, R.; Schnoller, J.; Hilfrich, U.; Hutter, H.; Schreiner, M. Initial oxidation of silver surfaces by S2- and S4+ species. Corros. Sci. 2008, 50, 1112–1121. [Google Scholar] [CrossRef]
  143. Wiesinger, R.; Kleber, C.; Frank, J.; Schreiner, M. A New Experimental Setup for in Situ Infrared Reflection Absorption Spectroscopy Studies of Atmospheric Corrosion on Metal Surfaces Considering the Influence of Ultraviolet Light. Appl. Spectrosc. 2009, 63, 465–470. [Google Scholar] [CrossRef]
  144. Wiesinger, R.; Schreiner, M.; Kleber, C. Investigations of the interactions of CO2, O3 and UV light with silver surfaces by in situ IRRAS/QCM and ex situ TOF-SIMS. Appl. Surf. Sci. 2010, 256, 2735–2741. [Google Scholar] [CrossRef]
  145. Wiesinger, R.; Schade, U.; Kleber, C.; Schreiner, M. An experimental set-up to apply polarization modulation to infrared reflection absorption spectroscopy for improved in situ studies of atmospheric corrosion processes. Rev. Sci. Instrum. 2014, 85, 064102. [Google Scholar] [CrossRef]
  146. Wiesinger, R.; Martina, I.; Kleber, C.; Schreiner, M. Influence of relative humidity and ozone on atmospheric silver corrosion. Corros. Sci. 2013, 77, 69–76. [Google Scholar] [CrossRef]
  147. Wan, S.; Ma, X.Z.; Miao, C.H.; Zhang, X.X.; Dong, Z.H. Inhibition of 2-phenyl imidazoline on chloride-induced initial atmospheric corrosion of copper by quartz crystal microbalance and electrochemical impedance. Corros. Sci. 2020, 170, 108692. [Google Scholar] [CrossRef]
  148. Schwind, M.; Langhammer, C.; Kasemo, B.; Zoric, I. Nanoplasmonic sensing and QCM-D as ultrasensitive complementary techniques for kinetic corrosion studies of aluminum nanoparticles. Appl. Surf. Sci. 2011, 257, 5679–5687. [Google Scholar] [CrossRef]
  149. Larsson, E.M.; Edvardsson, M.E.M.; Langhammer, C.; Zoric, I.; Kasemo, B. A combined nanoplasmonic and electrodeless quartz crystal microbalance setup. Rev. Sci. Instrum. 2009, 80, 125105. [Google Scholar] [CrossRef]
  150. Schwind, M.; Hosseinpour, S.; Johnson, C.M.; Langhammer, C.; Zoric, I.; Leygraf, C.; Kasemo, B. Combined in Situ Quartz Crystal Microbalance with Dissipation Monitoring, Indirect Nanoplasmonic Sensing, and Vibrational Sum Frequency Spectroscopic Monitoring of Alkanethiol-Protected Copper Corrosion. Langmuir 2013, 29, 7151–7161. [Google Scholar] [CrossRef] [PubMed]
  151. Odlyha, M.; Jakiela, S.; Bergsten, C.J.; Slater, J.M.; Niklasson, A.; Svensson, J.; Cavicchioli, A.; de Faria, D.; Thickett, D.; Grøntoft, T. Dosimetry for monitoring in organ pipes and in microclimate frames for paintings. In Metal 2010: Proceedings of the interim meeting of the ICOM-CC Metal Working Group, Charleston, CA, USA, 11-15 October 2010; Metal Working Group: Fairfield, OH, USA, 15 October 2010; pp. 321–326. [Google Scholar]
  152. Odlyha, M.; Slater, J.M.; Grøntoft, T.; Jakiela, S.; Obarzanowski, M.; Thickett, D.; Hackney, S.; Andrade, G.; Wadum, J.; Christensen, A.H. A Portable Tool for the Evaluation of Microclimate Conditions within Museum Enclosures, Transit Frames, and Transport Cases. Stud. Conserv. 2018, 63, 407–410. [Google Scholar] [CrossRef]
  153. Agbota, H.; Mitchell, J.E.; Odlyha, M.; Strlič, M. Remote assessment of cultural heritage environments with wireless sensor array networks. Sensors 2014, 14, 8779–8793. [Google Scholar] [CrossRef] [PubMed] [Green Version]
  154. OnGuard Smart. Available online: https://www.purafil.com/products/monitoring/active-monitoring/onguard-smart/ (accessed on 21 December 2021).
  155. OnGuard Lite. Available online: https://www.purafil.com/products/monitoring/active-monitoring/onguard-lite/ (accessed on 21 December 2021).
  156. ACM—Atmospheric Corrosivity Monitor. Available online: https://www.bryair.com/products-solutions/gas-phase-filtration-systems/acm-atmospheric-corrosivity-monitor/ (accessed on 21 December 2021).
  157. He, Y.L.; McLaughlin, S.; Lo, J.S.H.; Shi, C.; Lenos, J.; Vincelli, A. Radio frequency identification (RFID) based corrosion monitoring sensors Part 1-Component selection and testing. Corros. Eng. Sci. Technol. 2015, 50, 63–71. [Google Scholar] [CrossRef]
  158. Alamin, M.; Tian, G.Y.; Andrews, A.; Jackson, P. Corrosion detection using low-frequency RFID technology. Insight 2012, 54, 72–75. [Google Scholar] [CrossRef]
  159. Zhang, J.; Tian, G.Y.; Marindra, A.M.J.; Sunny, A.I.; Zhao, A.B. A Review of Passive RFID Tag Antenna-Based Sensors and Systems for Structural Health Monitoring Applications. Sensors 2017, 17, 265. [Google Scholar] [CrossRef]
  160. Dante, J.F.; Steiner, A.; Friedersdorf, F. RF system for corrosivity monitoring. In Proceedings of the CORROSION, New Orleans, LO, USA, 16 March 2008. [Google Scholar]
  161. Dante, J.F.; Friedersdorf, F.; Innovations, L. Low-Cost Wireless Corrosivity Sensors. In Proceedings of the 2007 Tri-Service Corrosion Conference, Denver, CO, USA, 3–7 December 2007. [Google Scholar]
  162. He, Y.L.; McLaughlin, S.; Lo, J.S.H.; Shi, C.; Lenos, J.; Vincelli, A. Radio frequency identification (RFID) based corrosion monitoring sensors Part 2-Application and testing of coating materials. Corros. Eng. Sci. Technol. 2014, 49, 695–704. [Google Scholar] [CrossRef]
  163. He, Y.L. Wireless Corrosion Monitoring Sensors Based on Electromagnetic Interference Shielding of RFID Transponders. Corrosion 2020, 76, 411–423. [Google Scholar] [CrossRef] [Green Version]
  164. Yasri, M.; Gallee, F.; Leseop, B.; Diler, E.; Thierry, D.; Rioual, S. Passive Wireless Sensor for Atmospheric Corrosion Monitoring. In Proceedings of the 8th Eurntennas and Opean Conference on Antennas and Propagation (EuCAP 2014), The Hague, The Netherlands, 6–11 April 2014; pp. 2945–2949. [Google Scholar]
  165. Yasri, M.; Khalifeh, R.; Lescop, B.; Gallée, F.; Diler, E.; Thierry, D.; Rioual, S. Development of environmental sensors for monitoring of corrosion in marine offshore and wind energy industries. In Proceedings of the 2014 IEEE Sensor Systems for a Changing Ocean (SSCO), Brest, France, 13–17 October 2014; pp. 1–4. [Google Scholar]
  166. Khalifeh, R.; Yasri, M.S.; Lescop, B.; Gallee, F.; Diler, E.; Thierry, D.; Rioual, S. Development of Wireless and Passive Corrosion Sensors for Material Degradation Monitoring in Coastal Zones and Immersed Environment. IEEE J. Ocean. Eng. 2016, 41, 776–782. [Google Scholar] [CrossRef]
  167. Yasri, M.; Lescop, B.; Diler, E.; Gallee, F.; Thierry, D.; Rioual, S. Monitoring uniform and localised corrosion by a radiofrequency sensing method. Sens. Actuators B Chem. 2018, 257, 988–992. [Google Scholar] [CrossRef]
  168. Alamin, M. Passive Low Frequencey RFID for Detection and Monitoring of Corrosion under Paint and Insulation; Newcastle University: Newcastle upon Tyne, UK, 2014. [Google Scholar]
  169. Sunny, A.I.; Tian, G.Y.; Zhang, J.; Pal, M. Low frequency (LF) RFID sensors and selective transient feature extraction for corrosion characterisation. Sens. Actuators A Phys. 2016, 241, 34–43. [Google Scholar] [CrossRef] [Green Version]
  170. Zhang, H.; Tian, G.Y.; Simm, A.; Alamin, M. Electromagnetic Methods for Corrosion under Paint Coating Measurement. In Proceedings of the Eighth International Symposium on Precision Engineering Measurements and Instrumentation, Chengdu, China, 8–11 August 2012; Volume 2013, p. 8759. [Google Scholar] [CrossRef]
  171. Zhang, H.; Yang, R.Z.; He, Y.Z.; Tian, G.Y.; Xu, L.X.; Wu, R.K. Identification and characterisation of steel corrosion using passive high frequency RFID sensors. Measurement 2016, 92, 421–427. [Google Scholar] [CrossRef]
  172. Zhang, J.; Tian, G.Y. UHF RFID Tag Antenna-Based Sensing for Corrosion Detection & Characterization Using Principal Component Analysis. IEEE Trans. Antennas Propag. 2016, 64, 4405–4414. [Google Scholar] [CrossRef]
  173. Zhao, A.B.; Zhang, J.; Tian, G.Y. Miniaturization of UHF RFID Tag Antenna Sensors for Corrosion Characterization. IEEE Sens. J. 2017, 17, 7908–7916. [Google Scholar] [CrossRef]
  174. Annamdas, K.K.K.; Annamdas, V.G.M. Review on Developments in Fiber Optical Sensors and Applications. Int. J. Mater. Eng. 2011, 1, 1–16. [Google Scholar] [CrossRef] [Green Version]
  175. Sabri, N.; Aljunid, S.A.; Salim, M.S.; Ahmad, R.B.; Kamaruddin, R. Toward Optical Sensors: Review and Applications. In Proceedings of the 2013 International Conference on Science & Engineering in Mathematics, Chemistry and Physics (Scietech 2013), Jakarta, Indonesia, 24–25 January 2013; p. 423. [Google Scholar] [CrossRef]
  176. Luo, D.; Li, J.N.; Li, Y.Y. A Review of Fiber-optic Corrosion Sensor in Civil Engineering. In Proceedings of the 6th International Conference on Computer-Aided Design, Manufacturing, Modeling and Simulation (Cdmms 2018), Busan, South Korea, 14–15 April 2018; p. 1967. [Google Scholar] [CrossRef]
  177. Qi, X.; J Gelling, V. A review of different sensors applied to corrosion detection and monitoring. Recent Pat. Corros. Sci. 2011, 1, 1–7. [Google Scholar] [CrossRef]
  178. Leung, C.K.Y.; Wan, K.T.; Chen, L. A novel optical fiber sensor for steel corrosion in concrete structures. Sensors 2008, 8, 1960–1976. [Google Scholar] [CrossRef] [Green Version]
  179. Wan, K.T.; Leung, C.K.Y. Durability Tests of a Fiber Optic Corrosion Sensor. Sensors 2012, 12, 3656–3668. [Google Scholar] [CrossRef]
  180. Dong, S.Y.; Liao, Y.B.; Tian, Q.; Luo, Y.N.; Qiu, Z.G.; Song, S.Z. Optical and electrochemical measurements for optical fibre corrosion sensing techniques. Corros. Sci. 2006, 48, 1746–1756. [Google Scholar] [CrossRef]
  181. Dong, S.Y.; Peng, G.D.; Luo, Y.N. Preparation techniques of metal clad fibres for corrosion monitoring of steel materials. Smart Mater. Struct. 2007, 16, 733–738. [Google Scholar] [CrossRef]
  182. Qiao, G.F.; Zhou, Z.; Ou, J.P. Thin Fe-C alloy solid film based fiber optic corrosion sensor. In Proceedings of the 2006 1st Ieee International Conference on Nano/Micro Engineered and Molecular Systems, Vols 1–3, Zhuhai, China, 18–21 June 2006; p. 541. [Google Scholar] [CrossRef]
  183. Wang, Y.; Huang, H. Optical fiber corrosion sensor based on laser light reflection. Smart Mater. Struct. 2011, 20, 085003. [Google Scholar] [CrossRef]
  184. Khorsandi, A.; Shojaei, S.; Hosseinibalam, F. Second-harmonic laser-coupled optical fiber sensor for pH measurement and corrosion detection based on evanescent field absorption. Opt. Laser Technol. 2012, 44, 1564–1569. [Google Scholar] [CrossRef]
  185. Deng, F.; Huang, Y.; Azarmi, F. Corrosion Behavior Evaluation of Coated Steel Using Fiber Bragg Grating Sensors. Coatings 2019, 9, 55. [Google Scholar] [CrossRef] [Green Version]
  186. Geng, J.; Wu, J.; Zhao, X.M. Application of Fiber Bragg Grating Sensor for Rebar Corrosion. Second Int. Conf. Smart Mater. Nanotechnol. Eng. 2009, 7493, 749333. [Google Scholar] [CrossRef]
  187. Hu, W.B.; Cai, H.L.; Yang, M.H.; Tong, X.L.; Zhou, C.M.; Chen, W. Fe-C-coated fibre Bragg grating sensor for steel corrosion monitoring. Corros. Sci. 2011, 53, 1933–1938. [Google Scholar] [CrossRef]
  188. Tan, C.H.; Shee, Y.G.; Yap, B.K.; Adikan, F.R.M. Fiber Bragg grating based sensing system: Early corrosion detection for structural health monitoring. Sens. Actuators A Phys. 2016, 246, 123–128. [Google Scholar] [CrossRef]
  189. Tan, C.H.; Adikan, F.R.M.; Shee, Y.G.; Yap, B.K. Non-destructive fiber Bragg grating based sensing system: Early corrosion detection for structural health monitoring. Sens. Actuators A Phys. 2017, 268, 61–67. [Google Scholar] [CrossRef]
  190. Chen, Y.Z.; Tang, F.J.; Bao, Y.; Tang, Y.; Chen, G.D. A Fe-C coated long-period fiber grating sensor for corrosion-induced mass loss measurement. Opt. Lett. 2016, 41, 2306–2309. [Google Scholar] [CrossRef] [PubMed]
  191. Chen, Y.Z.; Tang, F.J.; Tang, Y.; O'Keefe, M.J.; Chen, G.D. Mechanism and sensitivity of Fe-C coated long period fiber grating sensors for steel corrosion monitoring of RC structures. Corros. Sci. 2017, 127, 70–81. [Google Scholar] [CrossRef]
  192. Huang, Y.; Gao, Z.; Chen, G.D.; Xiao, H. Long period fiber grating sensors coated with nano iron/silica particles for corrosion monitoring. Smart Mater. Struct. 2013, 22, 075018. [Google Scholar] [CrossRef]
  193. Huang, Y.; Tang, F.J.; Liang, X.; Chen, G.D.; Xiao, H.; Azarmi, F. Steel bar corrosion monitoring with long-period fiber grating sensors coated with nano iron/silica particles and polyurethane. Struct. Health Monit. Int. J. 2015, 14, 178–189. [Google Scholar] [CrossRef]
  194. Ahmed, R.; Rifat, A.A.; Yetisen, A.K.; Salem, M.S.; Yun, S.H.; Butt, H. Optical microring resonator based corrosion sensing. Rsc. Adv. 2016, 6, 56127–56133. [Google Scholar] [CrossRef]
  195. Strebl, M.; Bruns, M.; Virtanen, S. Editors' Choice-Respirometric in Situ Methods for Real-Time Monitoring of Corrosion Rates: Part I. Atmospheric Corrosion. J. Electrochem. Soc. 2020, 167, 021510. [Google Scholar] [CrossRef]
  196. Stratmann, M.; Streckel, H. On the atmospheric corrosion of metals which are covered with thin electrolyte layers—II. Experimental results. Corros. Sci. 1990, 30, 697–714. [Google Scholar] [CrossRef]
  197. Strebl, M.; Virtanen, S. Real-Time Monitoring of Atmospheric Magnesium Alloy Corrosion. J. Electrochem. Soc. 2018, 166, C3001–C3009. [Google Scholar] [CrossRef]
  198. Strebl, M.; Virtanen, S. New Method for Monitoring Hydrogen Evolution of Magnesium Alloys Under Atmospheric Exposure. In Proceedings of the ECS Meeting Abstracts, 232nd ECS Meeting, National Harbor, MD, USA, 1–5 October 2017; p. 721. [Google Scholar]
  199. Matthiesen, H. A novel method to determine oxidation rates of heritage materials in vitro and in situ. Stud. Conserv. 2007, 52, 271–280. [Google Scholar] [CrossRef]
  200. Matthiesen, H.; Wonsyld, K. In situ measurement of oxygen consumption to estimate corrosion rates. In Corrosion of Archaeological and Heritage Artefacts EFC 45; Routledge: London, UK, 2017; pp. 350–356. [Google Scholar]
  201. Matthiesen, H.; Stemann-Petersen, K. A fast and non-destructive method to document and quantify the efficiency of metals conservation. In Proceedings of the Metal 2013: Interim Meeting of the ICOM-CC Metal Working Group, Edinburgh, Scotland, 16–20 September 2013; pp. 16–20. [Google Scholar]
  202. Watkinson, D.; Rimmer, M. Quantifying Effectiveness of Chloride Desalination Treatments for Archaeological Iron Using Oxygen Measurement. In Proceedings of the Metal 2013: Interim Meeting of the ICOM-CC Metal Working Group, Edinburg, Schotland, 16–20 September 2013; pp. 95–102. [Google Scholar]
  203. Watkinson, D.; Emmerson, N.; Seifert, J. Matching Display Relative Humidity to Corrosion Rate: Quantitative Evidence for Marine Cast Iron Cannon Balls. In Proceedings of the Interim Meeting of the ICOM-CC Metals Working Group, New Delhi, India, 26–30 September 2016; pp. 195–202. [Google Scholar]
  204. Watkinson, D.E.; Rimmer, M.B.; Emmerson, N.J. The influence of relative humidity and intrinsic chloride on post-excavation corrosion rates of archaeological wrought iron. Stud. Conserv. 2019, 64, 456–471. [Google Scholar] [CrossRef]
  205. Emmerson, N.J.; Watkinson, D.E. Surface preparation of historic wrought iron: Evidencing the requirement for standardisation. Mater. Corros. 2016, 67, 176–189. [Google Scholar] [CrossRef]
  206. Watkinson, D.; Emmerson, N. The impact of aqueous washing on the ability of βFeOOH to corrode iron. Environ. Sci. Pollut. Res. 2017, 24, 2138–2149. [Google Scholar] [CrossRef] [PubMed] [Green Version]
  207. Emmerson, N.; Seifert, J.; Watkinson, D. Refining the use of oxygen consumption as a proxy corrosion rate measure for archaeological and historic iron. Eur. Phys. J. Plus 2021, 136, 546. [Google Scholar] [CrossRef]
  208. Virtanen, S. Novel in-Situ Methods for Real-Time Monitoring of Corrosion. In Proceedings of the ECS Meeting Abstracts, PRiME 2020 (ECS, ECSJ & KECS Joint Meeting, Online, 4–9 October 2020; p. 1279. [Google Scholar]
  209. Garcia-Ochoa, E.; Gonzalez-Sanchez, J.; Corvo, F.; Usagawa, Z.; Dzib-Peerez, L.; Castaneda, A. Application of electrochemical noise to evaluate outdoor atmospheric corrosion of copper after relatively short exposure periods. J. Appl. Electrochem. 2008, 38, 1363–1368. [Google Scholar] [CrossRef]
  210. Jamali, S.S.; Zhao, Y.; Gao, Z.M.; Li, H.J.; Hee, A.C. In situ evaluation of corrosion damage using non-destructive electrochemical measurements - A case study. J. Ind. Eng. Chem. 2016, 43, 36–43. [Google Scholar] [CrossRef]
Figure 1. Carbon steel/silver ACM sensor used by Mizuno et al. [21]. Reprinted from Corrosion science, 83, Mizuno, D., Suzuki, S., Fujita, S., Hara, N. Corrosion monitoring and materials selection for automotive environments by using Atmospheric Corrosion Monitor (ACM) sensor, 217–225, copyright 2014, with permission from Elsevier.
Metals 12 00171 g001
Figure 2. Schematic representation of the ACM sensor used by Pei et al. [23]. Reprinted from Corrosion science, 1770, Pei, Z.B., Zhang, D.W., Zhi, Y.J., Yang, T., Jin, L.L., Fu, D.M., Cheng, X.Q., Terryn, H.A., Mol, J.M.C., Li, X.G., Towards understanding and prediction of atmospheric corrosion of an Fe/Cu corrosion sensor via machine learning, Open Access.
Metals 12 00171 g002
Figure 3. Schematic representation of EN measurement using ZRA mode; I-out is current output [28]; Reprinted from Measurement, 138, Ma, C., Behnamian, Y., Gao, Z., Wu, Z., Qin, Z., Xia, D.-H., Measuring atmospheric corrosion with electrochemical noise: A review of contemporary methods, 54–79, Copyright 2019, with permission from Elsevier.
Metals 12 00171 g003
Figure 4. A schematic representation of the TFER sensors with (a) a single-line pattern and (b) a multi-line pattern [3]. Reprinted from Sensors and Actuators B-Chemical, 120, Li, S., Kim, Y.G., Jung, S., Song, H.S., Lee, S.M. Application of steel thin film electrical resistance sensor for in situ corrosion monitoring, 368–377, copyright 2007, with permission from Elsevier.
Metals 12 00171 g004
Figure 5. AirCorr ER sensor. Current (I) passes through two terminal circuit contacts and the voltage is measured between two other spots on the sensing (Vsens) and reference (Vref) parts [103]. Reprinted from Corrosion Science, 87, Prosek, T., Taube, M., Dubois, F., Thierry, D. Application of automated electrical resistance sensors for measurement of corrosion rate of copper, bronze and iron in model indoor atmospheres containing short-chain volatile carboxylic acids, 376–382, copyright 2014, with permission from Elsevier.
Metals 12 00171 g005
Figure 6. Schematic representation of quartz oscillator [136].
Metals 12 00171 g006
Figure 7. Schematic representation of RFID corrosion sensor proposed by Yasri et al. [164]; Rx is received signal and Tx is transmitted signal.
Metals 12 00171 g007
Table 1. Summary of studies applying real-time atmospheric corrosion monitoring.
TechniqueEnvironment *Sensing Metal **Range of Measured Corrosion Rates ***, [µm·a−1]ReferencesLocalised Corrosion Detection
ACM 1Outdoor exposuresFe1 × 10−1–1 × 10²[16,21,22,23,24,25,26,27,30]
ZnNot calculated[32]
ACTsFe1 × 102[20]
Laboratory testsFe1 × 101–1 × 10³[19,31]
Zn1 × 101–1 × 10³[19,31]
Cu1 × 101–1 × 10³[19]
Al1 × 101–1 × 10³[19]
EROutdoor exposuresFe1 × 10−1–1 × 10³[97,108,118][3,29,100]
Zn1 × 10−1–1 × 101[108]
Cu1 × 10−1–1 × 100[120]
ACTsFe1 × 101–1 × 10³[2,93,101,108,113,114,119]
Zn1 × 100–1 × 10³[2,93,101]
Cu1 × 103[2]
Al1 × 10−1–1 × 101[29]
Laboratory testsFe1 × 10−3–1 × 101[2,3,103]
Cu1 × 10−3–1 × 10⁻¹[2,4,98,103]
Ag1 × 10−3–1 × 101[4,98,117]
Zn1 × 100–1 × 10²[2]
Pb1 × 10−3–1 × 10²[109,110,112]
Indoor exposuresCu1 × 10−3–1 × 10⁻¹[4,94,102,104,115,125]
Ag1 × 10−3–1 × 10⁻¹[4,94,102,115,127]
Pb1 × 10−2–1 × 101[102,115,116]
EIS 2Outdoor exposuresFe1 × 10−1–1 × 101[47,69][89,91]
Cu1 × 102–1 × 10³[120]
ACTsFe1 × 102–1 × 10³[70]
Laboratory testsFe1 × 10−1–1 × 10⁴[45,48,50,52,71]
Zn-coated steel1 × 100–1 × 10³[56,57,58,59]
Zn1 × 101[44]
Cu1 × 10−1–1 × 101[43,64,120]
EN 3Outdoor exposuresFe1 × 10−1–1 × 101[89,90][89,90,91,209]
Cu1 × 10−2–1 × 10²[86,209]
QCM 4Laboratory testsCu1 × 10−1–1 × 100[147]
Ag1 × 10−3–1 × 10⁻²[141,142,143,144,145,146]
Indoor exposuresCu1 × 10−3–1 × 10⁻¹[102,138]
Ag1 × 10−2–1 × 10⁻¹[102,127,138]
Co1 × 10−2–1 × 10⁻¹[138]
RFIDACTsFe1 × 102–1 × 10³[157,163][95,167]
Laboratory testsZn1 × 101[95,166,167]
FOCS FeNo data for atmospheric corrosion
Respirometry 5Laboratory testsFe1 × 10−1–1 × 10²[200,205][195,197]
Cu1 × 10−2–1 × 10⁻¹[200]
Al1 × 10−1–1 × 100[195]
Mg1 × 101–1 × 10³[195,197]
* Outdoor exposures–field exposures outdoors; ACTs–standardised accelerated corrosion tests; Laboratory tests–non-standardised tests in laboratories, e.g., wetting/drying cycles, thin electrolyte layers application, increased T and RH, pre-contamination; Indoor exposures–exposures in real indoor environments. ** Symbols Fe, Al, Zn, Cu and Mg refer to both pure metals and their alloys. Zn-coated Fe refers to zinc-coated steels. *** For easy orientation, and as exact values of minimum and maximum detected corrosion rates are often not given in the studies, they are summarised in orders of magnitude of µm·a−1 here. 1 In reference [22], the lowest detectable Fe corrosion rate of 7.7 µm a−1 was calculated. 2 Rp−1 (Rct−1) evolution in time is commonly used as a corrosion indicator instead of calculated corrosion rate as Tafel slopes are not usually known for systems under investigation, as, for example, for corrosion monitoring of Fe [49,51,53,54,55], Zn and Zn-coated steel [60,61], Cu [42,49,63,147], Al [65,68] and Sn [57]. 3 More frequently, Rn, ECN and/or EPN evolution in time is used as a corrosion indicator instead of corrosion rate, as, for example, for corrosion monitoring of Fe [88,210] and Al [76,91]. 4 Mass gain in time is frequently presented as a direct measurement output instead of thickness loss in time, as, for example, for corrosion monitoring of Ag [138,141,142,143,144,145,146], Cu [138,139,147,150,153], Pb [151,152] and Fe [153]. 5 For pre-corroded historical iron artefacts, when the corrosion mechanism is not known, ORR rate cannot be re-calculated to corrosion rate and oxygen consumption is used as a corrosion indicator [199,201,202,203,204].
Table 2. Comparison of atmospheric corrosion monitoring techniques.
TechniqueCurrent ApplicationsPotential Fields of ApplicationSensitivity *Commercial SuppliersMain AdvantagesMain Drawbacks
CouponsIndoor and outdoor corrosivity classification according to standards
Verification of other techniques
Applicable in any environmentHigh at long exposure times, otherwise medium SeveralStandardised technique
Easy data interpretation
No real-time data
Time-consuming
ACMOutdoor monitoring
TOW assessment
Outdoor and indoor at higher RHMedium1Not sensitive to temperature fluctuations
Suitable for harsh outdoor environments
Corrosion acceleration due to galvanic coupling
Unclear data interpretation during rainfall
Electrolyte presence required
EISLaboratory tests at higher RH and under thin electrolyte layers
Assessment of protective coatings
Outdoor and indoor at higher RHMedium0Information about corrosion mechanism
Non-destructive assessment of coatings
Knowledge about investigated system needed for correct data interpretation
Electrolyte presence required
Unclear results under very thin electrolyte layers and in presence of thick corrosion products
ENOutdoor corrosion monitoringOutdoor and indoor at higher RHMedium0Localised corrosion detection
Corrosion mechanism determination
Complex and unclear interpretation
Electrolyte presence required
ERIndoor and outdoor corrosion monitoring, laboratory studies
Corrosivity classification
Applicable in any environmentHigh4Universal technique
High sensitivity
Easy operation and data interpretation
Optimal for uniform corrosion monitoring
Sensitive to temperature fluctuations
Limited possibilities in monitoring of non-uniform corrosion
QCMIndoor corrosivity classification
Laboratory tests
Indoor at lower corrosivityHigh2High sensitivity and short response time
Electrolyte presence not required
Sensitive to temperature fluctuations, moisture and pollutants presence
Not suitable for harsh environments
RFIDLaboratory testsOutdoor and indoor at higher corrosivityLow0Compact and wireless
Electrolyte presence not required
Further development needed
FOCSNone for atmospheric corrosionNot clear yet, as the technique is at the development stageNot available0Not known for atmospheric corrosion yet
RespirometryLaboratory testsNot clear yet, as the technique is at the development stageHigh0High sensitivity
Information about corrosion mechanism
Electrolyte presence not required
Sensitivity to RH, temperature and pressure fluctuations
Further development needed
* Low sensitivity–corrosion detection in high-corrosive outdoor environments. Medium sensitivity–detection of corrosion rate in an order of 10 µm·a−1 and higher corresponding to outdoor corrosivity. High sensitivity–detection of corrosion rate in an order of 1 × 10⁻³ µm·a−1 and higher corresponding to indoor corrosivity.
Publisher’s Note: MDPI stays neutral with regard to jurisdictional claims in published maps and institutional affiliations.

