
Influence of Partitioning Temperature on Microstructure and Mechanical Performance of Medium Manganese Fe-C-Mn-Cu-Cr-Mo-Nb Steel


Abstract
:1. Introduction
2. Experimental Materials and Methods
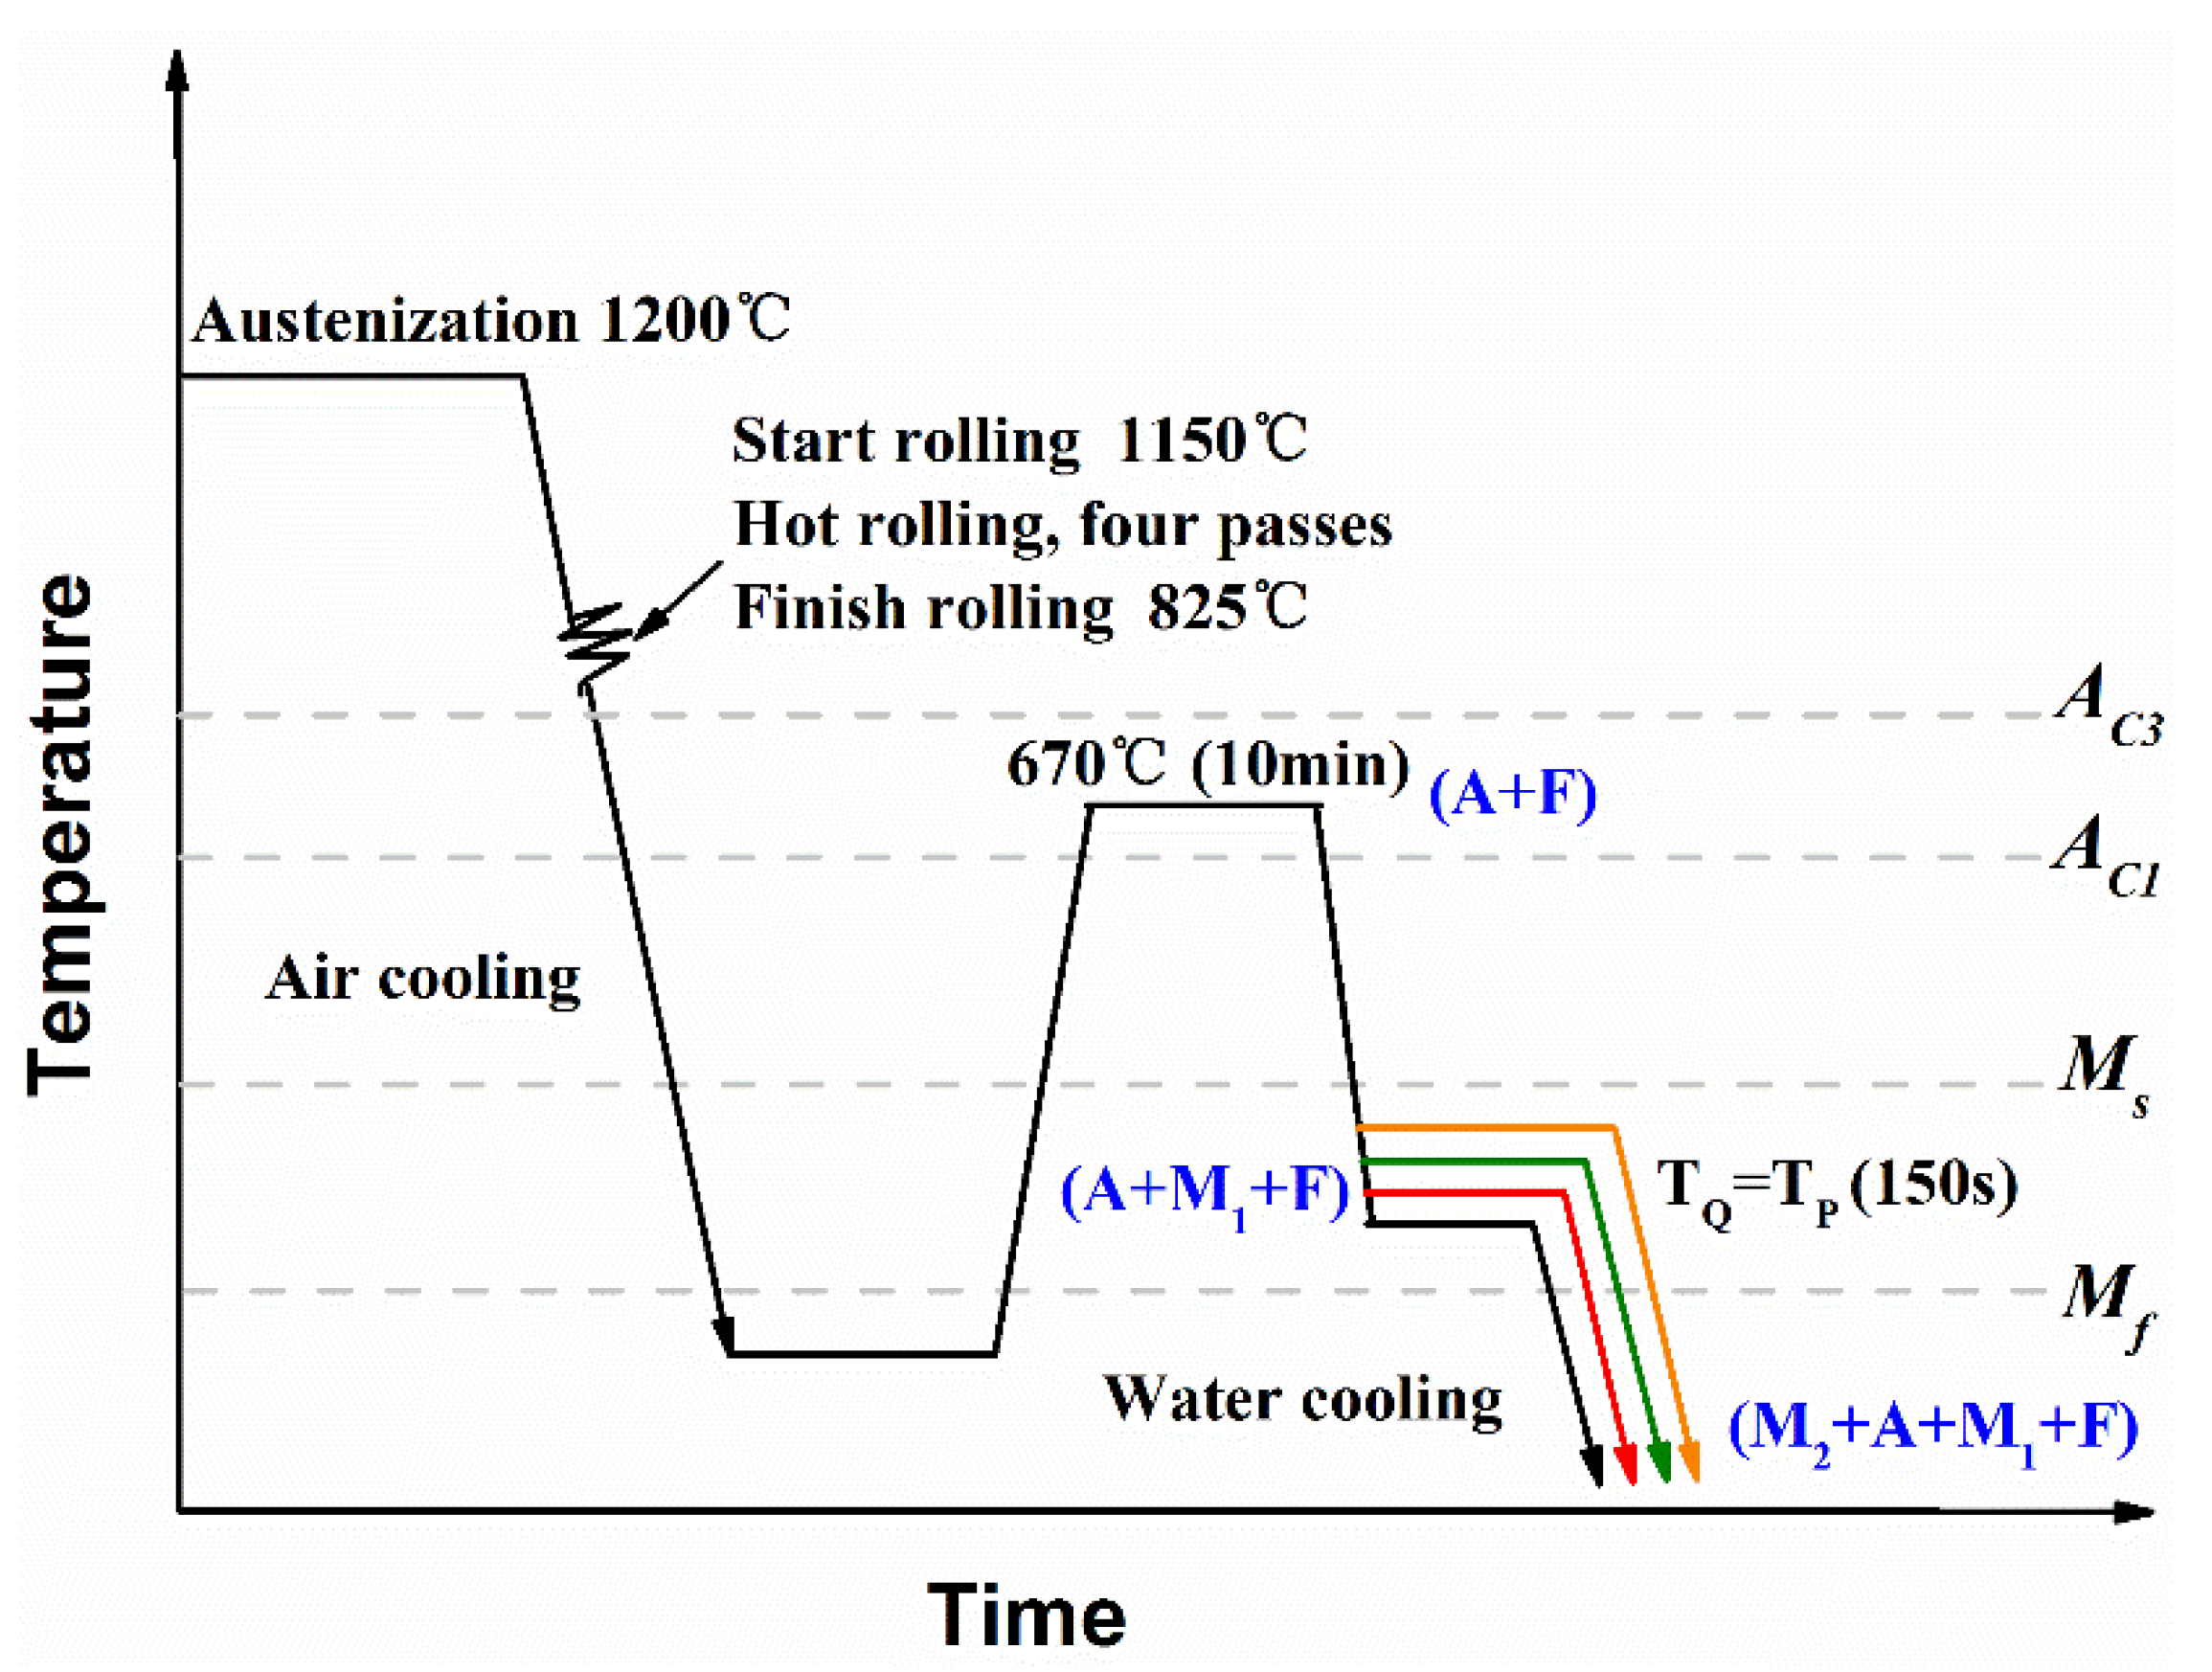
- (1)
- First, the sheets were heated at 670 °C between AC1 and AC3. They consisted of austenite (A) and ferrite (F);
- (2)
- Then, they were first quenched to temperatures between Ms and Mf (300 °C, 280 °C, 260 °C, 240 °C). The samples cut from the sheets were named P300, P280, P260, and P240, respectively. Some of the austenite was transformed into martensite (M1), and the rest was not transformed (the untransformed austenite). The sheets were kept in a salt bath furnace at the prescribed temperature for 150 s for partitioning;
- (3)
- Finally, the sheets were quenched to room temperature. Some stable carbon-rich untransformed austenite could be retained (RA), but some was not stable and was quenched to massive fresh martensite (M2).
3. Results and Discussion
4. Conclusions
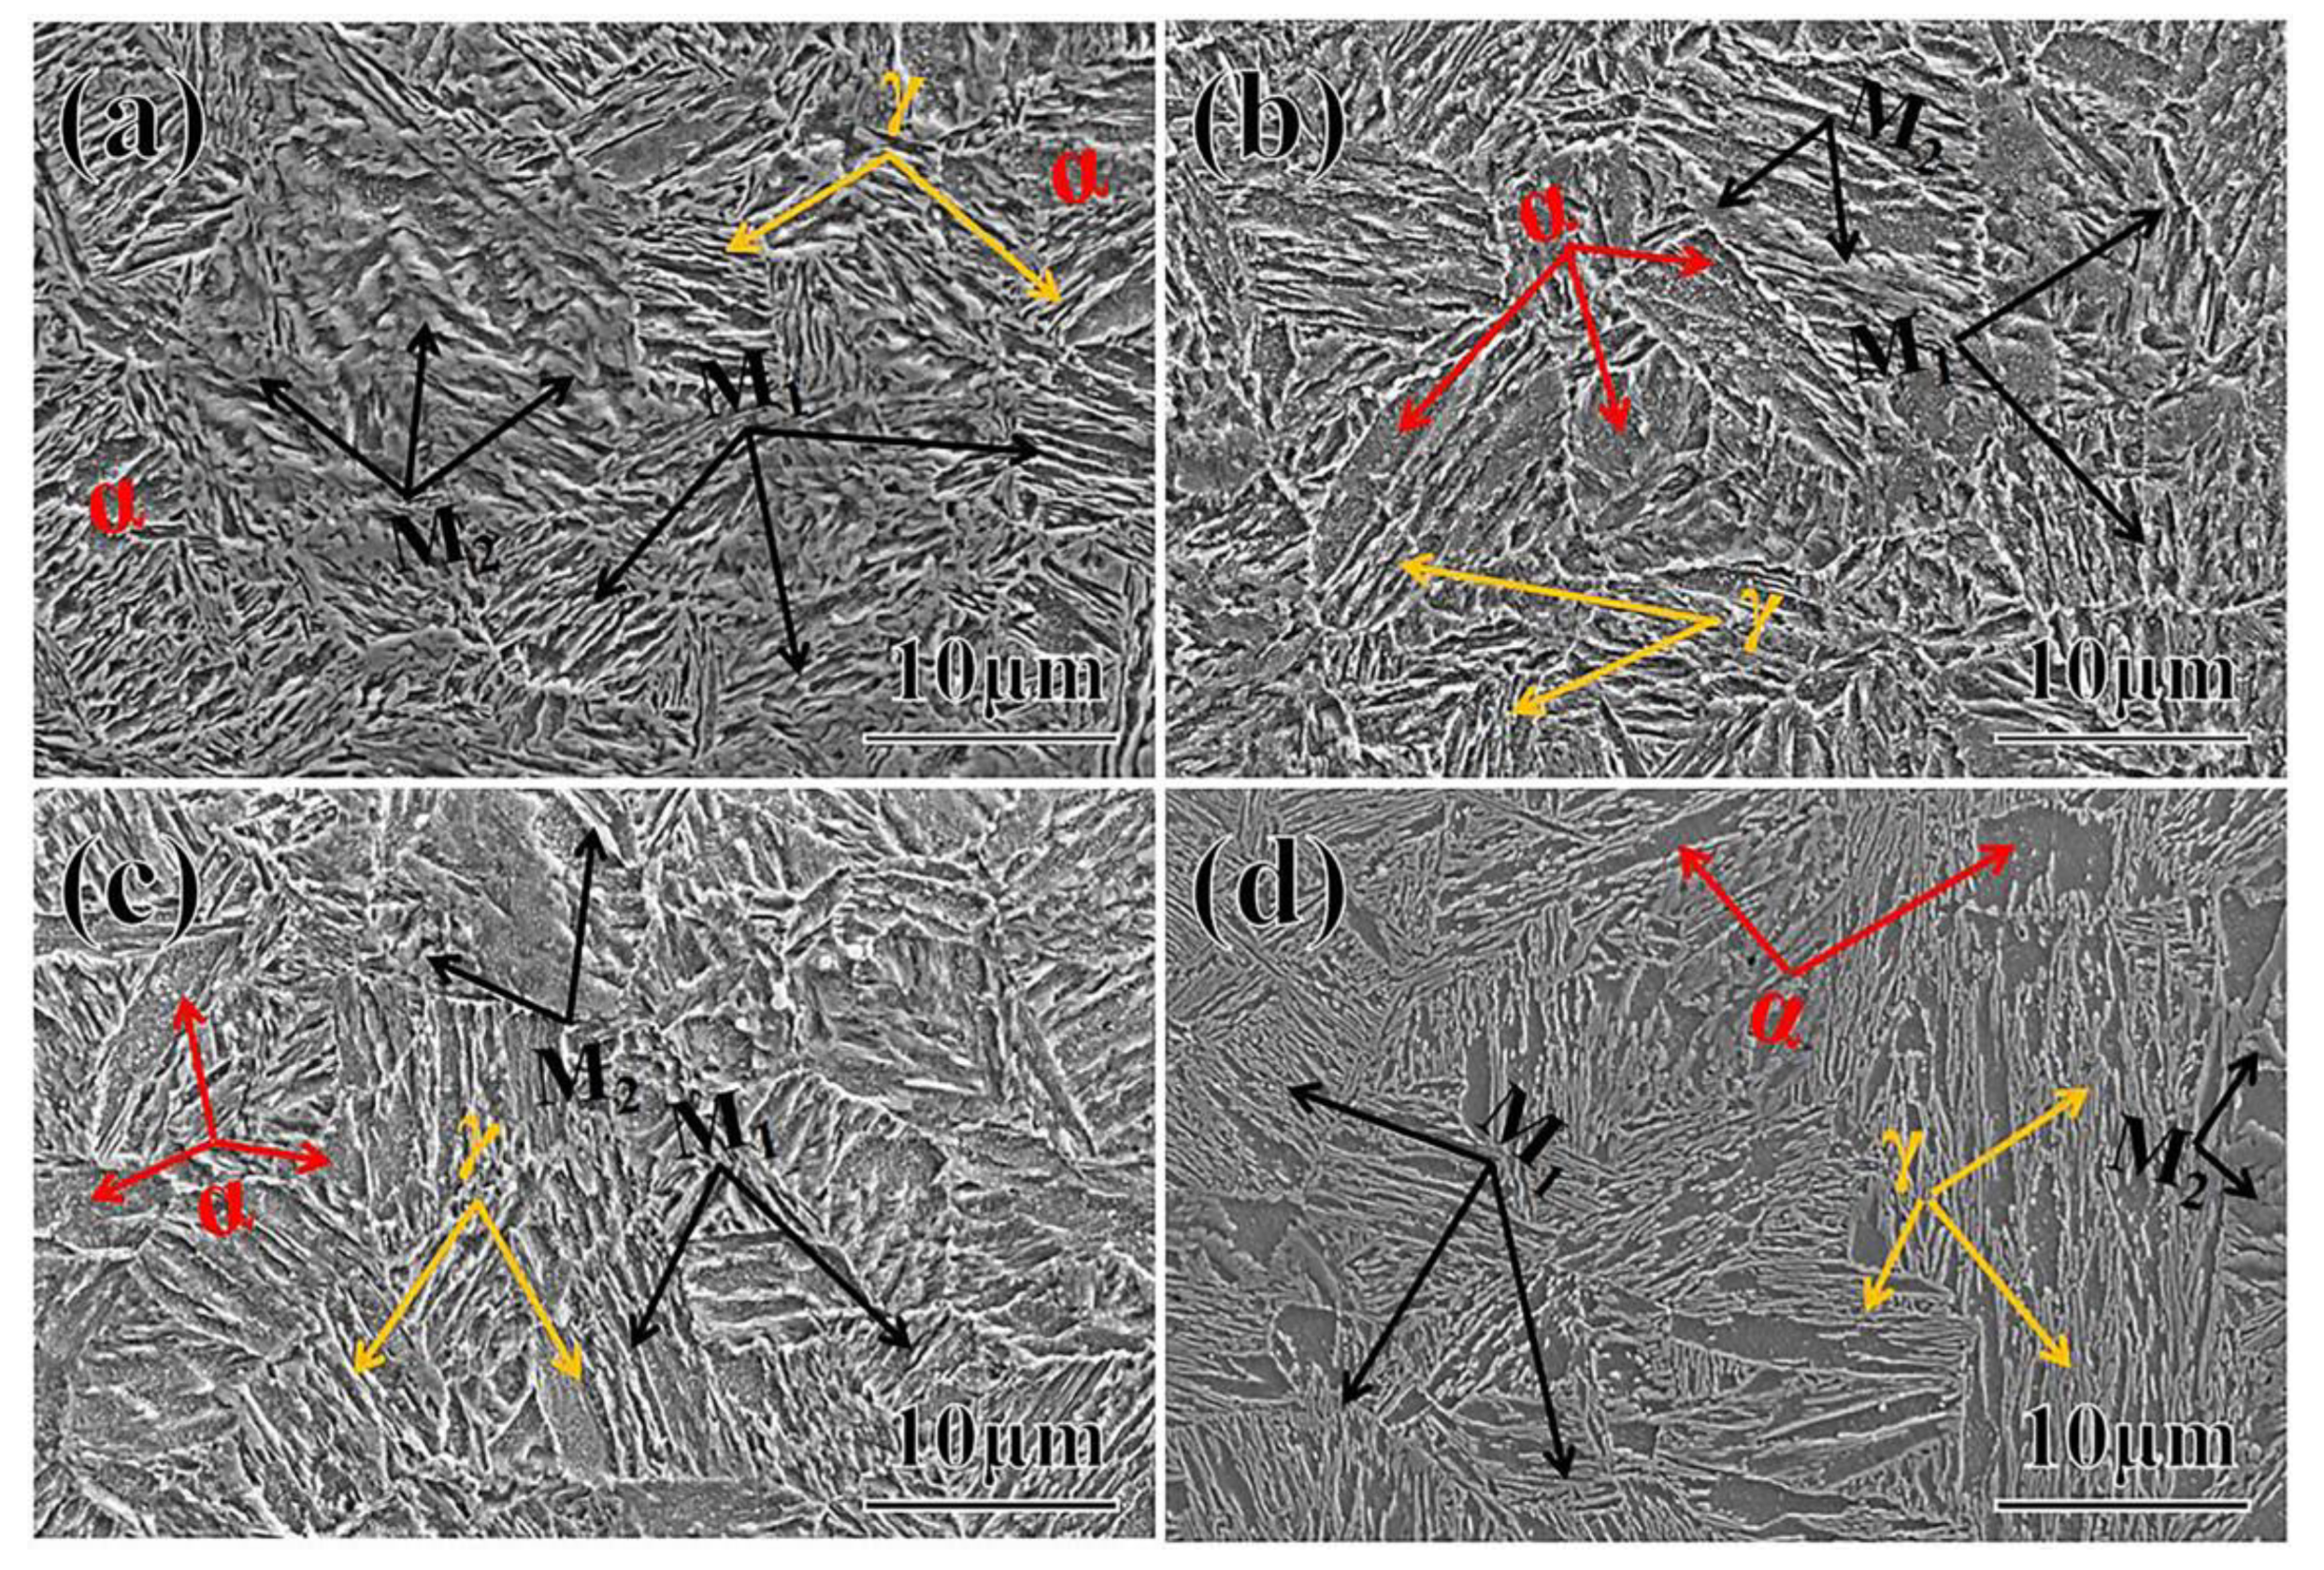
- (1)
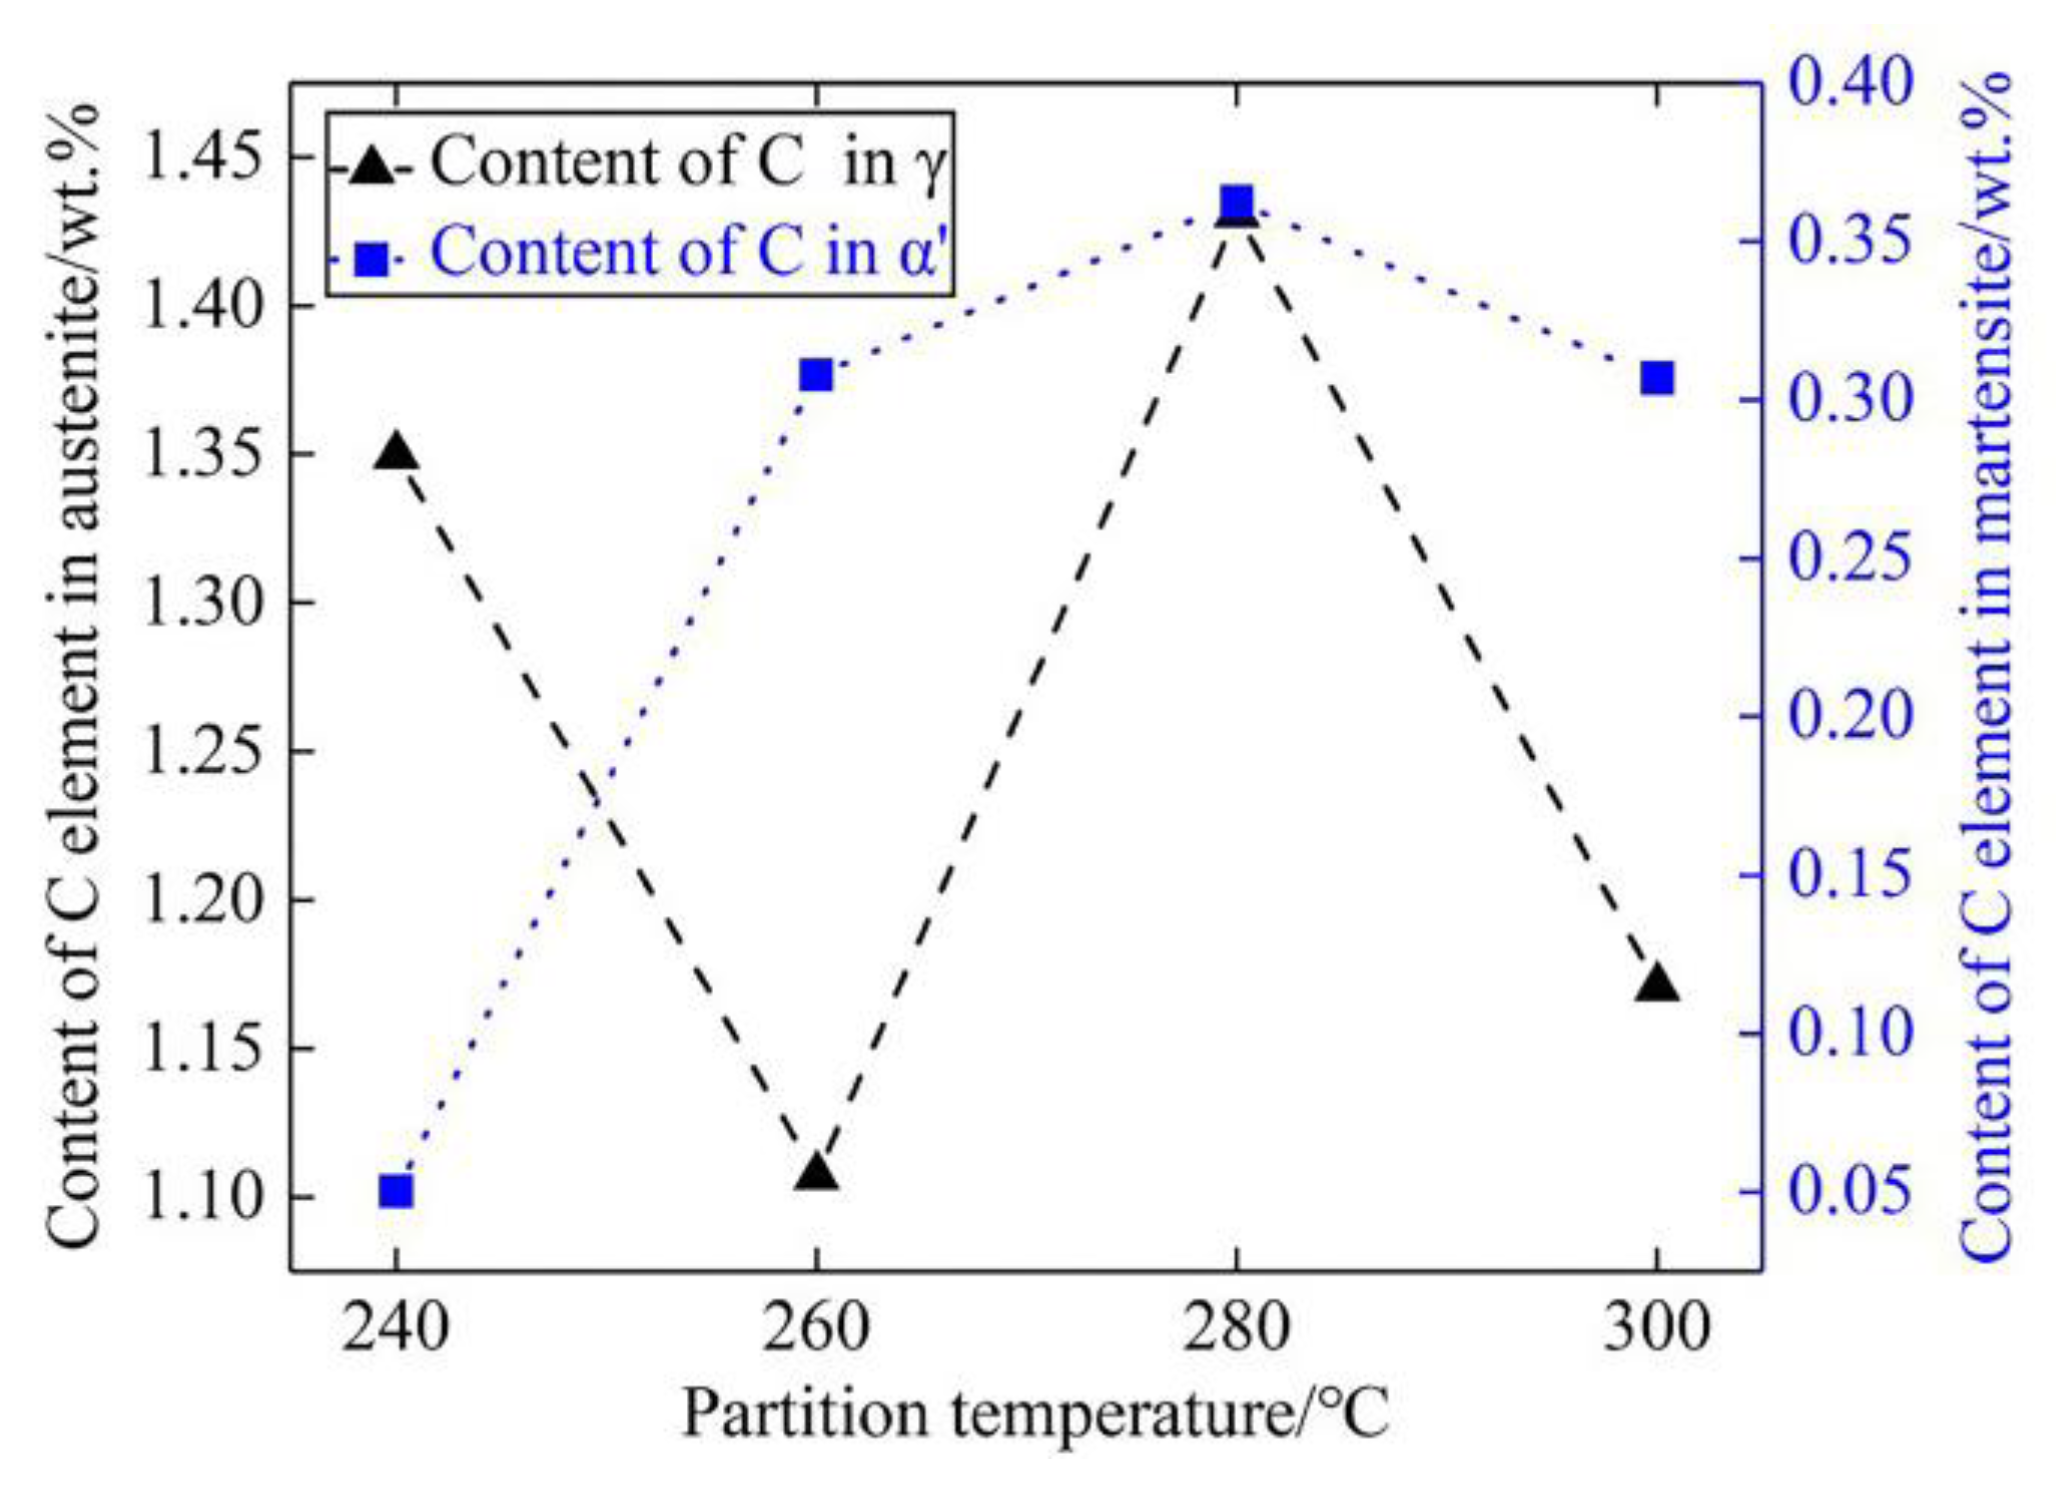
- When the partitioning temperature increased, the fractions of the fresh massive martensite (M2) increased, the fractions of the initial lath-like martensite (M1) decreased, and M1 became coarser. Meanwhile, the fractions of the thin lath-like retained austenite (RA) decreased, and the fractions of the block-shaped austenite increased. The fraction of retained austenite and its carbon content exhibited the opposite trend;
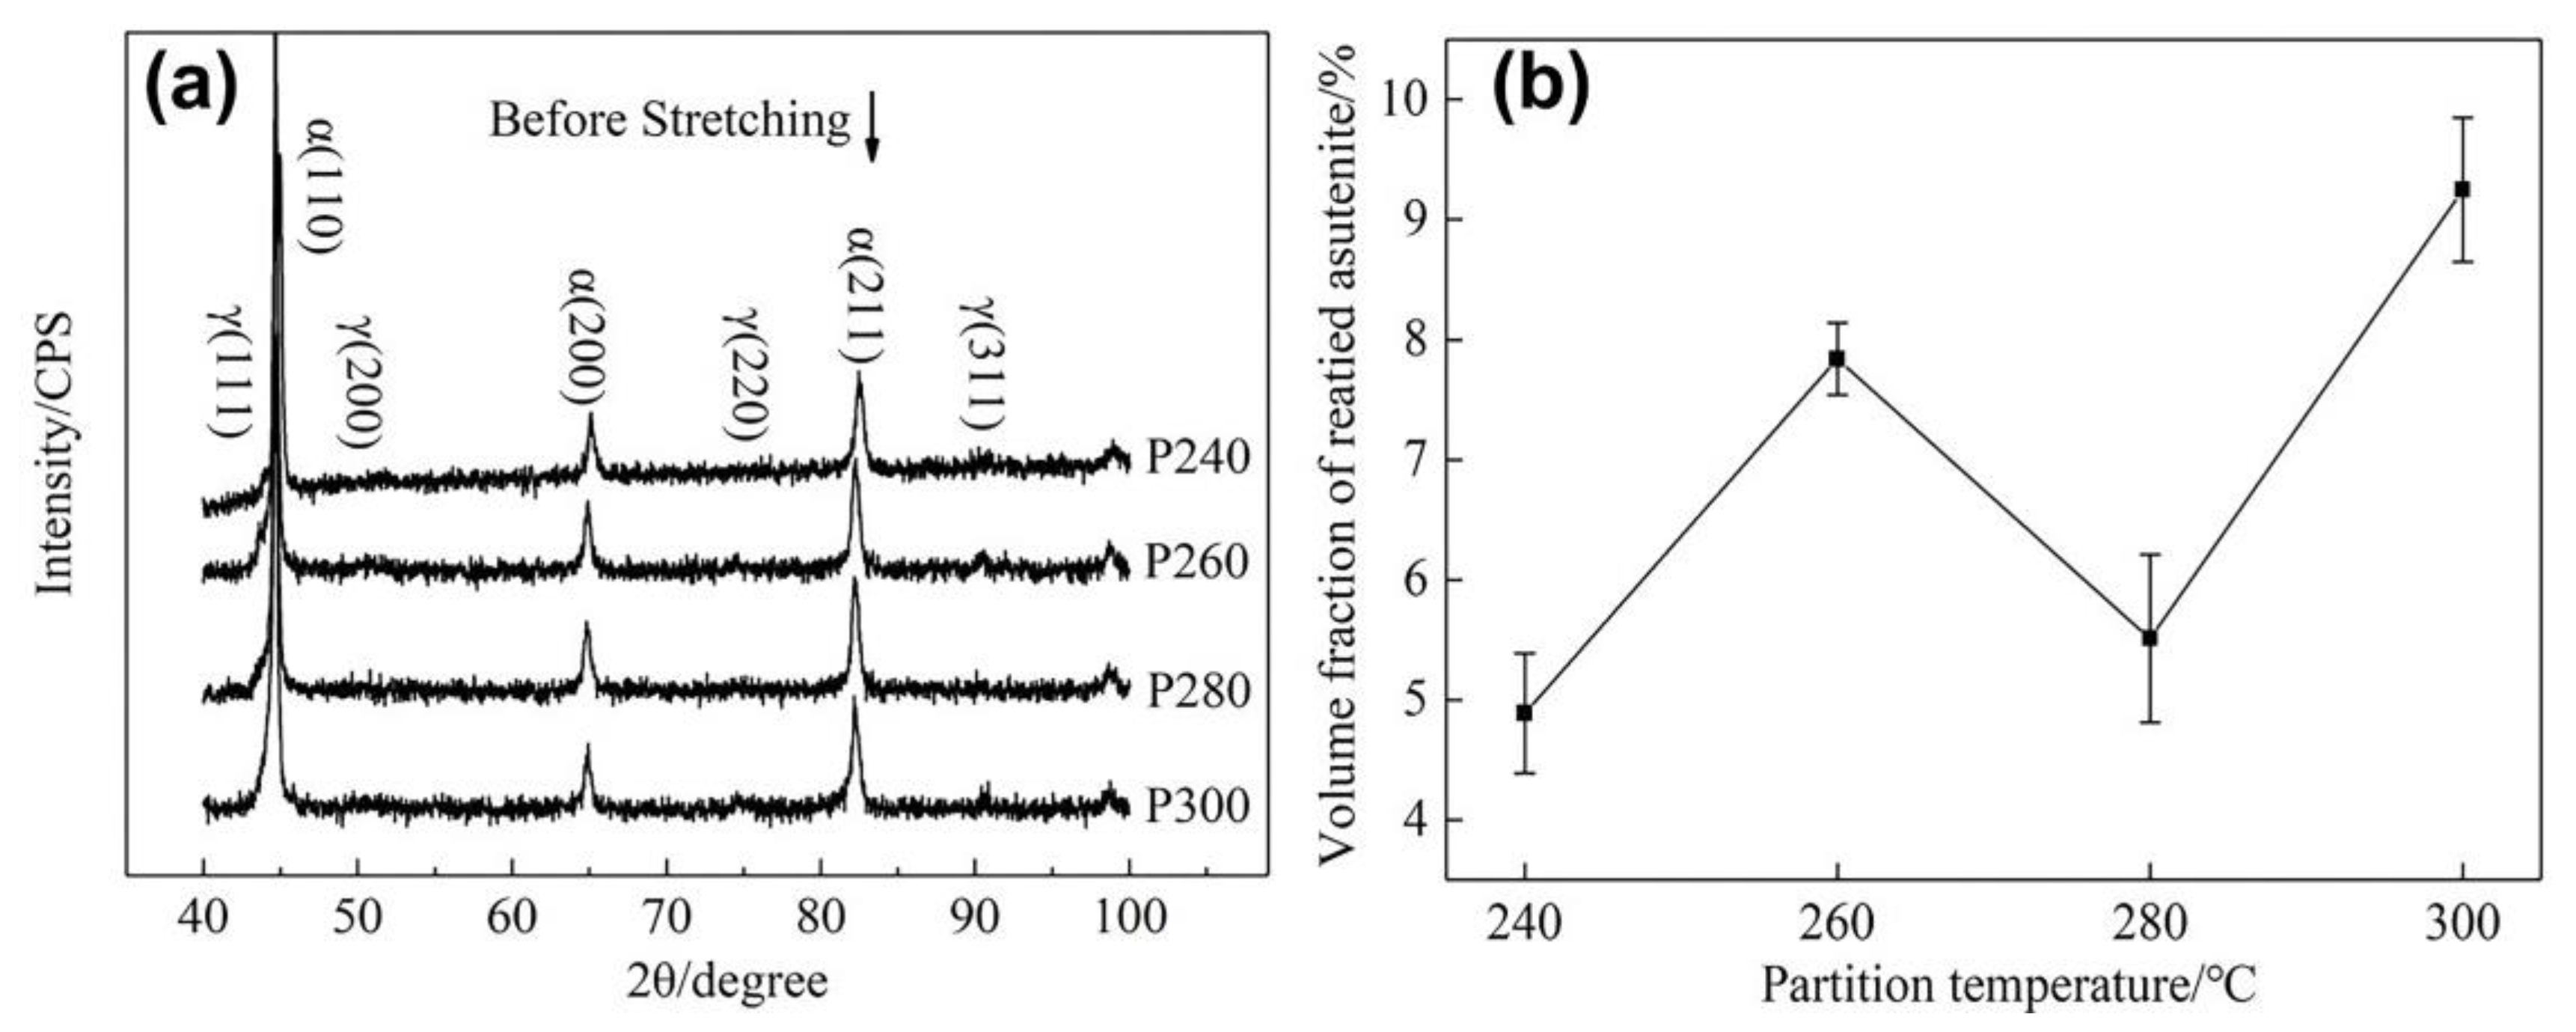
- (2)
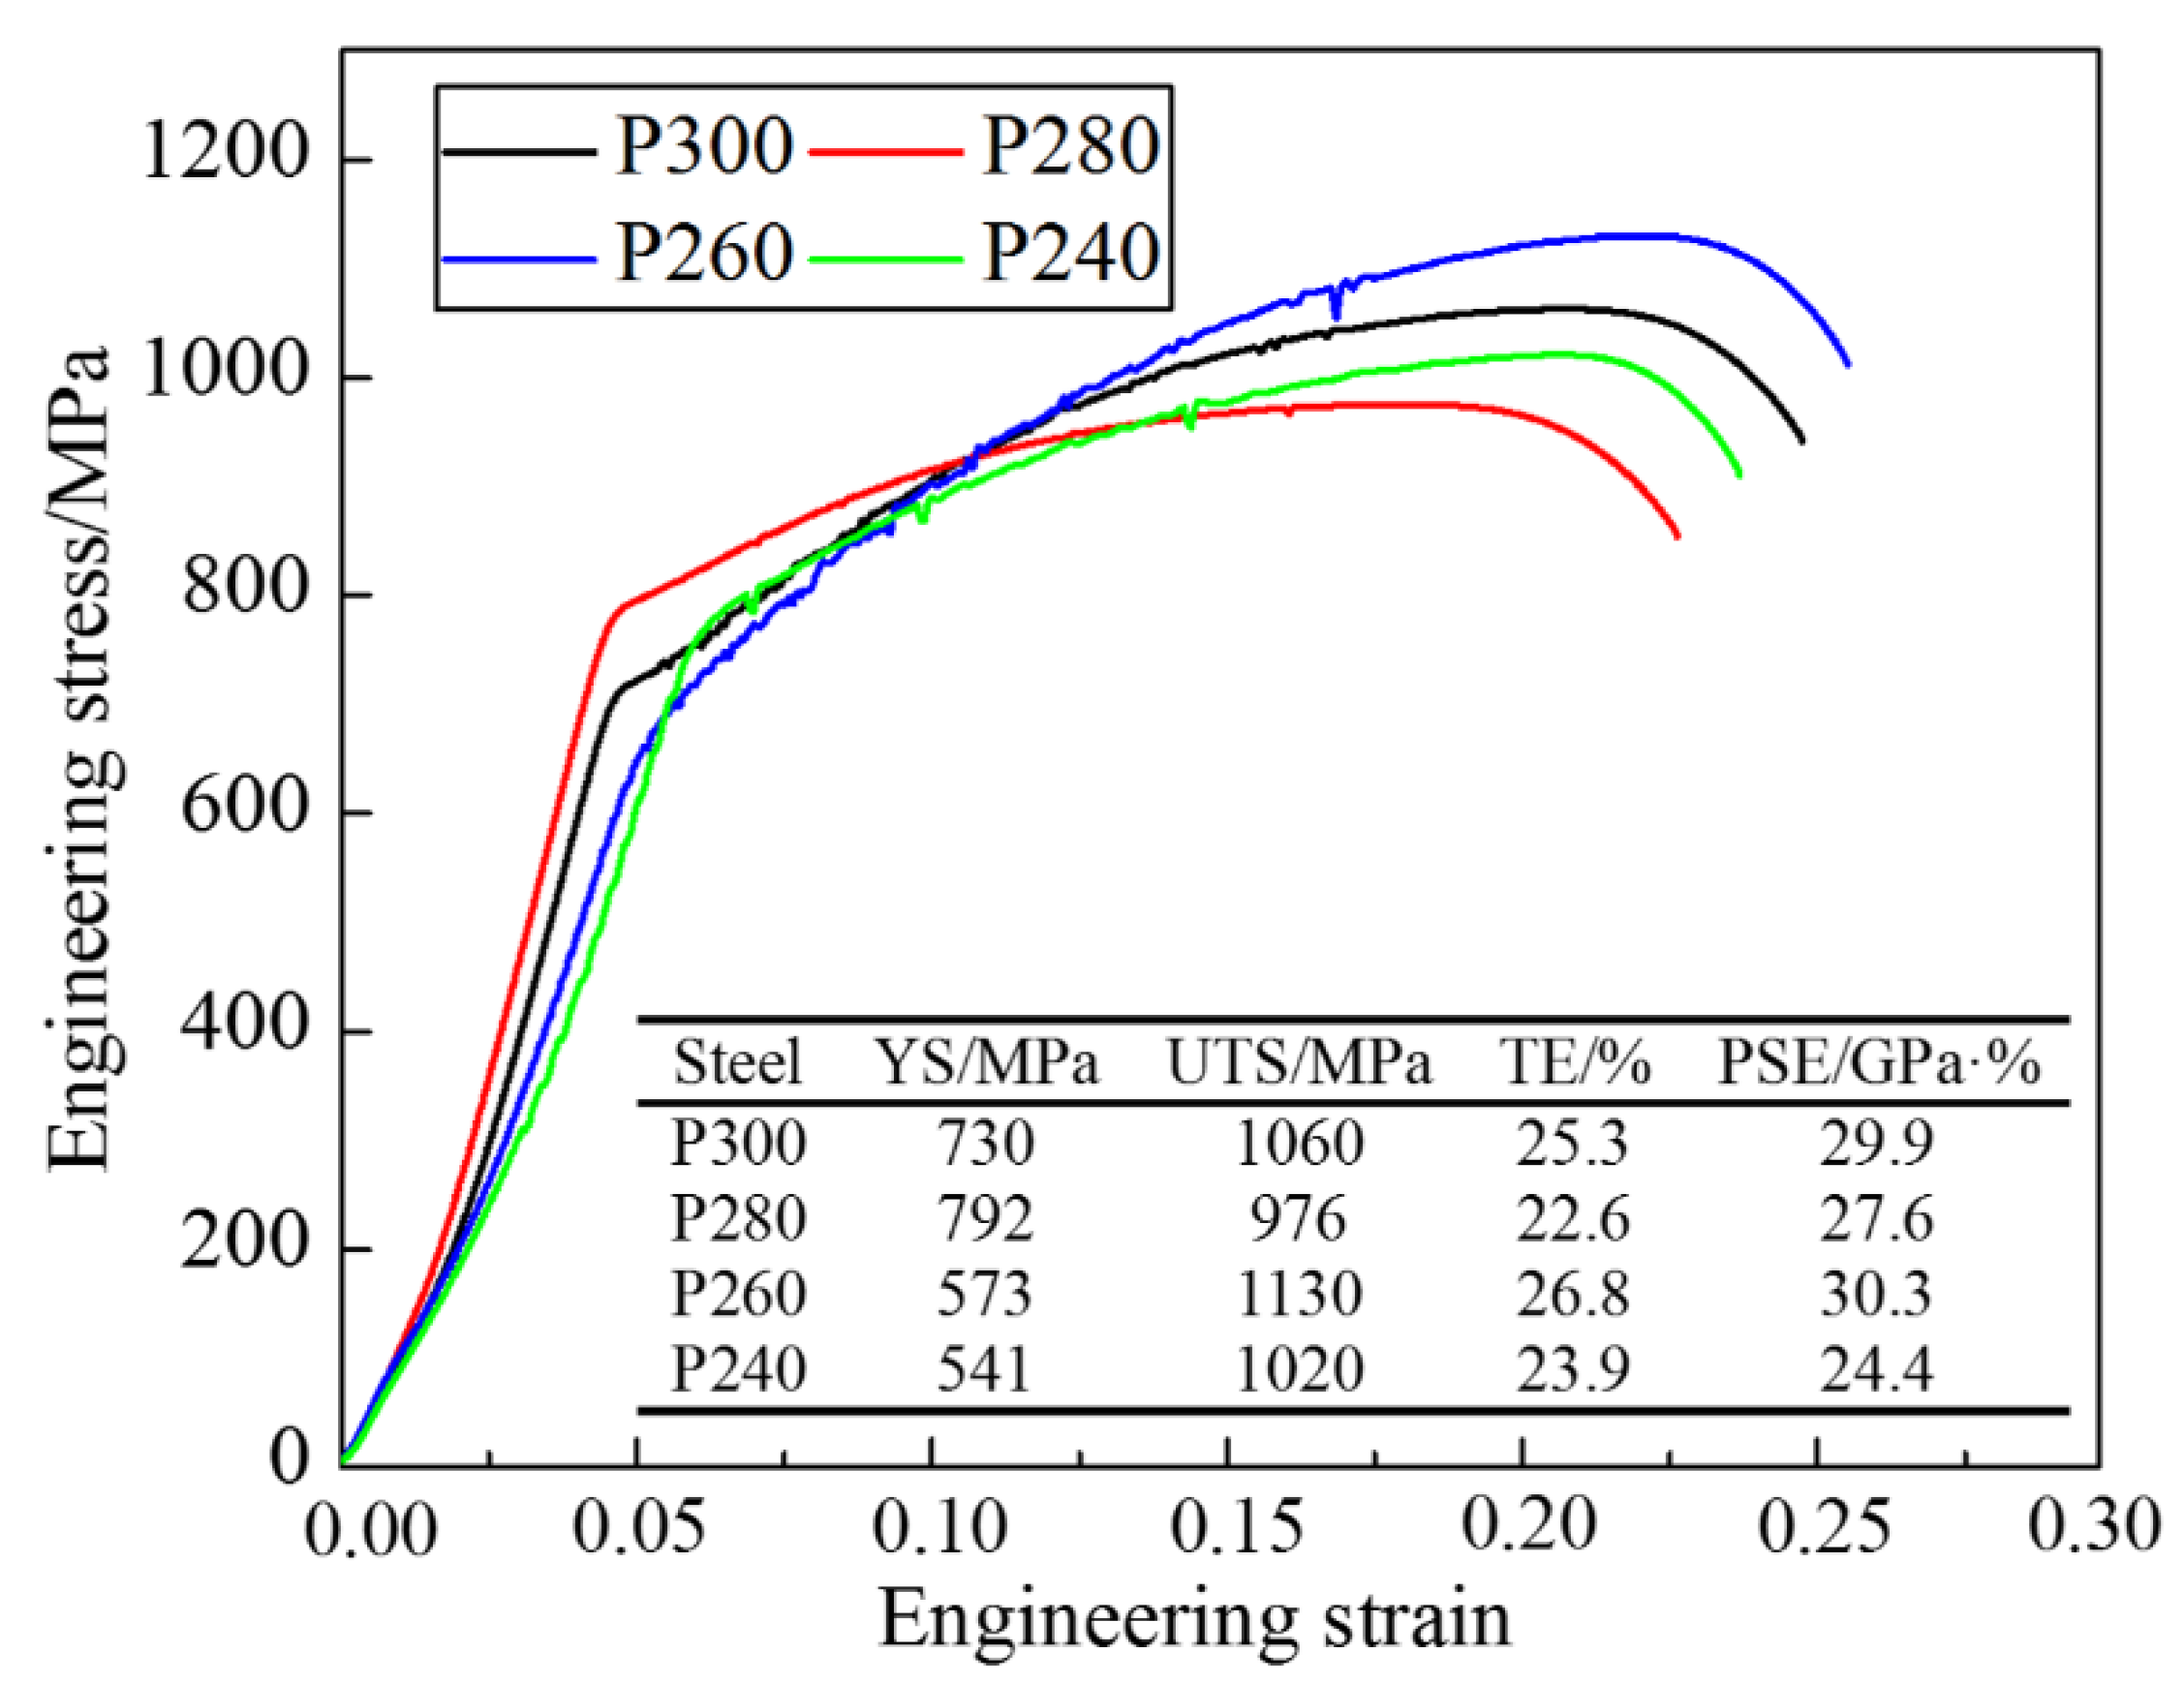
- The lath-like retained austenite (RA) had better stability than the block-shaped austenite. When the fractions of RA were high, the TRIP effect, good for the plasticity of the steel, would be more obvious, showing a longer hardening rate plateau and a higher average n value during plastic deformation;
- (3)
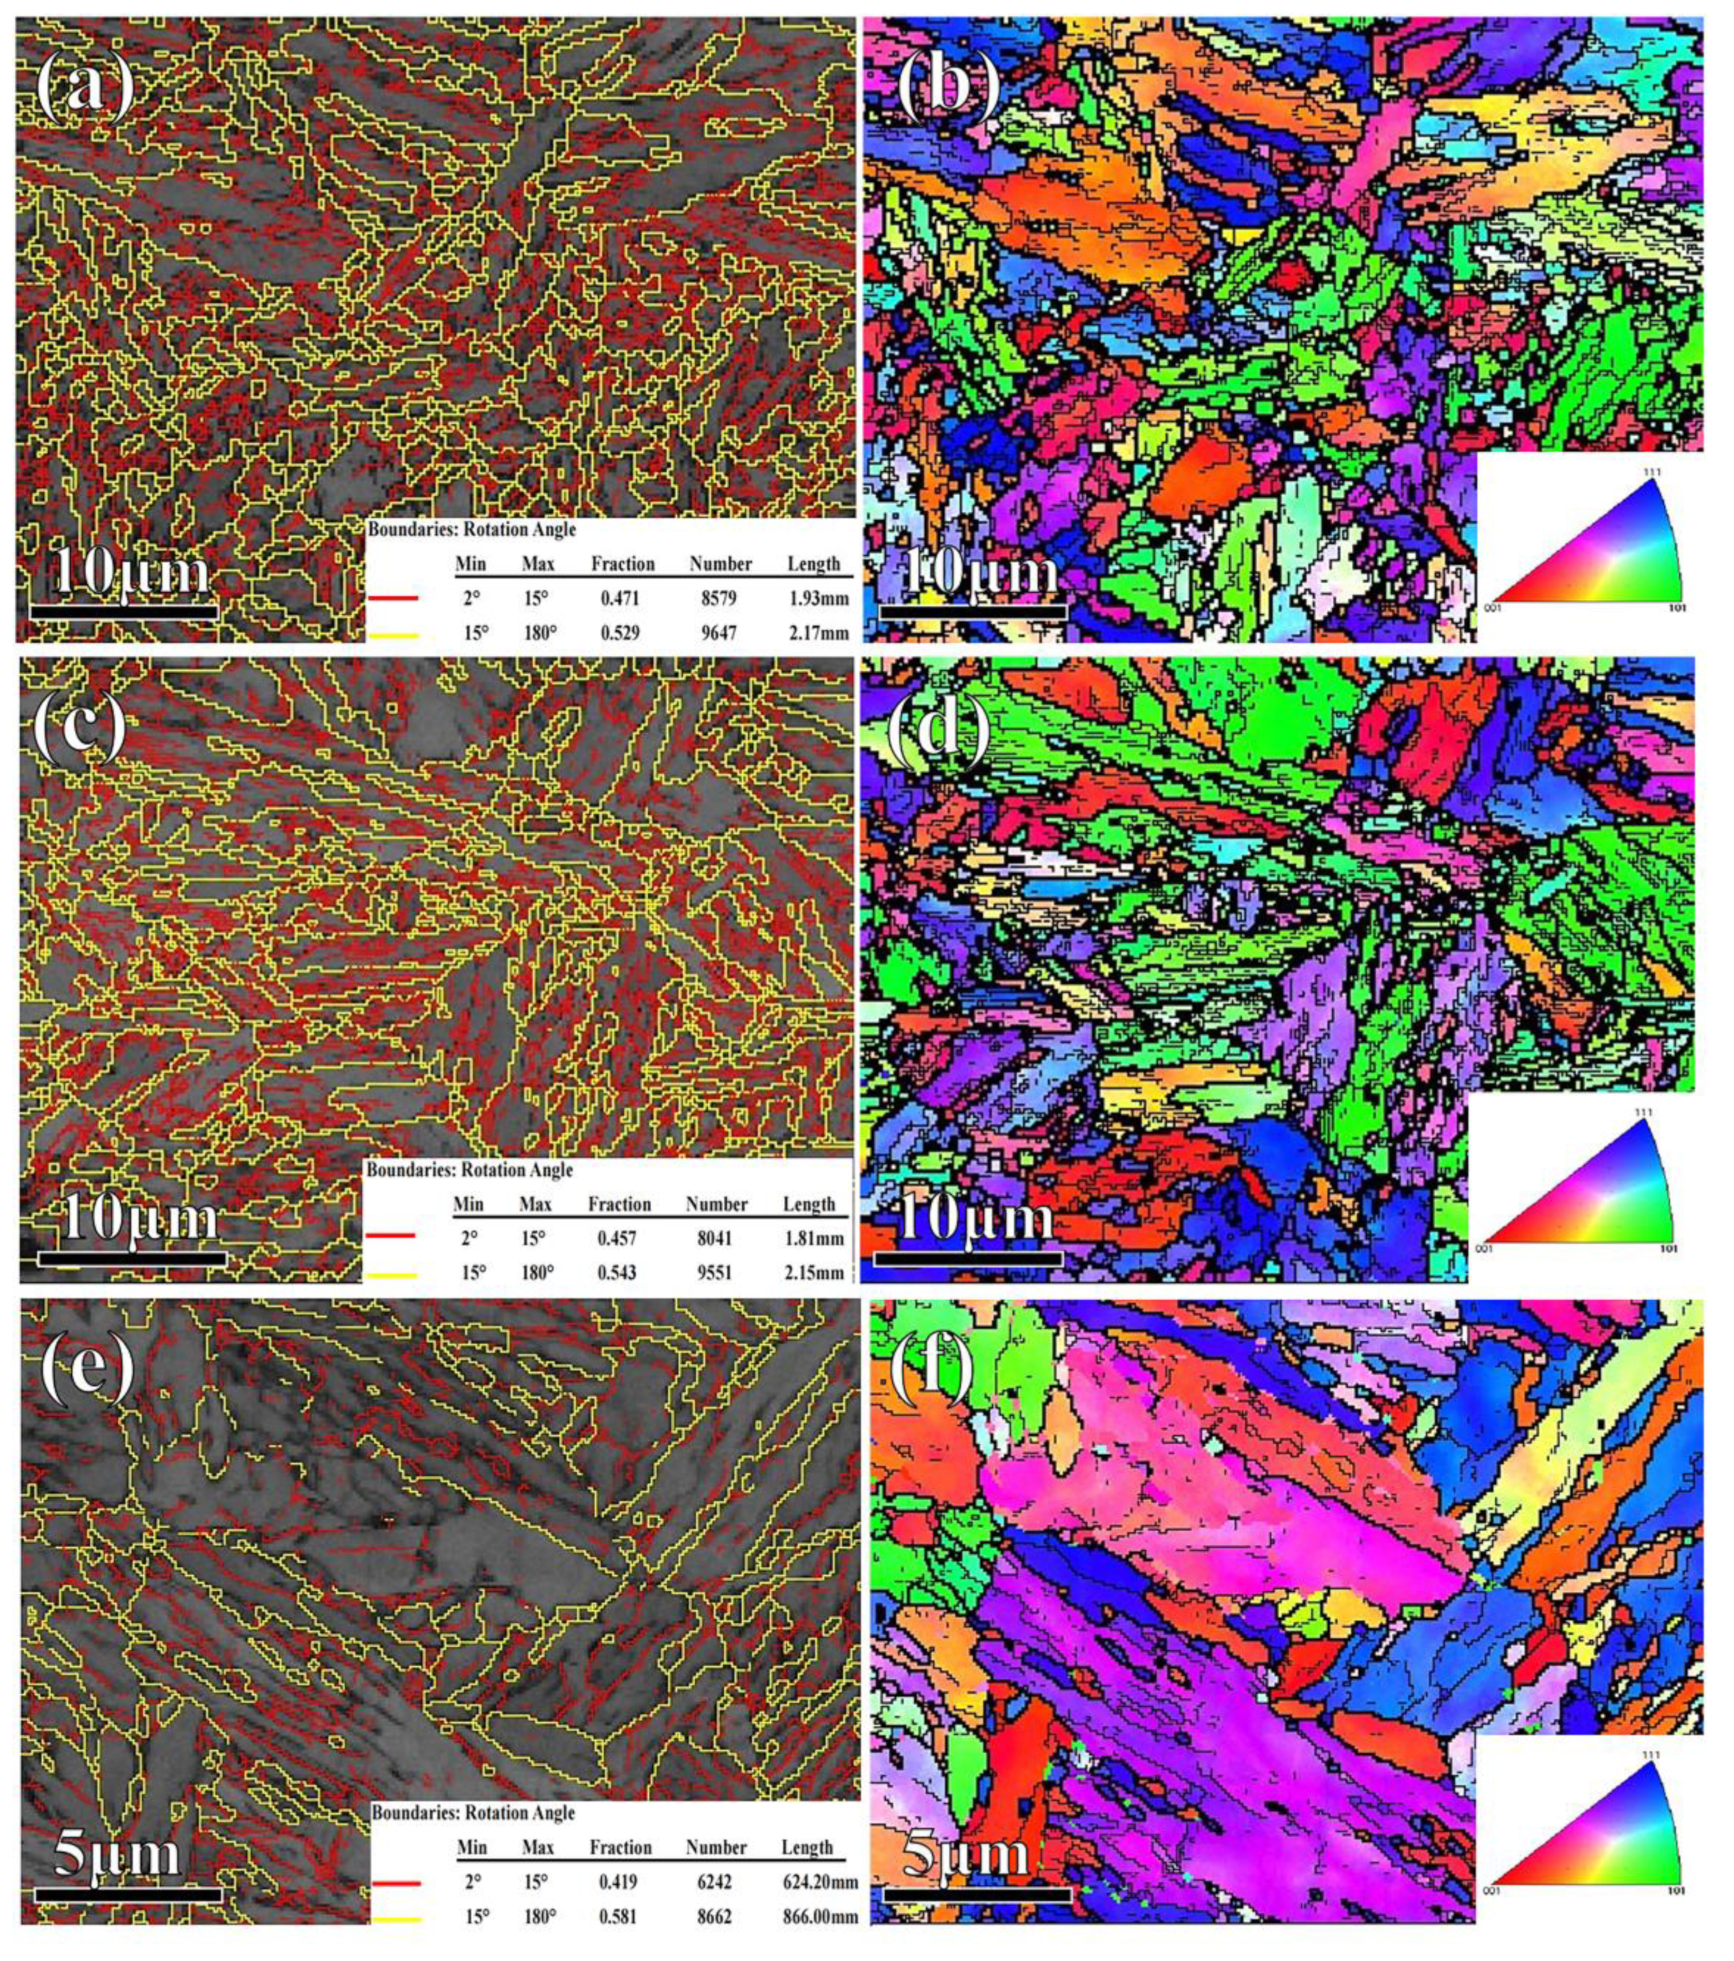
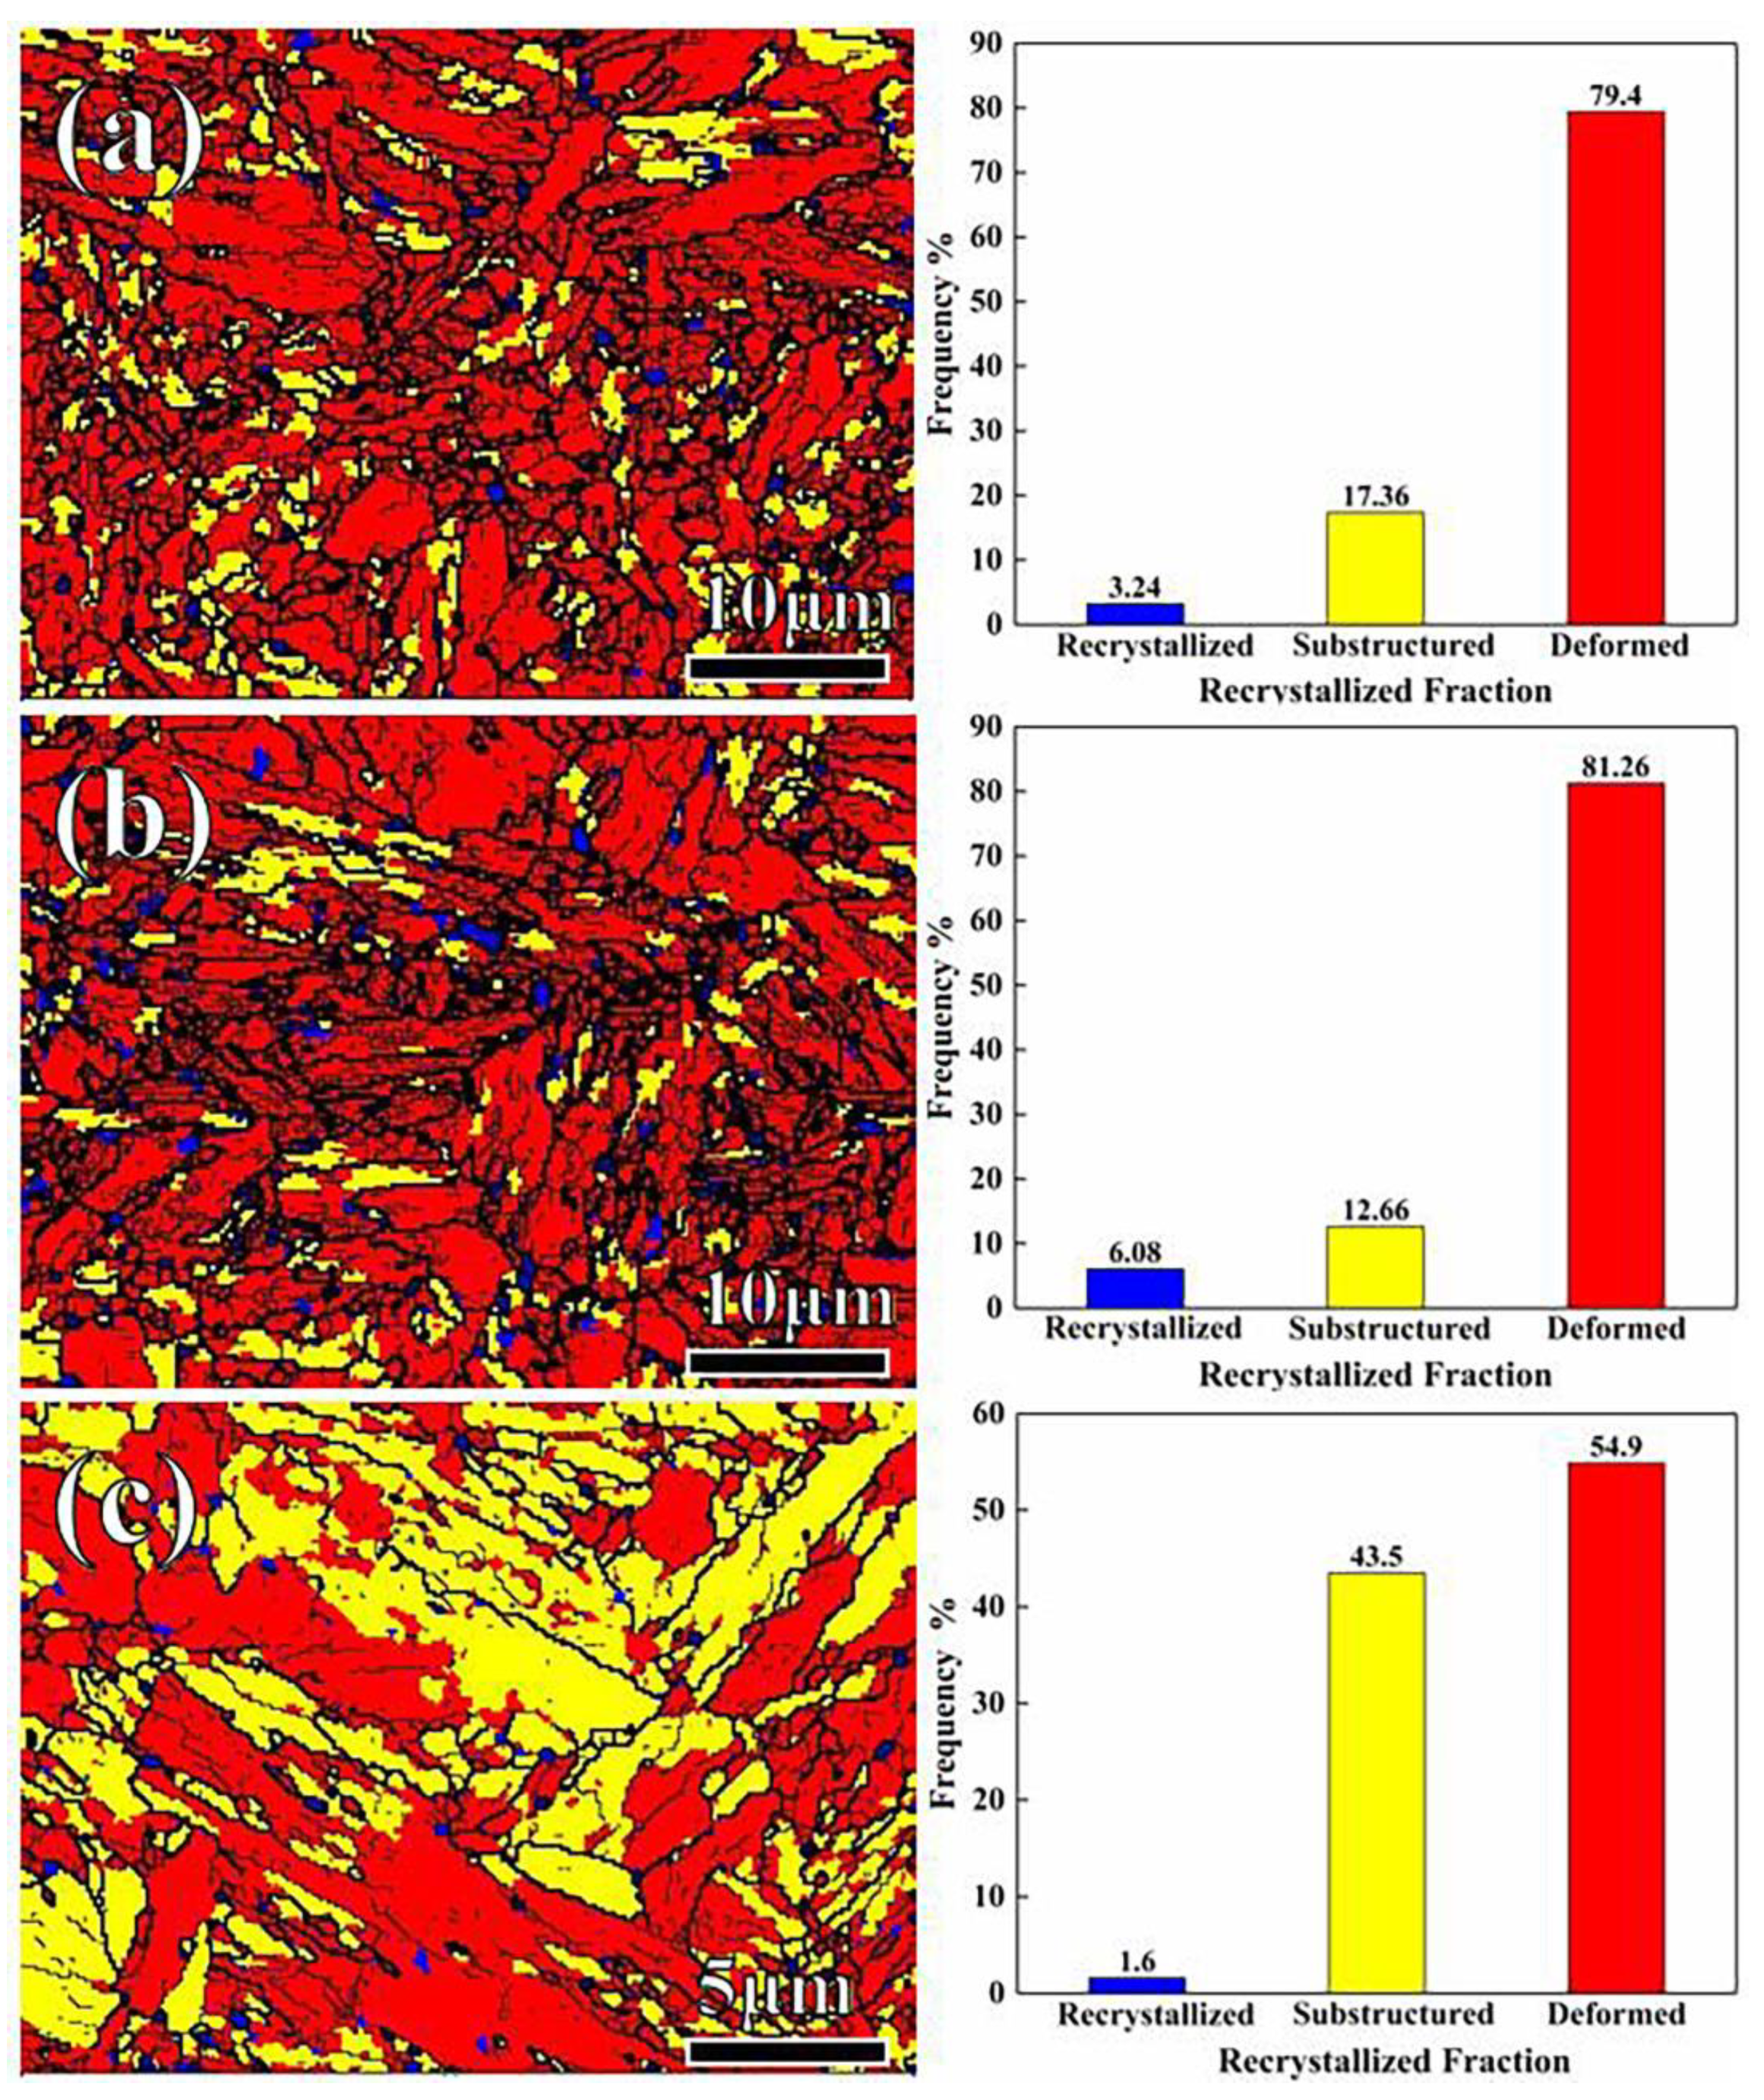
- In the sample partitioned at high temperature, the fractions of the high-angle grain boundaries were few, but the microstructure (the lengths of the low- and high-angle grain boundaries, the recrystallized structure, substructure, and deformed structure) was finer and multi-oriented, and the substructure and recrystallized structure were distributed uniformly. The finer microstructure was favorable for plasticity.
Author Contributions
Funding
Institutional Review Board Statement
Informed Consent Statement
Data Availability Statement
Conflicts of Interest
References
- Aydin, H.; Essadiqi, E.; Jung, I.H.; Yue, S. Development of 3rd generation AHSS with medium Mn content alloying compositions. Mat. Sci. Eng. A 2013, 564, 501–508. [Google Scholar] [CrossRef]
- Cai, Z.H.; Ding, H.; Kamoutsi, H.; Haidemenopoulos, G.N.; Misra, R.D.K. Interplay between deformation behavior and mechanical properties of intercritically annealed and tempered medium-manganese transformation-induced plasticity steel. Mat. Sci. Eng. A 2016, 654, 359–367. [Google Scholar] [CrossRef]
- Luo, H.; Shi, J.; Wang, C.; Sun, X.; Dong, H. Experimental and numerical analysis on formation of stable austenite during the intercritical annealing of 5Mn steel. Acta Mater. 2011, 59, 4002–4014. [Google Scholar] [CrossRef]
- Xu, H.F.; Zhao, J.; Cao, W.Q.; Shi, J.; Wang, C.Y.; Wang, C.J.; Li, H.D. Heat treatment effects on the microstructure and mechanical properties of a medium manganese steel (0.2C–5Mn). Mat. Sci. Eng. A 2012, 532, 435–442. [Google Scholar] [CrossRef]
- Chang, W.; Cao, W.; Jie, S.; Huang, C.; Han, D. Deformation microstructures and strengthening mechanisms of an ultrafine grained duplex medium-Mn steel. Mat. Sci. Eng. A 2013, 562, 89–95. [Google Scholar]
- Rocha, R.O.; Melo, T.; Pereloma, E.V. Microstructural evolution at the initial stages of continuous annealing of cold rolled dual-phase steel. Mat. Sci. Eng. A 2005, 391, 296–304. [Google Scholar] [CrossRef]
- Vercammen, S.; De Cooman, B.C.; Akdut, N.; Blanpain, B.; Wollants, P. Microstructural Evolution and Crystallographic Texture Formation of Cold Rolled Austenitic Fe-30Mn-3Al-3Si TWIP-Steel. Steel Res. Int. 2003, 74, 370–375. [Google Scholar] [CrossRef]
- Caballero, F.G.; Bhadeshia, H. Very strong bainite. Curr. Opin. Solid. St. M 2004, 8, 251–257. [Google Scholar] [CrossRef] [Green Version]
- Mohapatra, S.; Das, K.; Das, S. Effect of annealing time on the microstructure and mechanical properties of aluminum added low-density medium manganese steel. Mater. Lett. 2022, 318, 132211. [Google Scholar] [CrossRef]
- Peng, Q. Austenite stability and deformation behavior in medium Mn steel processed by cyclic quenching ART heat treatment. Materials 2021, 14, 7132. [Google Scholar]
- Speer, J.; Matlock, D.K.; De Cooman, B.C.; Schroth, J.G. Carbon partitioning into austenite after martensite transformation. Acta Mater. 2003, 51, 2611–2622. [Google Scholar] [CrossRef]
- Dong, X.X.; Shen, F.Y.; Jia, N.; Zhu, Y.T. Improving mechanical properties and retained-austenite stability of a medium carbon Q&P steel by adjusting phase ratio. Mat. Sci. Eng. A 2022, 833, 142580. [Google Scholar]
- Bagliani, E.P.; Santofimia, M.J.; Zhao, L.; Sietsma, J.; Anelli, E. Microstructure, tensile and toughness properties after quenching and partitioning treatments of a medium-carbon steel. Mat. Sci. Eng. A 2013, 559, 486–495. [Google Scholar] [CrossRef]
- Tan, X.D.; Xu, Y.B.; Yang, X.L.; Wu, D. Microstructure-properties relationship in a one-step quenched and partitioned steel. Mat. Sci. Eng. A 2014, 589, 101–111. [Google Scholar] [CrossRef]
- Wu, T.; Wu, R.; Liu, B.; Liang, W.; Ke, D. Enhancing the Mechanical Properties of a Hot Rolled High-Strength Steel Produced by Ultra-Fast Cooling and Q&P Process. Metals 2019, 9, 958. [Google Scholar]
- Santofimia, M.J.; Petrov, R.H.; Zhao, L.; Sietsma, J. Microstructural analysis of martensite constituents in quenching and partitioning steels. Mater. Charact. 2014, 92, 91–95. [Google Scholar] [CrossRef]
- Wu, J.; Bao, L.; Gu, Y.; Li, Q.; Liu, J. The strengthening and toughening mechanism of dual martensite in quenching-partitioning steels. Mat. Sci. Eng. A 2020, 772, 138765. [Google Scholar] [CrossRef]
- Lee, S.; De, C.; Bruno, C. Tensile Behavior of Intercritically Annealed 10 pct Mn Multi-phase Steel. Metall Mater. Trans. 2014, 45, 709–716. [Google Scholar] [CrossRef] [Green Version]
- Yang, F.; Luo, H.; Hu, C.; Pu, E.; Dong, H. Effects of intercritical annealing process on microstructures and tensile properties of cold-rolled 7Mn steel. Mat. Sci. Eng. A 2017, 685, 115–122. [Google Scholar] [CrossRef]
- Feng, Y.; Jing, C.N.; Lin, T.; Wu, Z.L.; Li, Z.T.; Zhao, J.R. Effect of retained austenite on the microstructure and mechanical properties of cold rolled medium manganese Q&P steel. Ironmak Steelmak. 2022, 1–7. [Google Scholar]
- Wu, Z.L.; Jing, C.N.; Feng, Y.; Li, Z.T.; Lin, T.; Zhao, J.R. Effect of a new prestrain, intercritical annealing, quenching, and partitioning process on the microstructure and mechanical properties of medium-manganese steels. Steel Res Int. 2022, 93, 2200492. [Google Scholar] [CrossRef]
- Liu, L.; Jing, C.N.; Shan, B.; Zhang, Z.H.; Zhao, S.Z.; Lin, L.; Zhao, J.R. Effect of different matrix structure in medium-Mn quenching and partitioning steel on austenite stability and work hardening behavior. Mater. Today Commun. 2022, 32, 103851. [Google Scholar] [CrossRef]
- Zhuang, D.W.; Tang, Y.J.; Qin, Z.Z. Materials Science Method; Tianjin University Press: Tianjin, China, 2020. [Google Scholar]
- Wang, C.Y.; Shi, J.; Cao, W.Q.; Dong, H. Characterization of microstructure obtained by quenching and partitioning process in low alloy martensitic steel. Mat. Sci. Eng. A 2010, 527, 3442–3449. [Google Scholar] [CrossRef]
- Li, Q.G.; Huang, X.F.; Huang, W.G. Microstructure and mechanical properties of a medium-carbon bainitic steel by a novel quenching and dynamic partitioning (Q-DP) process. Mat. Sci. Eng. A 2016, 662, 129–135. [Google Scholar] [CrossRef]
- Feng, S.M.; Wan, D.C.; Wang, Y.T.; Li, J.; Cui, Y. Microstructure and mechanical properties of low carbon medium manganese steel treated with Q&P. Met. Heat Treat. 2020, 45, 69–74. [Google Scholar]
- Liu, L.; He, B.B.; Cheng, G.J.; Yen, H.W.; Huang, M.X. Optimum properties of quenching and partitioning steels achieved by balancing fraction and stability of retained austenite. Scripta Mater. 2018, 150, 1–6. [Google Scholar] [CrossRef]
- Huang, L.; Deng, X.T.; Liu, J.; Wang, Z. Relationship between stability and low temperature toughness of residual austenite in 0.12C-3.0Mn low carbon medium manganese steel. Acta Metall. Sin. 2017, 53, 62–70. [Google Scholar]
- Liu, Z.N. Materials Science & Engineering, 4th ed.; Northwestern Polytechnical University Press: Xi’an, China, 2013. [Google Scholar]
- Xiong, Z.L.; Qi, J.J.; Sun, L.; Dong, Y.K.; Zhao, Y.Z.; Yang, T.; Xing, C.L. Formability of high strength duplex steel. Met. Heat Treat. 2021, 46, 66–71. [Google Scholar]
- Jung, Y.S.; Lee, Y.K.; Matlock, D.K.; Mataya, M.C. Effect of grain size on strain-induced martensitic transformation start temperature in an ultrafine grained metastable austenitic steel. Met. Mater. Int. 2011, 17, 553–556. [Google Scholar] [CrossRef] [Green Version]
- Chiang, J.; Lawrence, B.; Boyd, J.D.; Pilkey, A.K. Effect of microstructure on retained austenite stability and work hardening of TRIP steels. Mat. Sci. Eng. A 2011, 528, 4516–4521. [Google Scholar] [CrossRef]


| Element | C | Mn | Cu | Cr | Mo | Nb | B | Fe |
|---|---|---|---|---|---|---|---|---|
| Content/wt.% | 0.11 | 4.96 | 0.53 | 0.35 | 0.18 | 0.10 | 0.001 | Bal. |
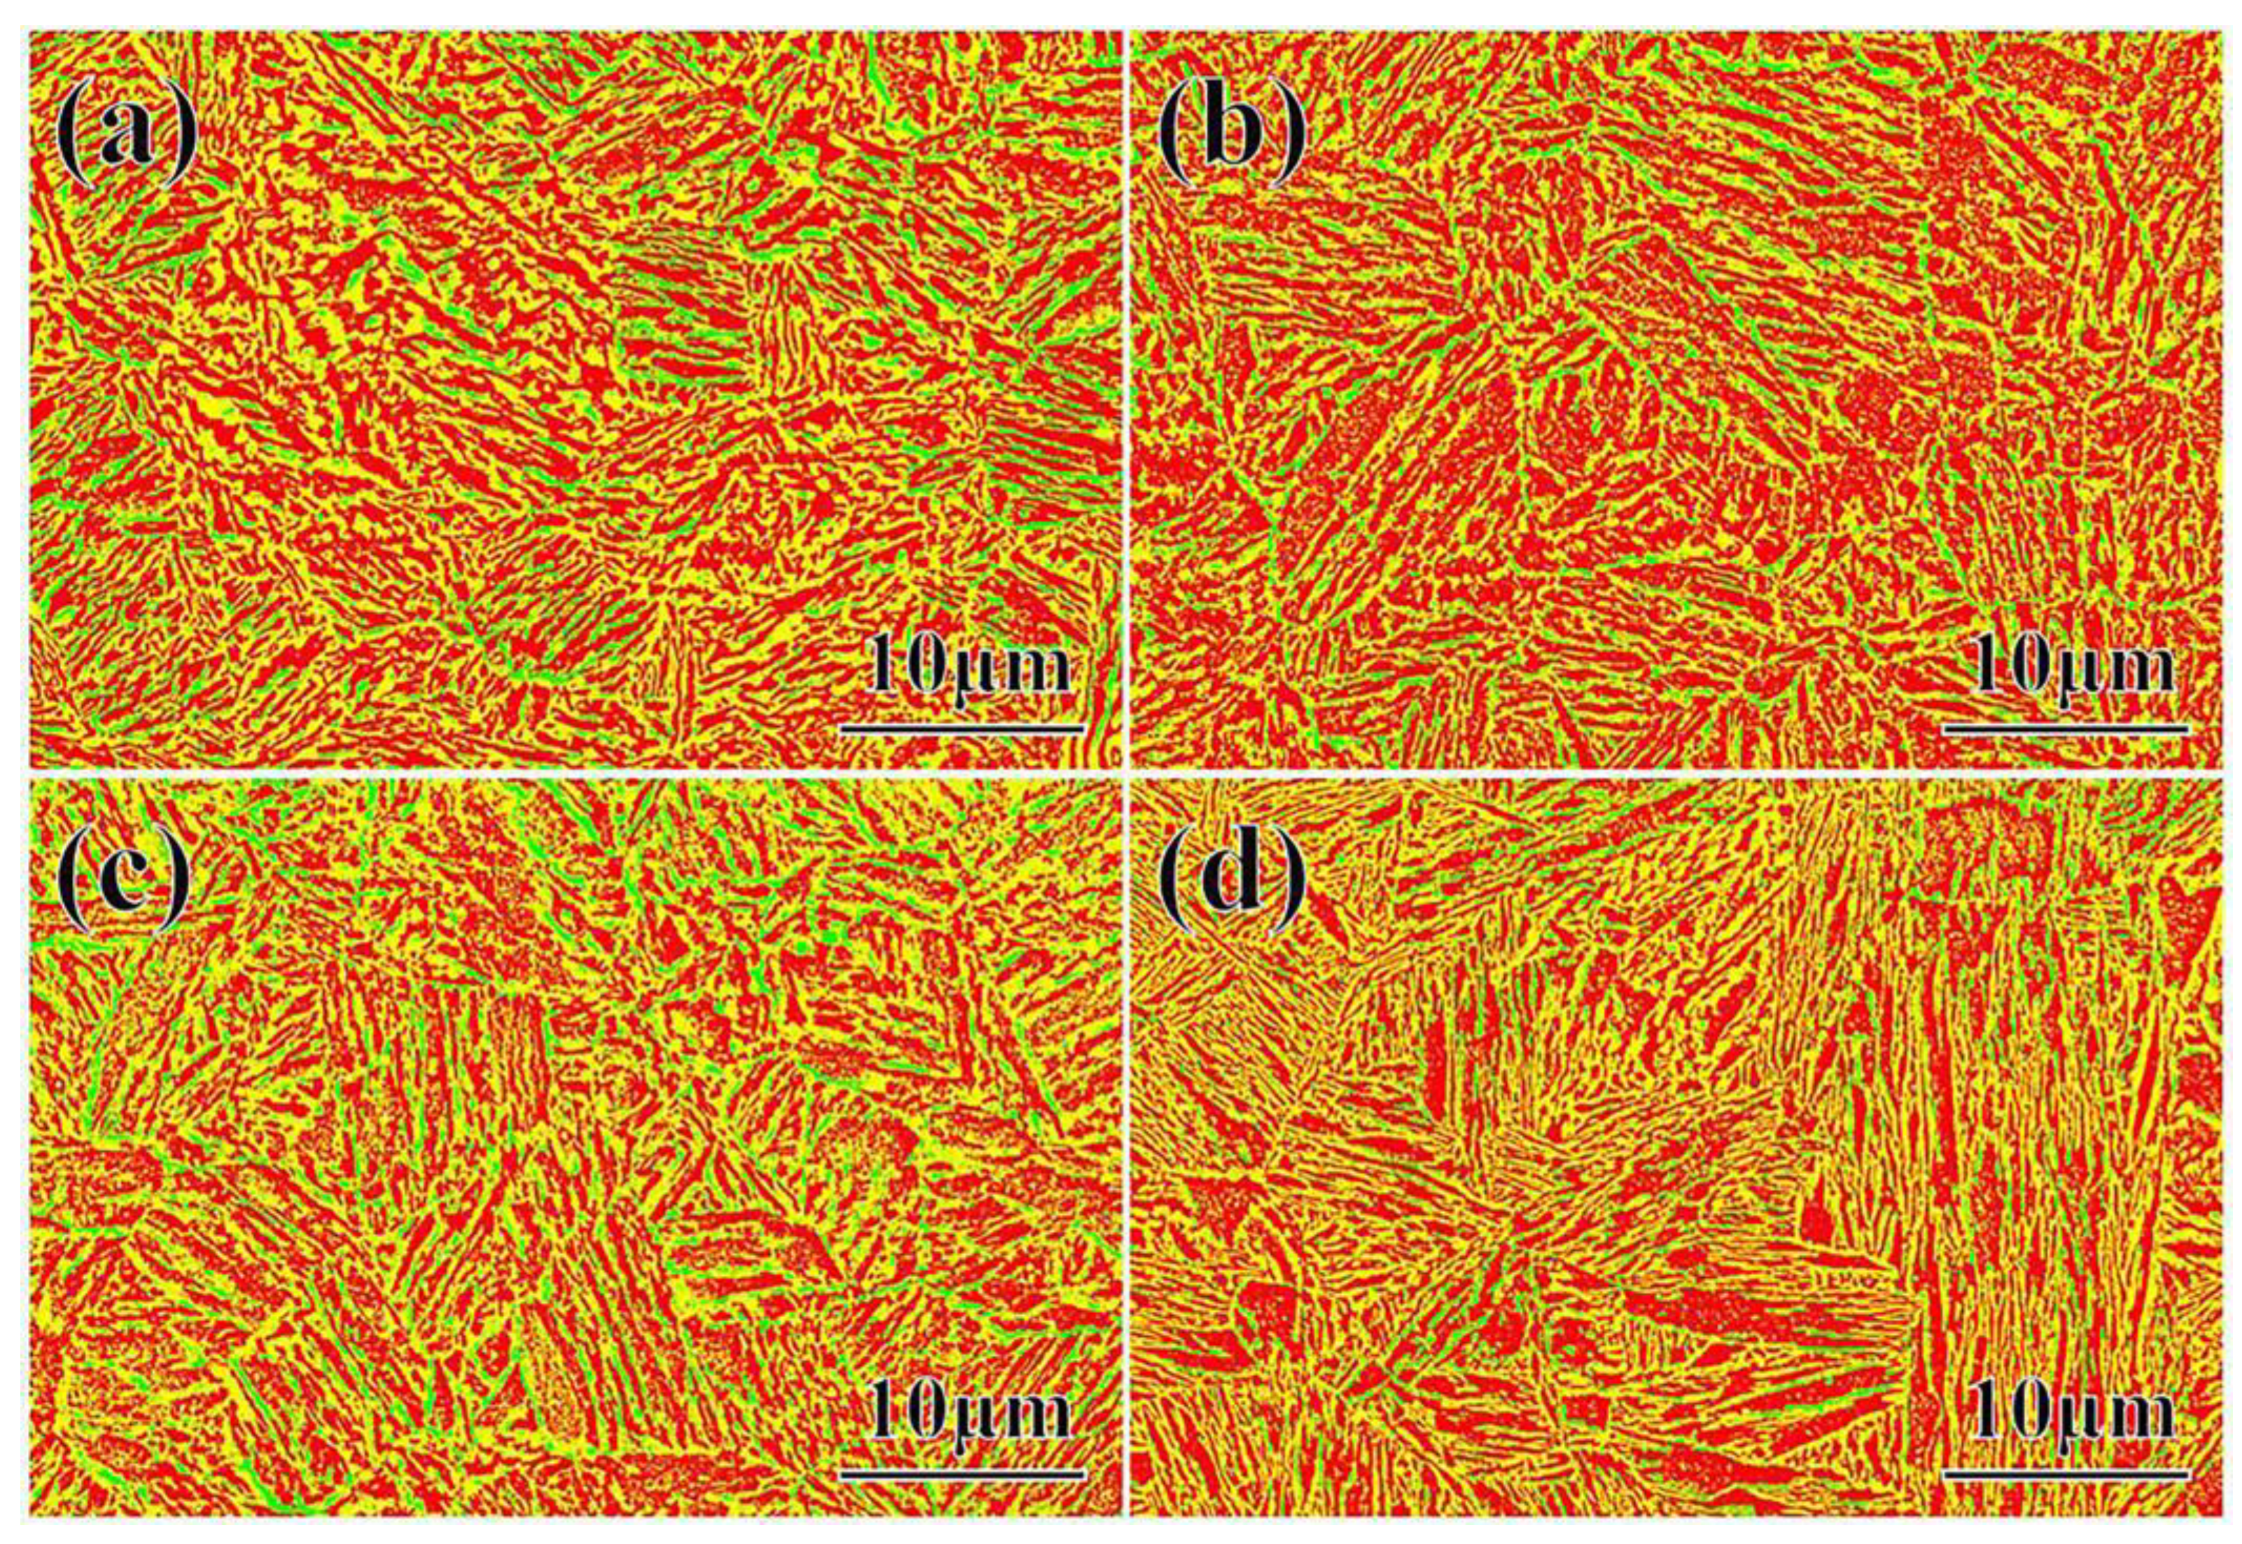
| Area % | P300 | P280 | P260 | P240 |
|---|---|---|---|---|
| Red/α | 50.0 | 55.3 | 45.1 | 48.2 |
| Yellow/M(M1, M2) | 42.2(6.0, 36.2) | 38.5(11.2, 27.3) | 47.4(27.3, 20.1) | 46.1(41.4, 4.7) |
| Green/γ | 7.8 | 6.2 | 7.5 | 5.7 |
Publisher’s Note: MDPI stays neutral with regard to jurisdictional claims in published maps and institutional affiliations. |
© 2022 by the authors. Licensee MDPI, Basel, Switzerland. This article is an open access article distributed under the terms and conditions of the Creative Commons Attribution (CC BY) license (https://creativecommons.org/licenses/by/4.0/).
Share and Cite
Lin, T.; Feng, Y.; Liu, L.; Jing, C.; Wu, Z.; Li, Z.; Zhao, J. Influence of Partitioning Temperature on Microstructure and Mechanical Performance of Medium Manganese Fe-C-Mn-Cu-Cr-Mo-Nb Steel. Metals 2022, 12, 2147. https://doi.org/10.3390/met12122147
Lin T, Feng Y, Liu L, Jing C, Wu Z, Li Z, Zhao J. Influence of Partitioning Temperature on Microstructure and Mechanical Performance of Medium Manganese Fe-C-Mn-Cu-Cr-Mo-Nb Steel. Metals. 2022; 12(12):2147. https://doi.org/10.3390/met12122147
Chicago/Turabian StyleLin, Tao, Yan Feng, Lei Liu, Cainian Jing, Zhonglin Wu, Zhaotong Li, and Jingrui Zhao. 2022. "Influence of Partitioning Temperature on Microstructure and Mechanical Performance of Medium Manganese Fe-C-Mn-Cu-Cr-Mo-Nb Steel" Metals 12, no. 12: 2147. https://doi.org/10.3390/met12122147