Article

Effect of CMT Welding Heat Input on Microstructure and Properties of 2A14 Aluminum Alloy Joint

1
School of Materials Science and Engineering, Inner Mongolia University of Technology, Hohhot 010051, China
2
School of Mechatronics Engineering, Northeast Forestry University, Harbin 150040, China
*
Authors to whom correspondence should be addressed.
Metals 2022, 12(12), 2100; https://doi.org/10.3390/met12122100
Submission received: 6 November 2022 / Revised: 25 November 2022 / Accepted: 2 December 2022 / Published: 7 December 2022
(This article belongs to the Special Issue Advances in Welding Science and Technology for Metallic Materials)

Abstract

:
Cold metal transfer (CMT) welding is an attractive welding technology for thin sheet aluminum alloys because of its low heat input, arc stability and spatter-free behavior during the welding process. The present research is mainly concerned with the effect of different heat input on microstructure and mechanical properties of CMT welding 2A14 aluminum alloy in 3 mm thickness. The results indicate that a welded joint with good quality can be achieved when the welding current is 105 A and welding speed is 8 mm/s. The weld width and porosity gradually increase along with the constantly increasing welding heat input. The center of the welded joint consists of a large number of fine equiaxed dendrites, and the gray matrix is uniformly distributed accompanied by a large number of dots and blocks as a white second phase, corresponding to the composition of the Al2Cu phase. The microhardness of welded joints under different welding heat input maintains relative stability and presents a certain softening degree; the base material is the highest, followed by the heat-affected zone.

1. Introduction

Due to the advantages of high specific strength, high specific stiffness, low density, corrosion resistance and good welding performance, aluminum and aluminum alloys are widely used as one of the structural materials in aviation, aerospace, shipping, automotive and other industries [1,2,3]. Among them, aluminum–copper alloys are widely used in aerospace because of their comprehensive properties such as weldability, mechanical properties and processability [4]. Welding is widely used in aerospace manufacturing as the primary means of joining [5]. Therefore, the welding process for aluminum–copper alloys has higher requirements.
In recent years, friction stir welding (FSW) and tungsten inert-gas welding (TIG) have been commonly used as the main welding methods for storage tanks in the actual manufacturing process [6,7]. FSW is a solid phase joining technique invented by TWI in 1991, which does not melt the base material during the welding process, and the welded joint has good mechanical properties [8,9]. However, when FSW is performed, the welded workpiece must be rigidly fixed, and the keyhole at the end of the weld will be difficult to repair, resulting in a decrease in its welding performance. TIG is a kind of fusion welding, which has cathodic cleaning effect in the welding process and can effectively remove the dense oxide film on the surface of the welded parts [10]. However, it was found that TIG welding has many disadvantages such as small penetration, unstable welding process and easily produced porosity [11].
Cold metal transfer (CMT) welding technology is a new welding process with no slag spatter and low heat input and was developed by Fronius [12]. CMT welding technology is suitable for the welding of thin and ultrathin boards of about 0.3–3 mm [13]. Many studies in recent years have shown that CMT technology is not only suitable for welding thin aluminum alloys, but also for welding of dissimilar metals such as aluminum alloys and steel and aluminum alloys and magnesium alloys [14,15,16,17]. Tian et al. [18] found that when using CMT welding for aluminum alloy cladding fabrication, with the increase of heat input, the weld depth and contact angle increased, and the overlap length reduced. At the same time. the grooves were clearer at the wear surfaces. Zhu et al. [19] prepared a composite structure of TA2 titanium and Q235 carbon steel carbon steel using a hybrid welding method of Laser + CMT. It was found that when the welding heat input was low, intermetallic compounds (ICs) formed. Under a low heat input circumstance, the tensile strength of the weld could reach up to 420 MPa.
Although CMT welding technology in aluminum alloys and in aluminum alloys and steel in the heterogeneous connection have received some remarkable results, the welding research of 2A14 aluminum alloy thin plate is still relatively scarce [20]. Therefore, in this paper, CMT welded joints of 2A14 aluminum alloy were prepared using different CMT welding heat inputs. The effect mechanism of welded joints on microstructure and mechanical properties by varying the welding current was systematically studied. The optimal process parameters for the fine microstructure and performance of 2A14 aluminum alloy under CMT welding were determined. The results of this study can provide technical reference for obtaining high quality 2XXX aluminum alloy weld joints and additive manufacturing 2XXX aluminum alloy components through CMT technology.

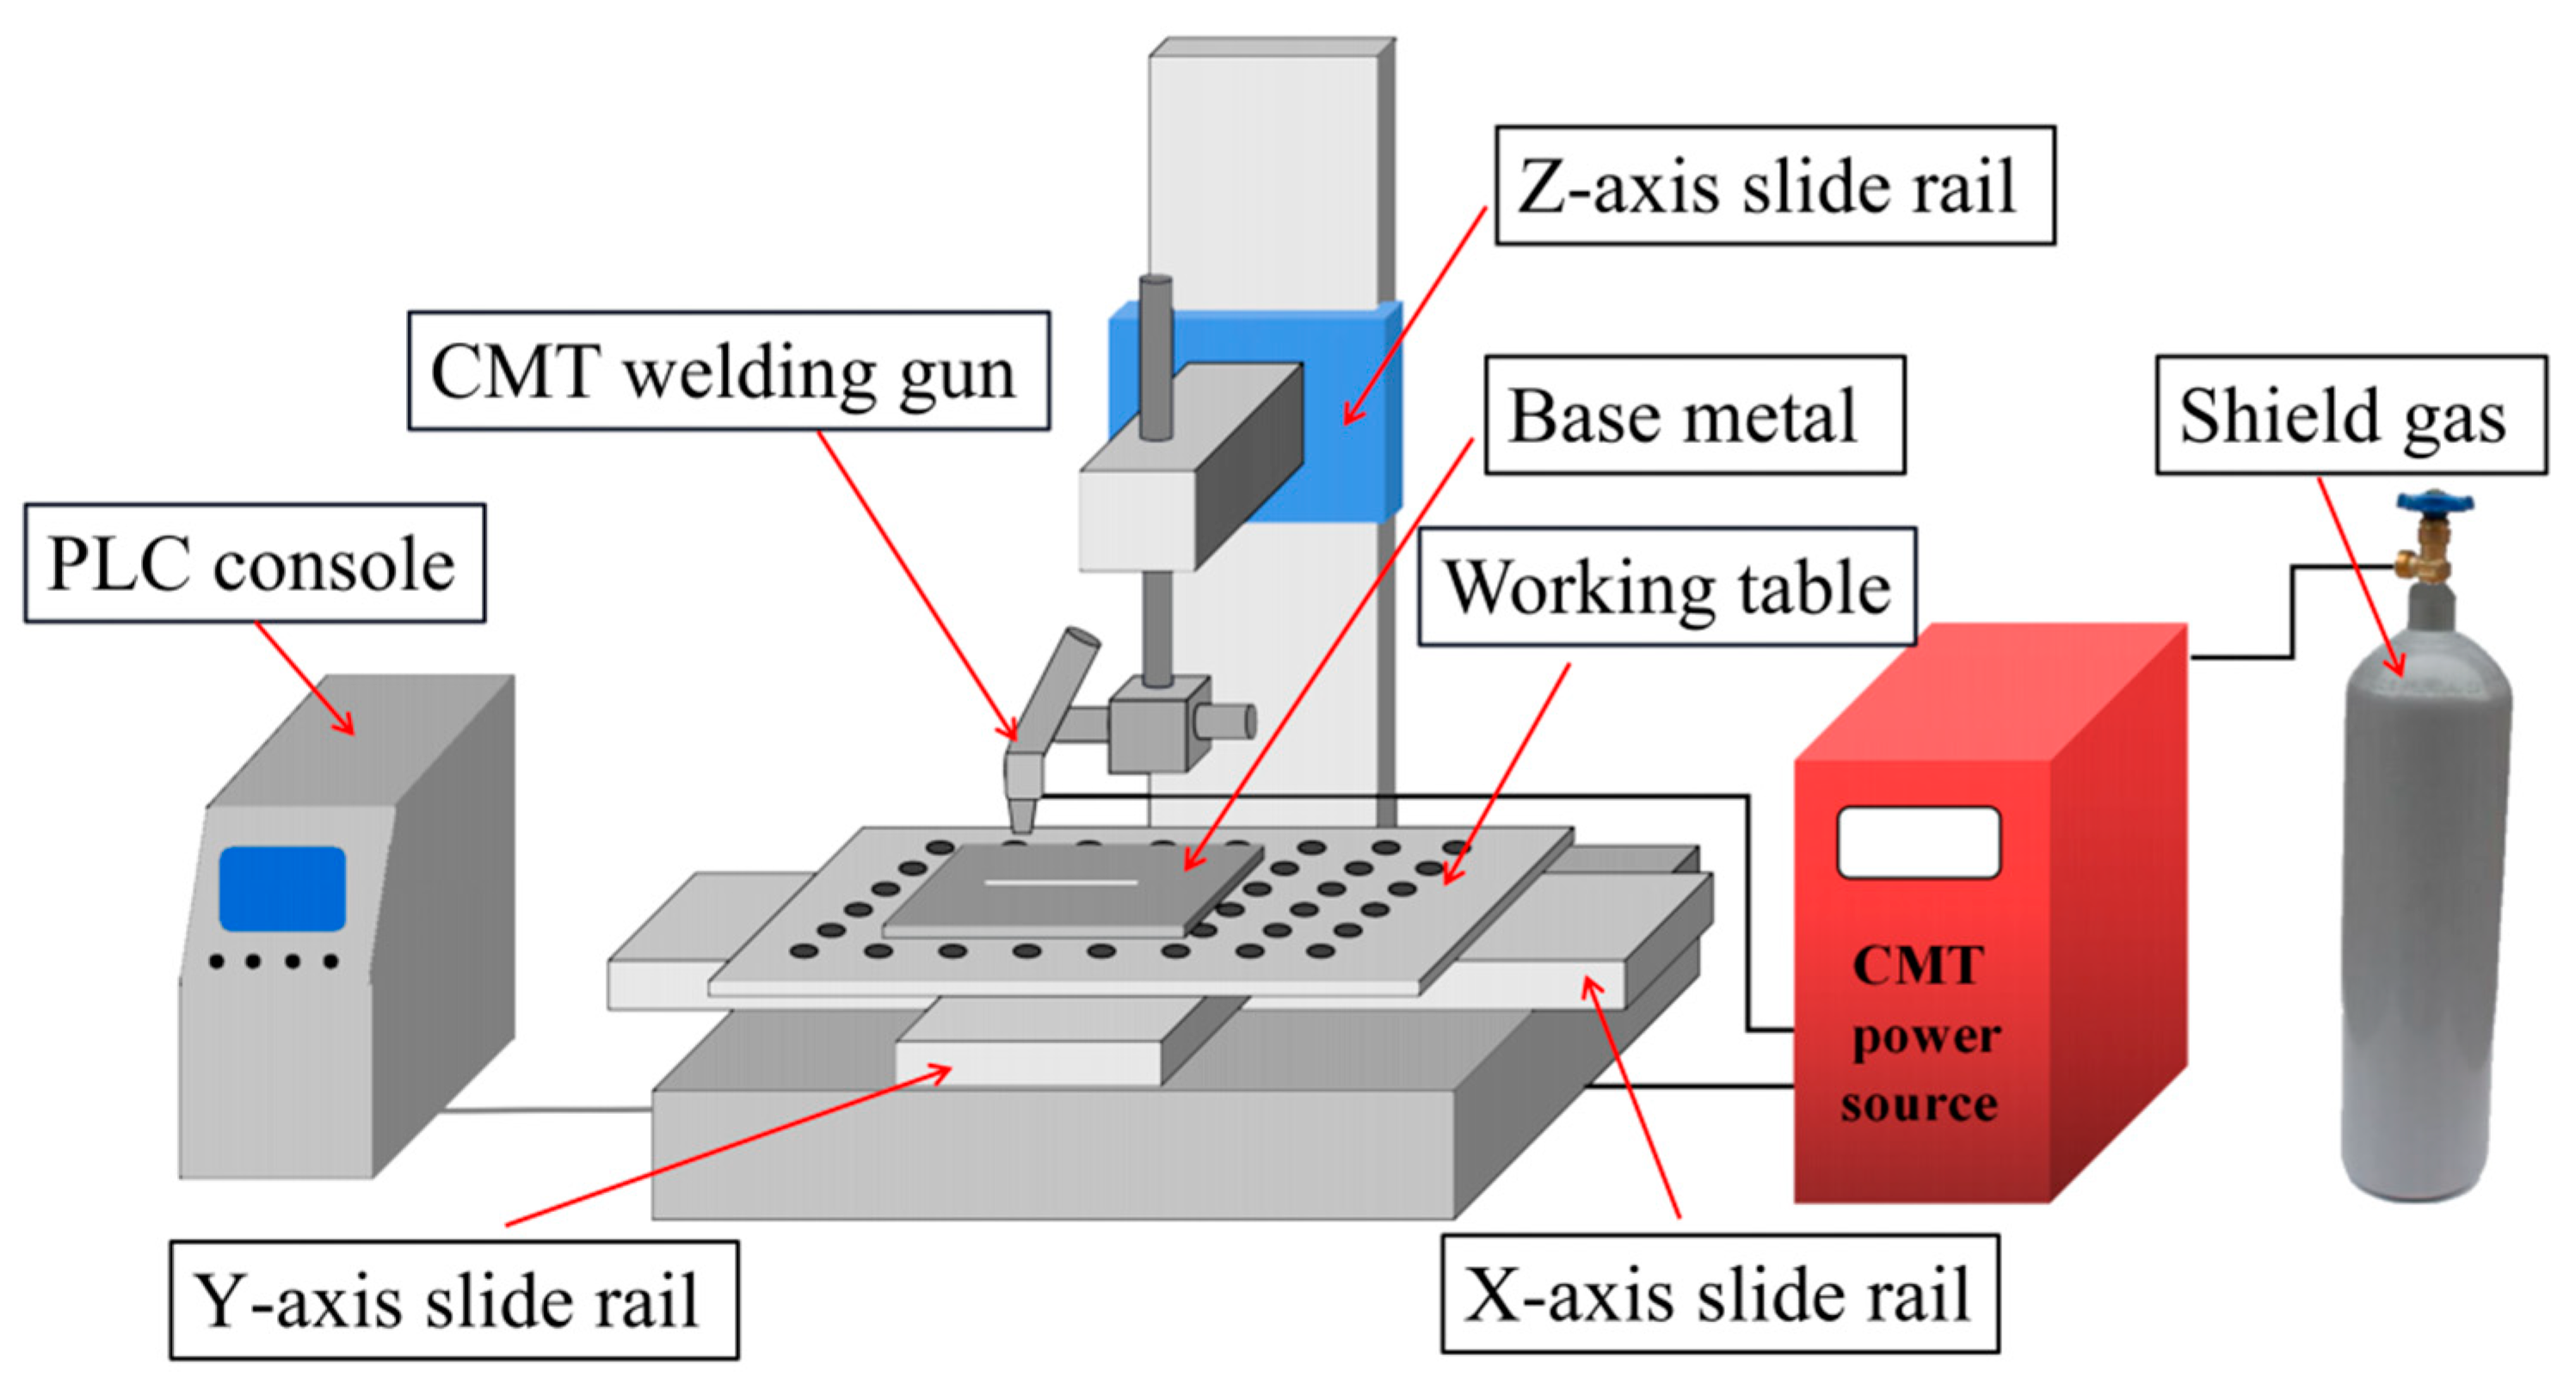
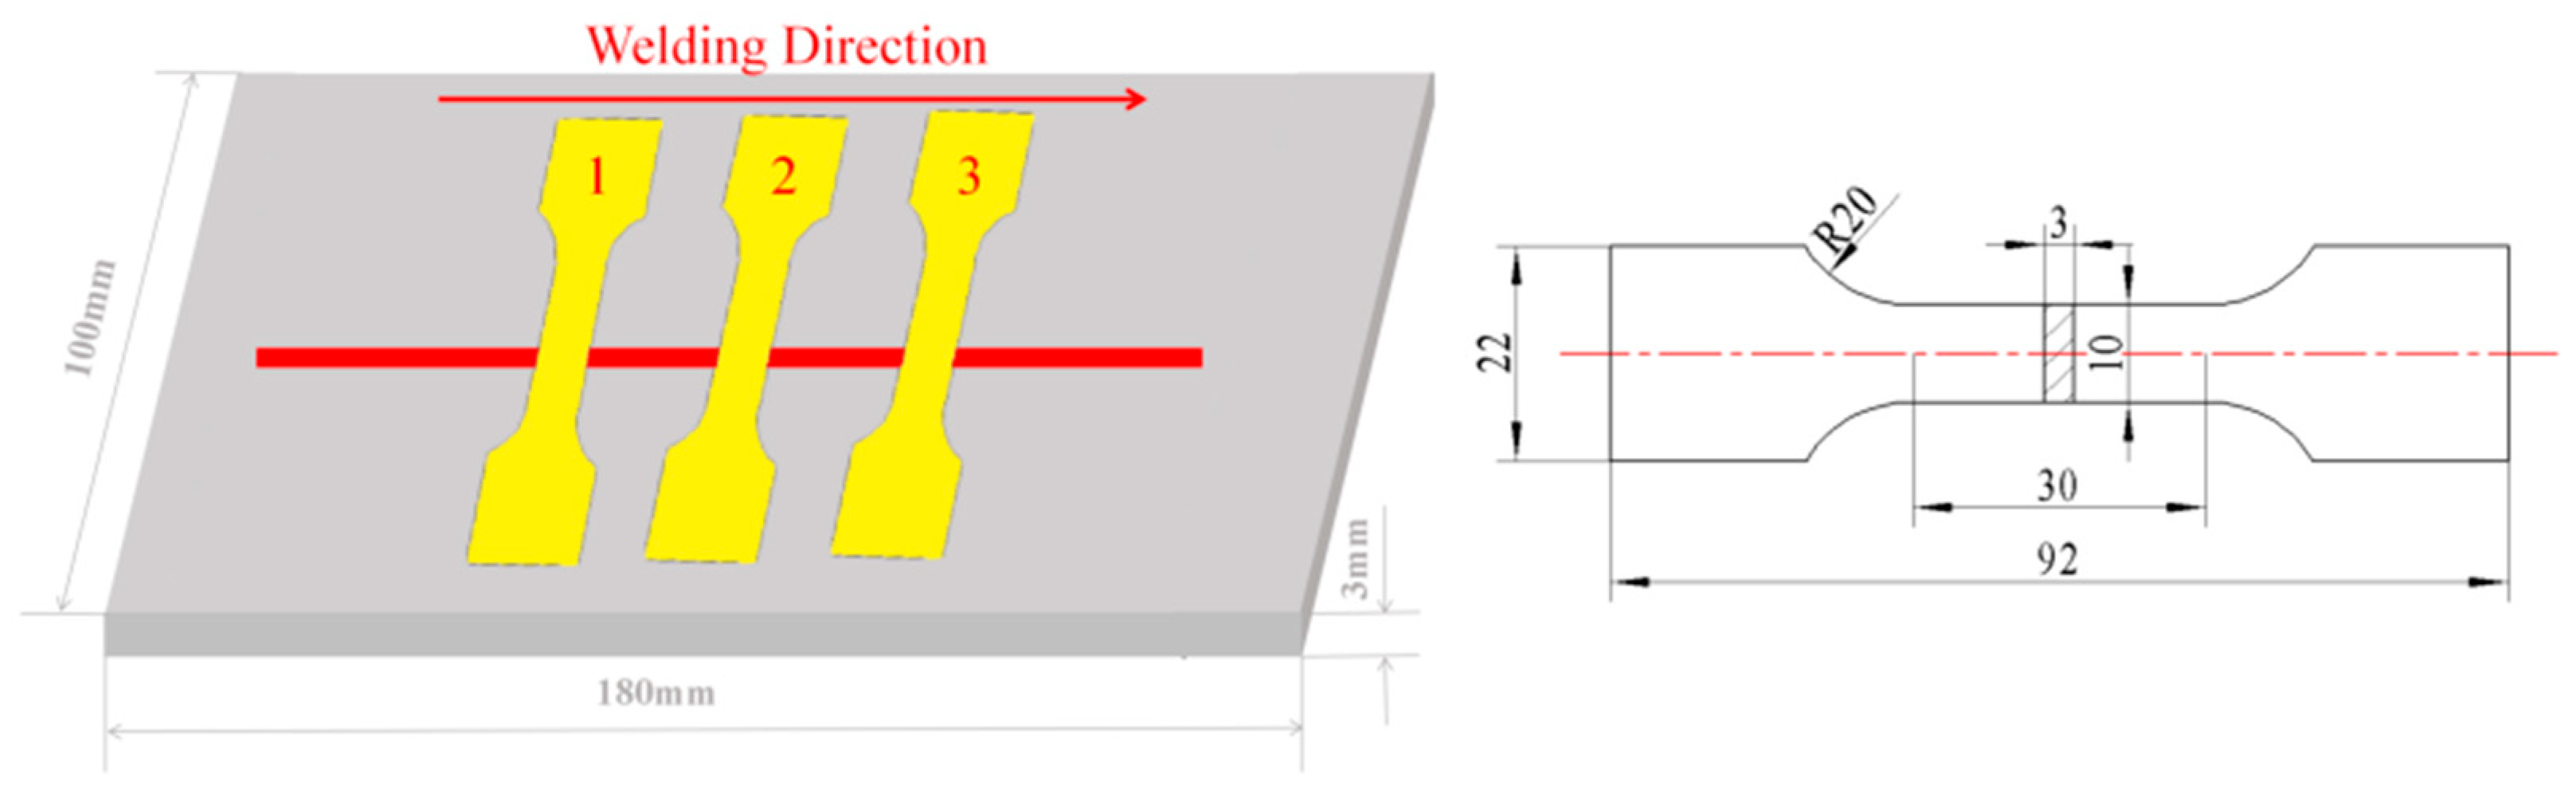
2. Materials and Methods

The base metal was 2A14-T6 aluminum alloy for this test, and the specification was 180 mm × 100 mm × 3 mm3. The welding wire was 1.2 mm diameter ER2319 wire made by Schaefer in France, and the main chemical components of the base metal and the welding wire are listed in Table 1. Before the welding test, the base material was pretreated by acetone and sandpaper to remove the surface oxide film. The selected welding machine was the Austrian Fronius TPS 2700 digital pulse welding machine, and welding equipment was mainly composed of the CMT power supply, a welding gun, and a gas supply and clamping system as shown in Figure 1. The welding method was plate overlay welding, and the wire feed speed was kept constant. The microstructure and mechanical properties of the welded joint were studied at different welding currents. According to the results of existing studies, the design welding current is shown in Table 2, where the welding heat input was calculated according to Equation (1) [21], where E denotes heat input, η denotes heat transfer efficiency and is taken as 0.8 in the present case [22,23], Ui denotes welding voltage, Ii denotes welding current, and v denotes welding speed. The welding shielding gas was 99.9% argon gas, and the welding speed was 8 mm/s.
E = η × U i I i / v
After welding, the optical microscope (OM) scanning electron microscope (SEM), energy dispersive spectroscopy (EDS), electron backscattered diffraction (EBSD), microhardness and tensile specimens were cut by a wire cutting method. The OM specimen size was 10 × 20 × 3 mm3, the metallographic specimens were grinded, polished and corroded by Keller’s reagent (HF:HCl:HNO3:H2O = 1:1.5:2.5:95). Observation of the organization of welded joints was conducted using an Axio lmager Zeiss optical microscope. The microhardness testing results were obtained using an HXD-1000TM Vickers hardness tester for specimen size in 10 × 25 × 3 mm3. The microhardness points were distributed in the direction perpendicular to the welding center at one point, taking every 1 mm. Three samples were randomly selected for each mechanical property test. The final testing result of mechanical performance was that of the average for the three samples. The microstructure of welded joints with dimensions of 8 × 8 × 3 mm3 was observed and analyzed using a JEM-7001F field emission scanning electron microscope. The grain size and shape distribution of specimens were analyzed using the JSM7400 probe Pegasus XM2 (EBSD) with energy spectrometer (EDS). Tensile testing was conducted by an SHT-4605 type microcomputer-controlled electro-hydraulic servo universal testing machine, selecting 90 A, 105 A and 120 A welding current for welding. The weld was in the center of each of the three tensile specimens, taking into account room temperature, tensile direction and tensile size as depicted in Figure 2. Three samples were randomly selected for each mechanical property test, as shown in Figure 2 1–3. The final testing result of mechanical performance was that of the average for the three samples.

3. Results and Discussion

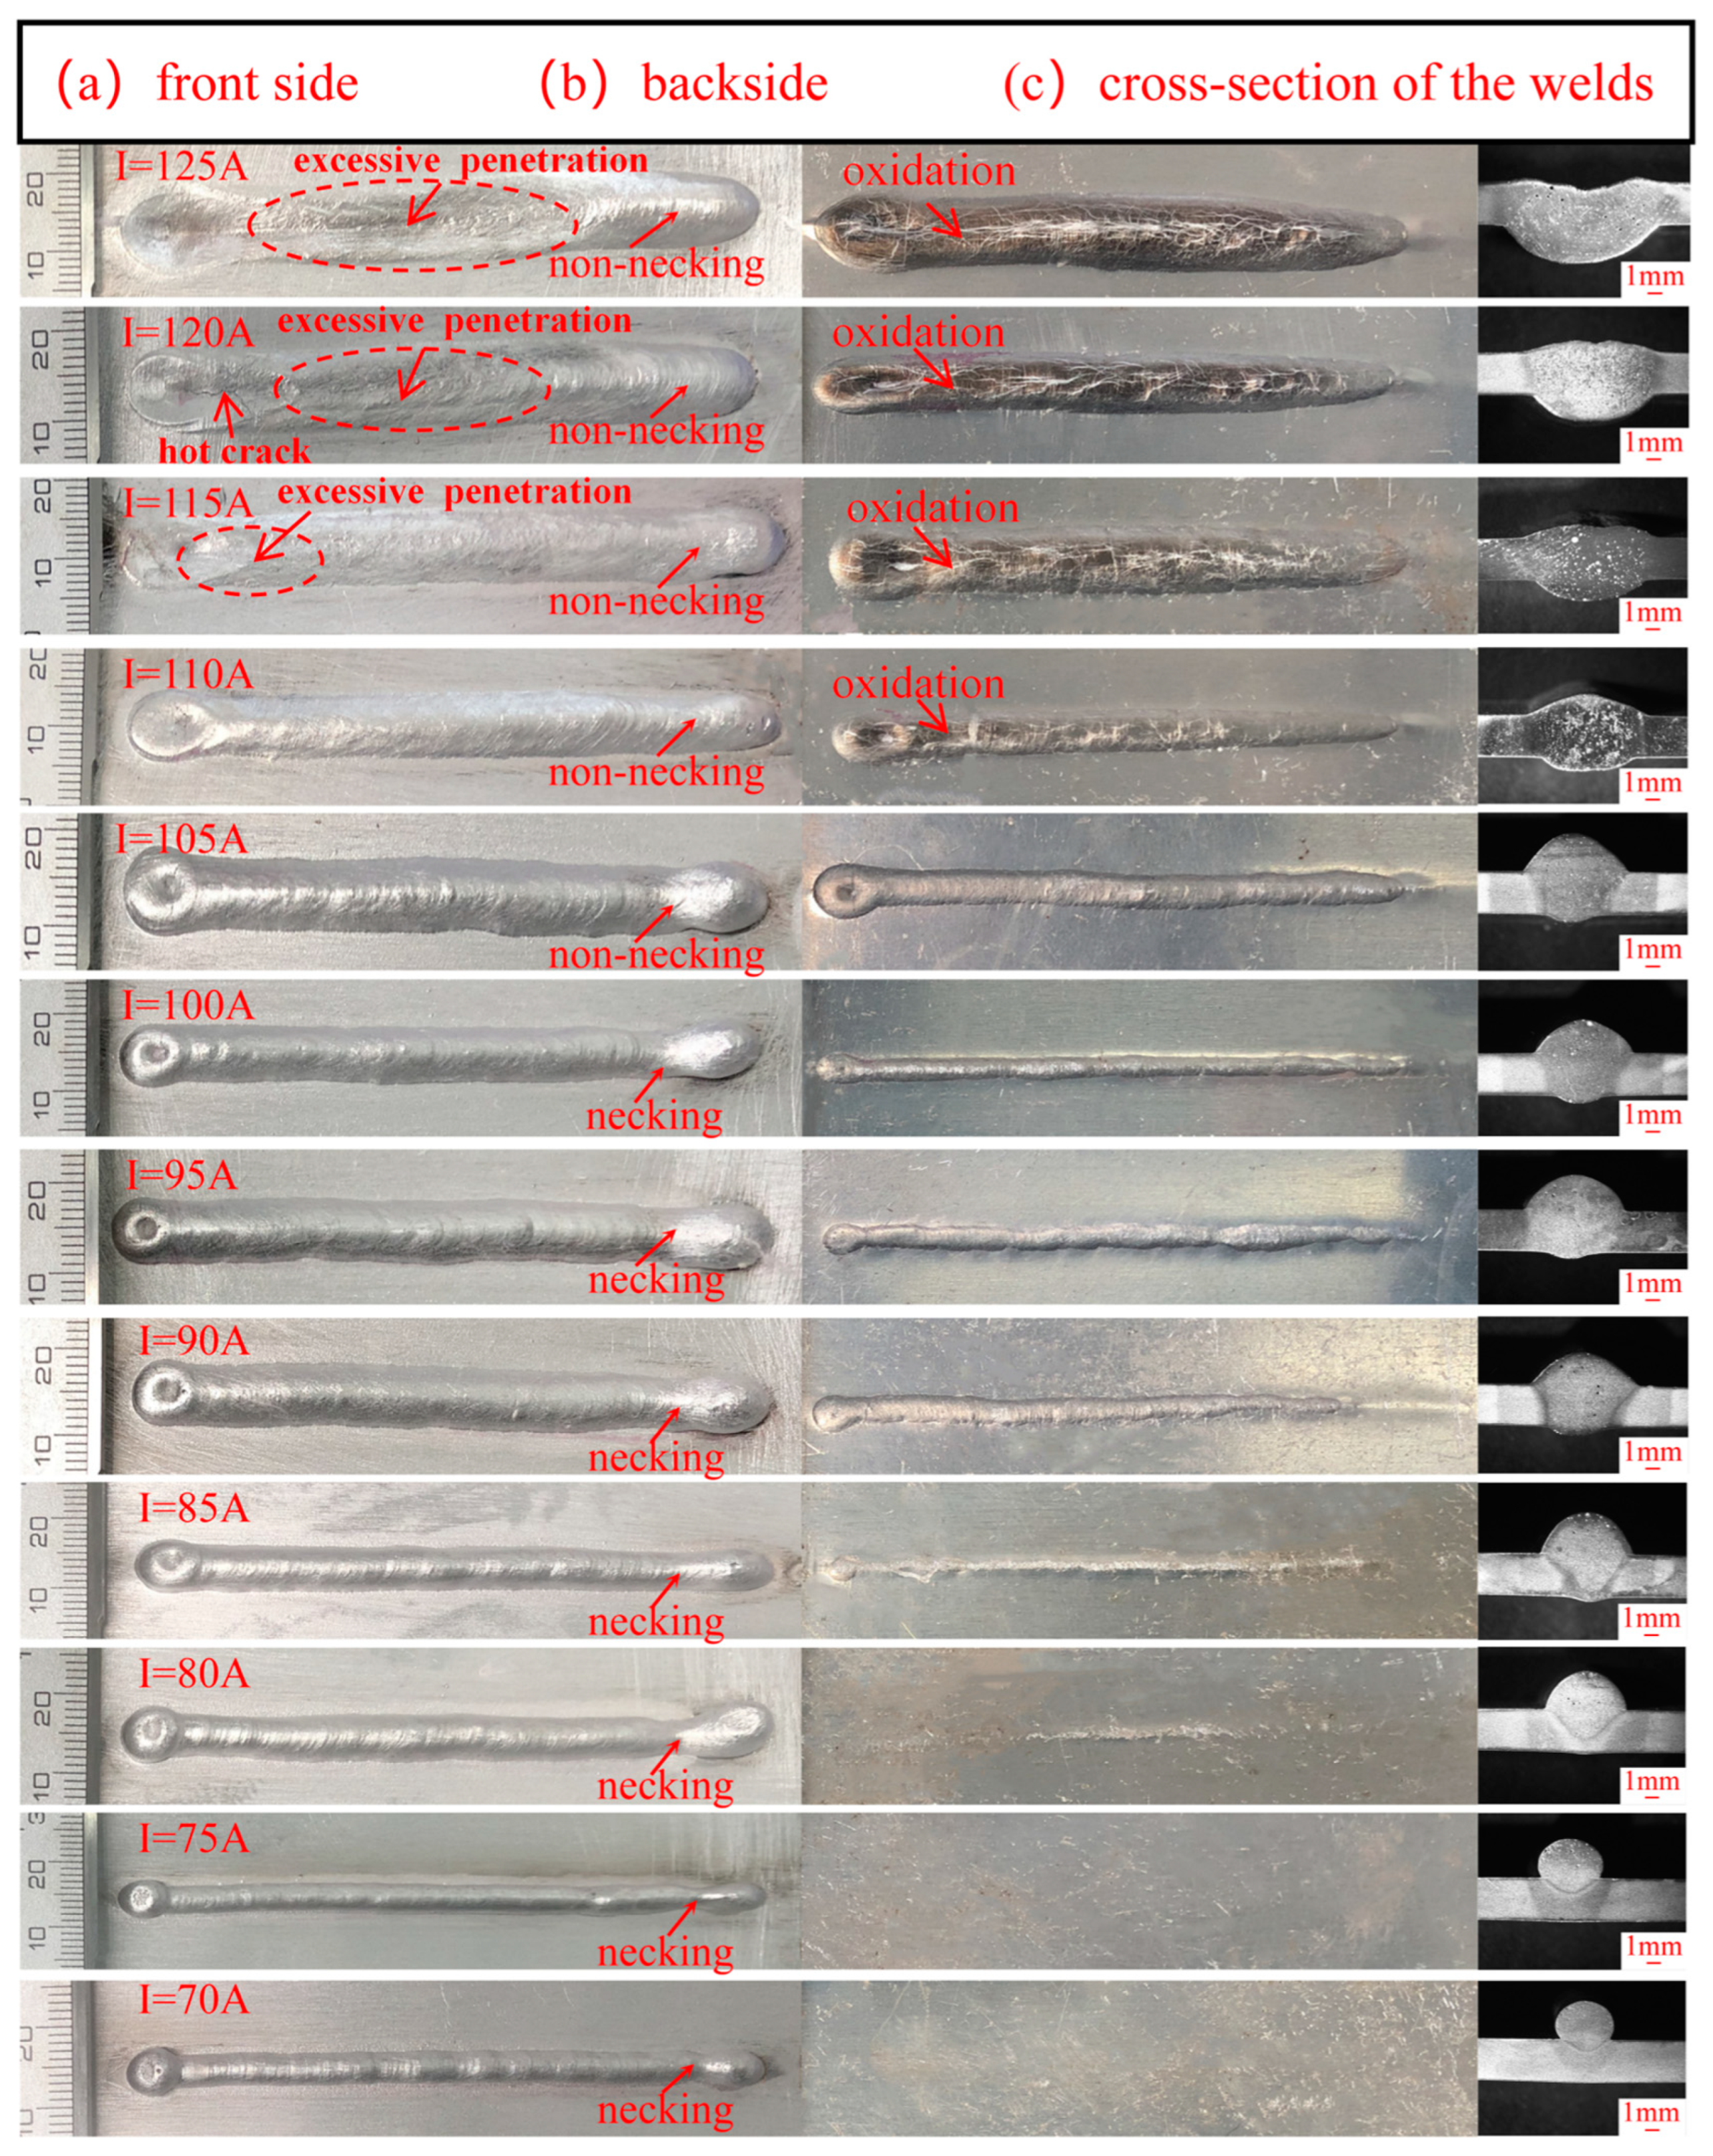
3.1. Analysis of Weld Surface Morphology

Figure 3 presents the appearance and sectional shape of the weld seam under different heat inputs. When the welding current was 120–125 A, the weld melt width was wider. There was collapse of the weld caused by a larger welding heat input. The closing arc area showed obvious welding heat cracks when the current was 120 A. Welding collapse also occurred in the closing arc area when the welding current was 115 A. When the welding current was 105 A, the melt width and depth were moderate, and the weld was well formed on the front and back surfaces, without defects such as unfused, unwelded, cracks and collapsed welds. When the welding current was reduced to 70–85 A, there was a failure to melt through and the neck appeared to shrink in the starting arc area, caused by a relatively small welding heat input. As the welding heat input decreased, the weld surface exhibited difficulty in completely forming. It can be seen that the welded joints had some degree of porosity from the welded cross-sectional morphology in Figure 3. In contrast, the weld surface and sectional morphology were well formed when current was 105 A.
The morphology of the welded joint was observed using a body microscope, and measurements of the penetration and melting width as well as the solution of the weld appearance coefficient are shown in Figure 4a–c. The weld forming appearance coefficient can be calculated according to Equation (2). Here, Φ is the form factor of weld, B is the weld width, and H is the weld penetration.
Φ = B H
As the welding current increased, the melt width of the weld gradually increased, and the weld forming factor presented a trend of first decreasing and then increasing. When the welding current was increased from 70 A to 85 A, the depth of melt increased from 0.75 mm to 2.59 mm, the weld width increased from 2.78 mm to 5.41 mm, and presented a spherical appearance. Meanwhile, the weld forming factor gradually decreased, and there was no fusion through the phenomenon. With the increase of welding current, the depth of melt increased. The melt width increased to 6.84 mm when the welding current increased to 90 A. When the welding current increased to 105 A, the melt width increased to 7.25 mm. The melt width reached up to 9.37 mm when the welding current was 120 A. In order to accurately express the characteristics of CMT welding heat input, the energy transferred to the arc should be expressed using the arithmetic mean of the instantaneous energy. The arithmetic mean energy of the entire cycle can be expressed in Equation (3):
P a v = i = 1 n U i I i ÷ n ,
where Pav is the energy of the arc, Ui and Ii are the instantaneous voltage and current values, and n is the number of points collected in a cycle. That is, the energy value is found by summing the instantaneous energy and then averaging over the entire cycle. Meanwhile, this method can also be calculated for the short circuit energy Psc. The short circuit energy is divided by the ratio of the whole cycle energy and is the ratio of short circuit energy. According to Equation (3), when the welding current increases, the arc energy increases. CMT welding can achieve precise control of welding heat input mainly through correction of current and voltage waveforms and wire retraction motion. The drop transition in CMT welding is the form of a short-circuit transition, where the drop overcomes the surface tension of the molten pool caused by surface gravity and its own gravity and falls into the molten pool by arc force, driving the flow of metal liquid in the molten pool as shown in Figure 4d.
An arbitrary area element is drawn on the surface of the molten drop; l is the length of each side of the area element, and F is the tension acting perpendicularly on each side of the rest of the surface. Here, σ the surface tension. In the steady state of welding, the melt pool shape remains constant, and the surface tension is the resistance, which is found to be constant for different welding currents. The arc force gradually increases with the increase of welding heat input according to Equation (4).
σ = F l ,

3.2. Weld Porosity

Weld porosity is one of the most common defects in the aluminum alloy welding process. The existence of porosity reduces the mechanical properties of the welded joint. Figure 5((a-1)–(c-1)) present the welded joint cross-sectional morphology for 90 A, 105 A and 120 A, respectively. Figure 5((a-2)–(c-2)) are the size and number of air holes under 90 A, 105 A and 120 A welding current. For use of CMT welding process, the welds contain a certain number of pores in different diameters, and with the increase in welding heat input, the number of pores present an increasing trend. Using nano measure software to measure and calculate the number and size of pores, it is found that the porosity of 90 A was 0.87%, that of 105 A was 0.79%, and that of 120 A was 13.64%. At a higher heat input condition, it is easy to form porosity, and it is not conducive to gas escape, thus forming a large number of porosity defects in the welded joint.
The chemical activity of aluminum is extremely strong, and its surface can quickly renew or regenerate a layer of oxide film (A12O3). This layer can then continue to thicken. Aluminum and aluminum alloy surface oxide film is not dense, and there are many capillary pores within the film. Under the environmental conditions of high relative humidity, the oxide film layer thickening is accelerated, and moisture absorption and water absorption are enhanced. Therefore, the surface oxide film can be transformed into water-containing oxide film or hydrated oxide film in the form of A12O3-H2O, A12O3-3H2O. Under the high temperature of the welding arc, the water-containing oxide film on the surface of the base material and the welding wire decomposes:
A12O3·H2O → A12O3 + H2O
3H2O + 2A1 → A12O3 + 6[H]
The dissolved atomic hydrogens enter the weld metal, and its solubility is shown in the expression of Sievert’s Law:
H = K P H 2 ,
where H is the solubility of hydrogen in the atomic state, P H 2 is the partial pressure of hydrogen above the melt pool, and K is the equilibrium constant.
In Equation (5), the hydrogen concentration in the hydrogen source is directly proportional to the greater hydrogen concentration in the hydrogen source dissolved into the melt pool during welding process. However, when the molten pool cools and solidifies, the solubility of hydrogen in the liquid metal suddenly decreases. The difference between the solubility of hydrogen in liquid aluminum and solid aluminum is nearly 20 times [24]. Due to the sudden change of hydrogen solubility, hydrogen precipitates out of liquid aluminum containing supersaturated hydrogen, which provides conditions for the formation of hydrogen pores in the weld seam. Typically, the floating velocity of the pores and the solidification rate of the melt pool determine the final size and distribution of the pores when other conditions are similar. The conditions required for pore escape are shown in Equation (6) [25].
V l = V e = 2 9 ρ l ρ g g r 2 η ,
where Vl is the solidification velocity of the melt pool, Ve is the floating velocity of the pore, ρl is the density of the melt pool, ρg is the density of the pore, g is the acceleration of gravity, r is the radius of the pore, and η is the viscosity of the melt pool.

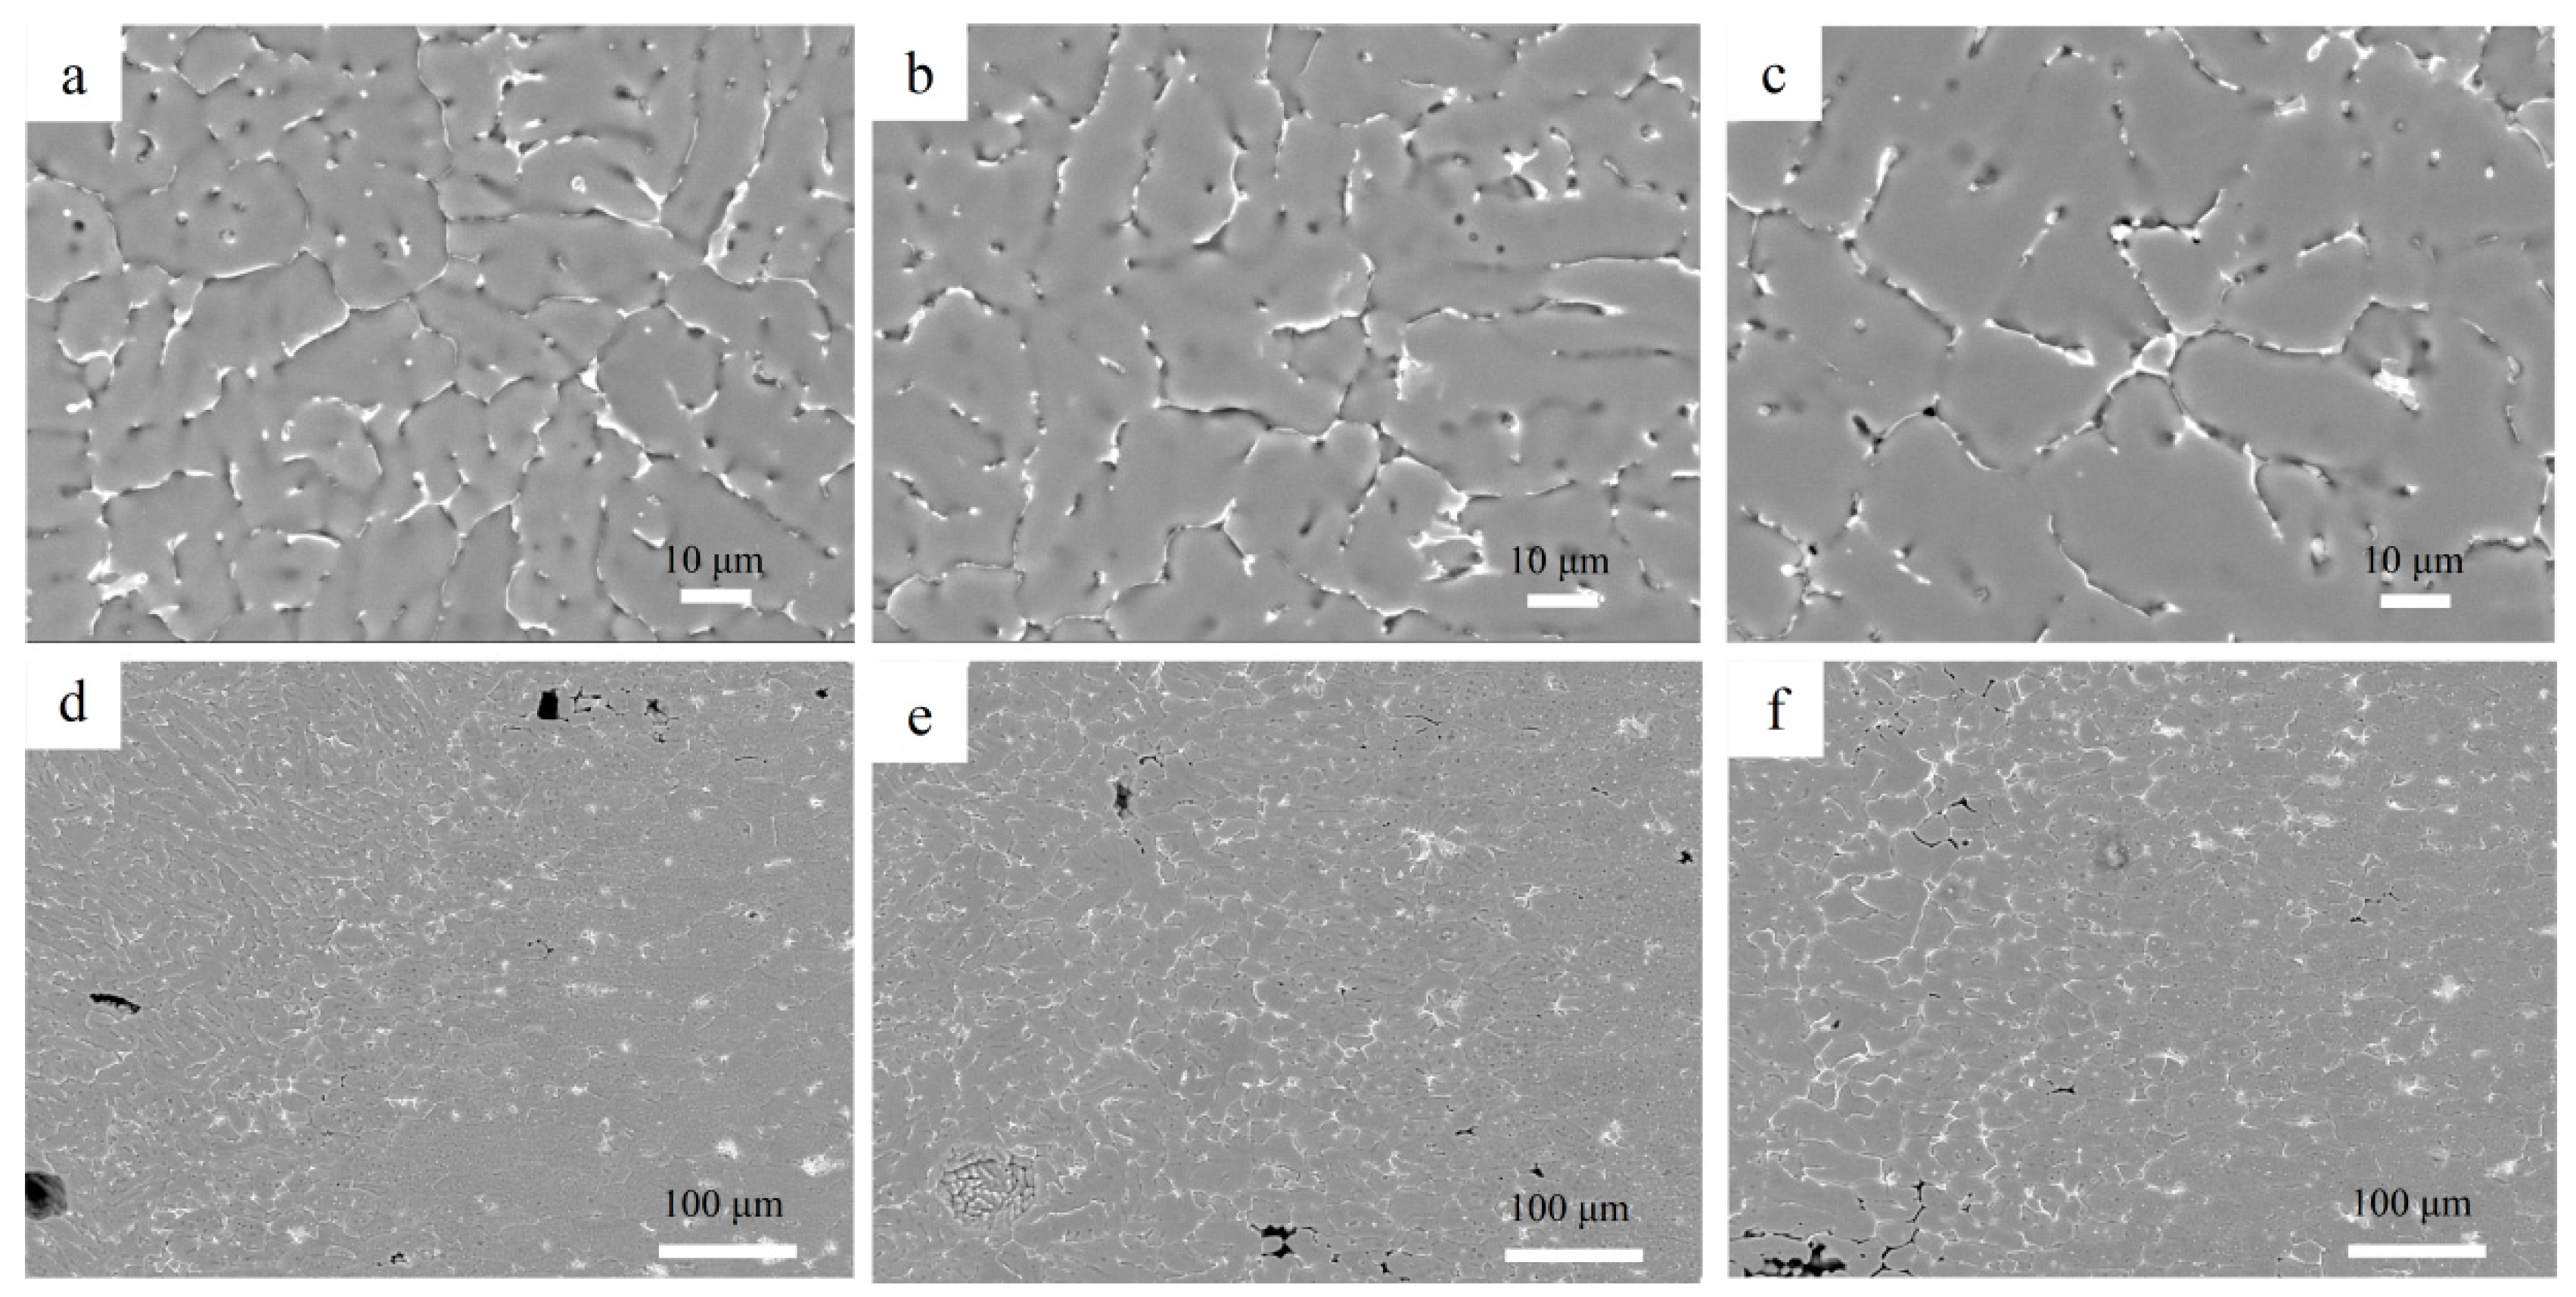
3.3. Metallographic Analysis

The microstructure of the welded joint is composed of the weld metal (WM), fusion line (FL), heat affected zone (HAZ) and base metal (BM). Figure 6 shows the microstructure of welded joints under different welding currents. As the welding current increases, the welding heat input continues to increase, and the HAZ width continues to increase. According to Figure 6a–c, the HAZ widths are 486.6 μm, 533.9 μm, and 658.7 μm, respectively. Due to the action of the welding thermal cycle, the grain appears significantly coarsened in the HAZ region near the fusion line. Figure 6d–f present the microstructure of the weld center under the action of 90 A, 105 A and 120 A currents, respectively. Based on the fusion ratio of the wire composition and the base material, it is estimated that the weld composition is still close to the base metal 2A14 alloy, which is a fine and uniform α-Al solid solution [26]. The microstructure of the WM center region has cast characteristics consisting of a large number of small equiaxed dendrites, no precipitation phase inside the grain and coarse grain boundaries for different welding heat input. When the welding current is 105 A, the dendrites appear to be coarser than those of 90 A. With the further increase of welding heat input, secondary dendrites appear when the welding current is 120 A. As the welding heat input increases, the grain size keeps its increasing trend. This is because the increase of welding heat input allows for longer grain growth time in the weld zone. When the welding heat input is reduced, grain growth can be effectively suppressed.

3.4. Microscopic Morphology of Welded Joints and EDS Analysis

Figure 7a–c are the scanning patterns of the weld centers of 90 A, 105 A and 120 A, and Figure 7d–f are the scanning patterns of the fusion lines of 90 A, 105 A and 120 A. The gray matrix is uniformly distributed with a large amount of dotted as well as massive white second phase tissue with the composition of the Al2Cu phase.
As shown in Figure 8a–c, the microstructure of the weld center is further analyzed by EDS. With the increase of welding heat input, the grain size gradually increases, the content of Cu elements decreases, and the content of Al and Mg elements increases. This is due to the fact that the equilibrium distribution coefficient of Cu elements is less than one.Therefore, the Cu element will be biased toward the grain boundaries during solidification, resulting in a matrix of poor solute elements, and the bias of Cu elements in the weld follows Sheil’s law [27]:
C s = K 0 C 0 1 f s K 0 1 ,
where Cs is the content of solute elements of the solidified material, C0 is the starting solute element content of the alloy, K0 is the equilibrium distribution coefficient of Cu elements, and fs is the percentage of solidified metal. When fs = 0, the dendrite center solidifies first, and the content of solute elements in the matrix is relatively low. Then, with the further solidification, the percentage of solidified metal increases, and the content of Cu element in the matrix increases. The final solidification is the grain boundary eutectic structure. If solidification is carried out in an equilibrium state, the content of the central Cu element between dendrite arms should be K0C0, that is, Cs = 0.17 × 5.6 = 0.952. According to Equation (7), the theoretical Cu element content can be calculated as 0.952. However, the welding solidification process contains a non-equilibrium process and the dendrites are in a certain degree of subcooling solidification. Due to the presence of subcooling, the content of Cu elements in the liquid material at the dendrite front can be increased. As the welding heat input increases, the subcooling increases, and the Cu element content in the dendrites then decreases.

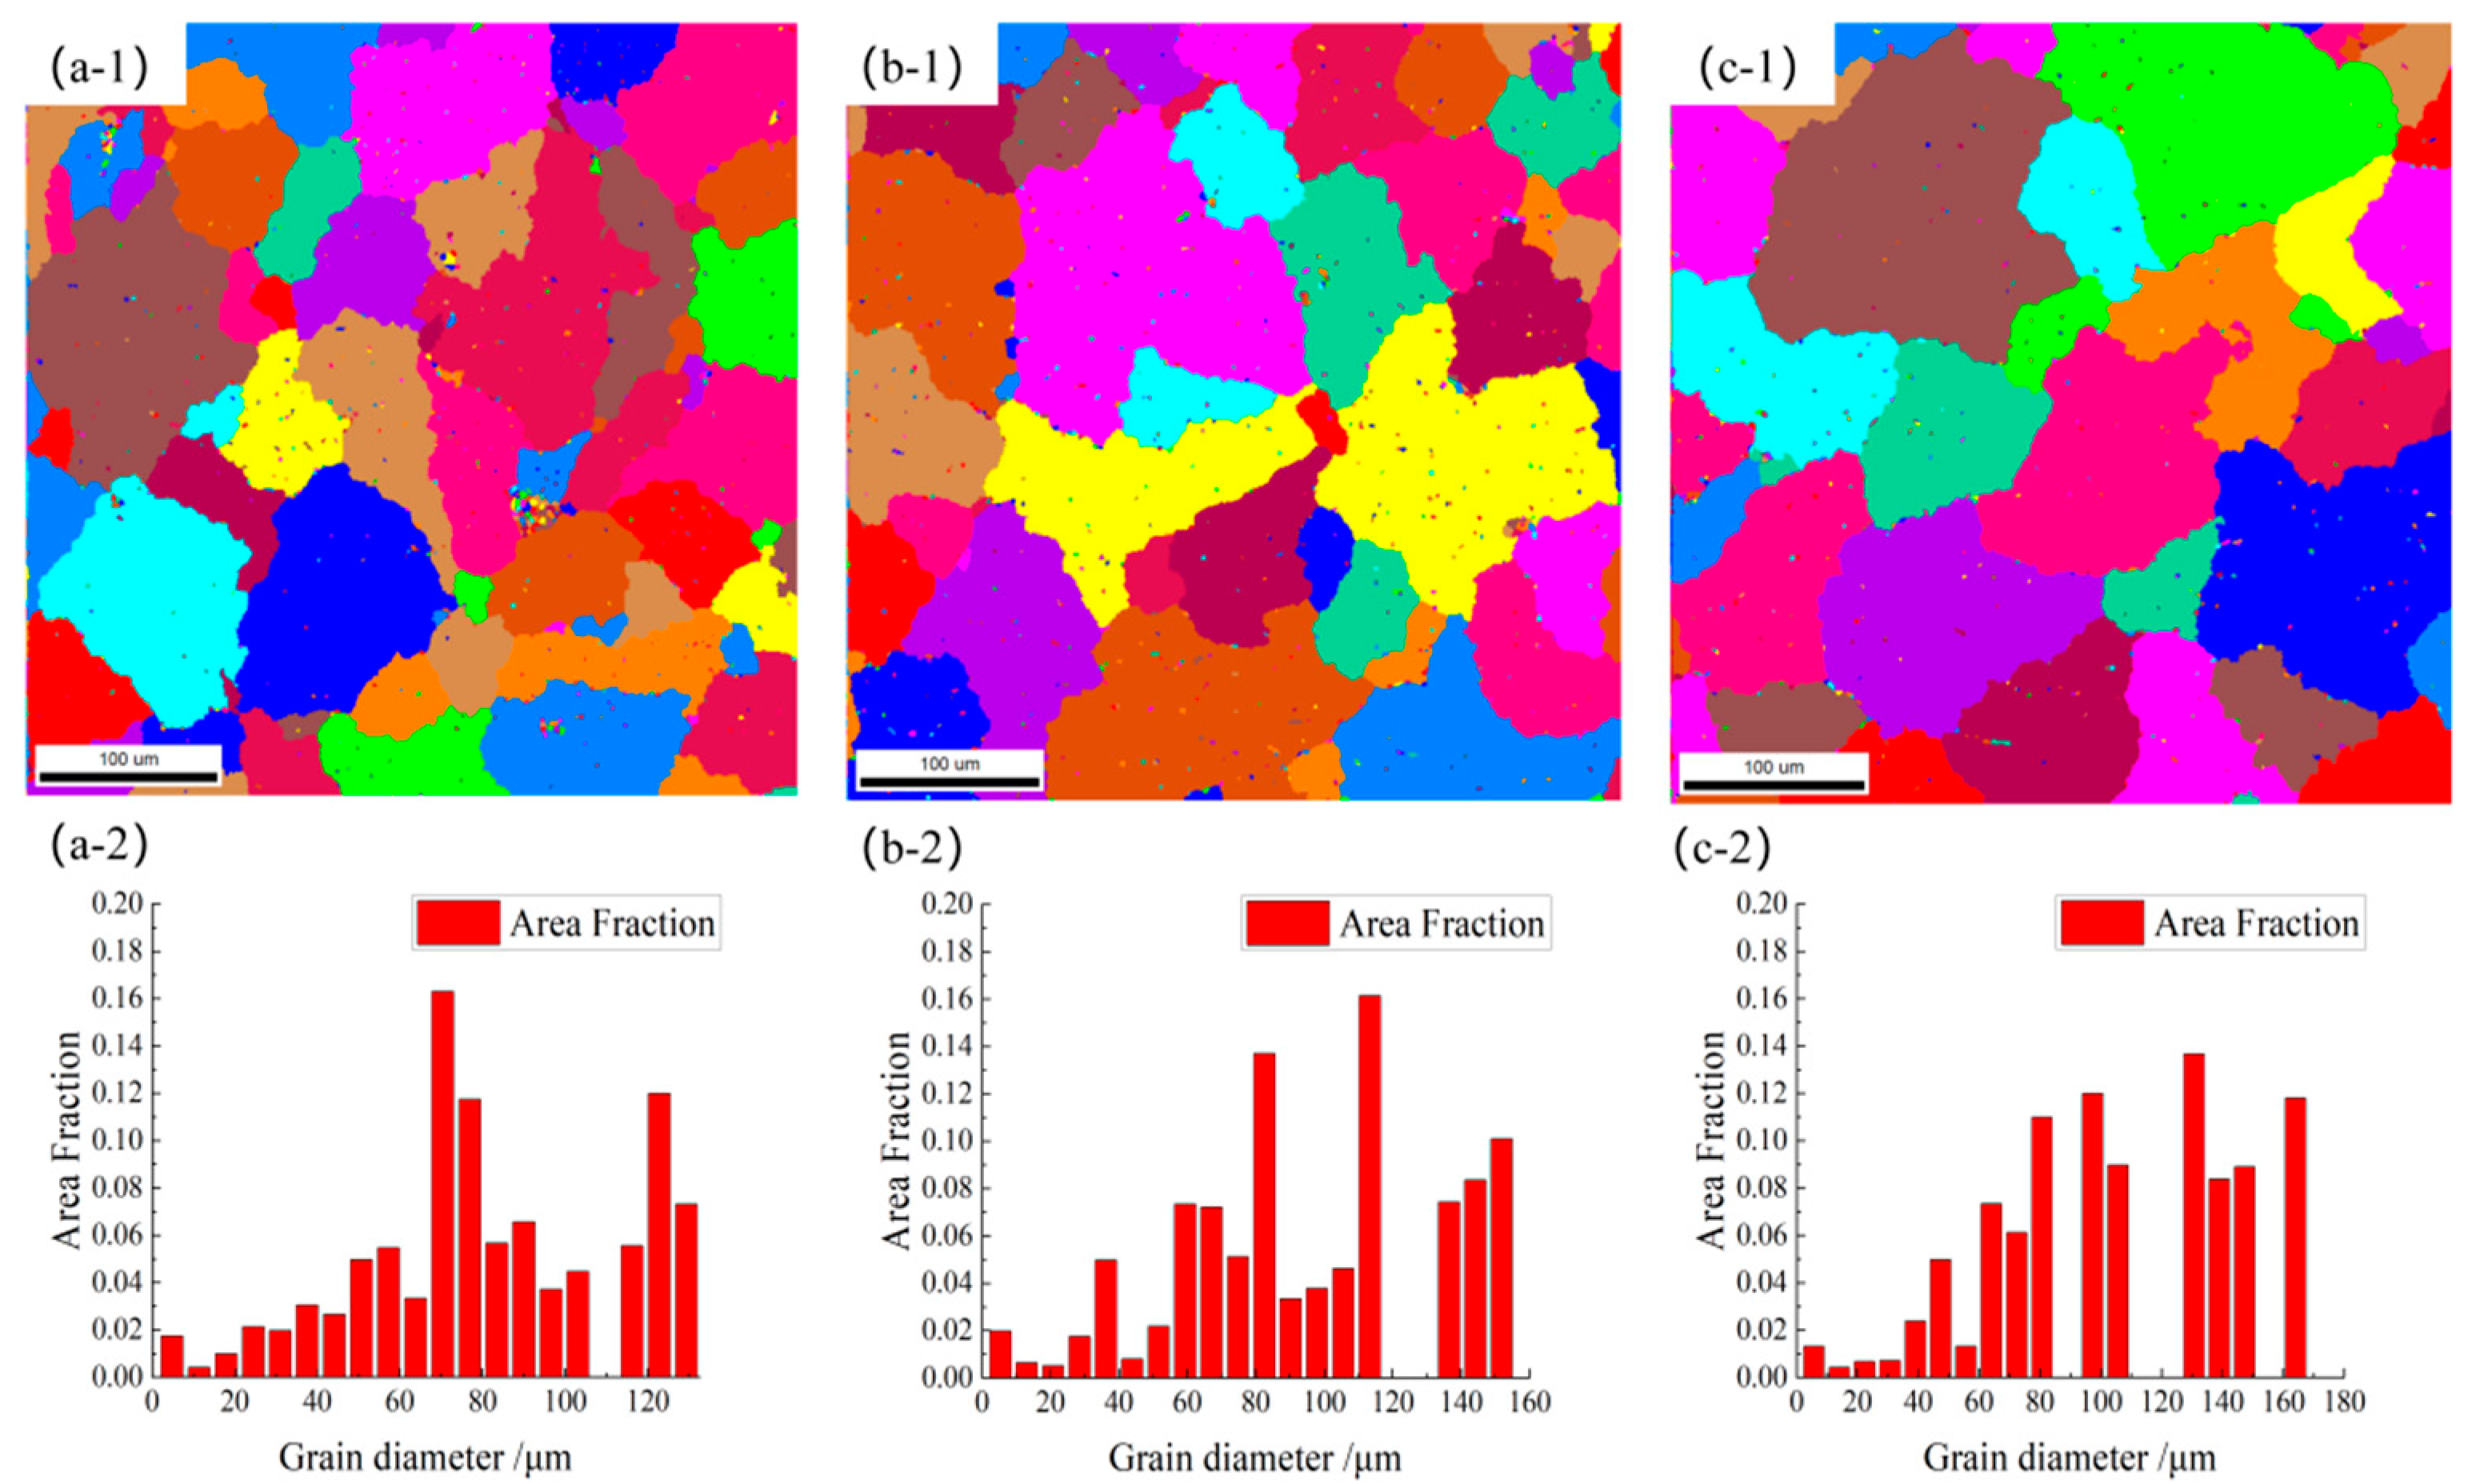
3.5. Observation of Microstructure by EBSD

The images of the EBSD welded center at different welding currents are shown in Figure 9. Figure 9((a-1)–(c-1)) present the EBSD images of the welded center at 90 A, 105 A and 120 A currents, respectively, and the grain shapes are all equiaxed crystals. As shown in Figure 9(a-2), the maximum grain size is greater than 130 μm when the welding current is 90 A. When the welding current is 105 A in Figure 9(b-2), the maximum grain size is greater than 150 μm. The maximum grain size is greater than 160 μm when the welding current is 120 A in Figure 9(c-2). It can be concluded that with the increase of welding heat input, the grain size is increasing. The reason for this phenomenon is that the liquid molten metal is at a higher temperature for a longer period of time, and the welded joint absorbs more heat to cause coarse growth of the grain.
The EBSD images near the fusion line of different welding current are shown in Figure 10. Figure 10((a-1)–(c-1)) present EBSD images near the fusion line for 90 A, 105 A and 120 A current. The grain shapes are equiaxed crystals and columnar crystals. The maximum grain size is greater than 90 μm when the welding current is 90 A, and the result is displayed in Figure 10(a-2). As shown in Figure 10(b-2), when the welding current is 105 A, the maximum grain size is greater than 110 μm. When the welding current is 120 A in Figure 10(c-2), the maximum grain size is greater than 90 μm.

3.6. Microhardness of Welded Joints

Microhardness of welded joints under different welding heat input is shown in Figure 11. The microhardness of welded joints under different welding heat input maintains relative stability, and all values appear to have a certain degree of softening. There is a softening zone in the WM, the highest microhardness of the BM. When the welding current is 105 A, the hardness in the weld area is the highest, which is due to the grain being relatively small., The precipitation phase in the grain boundary is small, and diffuse precipitation plays a certain role in strengthening. When the welding current is large, the large heat input causes a coarse grain, and the precipitation of the second phase from the common lattice gradually dissolves in the α-Al solid solution so that the common lattice effect disappears. The excessive welding heat input may also cause the burning of alloy elements, resulting in a reduction in the hardness value of the welded joint. When the welding current is small, the cooling rate is fast, and the second phase cannot precipitate uniformly, finely and diffusely, and the microhardness is lower.

3.7. Tensile Properties

Figure 12 presents the mechanical properties of the tensile specimens under different welding heat inputs. In Figure 12a, the tensile strength (Rm) and yield strength (Rel) of the base metal are 475 MPa and 419 MPa, respectively. The tensile strength (Rm) and yield strength (Rel) of 90 A reach about 67.4% and 64.6% of the BM. The tensile strength (Rm) and yield strength (Rel) of 105 A are about 61.1% and 58.7% of the BM. The tensile strength (Rm) and yield strength (Rel) of 120 A are about 51.6% and 49.6%, respectively. According to Figure 12b, with the increase in welding heat input, the surface shrinkage and elongation after break also present a decreasing trend. Figure 12c indicates tensile macroscopic morphology and tensile fracture locations of all nine groups of specimens in the HAZ.
Welding heat input will lead to burnout of Cu element in the weld area, but we rely on the Al element in the wire into the weld, which promotes the increase of the Al2Cu phase. The Al2Cu phase will hinder grain growth to a certain extent and help improve the mechanical properties, but its role is limited. With the increase of welding heat input, the mechanical properties of the weld area present a generally decreasing trend.

4. Conclusions

Different welding heat inputs are used for CMT overlay welding of a 2A14 aluminum alloy, and the microstructure and mechanical properties of the welded joints are analyzed. The following conclusions are obtained:
(1)
From the surface morphology, when the welding current is 105 A, the surface of the weld is well formed, and there are no defects, such as unfused, unwelded, cracks and collapsed welds.
(2)
With the increase of welding heat input, the melt width of the weld gradually increases, the weld forming coefficient shows a trend of first decreasing and then increasing, the grain size increases, the porosity increases, and the mechanical properties gradually decrease.
(3)
Microscopic morphological analysis shows the welded joint gray matrix uniformly distributed on a large number of points as well as massive white second phase organization, corresponding to the composition of the Al2Cu phase.
(4)
The microhardness of the welded joints under different welding heat input maintains relative stability, and there is a certain degree of softening. There is a softening zone in the WM and the highest microhardness of the BM, followed by the HAZ.

Author Contributions

Conceptualization, writing—original draft, methodology, writing—review and editing, supervision, Y.Z.; Writing—original draft, methodology, software, funding acquisition, project administration F.C.; writing—original draft, methodology, software, funding acquisition, project administration resources, S.C.; formal analysis, writing—review and editing, C.C.; visualization, supervision, R.X. All authors have read and agreed to the published version of the manuscript.

Funding

This research was funded by the National Natural Science Foundation of China (Grant No. 51765053) and the Basic Scientific Research Expenses Program of Universities directly under Inner Mongolia Autonomous Region (Grant No. JY20220123).

Institutional Review Board Statement

Not applicable.

Informed Consent Statement

Not applicable.

Data Availability Statement

All data included in this paper are available upon request by contact with the corresponding authors.

Conflicts of Interest

The authors declare no conflict of interest.

References

  1. Kleiven, D.; Akola, J. Precipitate formation in aluminium alloys: Multi-scale modelling approach. Acta Mater. 2020, 195, 123–131. [Google Scholar] [CrossRef]
  2. Policastro, S.A.; Anderson, R.M.; Hangarter, C.M. Analysis of Galvanic Corrosion Current between an Aluminum Alloy and Stainless-Steel Exposed to an Equilibrated Droplet Electrolyte. J. Electrochem. Soc. 2021, 168, 041507. [Google Scholar] [CrossRef]
  3. Wisner, B.; Mazur, K.; Perumal, V.; Baxevanakis, K.; An, L.; Feng, G.; Kontsos, A. Acoustic emission signal processing framework to identify fracture in aluminum alloys. Eng. Fract. Mech. 2019, 210, 367–380. [Google Scholar] [CrossRef] [Green Version]
  4. Zhao, W.; Wang, H.; Wang, J.; Li, Y.; Jiang, Q. Simultaneously increasing the strength and ductility of the modified casting Al–Cu alloy. J. Mater. Res. 2008, 23, 1076–1081. [Google Scholar] [CrossRef]
  5. Meng, X.; Cao, B.; Qiu, Y.; Chen, H.; Xie, Y.; Wan, L.; Huang, Y. Equal-load-bearing joining of alclad AA2024-T4 alloy stringers and skins in aviation via friction stir lap welding. J. Manuf. Process. 2021, 68, 1295–1302. [Google Scholar] [CrossRef]
  6. Yan, X.; Ma, H.; Xiong, L.; Tian, Z.; Cao, X.; Zhang, Y. Effect of lateral offset on microstructure and strength of friction stir welded 2A14-T6 aluminum alloy. Int. J. Adv. Manuf. Technol. 2018, 97, 3893–3902. [Google Scholar] [CrossRef]
  7. Lei, X.; Deng, Y.; Yin, Z.; Xu, G. Tungsten Inert Gas and Friction Stir Welding Characteristics of 4-mm-Thick 2219-T87 Plates at Room Temperature and −196 °C. J. Mater. Eng. Perform. 2014, 23, 2149–2158. [Google Scholar] [CrossRef]
  8. Mishra, R.S.; Ma, Z.Y. Friction stir welding and processing. Mater. Sci. Eng. R Rep. 2005, 50, 1–78. [Google Scholar] [CrossRef]
  9. Kumar, K.S.A.; Murigendrappa, S.M.; Kumar, H. Experimental investigation on effects of varying volume fractions of SiC nanoparticle reinforcement on microstructure and mechanical properties in friction-stir-welded dissimilar joints of AA2024-T351 and AA7075-T651. J. Mater. Res. 2019, 34, 1229–1247. [Google Scholar] [CrossRef]
  10. Wan, Z.; Meng, D.; Zhao, Y.; Zhang, D.; Wang, Q.; Shan, J.; Song, J.; Wang, G.; Wu, A. Improvement on the tensile properties of 2219-T8 aluminum alloy TIG welding joint with weld geometry optimization. J. Manuf. Process. 2021, 67, 275–285. [Google Scholar] [CrossRef]
  11. Sahoo, A.; Tripathy, S. Improvement in Depth of Weld Penetration During TIG, Activated-TIG, and Pulsed TIG Welding: A Review. Int. J. Manuf. Mater. Mech. Eng. 2021, 11, 68–86. [Google Scholar] [CrossRef]
  12. Pickin, C.G.; Young, K. Evaluation of cold metal transfer (CMT) process for welding aluminium alloy. Sci. Technol. Weld. Joln. 2006, 11, 583–585. [Google Scholar] [CrossRef]
  13. Selvi, S.; Vishvaksenan, A.; Rajasekar, E. Cold metal transfer (CMT) technology—An overview. Def. Technol. 2018, 14, 28–44. [Google Scholar] [CrossRef]
  14. Feng, J.; Zhang, H.; He, P. The CMT short-circuiting metal transfer process and its use in thin aluminium sheets welding. Mater. Des. 2008, 30, 1850–1852. [Google Scholar] [CrossRef]
  15. Zhang, H.; Feng, J.; He, P.; Zhang, B.; Chen, J.; Wang, L. The arc characteristics and metal transfer behaviour of cold metal transfer and its use in joining aluminium to zinc-coated steel. Mater. Sci. Eng. A 2007, 499, 111–113. [Google Scholar] [CrossRef]
  16. Shang, J.; Wang, K.; Zhou, Q.; Zhang, D.; Huang, J.; Li, G. Microstructure characteristics and mechanical properties of cold metal transfer welding Mg/Al dissimilar metals. Mater. Des. 2012, 34, 559–565. [Google Scholar] [CrossRef]
  17. Cao, R.; Wen, B.; Chen, J.; Wang, P.-C. Cold Metal Transfer joining of magnesium AZ31B-to-aluminum A6061-T6. Mater. Sci. Eng. A 2013, 560, 256–266. [Google Scholar] [CrossRef]
  18. Tian, Y.; Shen, J.; Hu, S.; Gou, J. Macrostructure, microstructure and wear performance of Al alloy cladding fabricated by CMT technique. Eng. Res. Express 2020, 2, 015026. [Google Scholar] [CrossRef]
  19. Zhu, Z.Y.; Liu, Y.L.; Gou, G.Q.; Gao, W.; Chen, J. Effect of heat input on interfacial characterization of the butter joint of hot-rolling CP-Ti/Q235 bimetallic sheets by Laser plus CMT. Heterocycles 2021, 11, 10020. [Google Scholar] [CrossRef]
  20. Singh, J.; Arora, K.S.; Shukla, D.K. Dissimilar MIG-CMT weld-brazing of aluminium to steel: A review. J. Alloys Compd. 2019, 783, 753–764. [Google Scholar] [CrossRef]
  21. Kumar, S.; Shahi, A.S.; Sharma, V.; Malhotra, D. Effect of Welding Heat Input and Post-weld Thermal Aging on the Sensitization and Pitting Corrosion Behavior of AISI 304L Stainless Steel Butt Welds. J. Mater. Eng. Perform. 2021, 30, 1619–1640. [Google Scholar] [CrossRef]
  22. Wang, L.; Wei, Y.; Zhao, W.; Zhan, X.; She, L. Effects of welding parameters on microstructures and mechanical properties of disk laser beam welded 2A14-T6 aluminum alloy joint. J. Manuf. Process. 2018, 31, 240–246. [Google Scholar] [CrossRef]
  23. Pépe, N.; Egerland, S.; Colegrove, P.A.; Yapp, D.; Leonhartsberger, A.; Scotti, A. Measuring the process efficiency of controlled gas metal arc welding processes. Sci. Technol. Weld. Join. 2011, 16, 412–417. [Google Scholar] [CrossRef] [Green Version]
  24. DuPont, J.N.; Marder, A.R. Thermal efficiency of arc-welding processes. Weld. J. 1995, 74, 406–416. [Google Scholar]
  25. Huan, P.-C.; Wang, X.-N.; Zhang, J.; Hu, Z.-R.; Chen, W.-G.; Nagaumi, H.; Di, H.-S. Effect of wire composition on microstructure and properties of 6063 aluminium alloy hybrid synchronous pulse CMT welded joints. Mater. Sci. Eng. A 2020, 790, 139713. [Google Scholar] [CrossRef]
  26. Han, Y.; Xue, S.; Fu, R.; Lin, L.; Lin, Z.; Pei, Y.; Sun, H. Influence of hydrogen embrittlement on impact property and microstructural characteristics in aluminum alloy weld. Vacuum 2020, 172, 109073. [Google Scholar] [CrossRef]
  27. Norman, A.; Drazhner, V.; Prangnell, P. Effect of welding parameters on the solidification microstructure of autogenous TIG welds in an Al–Cu–Mg–Mn alloy. Mater. Sci. Eng. A-Struct. 1999, 259, 53–64. [Google Scholar] [CrossRef]
Figure 1. The CMT welding equipment.
Metals 12 02100 g001
Figure 2. Tensile direction and size of tensile parts.
Metals 12 02100 g002
Figure 3. Appearance and cross-sectional shape of weld seam under different heat inputs.
Metals 12 02100 g003
Figure 4. Variation under different heat inputs: (a) fusion width; (b) weld penetration; (c) weld appearance factor; (d) macrodiagram of melt pool force.
Metals 12 02100 g004
Figure 5. Different welding current under the welded joint cross-sectional morphology and the number and size of pores: (a-1) 90 A; (b-1) 105 A; (c-1) 120 A; (a-2) 90 A; (b-2) 105 A; (c-2) 120 A.
Metals 12 02100 g005
Figure 6. Microstructure of welded joints under different welding currents: (a) 90 A; (b) 105 A; (c) 120 A; (d) 90 A; (e) 105 A; (f) 120 A.
Metals 12 02100 g006
Figure 7. Different welding heat input under the center of the weld and fusion line scan: (a) 90 A; (b) 105 A; (c) 120 A; (d) 90 A; (e) 105 A; (f) 120 A.
Metals 12 02100 g007
Figure 8. Welded center EDS: (a) 90 A; (b) 105 A; and (c) 120 A.
Metals 12 02100 g008
Figure 9. EBSD results near WM: ((a-1),(a-2)) 90 A; ((b-1),(b-2)) 105 A; ((c-1),(c-2)) 120 A.
Metals 12 02100 g009
Figure 10. EBSD results near the fusion line: ((a-1),(a-2)) 90 A; ((b-1),(b-2)) 105 A; ((c-1),(c-2)) 120 A.
Metals 12 02100 g010
Figure 11. Microhardness of welded joints under different welding heat input.
Metals 12 02100 g011
Figure 12. Mechanical properties under different weld heat input: (a) tensile strength and yield strength; (b) shrinkage at section and elongation after break; (c) macroscopic photos of tension.
Metals 12 02100 g012
Table 1. Chemical compositions of 2A14 aluminum alloy and ER2319 filler metal (wt. %).
AlloysAlMnMgTiSiCuZrFeVZn
2A14-T6Bal.0.591.680.151.244.480.810.430.29-
ER2319Bal.0.240.0090.140.136.200.130.16-0.01
Table 2. Weld parameters of 2A14 aluminum alloy and ER2319 filler metal.
Sample No.Welding Current/AWelding
Voltage/V
Heat Input E/(J·mm−1)Sample No.Welding
Current/A
Welding
Voltage/V
Heat Input E/(J·mm−1)
112515.1188.879512.7120.7
212014.5174.089012.6113.4
311513.9159.998512.6107.1
411013.3146.3108012.5100.0
510513.1137.6117512.392.3
610012.8128.0127012.084.0
Publisher’s Note: MDPI stays neutral with regard to jurisdictional claims in published maps and institutional affiliations.

