Article

Microstructure and Deformation of Over-Aged Al-Zn-Mg-Cu Alloy with Fine Grains during Multiple Stress Relaxation Tests

1
Chengdu Aircraft Industrial (Group) Co., Ltd., Chengdu 610073, China
2
Shanghai Institute of Satellite Engineering, Shanghai 201109, China
3
Innovation Academy for Microsatellites, Chinese Academy of Sciences, Shanghai 201304, China
4
School of Materials Science and Engineering, Shanghai Jiao Tong University, Shanghai 200240, China
*
Author to whom correspondence should be addressed.
Metals 2022, 12(12), 2097; https://doi.org/10.3390/met12122097
Submission received: 11 November 2022 / Revised: 29 November 2022 / Accepted: 1 December 2022 / Published: 6 December 2022

Abstract

:
Strong obstacles can greatly impede the motion or transmission of dislocations, which can be reflected by strain rate sensitivity and activation volume. In this study, the strain rate sensitivity and activation volume of overaged Al-Zn-Mg-Cu alloys with a grain size of 3.1 μm fabricated by powder metallurgy were measured by two different methods: a stress relaxation test and strain rate jump test. It was found that the former method gave much higher strain rate sensitivity values. After reviewing the conventional theory of stress relaxation test, it is unreasonable that the activation volume at each cycle during the stress relaxation test is a constant. At a strain rate higher than 10−5 s−1, ln ε ˙ / τ *, which is proportional to the activation volume in the conventional theory of the stress relaxation test, increases significantly, and nearly linearly increases with the strain rate in its logarithmic form, while at a strain rate lower than 10−5 s−1, the value of ln ε ˙ / τ * is nearly a constant. The grain boundary sliding mechanism was incorporated into the plastic deformation during the stress relaxation test, and the strain rate sensitivity and activation volume obtained by stress relaxation after modification agree well with that obtained by the strain rate jump test.

1. Introduction

Strong obstacles can greatly interact with moving dislocations, reduce the dislocation free path, and then influence the mechanical behavior of the loaded materials, which can be reflected by strain rate sensitivity (SRS) and dislocation activation volume [1,2,3,4,5]. SRS is an important material property that governs the rate-dependent mechanical properties such as creep, high-speed punching, strain rate change, etc. [6,7,8]. The mechanical properties of alloys with a positive strain rate sensitivity, such as yield strength, generally increase with strain rate, which reveals the thermally activated nature of the interaction between dislocations and local obstacles such as precipitates and inclusions. After yielding, the alloys will be plastically deformed with dislocation multiplication and interaction under continuous loading. Additionally, the alloys exhibit the phenomenon of work hardening as it is shown in the stress–strain curves which can be described as σ ρ = σ 0 + α G b M ρ γ ˙ / γ 0 ˙ 1 / m , where σ is the stress, α is a constant, G is the shear modulus, b is the Burgers vector, ρ is dislocation density, M is the Taylor factor, γ ˙ is the strain rate, and m is strain rate sensitivity [9]. It is obvious that strain rate sensitivity significantly affects the work hardening rate. Moreover, the uniform elongation is influenced by strain rate sensitivity which can be described as 1 σ σ ε T , ε ˙ + m 1 0 ; thus, the strain hardening rate and strain rate sensitivity control the uniform elongation [10,11]. Therefore, physical insight into the mechanisms of SRS would enhance our understanding of the plastic deformation mechanism in ductile metallic materials.
There are two widely used methods to measure the strain rate sensitivity: one is the strain rate jump test [11,12], the other the stress relaxation test (SRT) [13,14]. The strain rate jump test is usually applied for the materials with high ductility. For example, Gupta et al. [15] investigated the SRS of Al2024 alloy over a strain rate range of 1 × 10⁻⁵ s−1 to 1 × 10⁻³ s−1 with a total elongation of 17%. It is necessary for materials to have a good ductility to change the strain rate. However, the nanostructured or ultrafine-grained (UFG) materials usually show nearly linear stress–strain curves or low elongation without a further work hardening stage [16,17]. Therefore, the stress relaxation test is usually applied to measure the strain rate sensitivity of nanostructured or UFG materials.
The stress relaxation test is often used to measure SRS which involves intermittent pause of the cross-head of the hard machine at a specific stress or strain value. The samples will continue to be deformed plastically at the expense of elastic deformation of the hard machine. Using this method, some researchers [18,19,20] have investigated the deformation mechanism of nanograined, nanotwinned, and coarse-grained metals by the stress relaxation test, indicating the important intrinsic role of grain boundary sliding in nanograined metals and the interaction between dislocations and twins. Li et al. [21] explored the deformation transition mechanism around the cellular boundaries in AlSi10Mg alloys fabricated by laser powder bed fusion and characterized the dependence of the activation volume on intrinsic cellular structures. Lee et al. [22] studied the effect of the precipitates on the stress drop behavior by comparing three different temper statuses: solid solutioned, underaged, and peak aged. However, these studies, especially on the nanostructured or ultrafine-grained materials, have not taken the grain boundary sliding mechanism into consideration. Guo et al. [23,24,25] found an obvious size effect of the materials when investigating the tensile stress relaxation behavior of thin copper wires with diameters of 20, 35, and 50 μm, and they pointed out that the dislocation activation volume decreases and strain rate sensitivity increases with decreasing sample diameters. They tried to explain this phenomenon with the expression: 1 V d = 1 V 0 + k ε 2 m T τ c V c d 1 / 2 1 4 1 ξ α r 1 α r 1 ; however, this modification does not directly incorporate the grain size effect into the stress relaxation theory and the linear fitting is needed. Additionally, Jun et al. [26] found that the SRS measured by the stress relaxation test is one order of magnitude higher than the SRS measured by the strain rate jump test in a single α phase within a dual-phase Ti alloy. This may have resulted from overlooking the grain size effect. Therefore, it is necessary to review the theory of the stress relaxation test for measuring the SRS and to develop a new method to take the grain boundary sliding mechanism into consideration.
This study was conducted to review the validity of the conventional theory of the stress relaxation test to measure the activation volume or SRS by examining overaged Al-Zn-Mg-Cu alloys with fine grains and thus revealing the deformation mechanism. The alloys were fabricated by powder metallurgy. The formed precipitates were nonshearable, and thus the dislocations would bypass the precipitates in the form of Orowan loops. To verify the reasonability of the assumption of the conventional stress relaxation theory, the activation volume and SRS results obtained by the stress relaxation test and strain rate jump were compared. Then, the grain boundary sliding mechanism in contrast to the dislocation activation occurrence was incorporated into the strain rate evolutions measured by the stress relaxation test. Then, the strain rate sensitivity in each cycle of the stress relaxation test was recalculated.

2. Experimental Procedure

2.1. Investigated Materials

The Al-10 wt. % Zn-2.5 wt. % Mg-2.5 wt.% Cu alloys were fabricated by our previously reported process [27]. The alloy powders were produced by gas atomization and then spark plasma sintered at 480 °C. Then, the sintered compacts were hot-extruded at 450 °C. The extruded Al-Zn-Mg-Cu alloys were then solution-treated at a temperature of 475 °C for 1 h followed by aging at 180 °C for 24 h.

2.2. Microstructure Characterization

The microstructures of the as-extruded and as-aged samples were characterized with a TESCAN MAIA3 scanning electron microscope (SEM) equipped with a BRUKER e-FlashHR electron backscattered diffraction (EBSD) detector (Bruker, Germany). The samples for the EBSD experiment were prepared by polishing with 5, 1.5, and 0.5 μm diamond colloidal solution and then followed by polishing with EM TIC 3× for 1.5 h. The precipitates formed during aging were characterized with a Talos F2000X equipped with a scanning transmission electron microscopy (STEM) detector operated at 200 kV. The TEM specimens were prepared by cutting a disc with a thickness of 1 mm, and the disc was subjected to twin-jet electropolishing in a mixture of 70 mL nitric and 210 mL methanol at the temperature of −30 °C at the working voltage of 20 V.

2.3. Mechanical Test

The mechanical properties of the alloys were obtained by tensile tests under room temperature on a Zwick/Roell machine at a strain rate of 1 × 10⁻⁴ s−1. The size of the specimens was 5 mm in diameter and 25 mm in gauge.
Stress relaxation tests were conducted on a Zwick/Roell machine under room temperature. The size of the specimen for the stress relaxation test was 5 mm in diameter and 25 mm in gauge. Firstly, the specimen was stretched at a load of 10 MPa/s until the stress reached 450 MPa, which is a little higher than the yield strength of the overaged Al-Zn-Mg-Cu alloys. Then, the cross-head of the machine was fixed and held for 3 min. Then, the specimen was re-strained at the load rate of 10 MPa/s to 450 MPa followed by 3 min holding. In total, the specimens were stress relaxation tested for 4 cycles.
The strain rate jump tests were also conducted on the Zwick/Roell machine. The specimens were loaded at the strain rate of 10−4 s−1. After the plastic strain reached 0.5%, the strain rate was changed to 10−3 s−1. After the specimens were deformed with a strain of 0.5%, the strain rate was changed to 10−4 s−1. Likewise, the specimens were strained at different strain rates with a plastic strain of 0.5%.

3. Results and Discussion

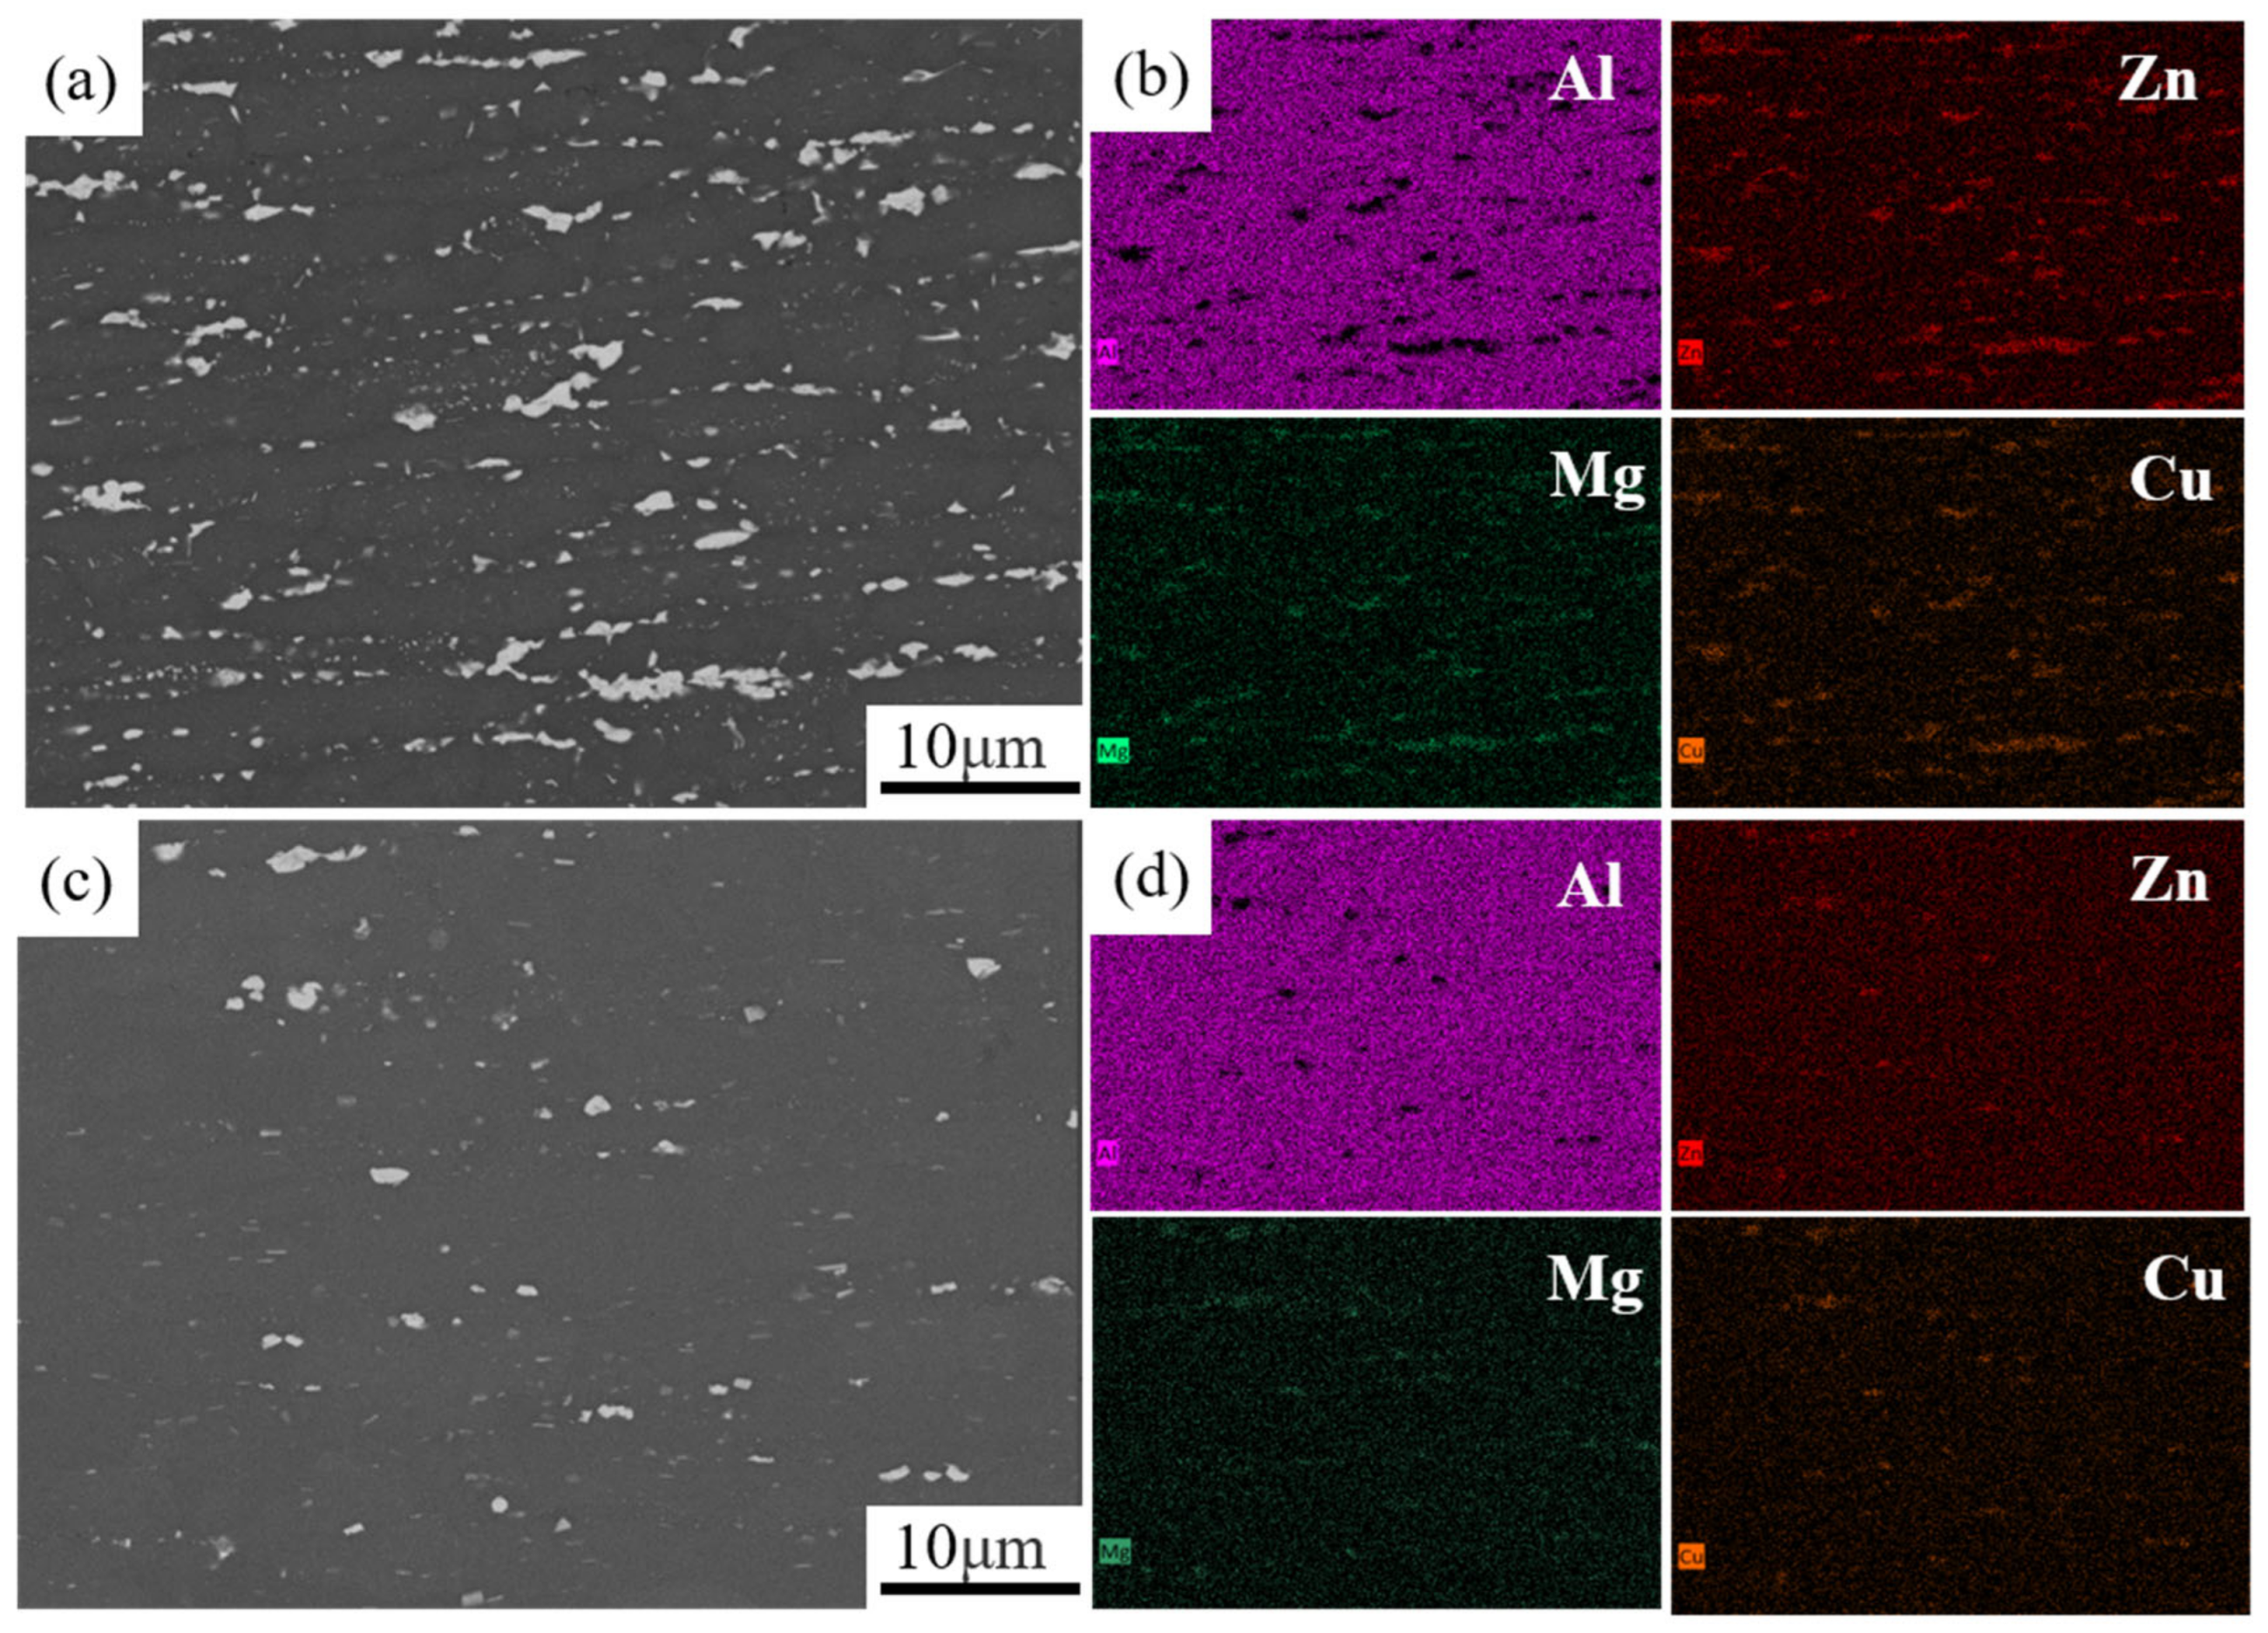
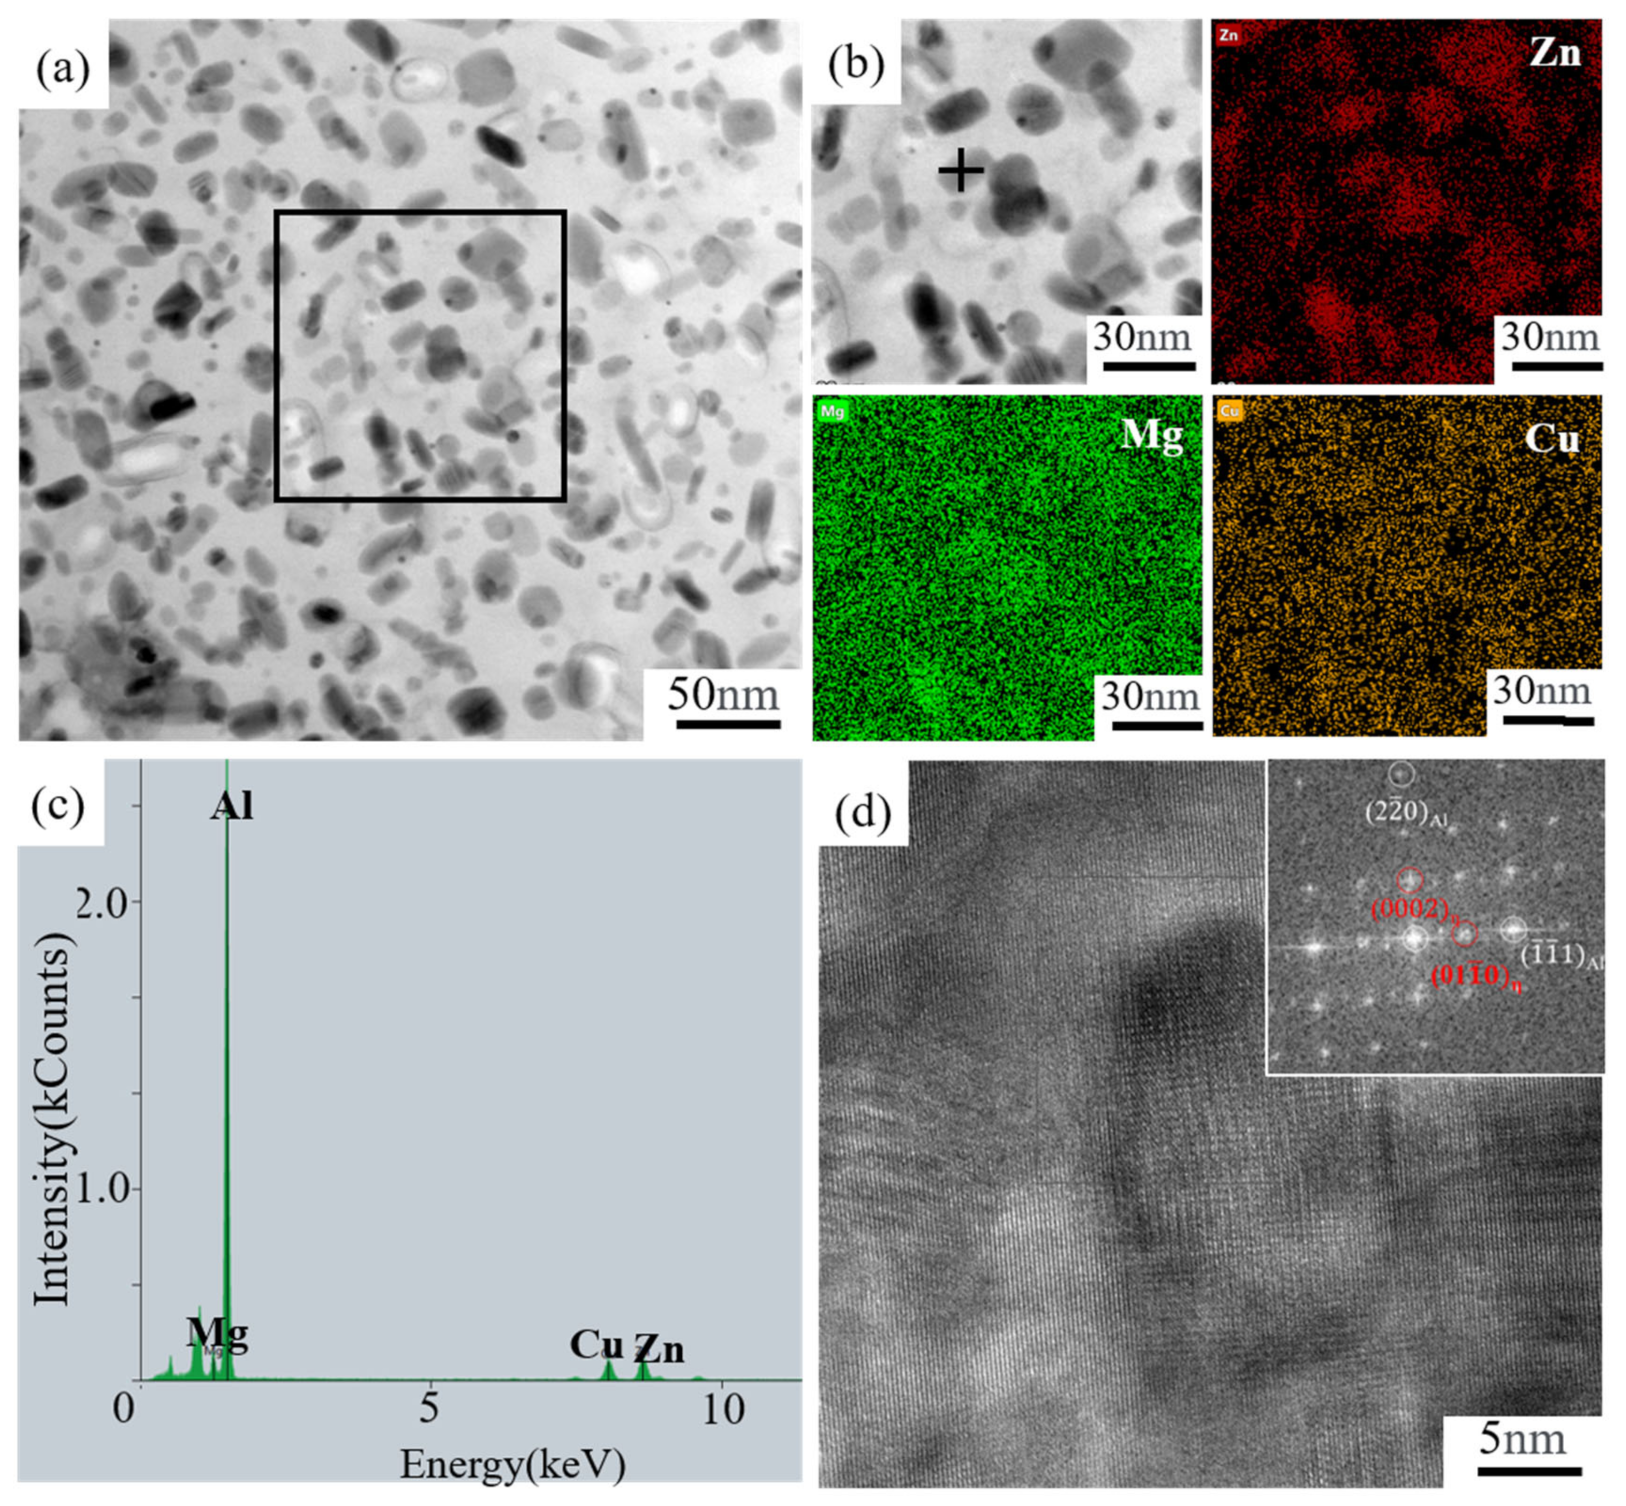
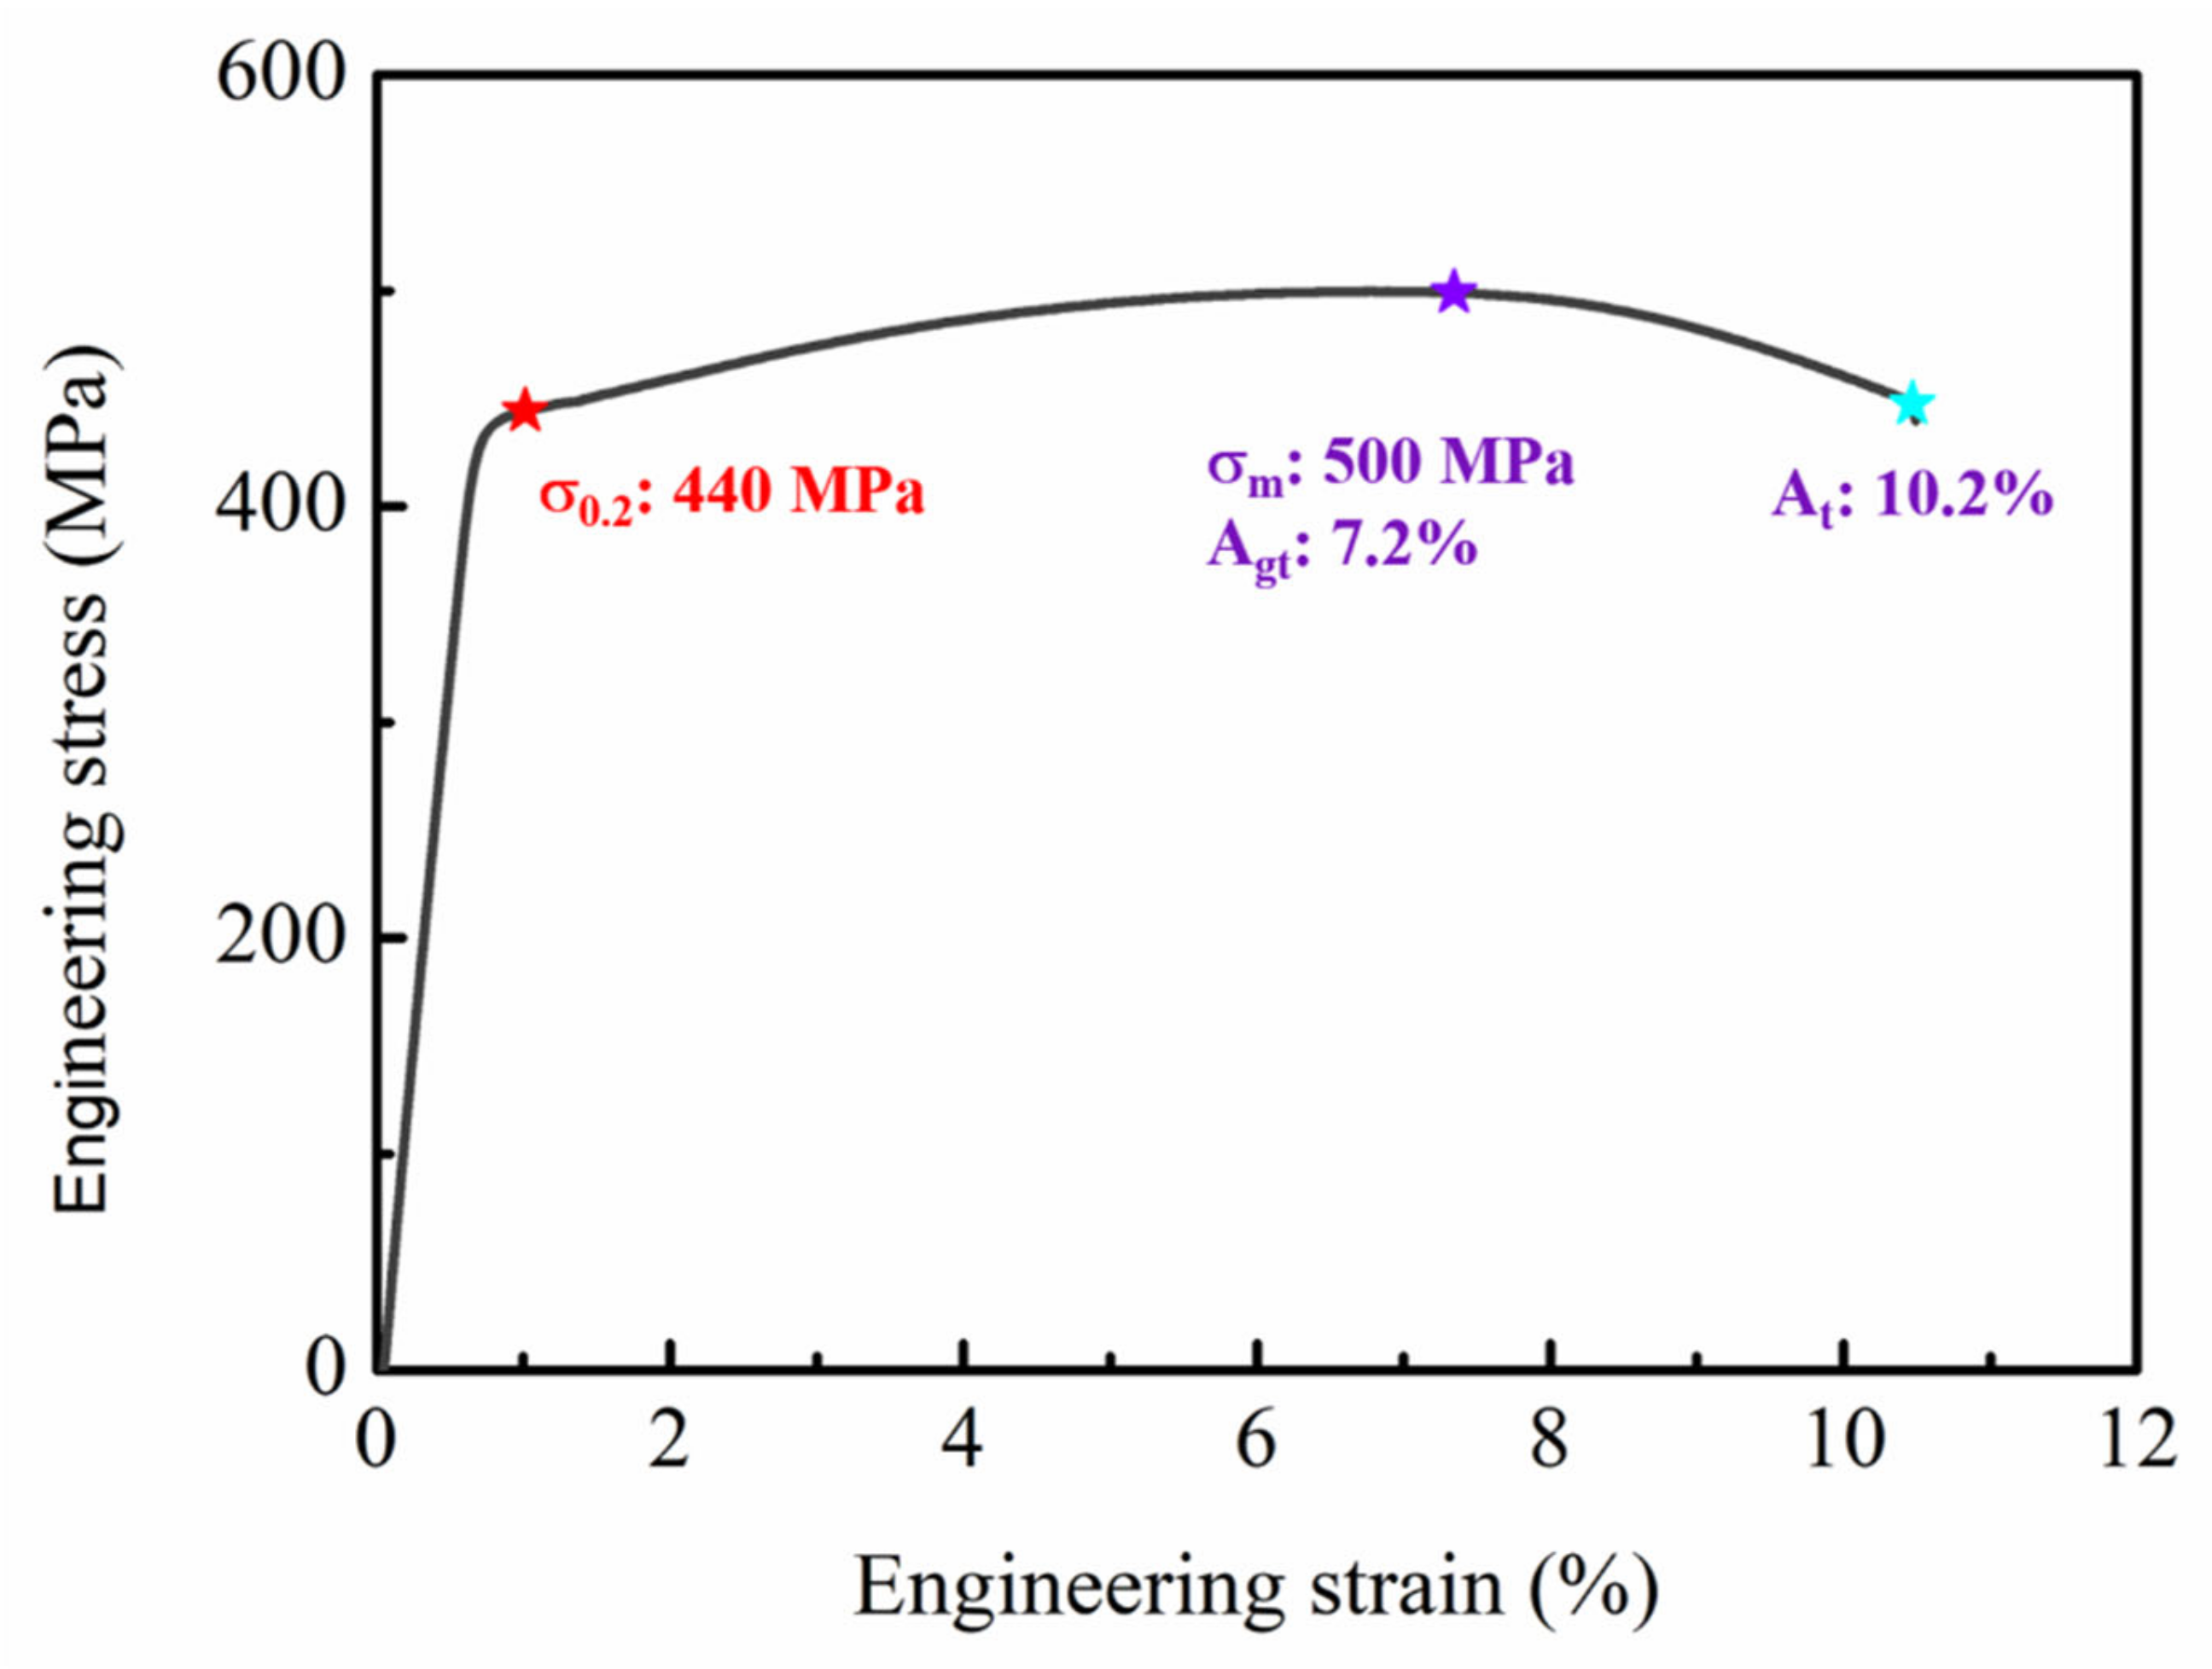
3.1. Microstructure and Mechanical Properties of the Al-Zn-Mg-Cu Alloy

Figure 1a shows the microstructure of the as-extruded Al-Zn-Mg-Cu alloy in the backscattered electron (BSE) mode, and Figure 1b shows the elemental map analysis of Al, Zn, Mg, and Cu. The phases in brighter contrast are composed of Al, Zn, Mg, and Cu and are supposed to be T(AlZnMgCu) phases. T phases are commonly formed in Al-Zn-Mg-Cu alloys [28,29]. The size of the T phases in the present study is significantly smaller than the T phases in cast alloys [29]. T phases in cast alloys are usually formed at the grain boundaries. After heat treatment, most interphases are dissolved into the matrix, and some residual interphases can still be observed, as shown in Figure 1c,d. The phenomenon that the primary coarse particles cannot be dissolved completely into the matrix is common in the Al-Zn-Mg-Cu alloys, especially with a high content of Zn.
Figure 2a shows the inverse pole figure (IPF) of the overaged Al-Zn-Mg-Cu alloy, and the average grain size is 3.1 μm as shown in Figure 2b. There are also 16% in number percent of grains with a size smaller than 1 μm. In our previous work [30,31], the microstructures of the alloy powders, composite powders, spark plasma sintered alloy compacts, and sintered composite powders were systematically investigated. It was found that the grain size of powders was generally in the range of 500 nm to 4 μm depending on the powder size. The grain size of the alloy compacts had a small increase to 4.3 μm after spark plasma sintering, whereas there was no increase in the grain size of the composite compacts. Dynamic recrystallisation occurs both in alloys and composites during hot extrusion according to the EBSD pattern and grain orientation spread parameter. It is acknowledged that both continuous and discontinuous dynamic recrystallisation grains usually nucleate at the primary grain boundaries due to more stored energy [32,33]. Therefore, the fine grains with a large fraction of grain boundaries can lead to dynamic recrystallisation. The average grain size of the alloys after extrusion was 3.12 μm, which was similar to the grain size of the alloys after solution treatment in this study and larger than the grain size of alloys after sintering, which results from dynamic recrystallisation during extrusion. It is shown that the grain size of the alloys fabricated by powder metallurgy is fine during the whole fabrication process. During solution treatment, static recrystallisation might occur due to high stored energy in the deformed grains. Low KAM values (<1°) can be found in the recrystallized grains due to low dislocation density. There are also many deformed grains within high KAM values as shown in Figure 2c. In the deformed grains, there are a fraction of subgrain boundaries due to the dislocation recovery process, as shown in Figure 2d.
The as-aged alloys exhibit typical <001> and <111> fiber texture, which has been discussed in [30], resulting from the preferential activated slip systems of {111}<110> and {001}<110> under elevated temperature. The analysis was based on the stress state analysis and Schmid factor of the different slip systems. Wang et al. [34] have also studied the texture evolution during ECAP of Al-7034 alloy and concluded that only {111}<110> and {001}<110> shear systems were activated, and there was no experimental evidence of the existence of other shear systems. Mayama et al. [35] used a similar analytical method to point out the activation of basal and pyramidal-2 slip systems led into the (0001) fiber texture, and activation of (10 1 ¯ 0) [ 1 ¯ 2 1 ¯ 0] slip system led to (10 1 ¯ 0) fiber texture of the magnesium alloy during extrusion.
Figure 3a gives the bright-field TEM image of the overaged Al-Zn-Mg-Cu alloy. After the heat treatment, a large number of precipitates with an average size of 18 nm are formed, which show a plate or regular morphology. Figure 3b shows the precipitates’ morphology in higher magnification, as marked in Figure 3a, and the elemental map analysis of Zn, Mg, and Cu. Figure 3c shows the point EDS marked in Figure 3b. The precipitates are composed of Al, Zn, Mg, and Cu and are supposed to be the η phases which are substantially larger than the size of η′ of alloys in peak hardness [36] and the size of η phases in alloys overaged at 140 °C [37]. The high-resolution transmission electron micrograph (HRTEM) of the precipitate shown in Figure 3d, together with the fast Fourier transform (FFT), evidences the formation of η phase in the Al-Zn-Mg-Cu alloy at the overaged stage and confirms the orientation relationship of [2 1 ¯ 1 ¯ 0] η11//[112]Al, (0001)η11//(1 1 ¯ 0)Al, (01 1 ¯ 0)η11//( 1 ¯ 1 ¯ 1)A1 [37,38]. It should be noted that there are some very small spherical inclusions in Figure 3a which might be alumina particles. The alumina particles are inevitable in the Al powders and will also interact with dislocations during deformation. However, the size of these tiny particles is much smaller and the amount is much lower than the precipitates in the alloys. The precipitates of larger size are stronger obstacles to dislocation movement compared with these small inclusions.
Figure 4 shows the tensile stress–strain curve of the overaged Al-Zn-Mg-Cu alloys in the present work. The yield strength reaches 440 MPa, the maximum strength is about 500 MPa, the uniform elongation is 7.2%, and the fracture strain is 10.2%.

3.2. Conventional Theory of Stress Relaxation Test

During multiple stress relaxation tests, the specimen is firstly deformed in a hard tensile machine with high stiffness at a rapid applied load rate. After the applied load reaches the predetermined value, the cross-head of the machine is fixed without continuous movement, which means a fixed total strain including the elastic strain of the hard machine and the plastic strain of the specimens. However, as a result of the higher Young’s modulus of the hard machine, the reduced elastic strain of the hard machine εem will transform into the plastic strain εps of the specimen during holding at a fixed total strain [18,19,20,39]. Therefore,
ε ˙ = ε e m ˙ + ε p s ˙ = 0  
The elastic strain rate of the machine can be calculated as:
ε em ˙ = σ ˙ / M
where σ ˙ is the stress rate during the stress relaxation test, and M is Young’s modulus of the hard machine. Then, the plastic strain rate of the specimen can be obtained as:
ε ps ˙ = σ ˙ / M
The stress σ required for plastic deformation of the specimen can be decomposed into two parts: one is the internal stress σi which is often called athermal stress, the other is the thermally activated stress σ* acting on the dislocations [40]. The plastic deformation of the polycrystals involves the dislocation multiplication/annihilation and can be regarded as a thermally activated dislocation process. The most general form of the constitutive equation of the plastic deformation can be described as [41]:
γ ˙ = ν i τ * , T exp Δ G τ * , T k T
where k is the Boltzmann constant, T is the temperature, vi( τ *, T) is the pre-exponential factor, and ΔG is the activation energy. The pre-exponential factor can be described as the following expression [41]:
ν i τ * , T = θ ρ m ν b  
where θ is the Schmid factor, ρm is the density of moving dislocations, b is the Burgers vector, and ν is the vibrational frequency. The relationship between the dislocation glide velocity and plastic deformation rate can be described by the typical Orowan equation:
γ ˙ = θ ρ m b V
Therefore, the dislocation glide velocity V can be obtained according to Equations (4) and (6) as:
V = ν × e x p Δ G τ * , T k T
The activation energy ΔG(τ*, T) is dependent on the deformation temperature T and effective shear stress τ*. In most of the studies on the stress relaxation tests, the activation energy ΔG(τ*, T) is assumed to be linearly dependent on the effective stress τ* as [18,19,20,42]:
Δ G = Δ G 0 V * τ *
where V* is the dislocation activation volume and
V * = Δ G τ *
Therefore, the stress rate σ ˙ and strain rate ε ˙ can be obtained as:
σ ˙ = M ρ m ν b exp Δ G 0 V * τ * k T
ε ˙ = ρ m ν b × exp Δ G 0 V * τ * k T
By integrating Equation (10), the stress drop profile can be obtained as:
Δ σ = M k T V * ln 1 + t C r
where Cr is dimensionless time and V* is the dislocation activation volume. The activation volume V* can be obtained by fitting each cycle of the stress relaxation curve. Note that during each cycle of the stress relaxation test, the activation volume V* is assumed to be a constant which is independent of the effective stress, strain rate, and accumulative strain, as shown in Figure 5. It is observed that the stress relaxation profiles agree well with Equation (12) under the assumption of the invariable activation volume V*. Additionally, the activation volume V* decreases from 252b3 at the first cycle to 123b3 at the fifth cycle with the proceeding cycle during the relaxation test.
The strain rate sensitivity (SRS) has a significant influence on the flow stress of the polycrystals. Generally, SRS is usually defined by a differential function of stress and strain rate in their logarithmic form at a specific strain and temperature as [43]:
m = ln σ ln ε ˙
During each cycle of the stress relaxation test, the time-dependent stress and strain rates in their logarithmic form can be easily obtained. Figure 6a shows the strain-rate-dependent strain sensitivity curves at each cycle. The SRS has a small decrease with increasing strain rate in each cycle, while the SRS increases greatly with the proceeding cycle of the stress relaxation. The increase in SRS between different cycles results from the decrease in activation volume, as shown in Figure 5. The activation volume V* can be expressed as [44]:
V * = b L ω
where L is the mobile dislocation segment, and ω is the width of dislocations. With proceeding plastic deformation of the specimen, the interaction of the dislocations leads to dislocation junctions which are immobile, and the mobile dislocation segment L will become shorter. Therefore, the activation volume V* will decrease with continuous deformation. However, the plastic strain εp at each cycle, as shown in Figure 6c, and the accumulative plastic strain during the whole stress relaxation test is very small as shown in Figure 6b. The activation volume V* decreases gradually at each cycle. Therefore, the validity of the assumption that the V* is a constant at each cycle is doubtful.

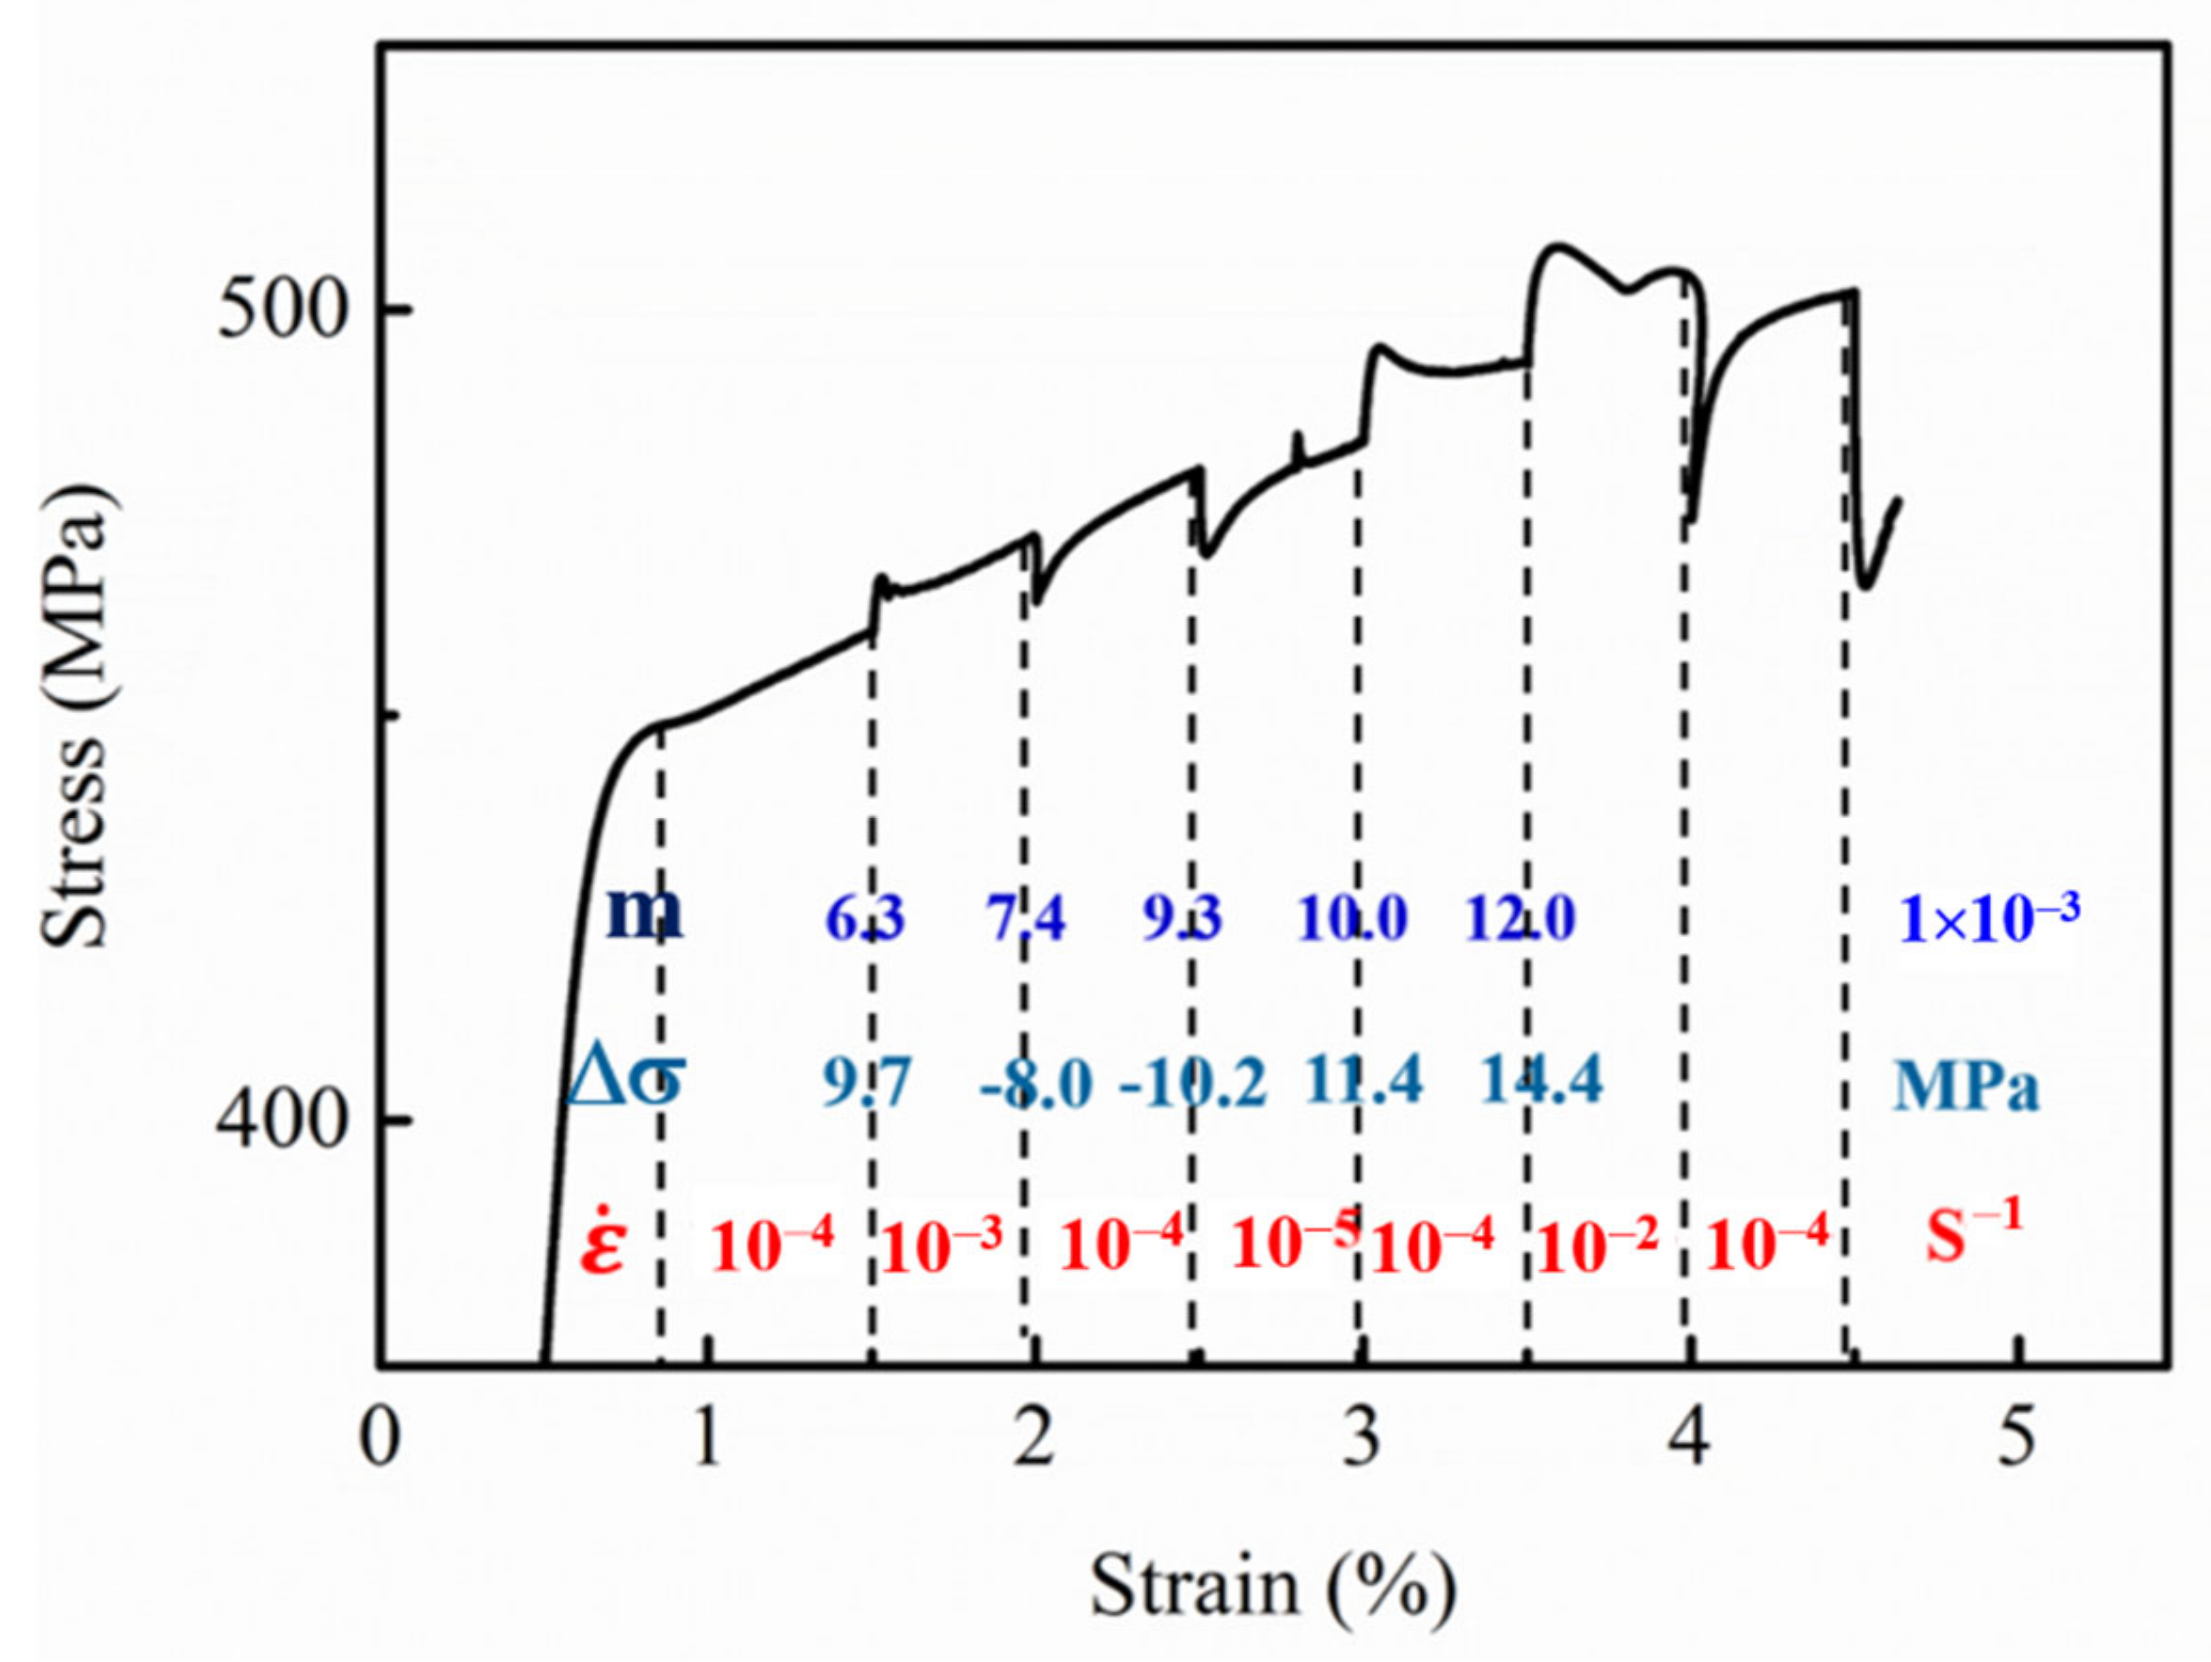
3.3. SRS Obtained by Strain Rate Jump Test

In addition to the stress relaxation tests, the strain rate jump test is another popular approach to investigate the strain rate sensitivity [11,12,45,46,47,48]. Figure 7 shows the stress vs. strain curve obtained from the strain rate jump test. The strain rate ε ˙ , stress variation Δσ, and the strain rate sensitivity m of each strain rate jump stage are provided in Figure 7. The strain rate sensitivity m is approximated by the following expression:
m = Δ ln σ Δ ln ε
The strain rates are in the range of 10−5–10−2 s−1, which are higher than those in the stress relaxation test. However, a higher strain rate leads to a more rapid dislocation accumulation rate, decreased activation volume, and increased SRS. Moreover, the plastic strain tested in the strain rate jump test is substantially higher than that in the stress relaxation test, and it is acknowledged that the strain rate sensitivity m increases with increasing strain. Thus, the SRS obtained by the strain rate jump test should be higher than that obtained by stress relaxation tests. However, it is observed that the strain rate sensitivity m measured by the strain rate jump test, typically in the range of 0.0063–0.0120, is smaller than that obtained by the stress relaxation test, especially in the second to fourth cycle. Therefore, it is further indicated that the SRS obtained in the conventional stress relaxation test needs to be revised.

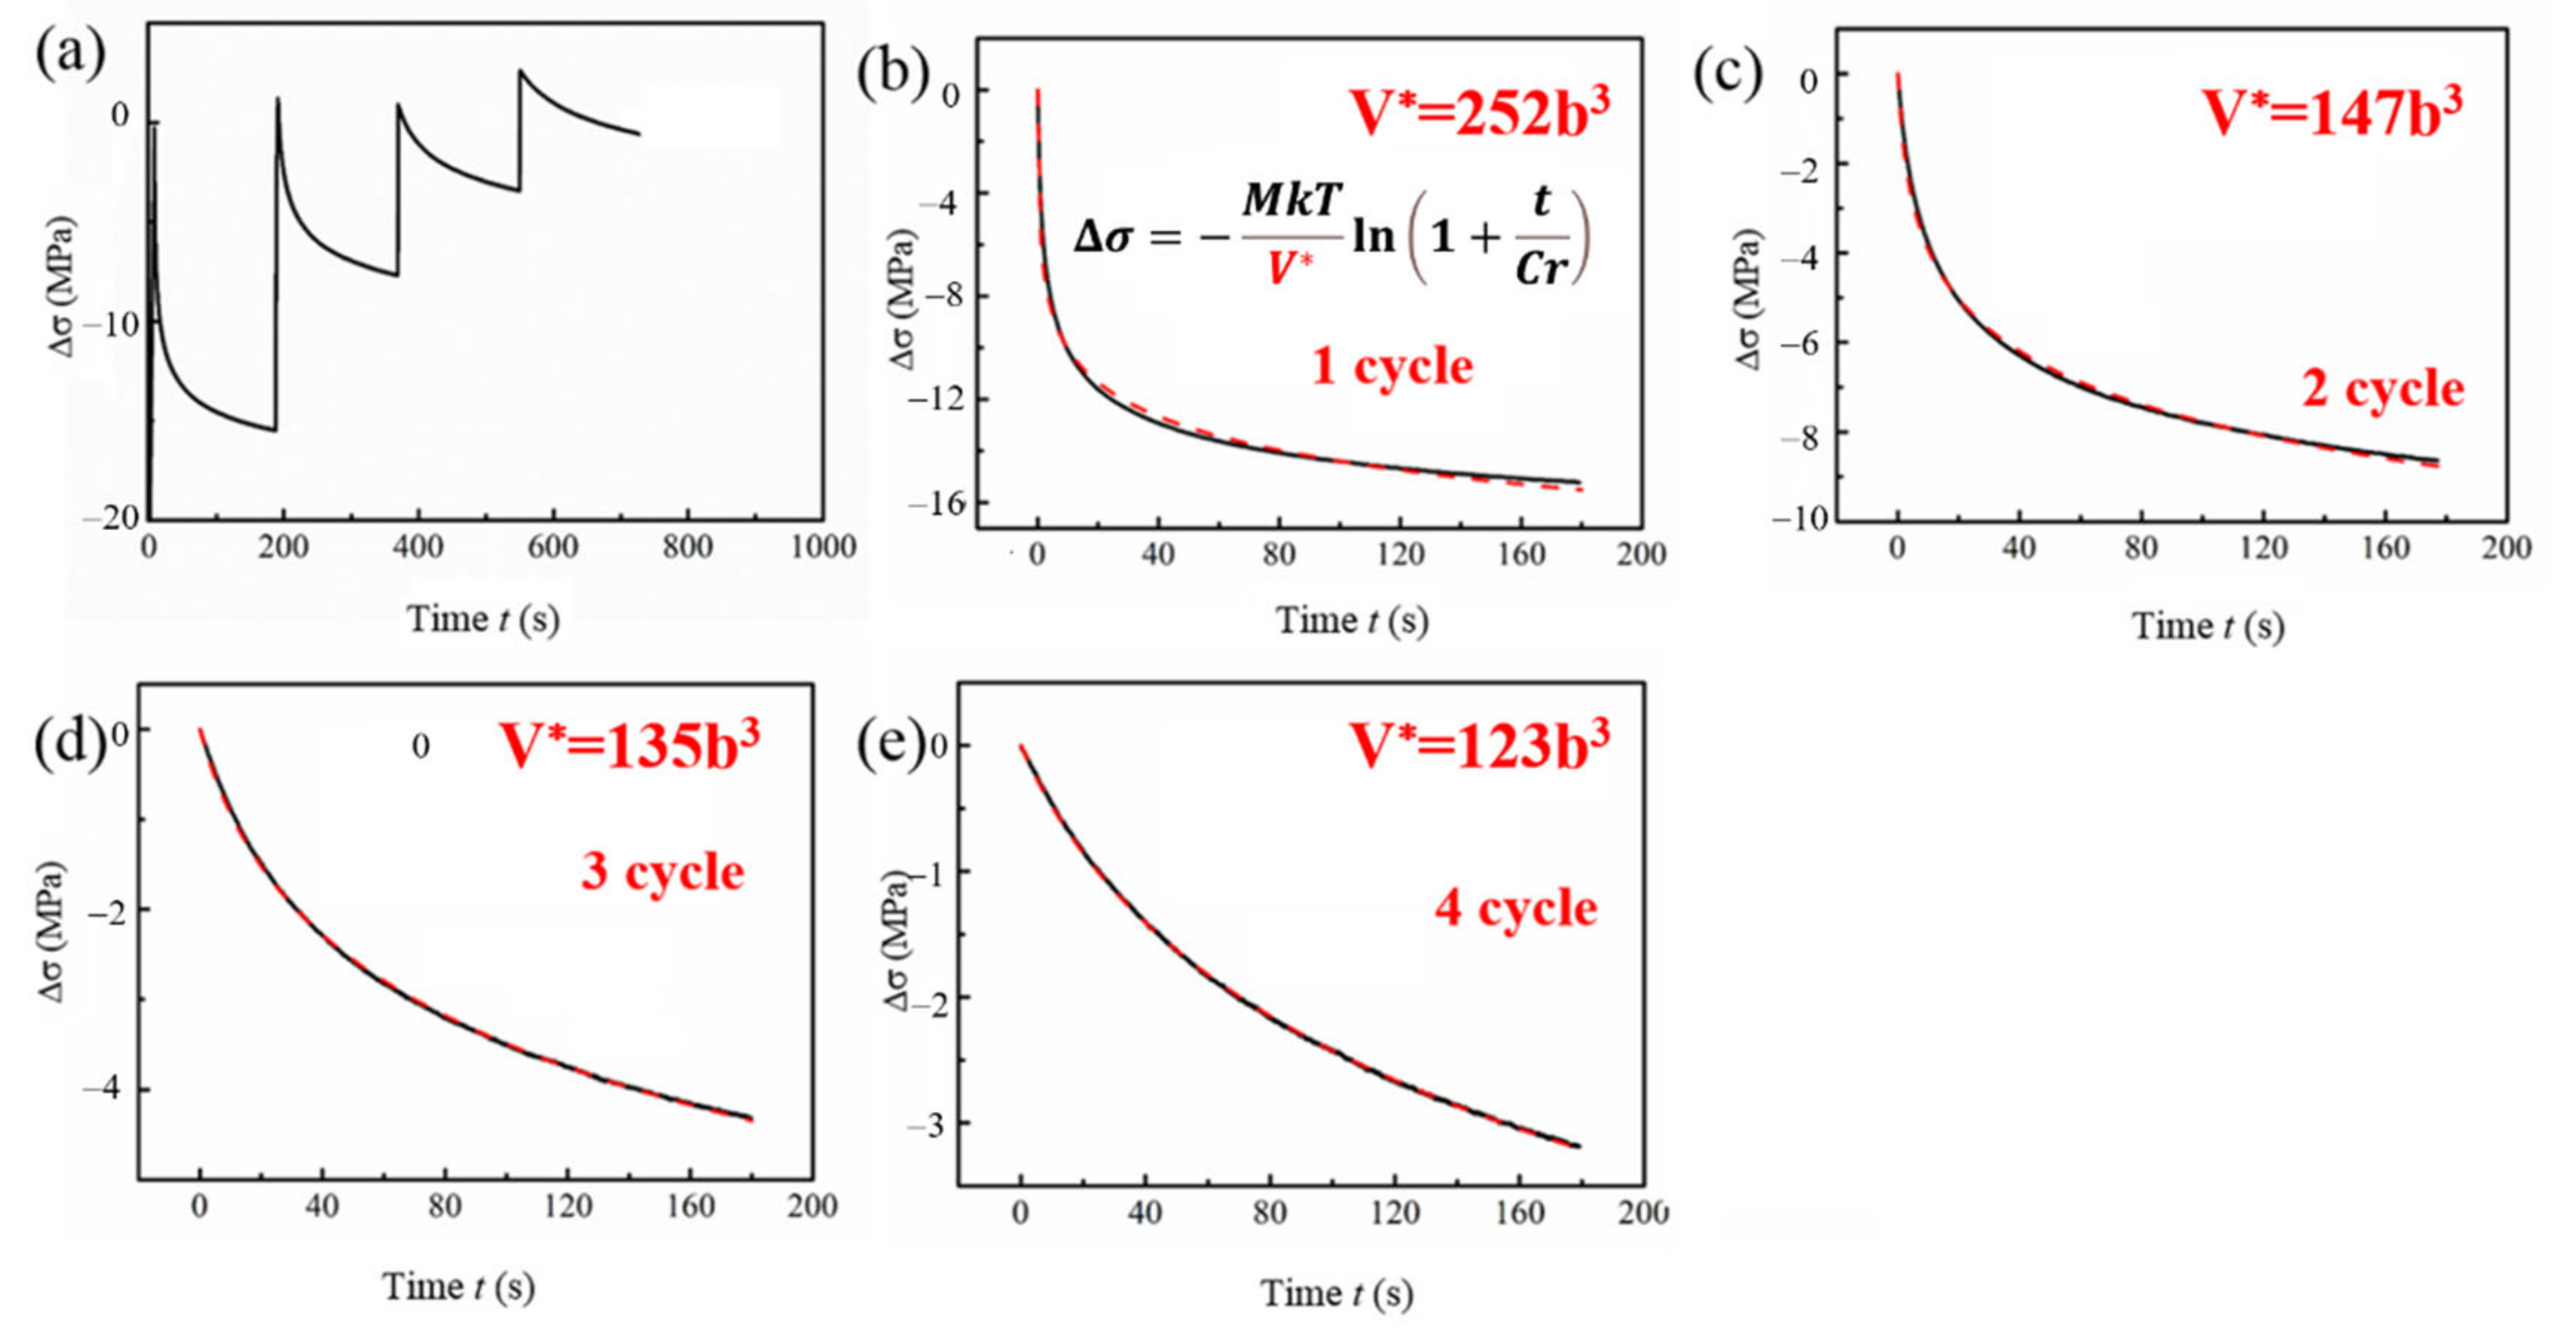
3.4. Strain-Rate-Dependent Activation Volume V* and SRS during Each Cycle
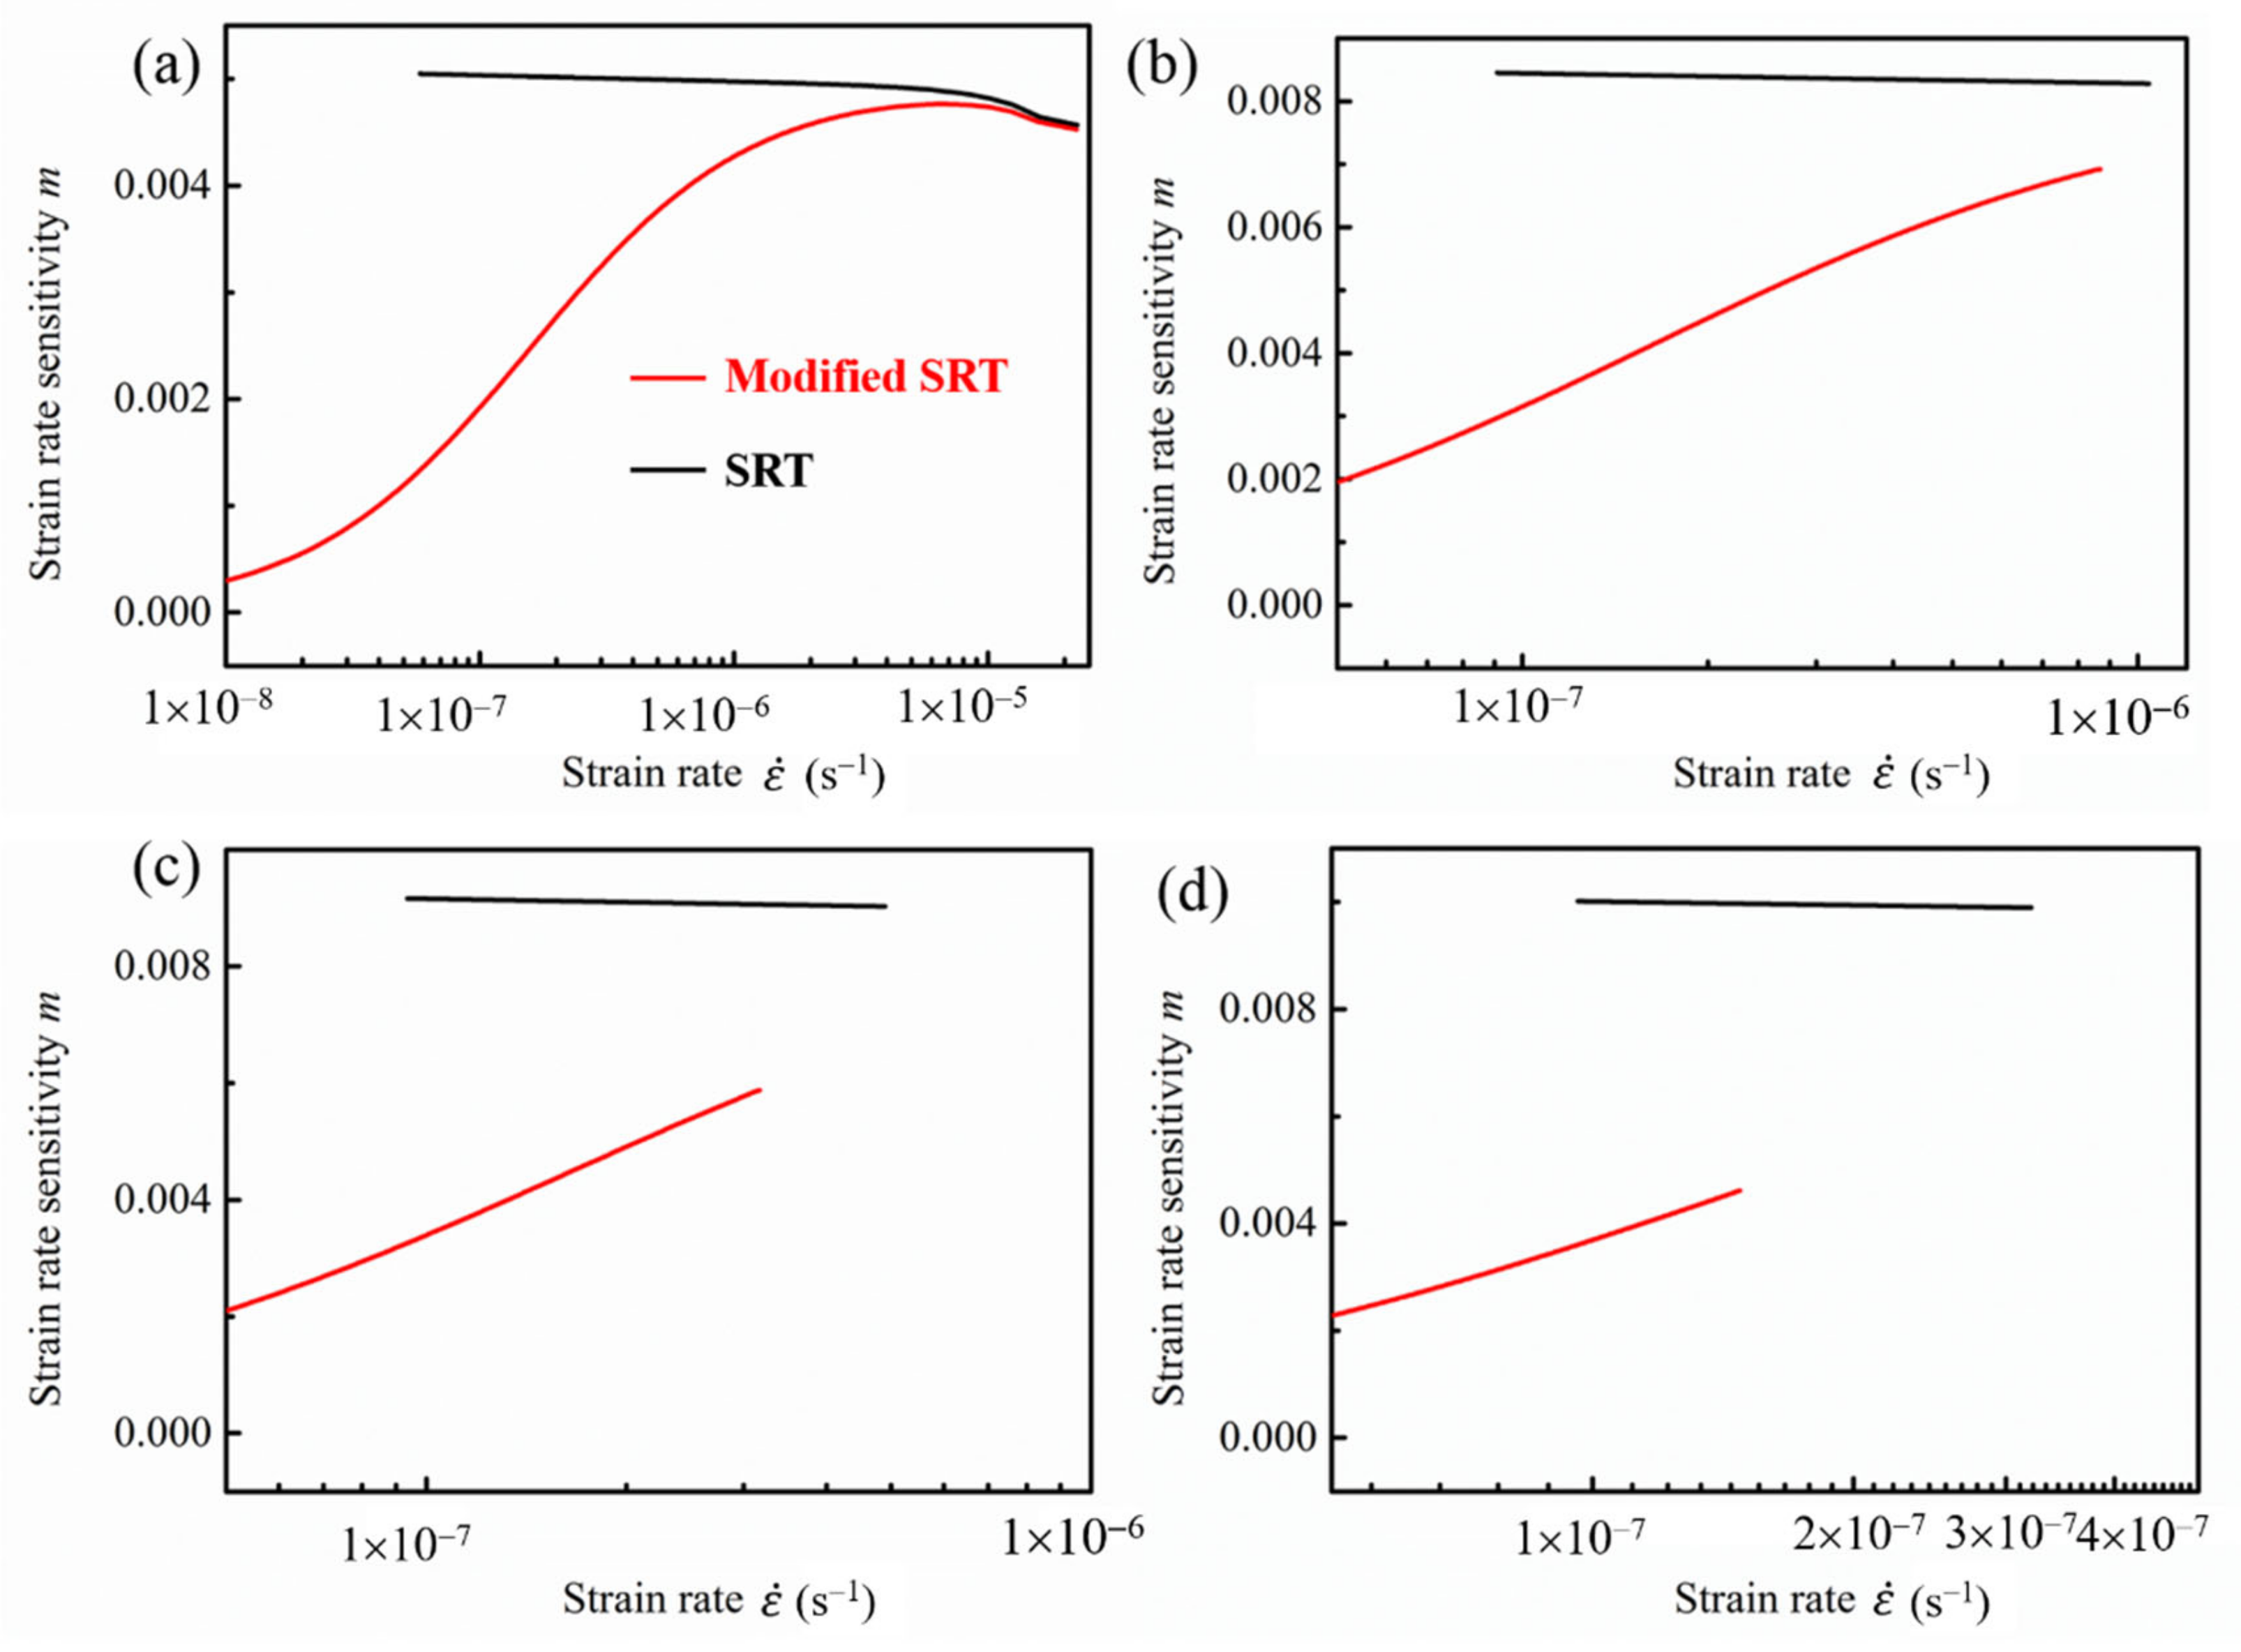
In the conventional theory of the stress relaxation test, it is assumed that the activation volume V* is constant at each cycle and is not dependent on the strain, strain rate, and effective stress. Equation (11) can be rewritten in its logarithmic form as:
ln ε ˙ = A + V * k T τ *
where k and T are constants. Therefore, the value of ln ε ˙ / τ * should be constant and independent of the strain rate. As shown in Figure 8, apart from the first cycle, the value of ln ε ˙ / τ * is a constant at each cycle. At the first relaxation cycle, the value of ln ε ˙ / τ * is constant at the strain rates lower than 10−5 s−1; however, when the strain rate exceeds 10−5 s−1 the value of ln ε ˙ / τ   * increases with increasing strain rate. The value of ln ε ˙ / τ * at the first cycle is obviously strain-rate-dependent. The strain rate at the other relaxation cycles is lower than 10−5 s−1. Therefore, it is not reasonable to assume that the activation volume V* at each cycle is a constant. Klepaczko [49] has pointed out that the mobile dislocation segment L not only depends on the strain based on the dislocation interaction mechanism but also on the strain rate through tensile tests of the polycrystalline aluminum under different strain rates. Additionally, he found that the strain rate sensitivity τ / ln ε ˙ had a distinctive trend with increasing stress when the strain rate is higher or lower than 10−4 s−1. In the present study, the critical strain rate is 10−5 s−1. The critical strain rate may depend on the characters of the materials. Additionally, it is observed that the curve of ln ε ˙ / τ * vs. ln ε ˙ has a good linear fit when the strain rate is higher than 10−5 s−1 as shown in Figure 8. Therefore, it is proposed that ln ε ˙ / τ * is linearly proportional to the strain rate in its logarithmic form as:
ln ε ˙ / τ * n ln ε ˙ ε c ˙
where ε c ˙ is the critical strain rate. In the present study, n is approximated as 1/3 according to the linear fitting.

3.5. Modification

The phenomenon that ln ε ˙ / τ * is constant when the strain rate is lower than the critical strain rate and otherwise strain-rate-dependent may result from different polycrystal deformation mechanisms. The stress profile of each cycle during the stress relaxation test can be fitted well according to Equation (12) assuming that the activation volume is constant. Although Varma et al. [14] have developed a new model which exhibits nonlinear relation between ln ε ˙ and Δσ, the model predicts an increasing trend of activation volume with relaxation steps. Mohebbi et al. [50] developed new equations of the ultrafine-grain aluminum in the stress relaxation process by incorporating the grain boundary sliding mechanism. The grain boundary sliding dominated creep behavior is of great significance for the ultrafine-grained materials. Ivan et al. [51] investigated the deformation mechanisms of the ultrafine-grained aluminum processed by equal-channel angular pressing under room temperature and found that the contribution of grain boundary sliding to the total deformation strain can even reach 24%. Liu and Ma [52] measured the grain boundary sliding offsets by observing the marker lines on the ultrafine-grained Al-Mg-Sc alloy with an average grain size of 0.6 μm processed by friction stir processing, and they indicated that the grain boundary sliding contribution to the strain can reach 50% during deformation at 175 °C. In this study, the grain boundary sliding mechanism dominated creep process is taken into consideration during the stress relaxation test. At each stress drop cycle, the strain rate is continuously decreasing and over the range of 1 × 10⁻⁸ s−1 to 1 × 10⁻⁴ s−1. Overall, the strain rate during stress relaxation is really low. During the creep test, grain boundary sliding and dislocation slip or climb contribute to the creep process. The dominated mechanism can even change from one to the other under different stress levels, which can be studied by measurement of the stress exponent and activation energy [53,54]. For example, Tayebi et al. [53] investigated the creep properties of ZK60 alloys and found that the creep mechanism changed from dislocation creep at high stress levels to the grain boundary sliding mechanism at low stress levels, with a change in the stress exponent from 5.82 to 1.93. It should be noted that the strain rate is lower than 1 × 10⁻⁵ s−1 at low stress during which the dominant creep mechanism is grain boundary sliding. Therefore, at each stress drop cycle with a low strain rate, the grain boundary sliding mechanism is nonnegligible. Additionally, the finer grains in the alloys fabricated by powder metallurgy in the present study make for the grain boundary sliding mechanism. In the present study, the specimens are processed by powder metallurgy with an average grain size of 3.1 μm, as indicated by the EBSD pattern. There are a fraction of grains with a size lower than 1 μm. Therefore, the grain boundary sliding (GBS) mechanism may also contribute to the deformation process during the stress relaxation test. The GBS-dominated phenomenological creep equations can be described as the following expression [55,56]:
ε cr ˙ = A D eff d 2 σ E 2
where Deff is the effective diffusion coefficient, and A is a constant of 2 × 10⁹. The lattice diffusion and grain boundary diffusion are simultaneously incorporated into the diffusion process:
D eff = D lat + c π δ d D gb
where c is a constant of 0.01, δ is the grain boundary width,
D lat = 1.7 × 10 4 exp 14 , 200 R T
D gb = 5 × 10 4 exp 84 , 000 R T
The total deformation rate in the stress relaxation test can be described in terms of the independent additive contribution from grain boundary sliding and dislocation slip.
ε tot ˙ = ε dis ˙ + ε gb ˙
Therefore, the normalized contribution from the grain boundary sliding and dislocation activation can be obtained as shown in Figure 9. It is observed that with the strain rate higher than 10−5 s−1, the dislocation slip mechanism dominates the deformation process during stress relaxation. With decreasing strain rate, the contribution from the GBS mechanism gradually increases. Usually, at the strain rate of around 10−7 s−1, the contributions from the GBS mechanism and dislocation slip mechanism are equal. With decreasing strain rate lower than 10−7 s−1, the GBS mechanism dominates the deformation process.
The SRS can be obtained according to the modified dislocation-slip-dominated strain rate equation as:
m = d ln σ d ln ε dis ˙
Figure 10 shows the modified SRS at each cycle during the stress relaxation test. Comparing Figure 10 with Figure 6, it is observed that the modified SRS is considerably different from the SRS obtained from the conventional stress relaxation test. In Figure 6, the SRS is nearly a constant at each cycle with only a quite small decrease with increasing strain rate, and the SRS is quite different at different cycles even at the same strain rate with a small increase in plastic strain. However, when the GBS mechanism is considered in the constitutive equation of the stress relaxation test, the SRS increases with increasing strain rate until 10−5 s−1 and decreases with increasing strain rate when the strain rate is higher than 10−5 s−1. Additionally, the SRS is generally lower than that obtained by the conventional stress relaxation test. Ma et al. [57] reported the strain-rate-dependent SRS of equal-channel angular-pressed ultrafine-grained copper through the strain-rate jump test, while SRS decreased with increasing strain rate in the range of 10−7–10−4 s−1, and there was no discussion of this phenomenon. In fact, with increasing strain rate, the dislocation accumulation rate is higher, and thus the dislocation segment L and activation volume V* are lower. The SRS is inversely proportional to the activation volume and flow stress in the following expression:
m = k T σ V *
With continuous deformation, the flow stress increases and work hardening occurs as a result of progressing dislocation multiplication. Therefore, it is difficult to investigate the effect of the strain rate on SRS by the strain rate jump test. Additionally, the SRS is greatly increased with the proceeding cycle of the conventional stress relaxation test even at the same strain rate when not considering GBS, as shown in Figure 6a. When taking the GBS mechanism into consideration, the SRS is 0.0022, 0.0031, 0.0033, and 0.0036 at the strain rate of 10−7 s−1 in the four cycles of stress relaxation test. This shows that the SRS at this specific strain rate is nearly identical at each cycle of the stress relaxation test when GBS is considered; a slight increase in the SRS may result from an accumulative strain in each cycle, which is quite different from the result obtained by the conventional stress relaxation theory.

4. Summary

In this study, the strain rate sensitivity and activation volume of the overaged Al-Zn-Mg-Cu alloys with fine grains were analyzed by a conventional stress relaxation test at each cycle and then compared with results obtained by a strain rate jump test. The strain rate sensitivity measured by the conventional stress relaxation test is higher than that obtained by the strain rate jump test. Additionally, the assumption that activation volume is constant and independent of the strain rate is unreasonable when fitting the stress profile. The activation-related value   ln ε ˙ / τ * is found to be strain-rate-dependent when the strain rate is higher than the critical strain rate 10−5 s−1, where the dislocation activation mechanism predominates over the deformation during each cycle of the stress relaxation test, and with decreasing strain rate the grain boundary sliding mechanism gradually takes control. By coupling the grain boundary sliding mechanism into a dislocation activation mechanism, the measured SRS is substantially strain-rate-dependent and increases with increasing strain rate until 10−5 s−1.

Author Contributions

P.R.: writing, data collection, data analysis; X.F.: study design, data analysis, literature search; Y.X.: literature search, figures, data analysis; Q.W.: study design, figures, data analysis; Z.B.: study design, materials preparation, discussion; Q.Y.: study design, discussion, revision; H.W.: study design, discussion, data analysis; Z.C.: study design, data analysis, discussion. All authors have read and agreed to the published version of the manuscript.

Funding

This study is financially supported by the National Natural Science Foundation of China (Grant No. 51971137).

Data Availability Statement

All data included in this study are available upon request by contact with the corresponding author.

Conflicts of Interest

The authors declare no conflict of interest.

References

  1. Spigarelli, S.; Paoletti, C. A new model for the description of creep behaviour of aluminium-based composites reinforced with nanosized particles. Compos. Part A Appl. Sci. Manuf. 2018, 112, 346–355. [Google Scholar] [CrossRef]
  2. Pham, M.S.; Iadicola, M.; Creuziger, A.; Hu, L.; Rollett, A.D. Thermally-activated constitutive model including dislocation interactions, aging and recovery for strain path dependence of solid solution strengthened alloys: Application to AA5754-O. Int. J. Plast. 2015, 75, 226–243. [Google Scholar] [CrossRef] [PubMed] [Green Version]
  3. Salvado, F.C.; Teixeira-Dias, F.; Walley, S.M.; Lea, L.J.; Cardoso, J.B. A review on the strain rate dependency of the dynamic viscoplastic response of FCC metals. Prog. Mater. Sci. 2017, 88, 186–231. [Google Scholar] [CrossRef] [Green Version]
  4. Yin, F.; Hu, S.; Xu, R.; Han, X.; Qian, D.; Wei, W.; Hua, L.; Zhao, K. Strain rate sensitivity of the ultrastrong gradient nanocrystalline 316 L stainless steel and its rate-dependent modeling at nanoscale. Int. J. Plast. 2020, 129, 102696. [Google Scholar] [CrossRef]
  5. Zhang, H.; Li, P.; Gong, X.; Wang, T.; Li, L.; Liu, Y.; Wang, Q. Tensile properties, strain rate sensitivity and failure mechanism of single crystal superalloys CMSX-4. Mater. Sci. Eng. A 2020, 782, 139105. [Google Scholar] [CrossRef]
  6. Wang, H.; Wu, P.; Kurukuri, S.; Worswick, M.J.; Peng, Y.; Tang, D.; Li, D. Strain rate sensitivities of deformation mechanisms in magnesium alloys. Int. J. Plast. 2018, 107, 207–222. [Google Scholar] [CrossRef]
  7. Figueiredo, R.B.; Langdon, T.G. Deformation mechanisms in ultrafine-grained metals with an emphasis on the Hall-Petch relationship and strain rate sensitivity. J. Mater. Res. Technol. 2021, 14, 137–159. [Google Scholar] [CrossRef]
  8. Liang, Z.Y.; Wang, X.; Huang, W.; Huang, M.X. Strain rate sensitivity and evolution of dislocations and twins in a twinning-induced plasticity steel. Acta Mater. 2015, 88, 170–179. [Google Scholar] [CrossRef]
  9. Yasnikov, I.S.; Estrin, Y.; Vinogradov, A. What governs ductility of ultrafine-grained metals? A microstructure based approach to necking instability. Acta Mater. 2017, 141, 18–28. [Google Scholar] [CrossRef]
  10. Li, Z.; Voisin, T.; McKeown, J.T.; Ye, J.; Braun, T.; Kamath, C.; King, W.E.; Wang, Y.M. Tensile properties, strain rate sensitivity, and activation volume of additively manufactured 316 L stainless steels. Int. J. Plast. 2019, 120, 395–410. [Google Scholar] [CrossRef]
  11. Zhao, C.; Wang, Z.; Li, D.; Kollo, L.; Luo, Z.; Zhang, W.; Prashanth, K.G. Selective laser melting of Cu–Ni–Sn: A comprehensive study on the microstructure, mechanical properties, and deformation behavior. Int. J. Plast. 2021, 138, 102926. [Google Scholar] [CrossRef]
  12. Wu, Z.; Gao, Y.; Bei, H. Thermal activation mechanisms and Labusch-type strengthening analysis for a family of high-entropy and equiatomic solid-solution alloys. Acta Mater. 2016, 120, 108–119. [Google Scholar] [CrossRef] [Green Version]
  13. Krishnaswamy, H.; Jain, J. Stress relaxation test: Issues in modelling and interpretation. Manuf. Lett. 2020, 26, 64–68. [Google Scholar] [CrossRef]
  14. Varma, A.; Krishnaswamy, H.; Jain, J.; Lee, M.-G.; Barlat, F. Advanced constitutive model for repeated stress relaxation accounting for transient mobile dislocation density and internal stress. Mech. Mater. 2019, 133, 138–153. [Google Scholar] [CrossRef]
  15. Gupta, S.; Beaudoin, A.J.; Chevy, J. Strain rate jump induced negative strain rate sensitivity (NSRS) in aluminum alloy 2024: Experiments and constitutive modeling. Mater. Sci. Eng. A 2017, 683, 143–152. [Google Scholar] [CrossRef]
  16. Ma, K.; Hu, T.; Yang, H.; Topping, T.; Yousefiani, A.; Lavernia, E.J.; Schoenung, J.M. Coupling of dislocations and precipitates: Impact on the mechanical behavior of ultrafine grained Al–Zn–Mg alloys. Acta Mater. 2015, 103, 153–164. [Google Scholar] [CrossRef]
  17. Ma, K.; Wen, H.; Hu, T.; Topping, T.D.; Isheim, D.; Seidman, D.N.; Lavernia, E.J.; Schoenung, J.M. Mechanical behavior and strengthening mechanisms in ultrafine grain precipitation-strengthened aluminum alloy. Acta Mater. 2013, 62, 141–155. [Google Scholar] [CrossRef]
  18. Lu, L.; Zhu, T.; Shen, Y.; Dao, M.; Lu, K.; Suresh, S. Stress relaxation and the structure size-dependence of plastic deformation in nanotwinned copper. Acta Mater. 2009, 57, 5165–5173. [Google Scholar] [CrossRef]
  19. Yang, X.S.; Wang, Y.J.; Wang, G.Y.; Zhai, H.R.; Dai, L.H.; Zhang, T.Y. Time, stress, and temperature-dependent deformation in nanostructured copper: Stress relaxation tests and simulations. Acta Mater. 2016, 108, 252–263. [Google Scholar] [CrossRef] [Green Version]
  20. Rizi, M.H.B.; Farahani, M.G.; Aghaahmadi, M.; Kim, J.H.; Karjalainen, L.P.; Sahu, P. Analysis of strain hardening behavior of a high-Mn TWIP steel using electron microscopy and cyclic stress relaxation. Acta Mater. 2022, 240, 118309. [Google Scholar] [CrossRef]
  21. Li, Z.; Li, Z.; Tan, Z.; Xiong, D.-B.; Guo, Q. Stress relaxation and the cellular structure-dependence of plastic deformation in additively manufactured AlSi10Mg alloys. Int. J. Plast. 2019, 127, 102640. [Google Scholar] [CrossRef]
  22. Lee, H.; Chae, H.; Kim, Y.S.; Song, M.J.; Lim, S.; Prasad, K.; Krishnaswamy, H.; Jain, J.; An, K.; Lee, S.Y. Viscoplastic lattice strain during repeated relaxation of age-hardened Al alloy. Mech. Mater. 2021, 158, 103899. [Google Scholar] [CrossRef]
  23. Guo, S.; Xie, Y.; Lei, J.; Han, S.; Liu, D.; He, Y. Coupled effect of specimen size and grain size on the stress relaxation of micron-sized copper wires. J. Mater. Sci. 2022, 57, 18655–18668. [Google Scholar] [CrossRef]
  24. Guo, S.; He, Y.; Liu, D.; Li, Z.; Lei, J.; Han, S. Geometrically necessary dislocations induced size effect in the torsional stress relaxation behavior of thin metallic wires. Scr. Mater. 2019, 173, 129–133. [Google Scholar] [CrossRef]
  25. Guo, S.; He, Y.; Li, Z.; Lei, J.; Liu, D. Size and stress dependences in the tensile stress relaxation of thin copper wires at room temperature. Int. J. Plast. 2019, 112, 278–296. [Google Scholar] [CrossRef]
  26. Jun, T.S.; Zhang, Z.; Sernicola, G.; Dunne, F.P.E.; Britton, T.B. Local strain rate sensitivity of single α phase within a dual-phase Ti alloy. Acta Mater. 2016, 107, 298–309. [Google Scholar] [CrossRef] [Green Version]
  27. Yang, Q.; Ma, Y.; Chen, Z.; Ji, G.; Wang, M.L.; Zhong, S.Y.; Wu, Y.; Ji, V.; Wang, H.W. A new powder metallurgy routine to fabricate TiB2/Al–Zn–Mg–Cu nanocomposites based on composite powders with pre-embedded nanoparticles. Materialia 2019, 8, 100458. [Google Scholar] [CrossRef]
  28. Yang, Q.; Shen, Y.; Liu, J.; Wang, L.; Chen, Z.; Wang, M.L.; Zhong, S.Y.; Wu, Y.; Wang, H.W. Microstructure and mechanical response of TiB2/Al–Zn–Mg–Cu composites with more addition of Zn. J. Alloys Compd. 2020, 816, 152584. [Google Scholar] [CrossRef]
  29. Kheradmand, A.B.; Tayebi, M.; Akbari, M.M.; Abbasian, A. Effect of quench-controlled precipitation hardening on microstructure and mechanical properties of Al-Zn-Mg-Cu-Zr alloys contain of Sc micro-alloying. J. Alloys Compd. 2022, 902, 163748. [Google Scholar] [CrossRef]
  30. Yang, Q.; Cheng, D.L.; Liu, J.; Wang, L.; Chen, Z.; Wang, M.L.; Zhong, S.Y.; Wu, Y.; Ji, G.; Wang, H.W. Microstructure evolution of the TiB2/Al composites fabricated by powder metallurgy during hot extrusion. Mater. Charact. 2019, 155, 109834. [Google Scholar] [CrossRef]
  31. Yang, Q.; Liu, Y.T.; Liu, J.; Wang, L.; Chen, Z.; Wang, M.L.; Zhong, S.Y.; Wu, Y.; Wang, H.W. Microstructure evolution of the rapidly solidified alloy powders and composite powders. Mater. Des. 2019, 182, 108045. [Google Scholar] [CrossRef]
  32. Lv, B.-J.; Wang, S.; Xu, T.-W.; Guo, F. Effects of minor Nd and Er additions on the precipitation evolution and dynamic recrystallization behavior of Mg–6.0Zn–0.5Mn alloy. J. Magnes. Alloy. 2021, 9, 840–852. [Google Scholar] [CrossRef]
  33. Zhang, B.; Wang, Z.; Yu, H.; Ning, Y. Microstructural origin and control mechanism of the mixed grain structure in Ni-based superalloys. J. Alloys Compd. 2022, 900, 163515. [Google Scholar] [CrossRef]
  34. Wang, S.C.; Starink, M.J.; Gao, N.; Qiao, X.G.; Xu, C.; Langdon, T.G. Texture evolution by shear on two planes during ECAP of a high-strength aluminum alloy. Acta Mater. 2008, 15, 3800–3809. [Google Scholar] [CrossRef] [Green Version]
  35. Mayama, T.; Noda, M.; Chiba, R.; Kuroda, M. Crystal plasticity analysis of texture development in magnesium alloy during extrusion. Int. J. Plast. 2011, 27, 1916–1935. [Google Scholar] [CrossRef] [Green Version]
  36. Chung, T.F.; Yang, Y.L.; Huang, B.M.; Shi, Z.; Lin, J.; Ohmura, T.; Yang, J.R. Transmission electron microscopy investigation of separated nucleation and in-situ nucleation in AA7050 aluminium alloy. Acta Mater. 2018, 149, 377–387. [Google Scholar] [CrossRef]
  37. Fang, X.; Song, M.; Li, K.; Du, Y.; Zhao, D.; Jiang, C.; Zhang, H. Effects of Cu and Al on the crystal structure and composition of η (MgZn2) phase in over-aged Al–Zn–Mg–Cu alloys. J. Mater. Sci. 2012, 47, 5419–5427. [Google Scholar] [CrossRef]
  38. Ou, Y.; Jiang, Y.; Wang, Y.; Liu, Z.; Lervik, A.; Holmestad, R. Vacancy and solute co-segregated η1 interface in over-aged Al-Zn-Mg alloys. Acta Mater. 2021, 218, 117082. [Google Scholar] [CrossRef]
  39. Mishra, S.; Yadava, M.; Kulkarni, K.N.; Gurao, N.P. Stress relaxation behavior of an aluminium magnesium silicon alloy in different temper condition. Mech. Mater. 2018, 125, 80–93. [Google Scholar] [CrossRef]
  40. Niewczas, M.; Jobba, M.; Mishra, R.K. Thermally activated flow of dislocations in Al–Mg binary alloys. Acta Mater. 2014, 83, 372–382. [Google Scholar] [CrossRef]
  41. Laplanche, G.; Bonneville, J.; Varvenne, C.; Curtin, W.A.; George, E.P. Thermal activation parameters of plastic flow reveal deformation mechanisms in the CrMnFeCoNi high-entropy alloy. Acta Mater. 2018, 143, 257–264. [Google Scholar] [CrossRef]
  42. Mohebbi, M.S.; Akbarzadeh, A.; Kim, B.H.; Kim, S.K. Analysis of Strain Rate Sensitivity of Ultrafine-Grained AA1050 by Stress Relaxation Test. Met. Mater. Trans. A 2014, 45, 5442–5450. [Google Scholar] [CrossRef]
  43. Khan, A.S.; Liu, H. Variable strain rate sensitivity in an aluminum alloy: Response and constitutive modeling. Int. J. Plast. 2012, 36, 1–14. [Google Scholar] [CrossRef]
  44. George, E.P.; Curtin, W.A.; Tasan, C.C. High entropy alloys: A focused review of mechanical properties and deformation mechanisms. Acta Mater. 2020, 188, 435–474. [Google Scholar]
  45. Malyar, N.V.; Grabowski, B.; Dehm, G.; Kirchlechner, C. Dislocation slip transmission through a coherent Σ3{111} copper twin boundary: Strain rate sensitivity, activation volume and strength distribution function. Acta Mater. 2018, 161, 412–419. [Google Scholar] [CrossRef]
  46. Bach, J.; Stoiber, M.; Schindler, L.; Höppel, H.W.; Göken, M. Deformation mechanisms and strain rate sensitivity of bimodal and ultrafine-grained copper. Acta Mater. 2020, 186, 363–373. [Google Scholar] [CrossRef]
  47. Ruppert, M.; Schunk, C.; Hausmann, D.; Höppel, H.W.; Göken, M. Global and local strain rate sensitivity of bimodal Al-laminates produced by accumulative roll bonding. Acta Mater. 2016, 103, 643–650. [Google Scholar] [CrossRef]
  48. Wheeler, J.M.; Thilly, L.; Morel, A.; Taylor, A.A.; Montagne, A.; Ghisleni, R.; Michler, J. The plasticity of indium antimonide: Insights from variable temperature, strain rate jump micro-compression testing. Acta Mater. 2016, 106, 283–289. [Google Scholar] [CrossRef]
  49. Klepaczko, J. Strain rate history effetcs for polycrystalline aluminum and theory of interactions. J. Mech. Phys. Solids 1968, 16, 255–266. [Google Scholar] [CrossRef]
  50. Mohebbi, M.S.; Akbarzadeh, A. Development of equations for strain rate sensitivity of UFG aluminum as a function of strain rate. Int. J. Plast. 2017, 90, 167–176. [Google Scholar] [CrossRef]
  51. Ivanov, K.V.; Naydenkin, E.V. Grain boundary sliding in ultrafine grained aluminum under tension at room temperature. Scr. Mater. 2012, 66, 511–514. [Google Scholar] [CrossRef]
  52. Liu, F.C.; Ma, Z.Y. Contribution of grain boundary sliding in low-temperature superplasticity of ultrafine-grained aluminum alloys. Scr. Mater. 2010, 62, 125–128. [Google Scholar] [CrossRef]
  53. Tayebi, M.; Najafi, H.; Nategh, S.; Khodabandeh, A. Creep Behavior of ZK60 Alloy and ZK60/SiCw Composite After Extrusion and Precipitation Hardening. Met. Mater. Int. 2020, 27, 3905–3917. [Google Scholar] [CrossRef]
  54. Wang, Y.Y.; Jia, C.; Tayebi, M.; Hamawandi, B. Microstructural Evolution during Accelerated Tensile Creep Test of ZK60/SiC(p) Composite after KoBo Extrusion. Materials 2022, 15, 6428. [Google Scholar] [CrossRef] [PubMed]
  55. Mirzadeh, H. High strain rate superplasticity via friction stir processing (FSP): A review. Mater. Sci. Eng. A 2021, 819, 141499. [Google Scholar] [CrossRef]
  56. Varma, A.; Gokhale, A.; Krishnaswamy, H.; Banerjee, D.K.; Jain, J. Grain boundary sliding and non-constancy strain during stress relaxation of pure Mg. Mater. Sci. Eng. A 2021, 817, 141349. [Google Scholar] [CrossRef]
  57. Wang, Y.M.; Ma, E. Three strategies to achieve uniform tensile deformation in a nanostructured metal. Acta Mater. 2004, 52, 1699–1709. [Google Scholar] [CrossRef]
Figure 1. (a,b) Microstructure of the Al-Zn-Mg-Cu alloy at the extruded state and the elemental map analysis; (c,d) microstructure of the Al-Zn-Mg-Cu alloy at the overaged state.
Metals 12 02097 g001
Figure 2. (a) Inverse pole figure (IPF) of the overaged Al-Zn-Mg-Cu alloy; (b) grain size distribution of the overaged Al-Zn-Mg-Cu alloy; (c) KAM image; (d) misorientation distribution.
Metals 12 02097 g002
Figure 3. (a) Bright-field TEM of the overaged Al-Zn-Mg-Cu alloy; (b) the precipitates in higher magnification and elemental map analysis of Zn, Mg, and Cu; (c) point EDS of the precipitate marked in Figure 3b; (d) HRTEM of the precipitate and fast Fourier transform (FFT).
Metals 12 02097 g003
Figure 4. Tensile stress–strain curve of the overaged Al-Zn-Mg-Cu alloys.
Metals 12 02097 g004
Figure 5. Fitting of the experimental data of each cycle during the conventional stress relaxation test, (a) 4 cycles; (b) first cycle; (c) second cycle; (d) third cycle; (e) fourth cycle.
Metals 12 02097 g005
Figure 6. (a) Strain rate sensitivity at each cycle calculated according to Equation (13); (b) the accumulative plastic deformation strain during the stress relaxation test; (c) the plastic deformation strain at each cycle; the same color represents the same cycle as (b).
Metals 12 02097 g006
Figure 7. Stress vs. strain curves obtained from the room temperature tensile test with strain rate jump.
Metals 12 02097 g007
Figure 8. ln ε ˙ / τ * vs. ln ε ˙ curves at each stress relaxation cycle.
Metals 12 02097 g008
Figure 9. Normalized contribution of dislocation slip mechanism and GBS mechanism to the total strain rate in the stress relaxation test: (a) the first cycle; (b) the second cycle; (c) the third cycle; (d) the fourth cycle.
Metals 12 02097 g009
Figure 10. Comparison of the SRS obtained by conventional stress relaxation theory which does not take the grain boundary sliding into consideration and the SRS obtained by modified stress relaxation test taking the grain boundary sliding into consideration: (a) the first cycle; (b) the second cycle; (c) the third cycle; (d) the fourth cycle.
Metals 12 02097 g010
Publisher’s Note: MDPI stays neutral with regard to jurisdictional claims in published maps and institutional affiliations.

