Article

Effect of Particle Size of MgO on the Sinter Strength before and after Reduction and Its Mechanism Analysis

School of Metallurgical Engineering, Anhui University of Technology, Ma’anshan 243002, China
*
Author to whom correspondence should be addressed.
Metals 2022, 12(12), 2088; https://doi.org/10.3390/met12122088
Submission received: 27 September 2022 / Revised: 27 November 2022 / Accepted: 28 November 2022 / Published: 5 December 2022

Abstract

:
It is a popular countermeasure to add MgO into sinter to cope with the use of high-Al2O3 iron ore. The effects of particle size with MgO-bearing flux on the strength of a sintered sample (Fe2O3-MgO and Fe2O3-MgO-CaO series) are discussed in the present work for the purpose of improving sinter strength before and after reduction. The experimental results show that (1) with the increase in fine light calcined magnesite (LCM) from 0 to 100%, the compressive strength with the Fe2O3-MgO series increased from 5.66 to 7.42 MPa before reduction and from 2.49 to 6.03 MPa after reduction, and the compressive strength with the Fe2O3-MgO-CaO series increased from 4.62 to 7.01 MPa before reduction and from 4.00 to 6.23 MPa after reduction. The result of the sintering pot experiment conformed with the laboratory result. In actual production, LCM with a 50% fine grind should be added into the sinter based on economic concerns and environmental protection. (2) The ball-to-ball model was introduced to explain the reason that the sample compressive strength increased with the increase in fine LCM addition before reduction. (3) To quantitatively analyze the relationship of mineralization rate and particle size with MgO-bearing flux, the mineralization reaction experiment was carried out in the study and the result was as follows: the diffusion layer thickness and diffusion rates with coarse MgO-bearing flux were 250.8 μm and 12.54 μm·min−1, respectively, and those of fine MgO-bearing flux were 397.1 μm and 19.86 μm·min−1, respectively. The experimental results also explained the reason that more fine LCM increased the compressive strength of the sample before reduction. (4) The more compact and uniform microstructures and less transformation of Fe2O3 to Fe3O4 resulted the increase in compressive strength with finer MgO-bearing flux after reduction. Based on above results, adding fine MgO-bearing flux to the sinter is effective in enhancing the sinter quality.

1. Introduction

A large number of iron and steel enterprises are using the high-Al2O3 iron ore to solve the issues of the shortage of high-grade ore resources and increasing imported ore prices in China [1,2,3,4]. However, the high-Al2O3 iron ore can bring a series of negative effects to ironmaking process. To address this problem, it is a common countermeasure to add MgO into the sinter in production process. The purpose of the countermeasure is to guarantee the appropriate basicity of the sinter, to increase viscosity with slag, and to improve the ability of desulfurization with slag; however, these countermeasures can bring a series of negative effects, such as the decrease in sinter compressive strength and poor properties with reduction and melting/dripping [5]. The drum strength and dropping strength are important parameters that are used to represent the strength of the sinter [6,7]. In the case of the usage of higher-strength sinter, the operation process of ironmaking is smooth and the production efficiency is improved; therefore, the economic benefits of the process are improved.
Many researchers have investigated the performance of strength and reduction of sinters and pellets [8,9,10]. Zhang et al. investigated the effect of MgO on sintering performance and the metallurgical properties of sinter with high-chromium vanadium–titanium magnetite. They found that the vertical sintering speed and the tumbler index first increased and then decreased with the increase in MgO in the sinter [11]. Guo et al. studied the effect of an MgO additive on the metallurgical properties of a fluxed pellet. They found that the compressive strength, low-temperature reduction disintegration index (RDI), and reduction swelling index (RSI) decreased with the increase in MgO in the fluxed pellet [12]. The tumbler strength decreased while the RDI increased with the increase in MgO content in the sinter; the main reasons were as follows: (1) the generation of less Fe2O3 in the sinter; (2) a small number of Fe2O3-CaO-SiO2-Al2O3 bonding phases (SFCA) existed in the sinter [13]. Feng et al. investigated the migration behavior of the MgO and its influence on the reduction of sinter. The results indicated that the reduction rate of the sinter increased with the increase in MgO content, and the main reasons were as follows: (1) the diffusion of Mg2+ into Fe3O4 resulted in the generation of more pores and increased porosity; and (2) the available active sites of the sample were improved with the increase in MgO [14]. In order to better utilize the MgO flux with agglomeration, some researchers investigated systematically the effect of MgO on the characteristics of sinter and pellets with high-chromium vanadium–titanium magnetite. The experimental results indicated that the rational burden structure was the combination of high-MgO sinter and a low-MgO pellet in the production process. [15]. According to the background analysis above, there are many challenges: MgO-containing flux is beneficial because it inhibits the low-temperature reduction disintegration, however, it reduces the self-strength of sinter. As far as the authors know, methods to obtain a low-MgO sinter with a good RDI property are rarely reported in the related literature.
Based on previous work, fine-grinding MgO-bearing flux might accelerate the reaction mineralization in sinter, which increases the self-strength of sinter and inhibits the low-temperature reduction disintegration. Therefore, in the present work, the effects of fine MgO-bearing flux on the sample strength before and after reduction were investigated by XRD and SEM. The main research content and innovations included the following:
(1) Compared with the previous method, the MgO-bearing flux was first grinded and then added into raw materials in the sintering process.
(2) The effects of particle size of the MgO-bearing flux on the strength of the sample (Fe2O3-MgO and Fe2O3-MgO-CaO series) were investigated before and after reduction. To better understand the reaction mechanism, the phase components and microscopy were analyzed and discussed for the sample with different fine MgO-bearing flux additive proportions.
(3) In this paper, the effect of fine MgO-bearing flux on mineralization reactions was first investigated, and the relationship between particle size and diffusion layer thickness and diffusion rate was obtained for the first time.

2. Materials and Methods

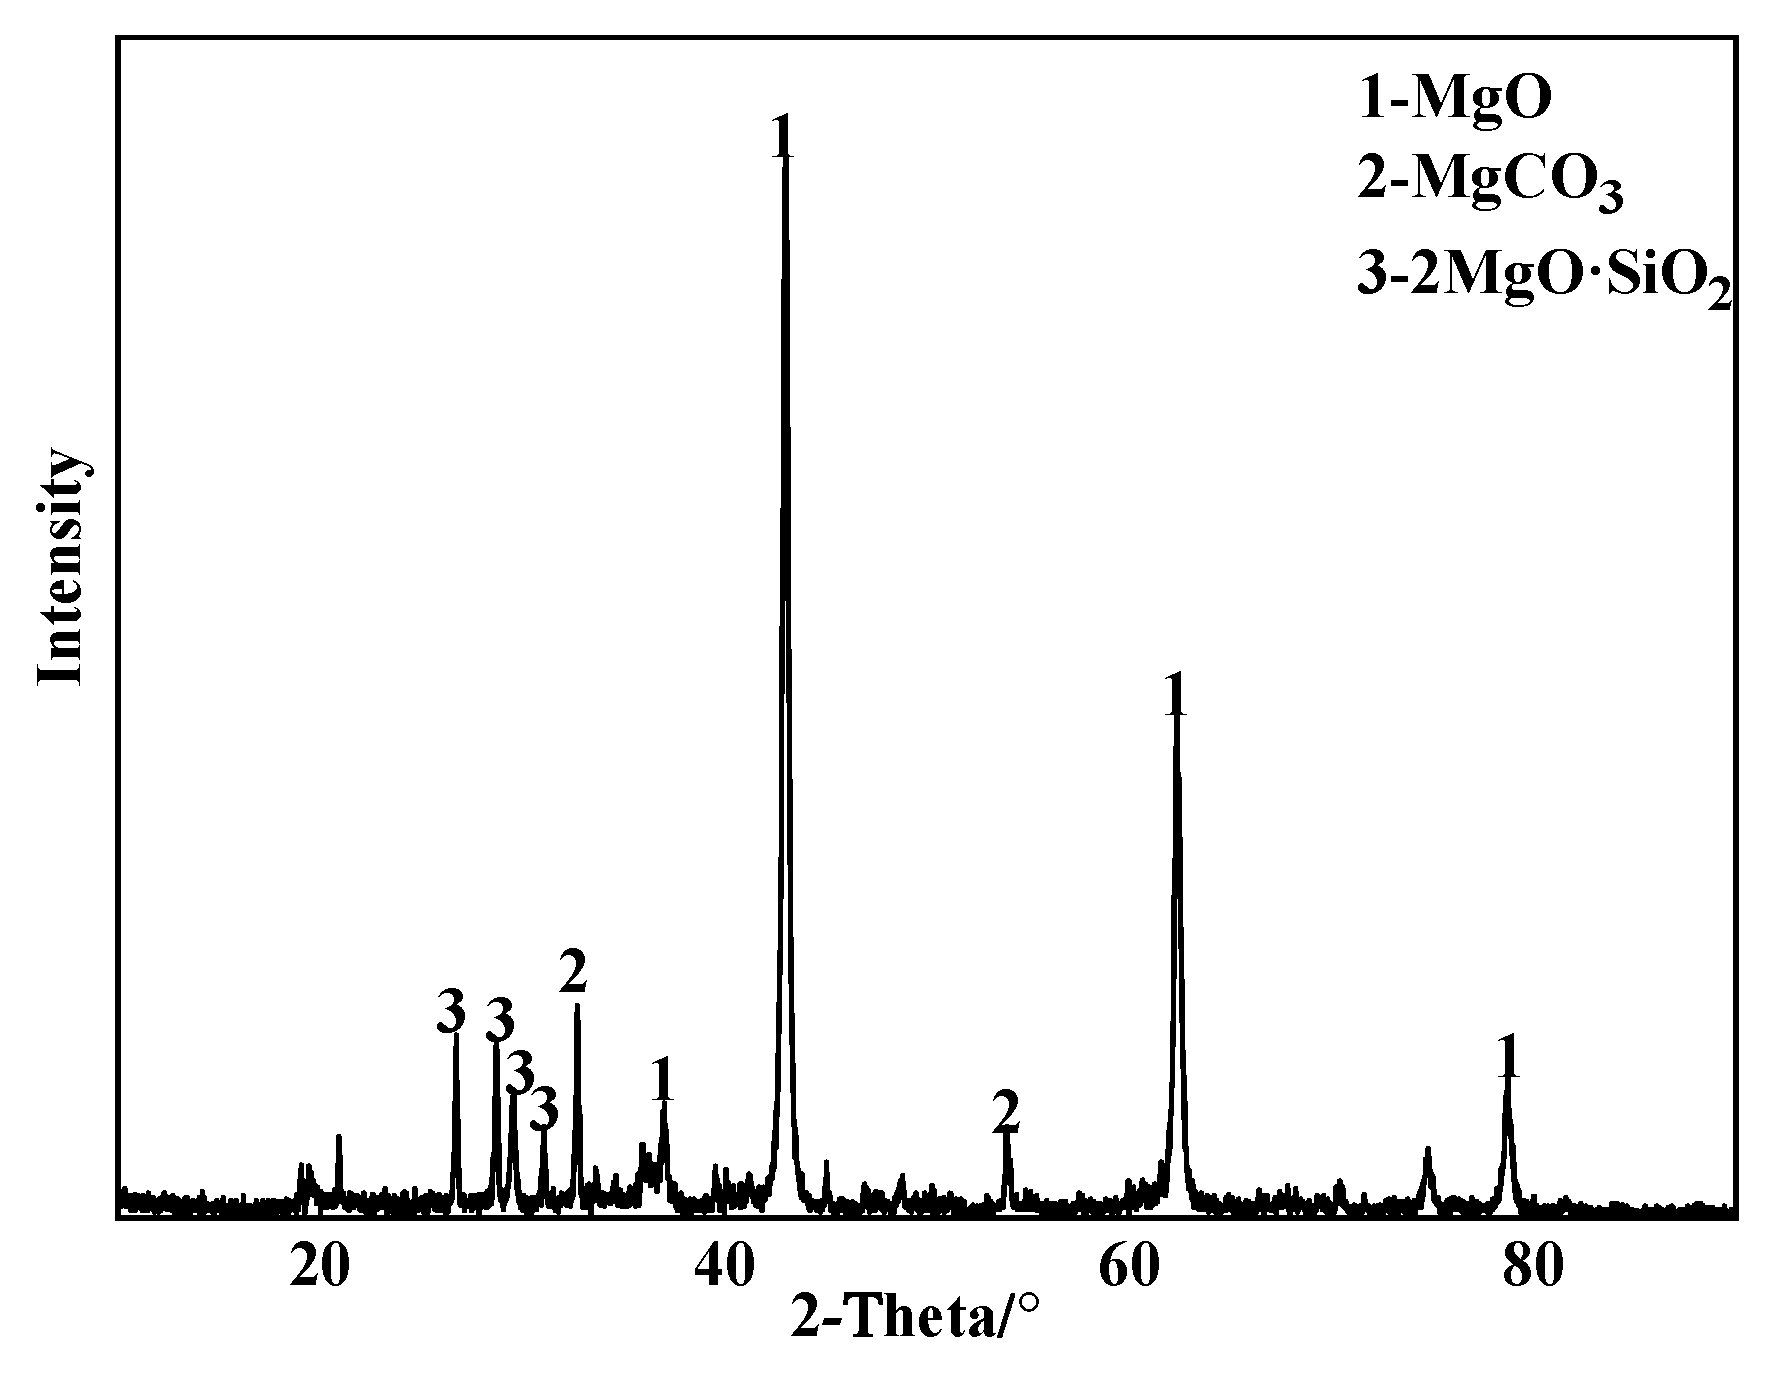
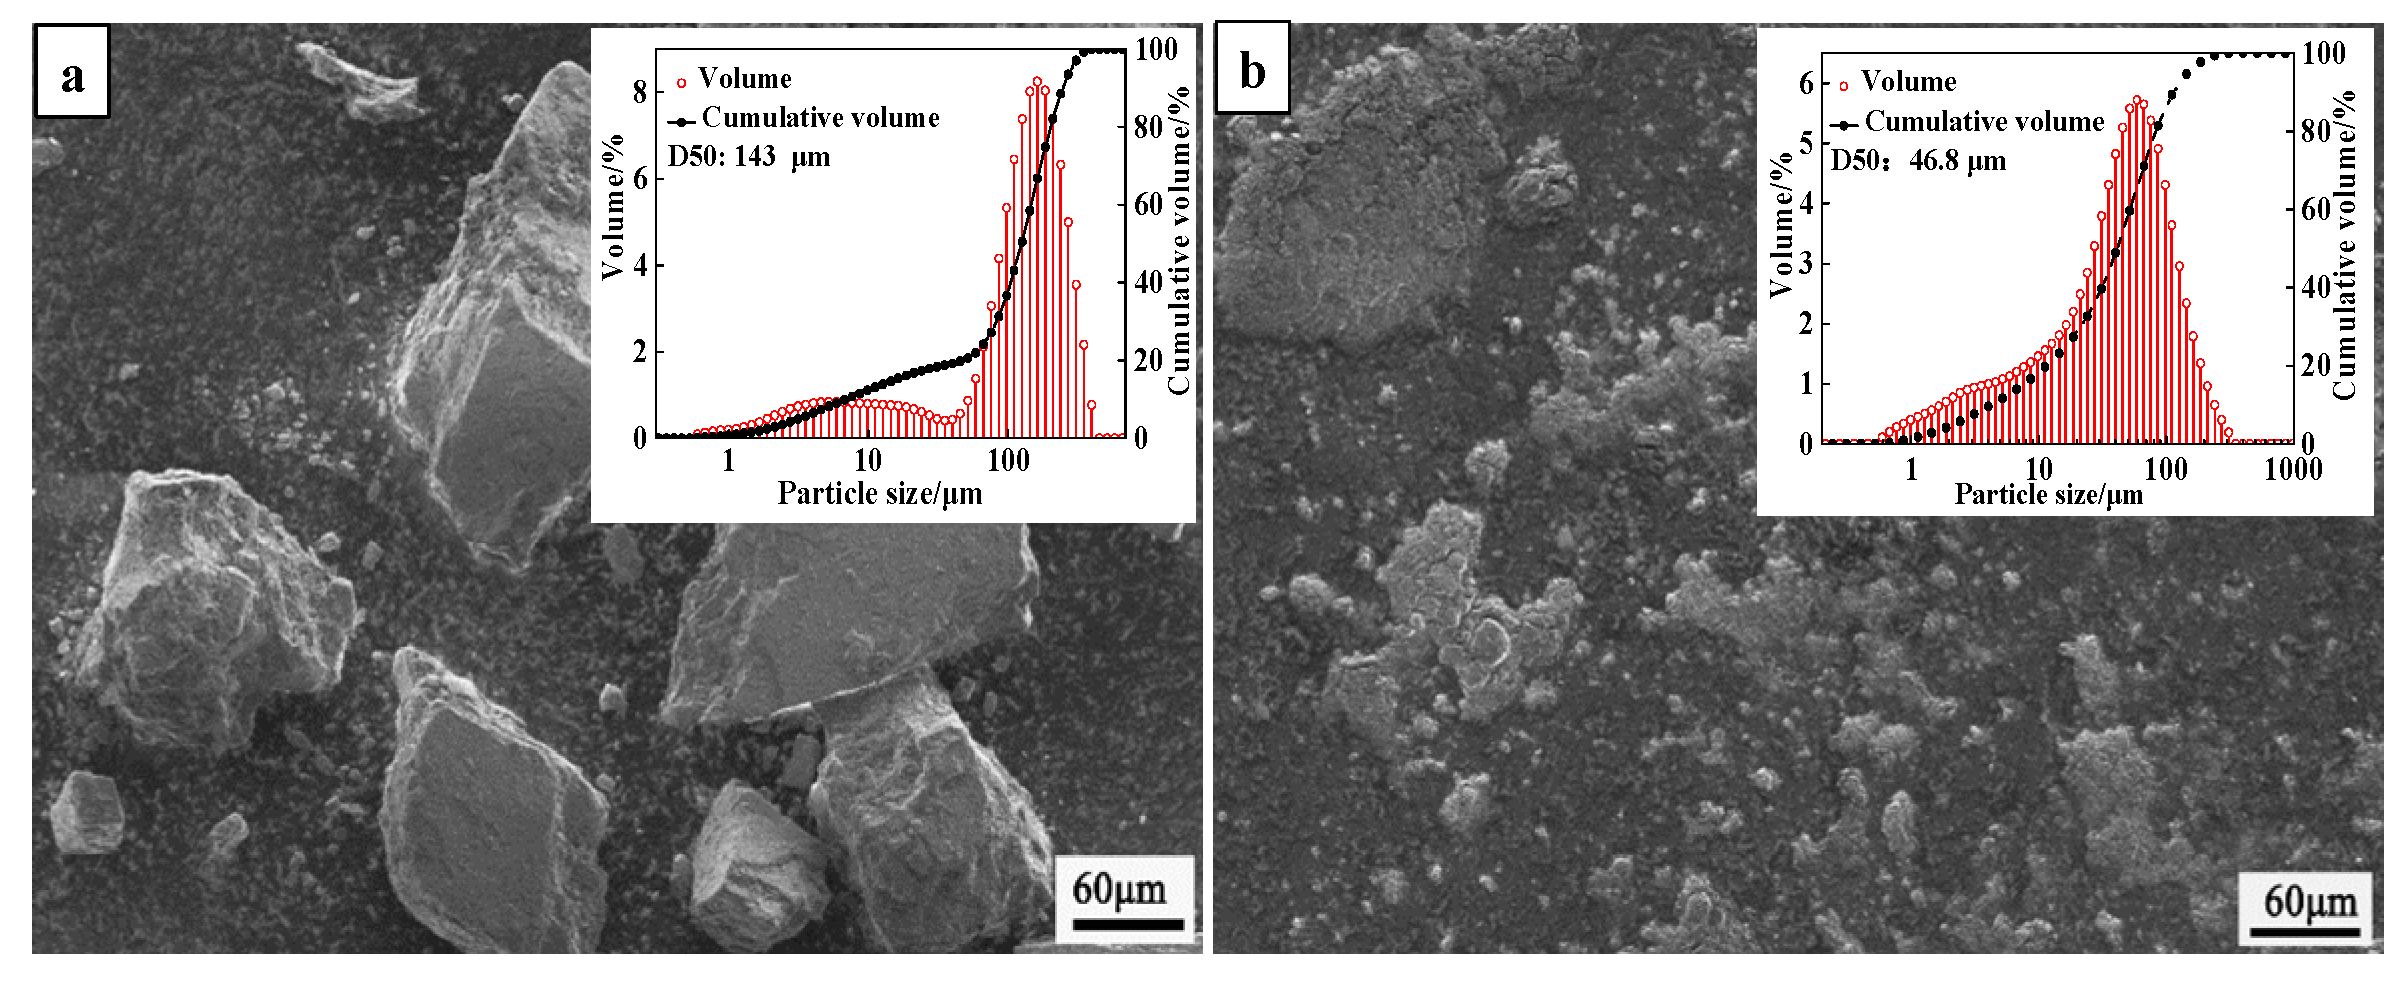
2.1. Characterization
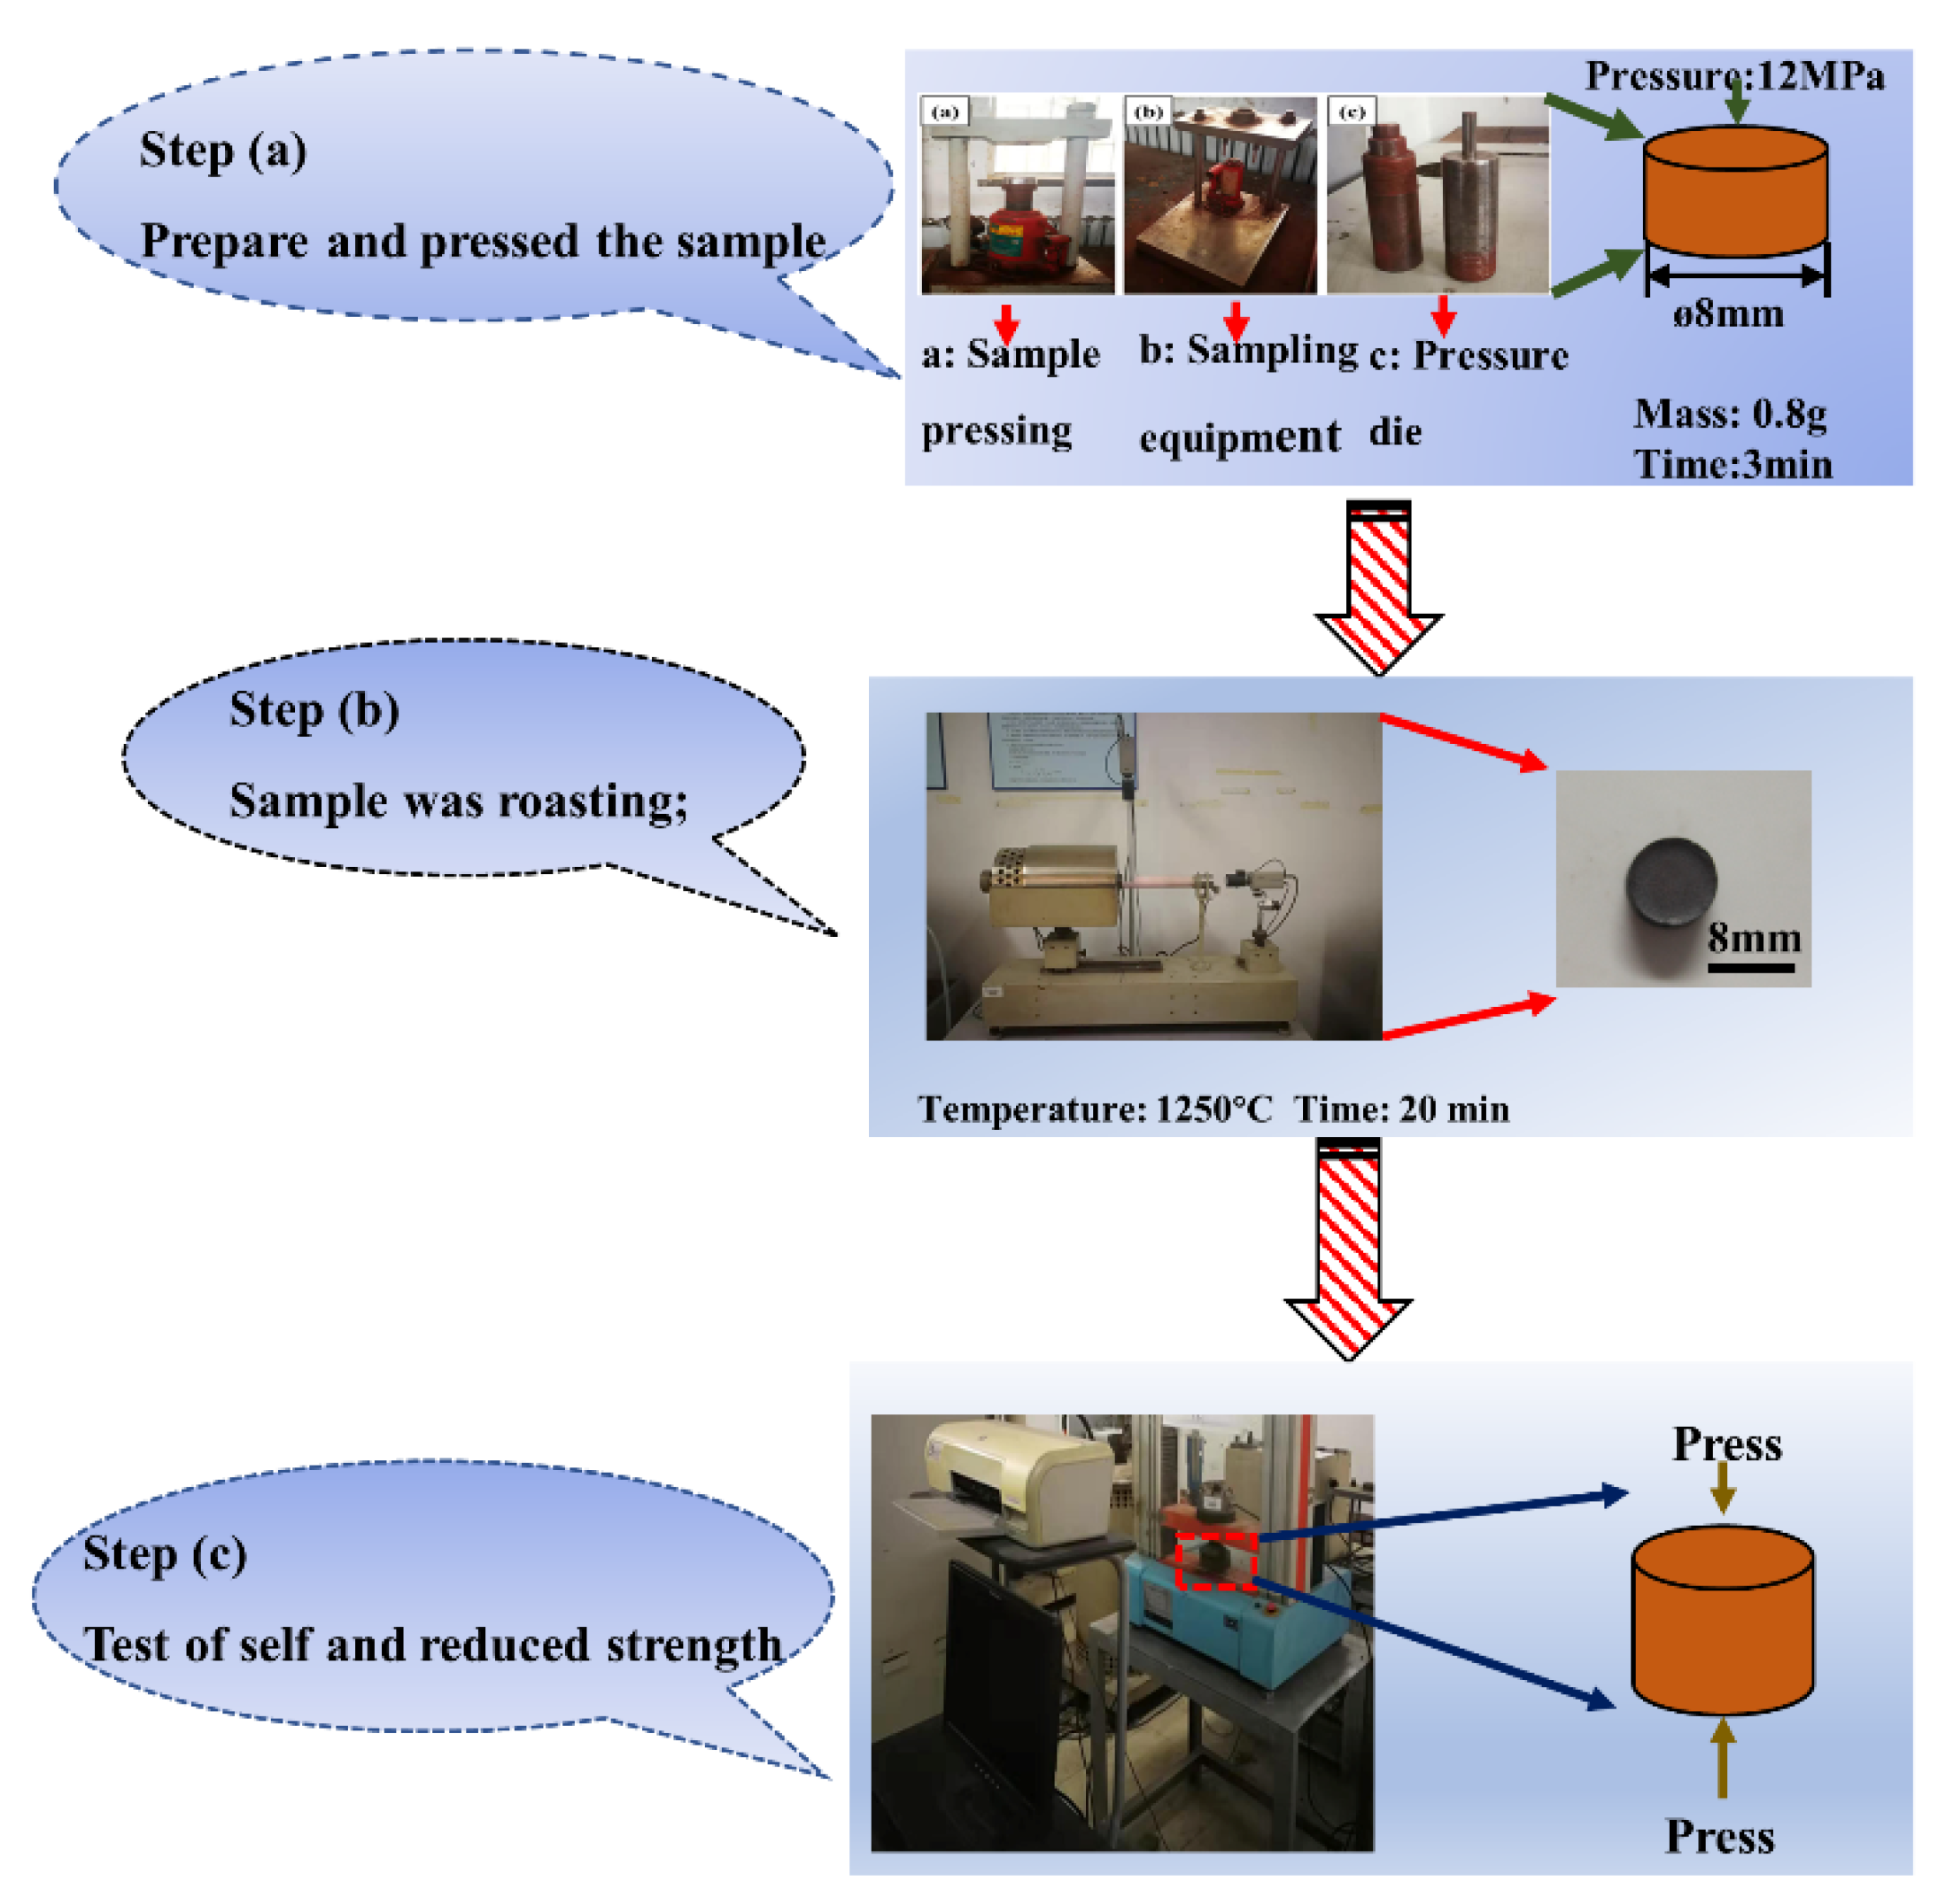
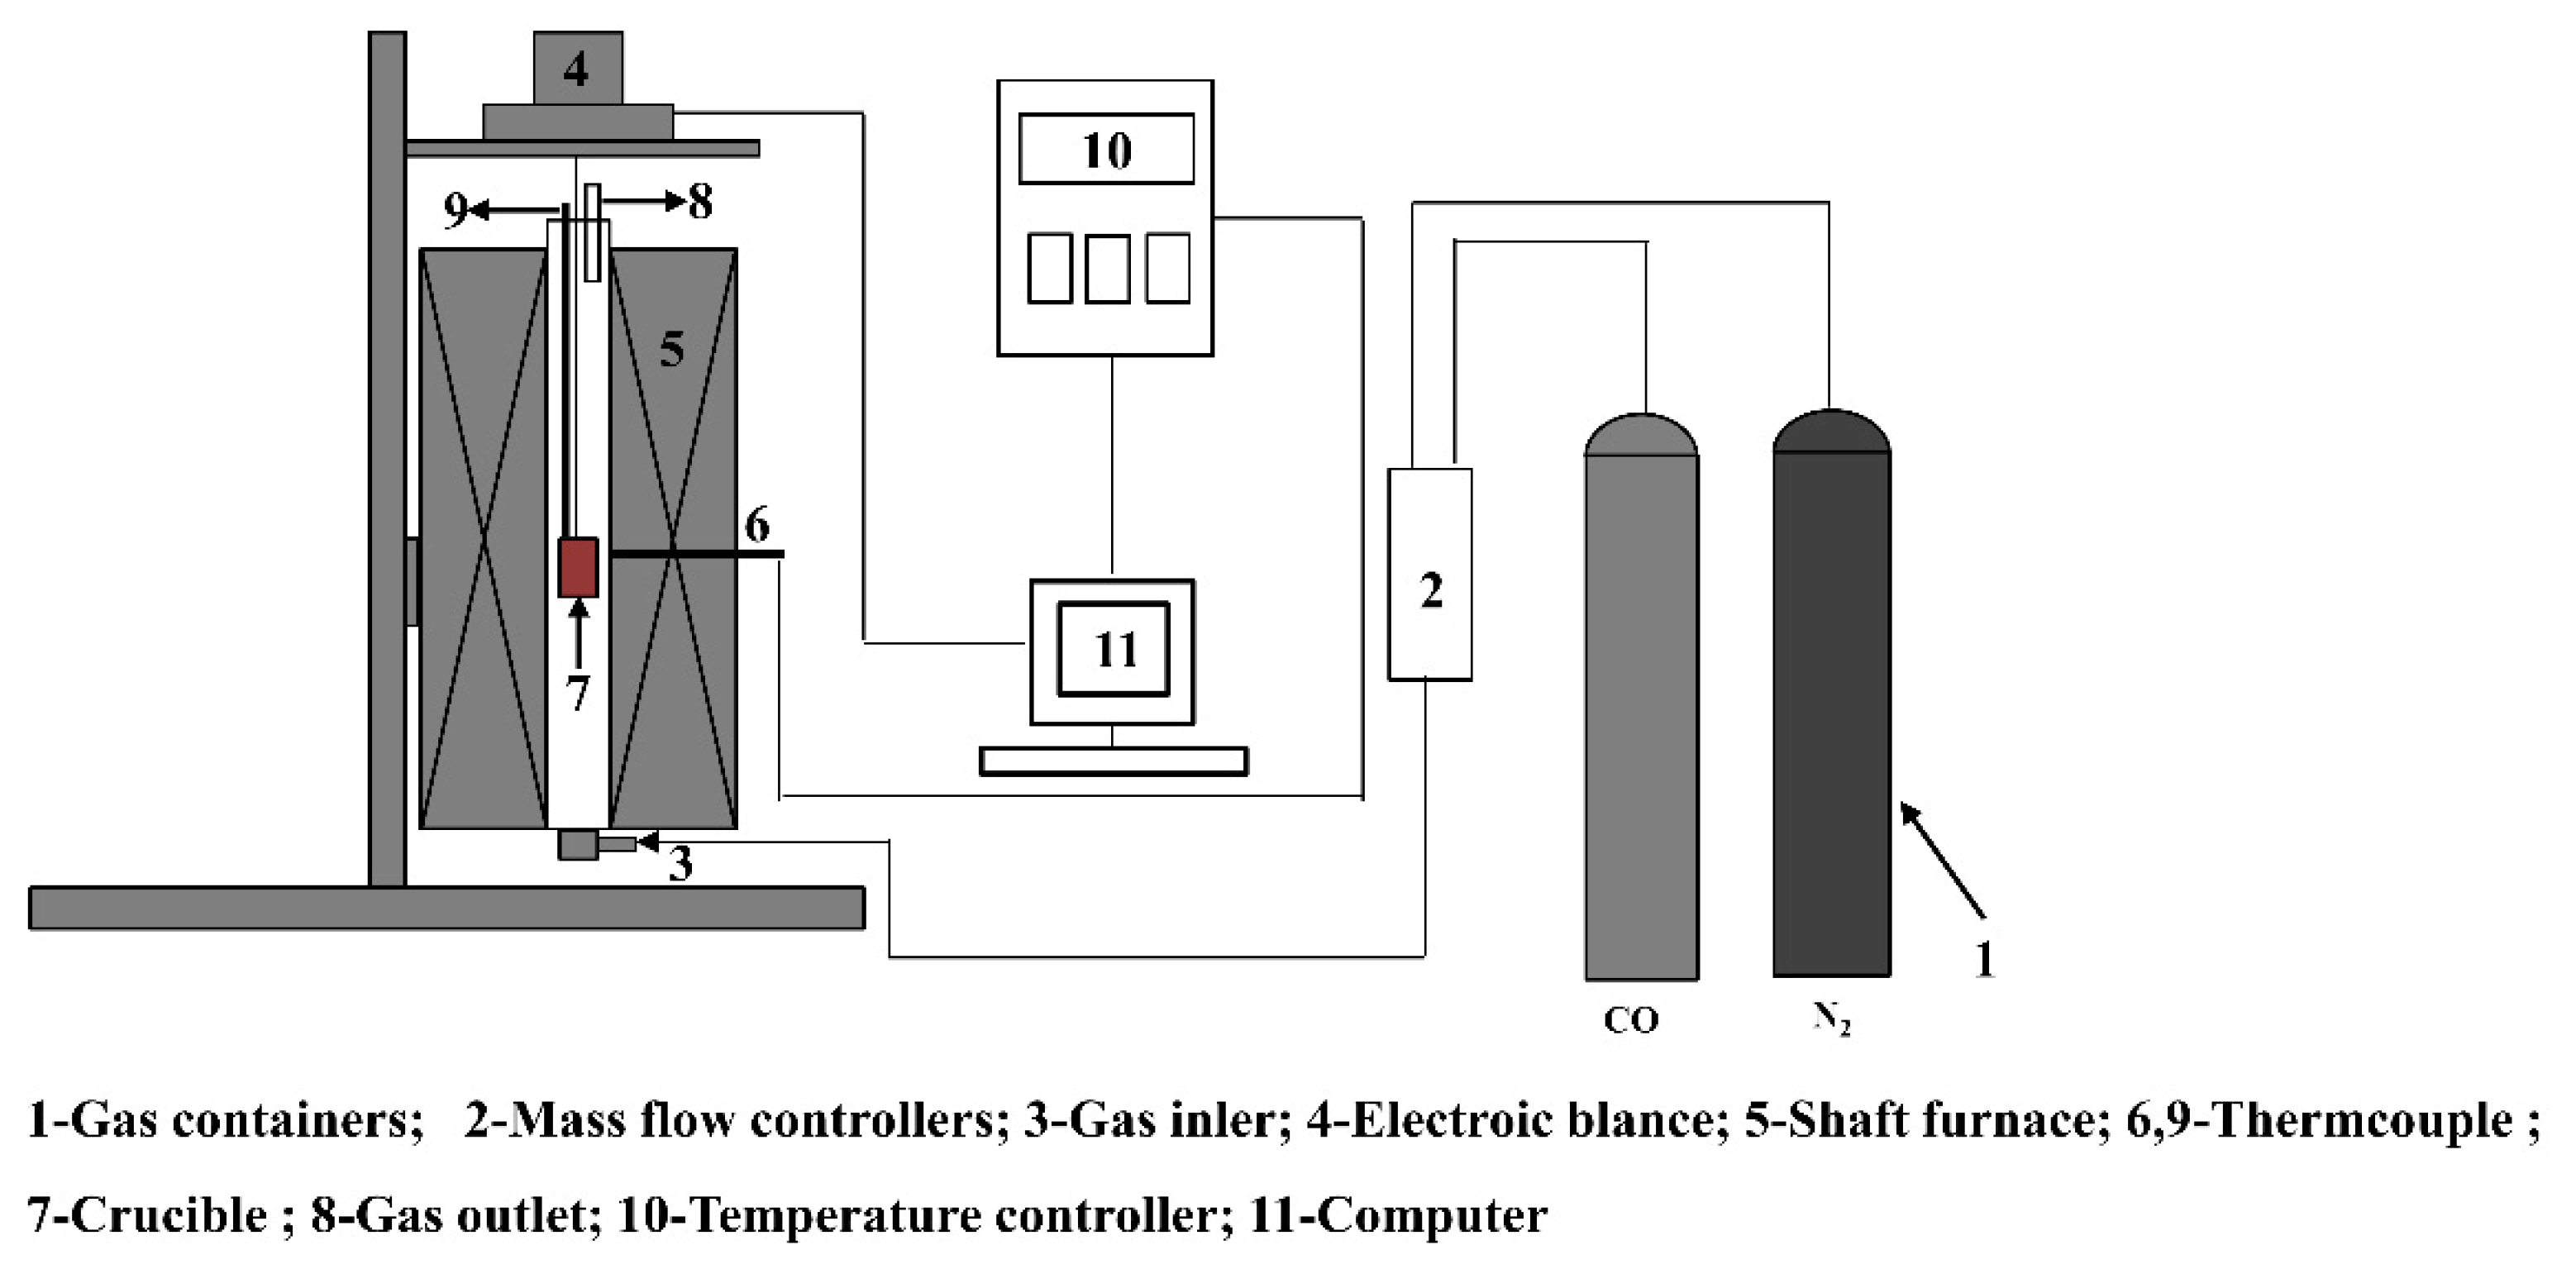
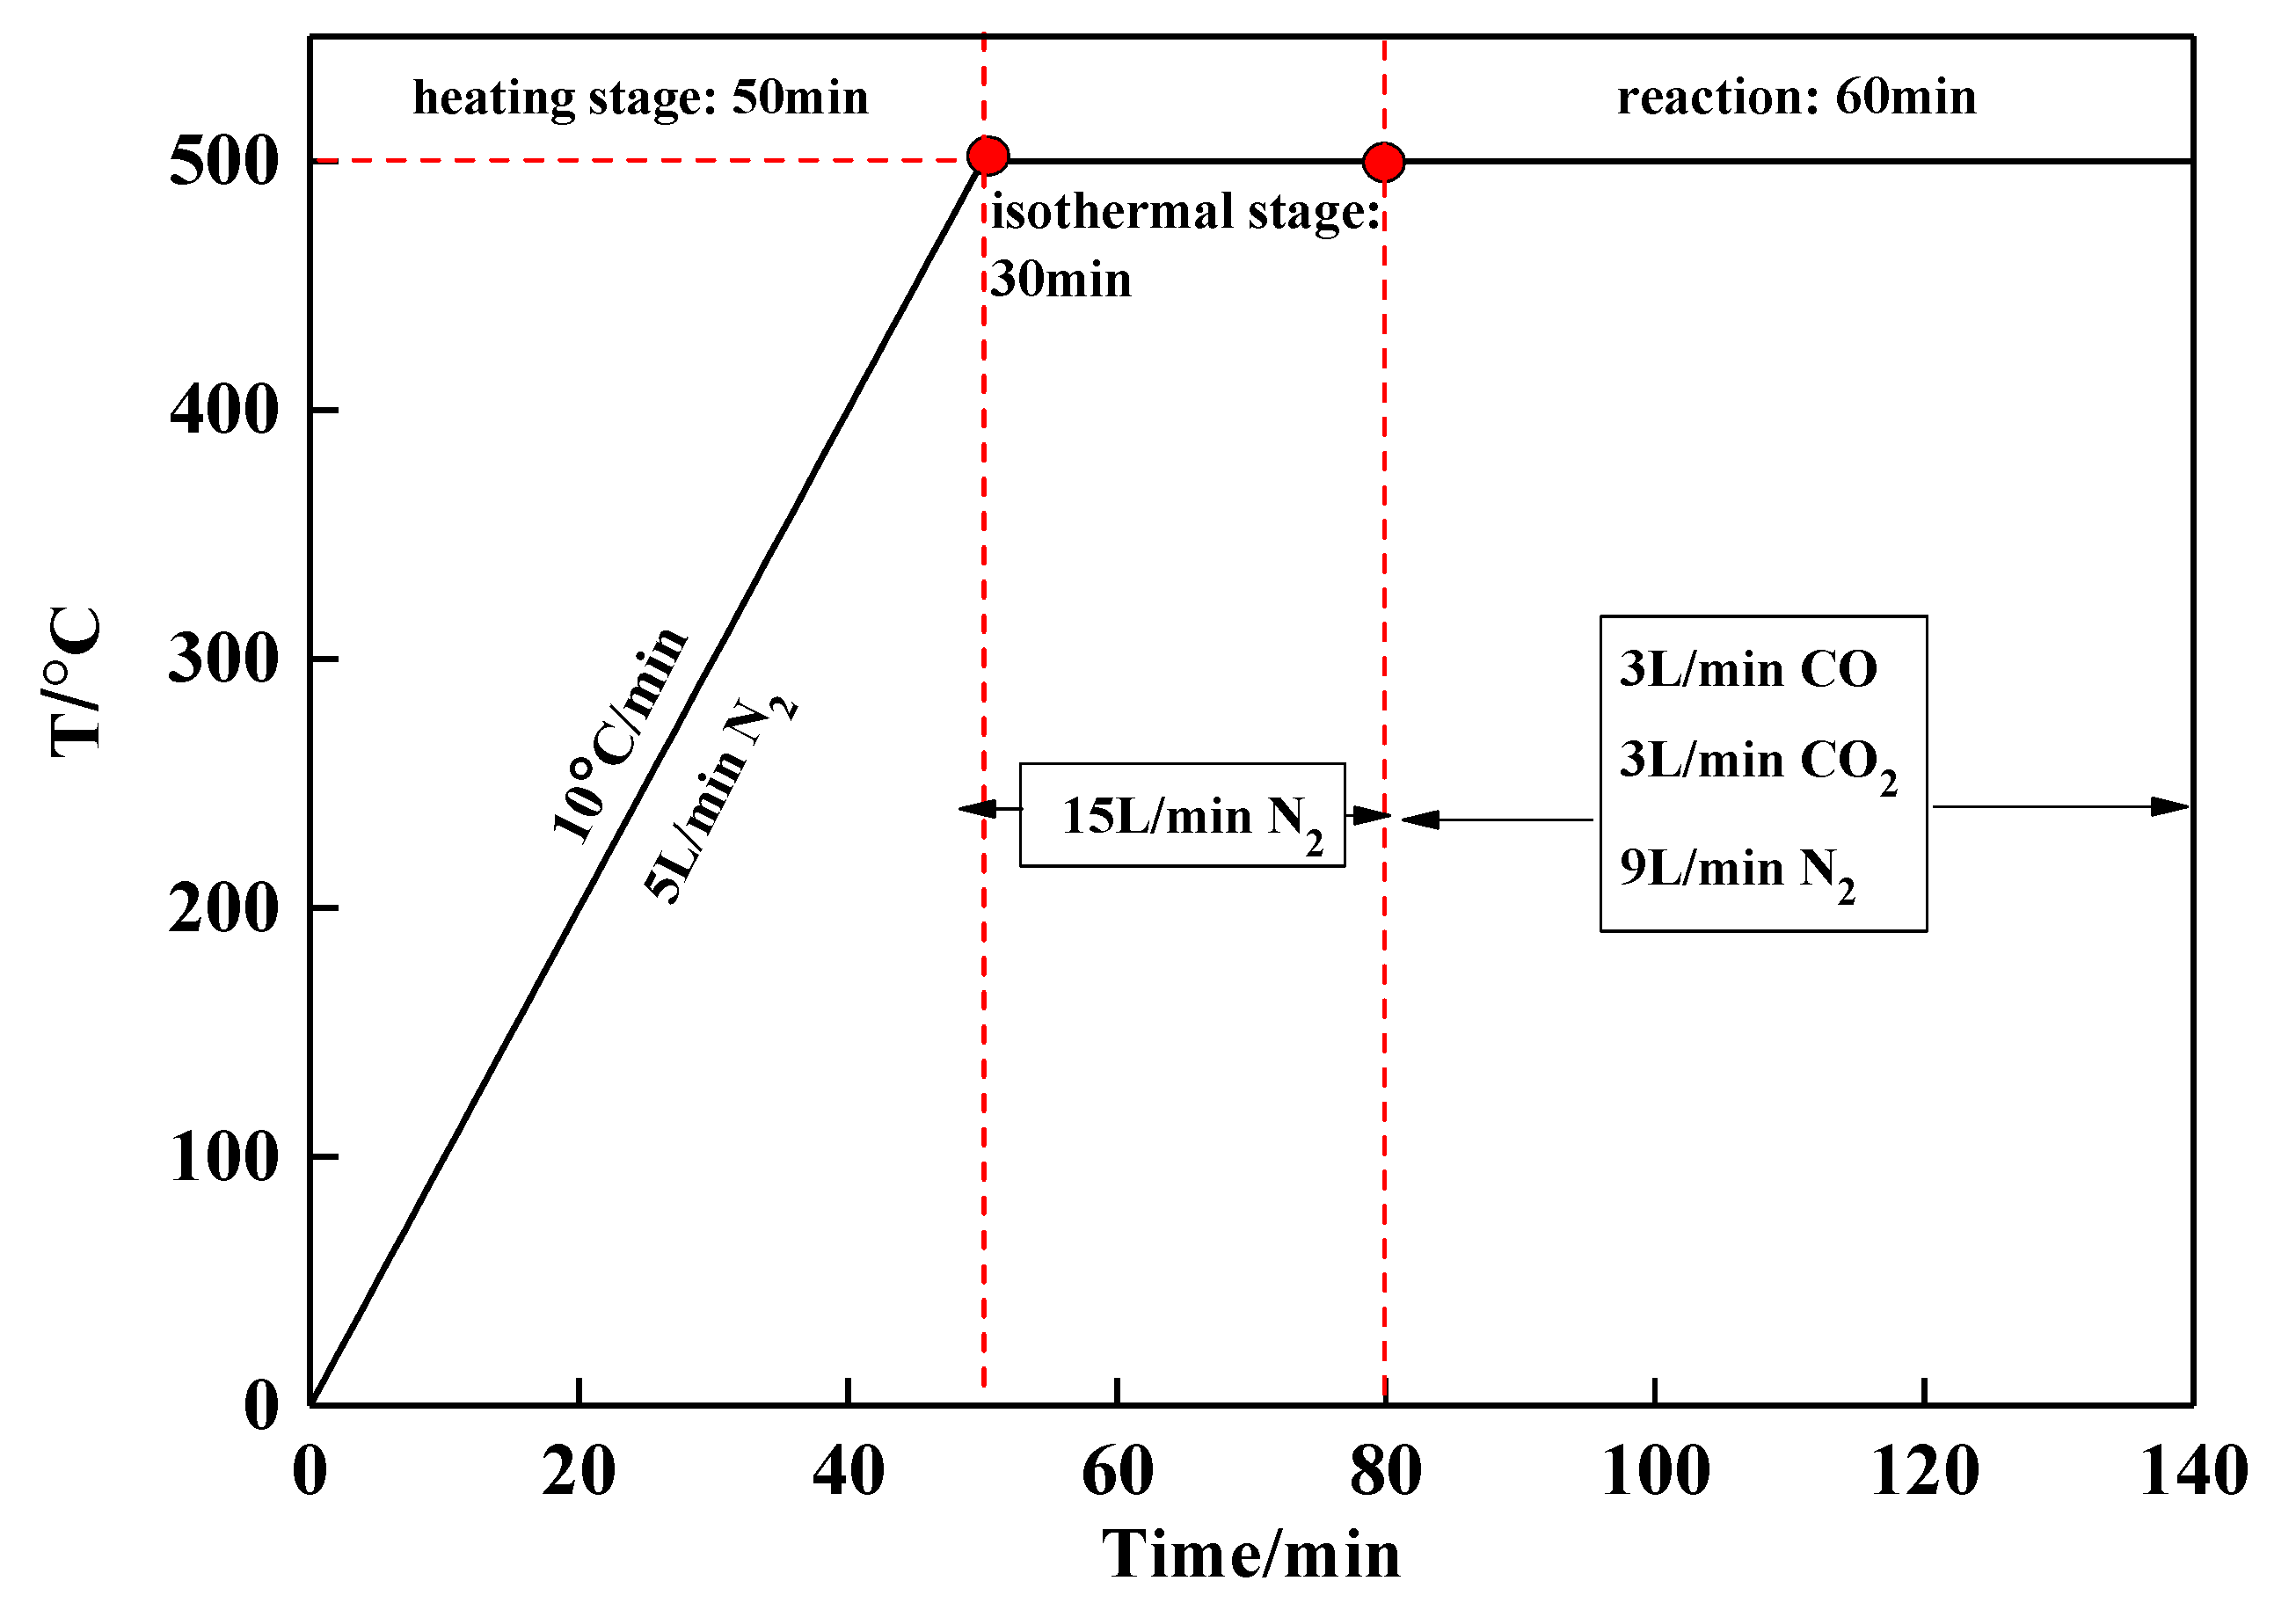
The dolomite, light calcined magnesite (LCM), and chemical reagents (Fe2O3 and CaO) used in this study were obtained from a domestic enterprise. The chemical compositions and XRD analysis (X’Pert Pro; PANalyical, Almelo, The Netherlands) of LCM are shown in Table 1 and Figure 1, respectively. As shown in Figure 1, the mineral phases primarily included magnesium oxide (MgO), magnesium carbonate (MgCO3), and magnesium silicate (2MgO·SiO2). The chemical composition analysis agreed with the XRD results. The chemical composition of dolomite is shown in Table 2. As shown in Table 2, the contents of CaO and MgO were 31.3% and 19.01%, while the composition of other components was lower; the loss of ignition (LOI) was higher (44.56%) compared with the LCM.
The LCM of different particle sizes was used in this test aim to study the influence mechanism of particle size of LCM on the sample strength before and after reduction. The coarse LCM was grinded and the fine LCM was produced. Then, the coarse and fine LCM were analyzed by laser granulometry (Mastersizer 3000, Marvin City, UK) and SEM (Zeiss, Dresden, Germany). The results are shown in Figure 2. As shown in Figure 2, the median size of coarse LCM was 143 μm and that of fine LCM was 46.8 μm.
The experiment was mainly assigned to the Fe2O3-MgO and Fe2O3-MgO-CaO series. The main reasons were as follows: (1) in the study, MgO mainly reacted with Fe2O3 to generate MgO·Fe2O3. Therefore, the Fe2O3-MgO series was introduced in the paper. (2) In the case of actual production, CaO reacted with Fe2O3 to generate CaO·Fe2O3, which influenced the strength and reduction of sinter. Therefore, the Fe2O3-MgO-CaO series was designed.
The detailed experimental design is laid out in Table 3. The dolomite replaced LCM in the subsequent mechanism study (Section 4.1) to achieve better understanding of the effect of MgO on the mineralization of sinter in actual production.

2.2. Procedures

The main process in the study is shown in Figure 3. It could be seen that the experiment equipment mainly included the sample pressing equipment (Kexiang, Anshan, China) (Figure 3 (step a)), the sintering basic characteristics furnace (Kexiang, Anshan, China) (Figure 3 (step b)), and the compressive strength measurement device (Kexiang, Anshan, China) (Figure 3 (step c)).
For the low-temperature reduction experiment (Boston, MA, USA), the experiment equipment is shown in Figure 4, and the reduction atmosphere and heating program is shown in Figure 5. The experiment’s set-up mainly comprised eleven facilities, and the reduction furnace was 800 mm in height and 75 mm in diameter. The experiment’s methods of determining the sample’s compressive strength before and after reduction were the same, as shown in Figure 3 step (c). The sample compressive strength after reduction was used as an index to evaluate the RDI in the present work. In addition, the CS was defined as the compressive strength before reduction, and the RCS was defined as the compressive strength after reduction.
The sintering pot experiment (Kexiang, Anshan, China) was carried out for verification of the results of the above experiment. The raw materials used in the study were obtained from an iron and steel enterprise in China, including blended ore, return ore, LCM, coke, etc. The ore-matching scheme of the sintering pot test is shown in Table 4. As shown in Table 4, the addition amount of LCM was fixed, and the variables were the proportions of finely ground LCM powder of 1 mm, which were 0, 50, 100%. After sintering, the tumbler index, falling strength and the RDI−3.15 experiments were carried out in the study. For the tumbler index, the main steps were as follows: (1) the sinter was put in the tumbler equipment that was design according to international standards (Diameter = 1000 mm, Length = 200 mm). The sinter was weighted by particle sizes of 25~40 mm, 16~25 mm and 10~16 mm by percentage and the total amount was 7.5 kg; (2) the tumbler equipment started to rotate in 25 r/min and the running time was 8 min. (3) After the experiment was complete, the sinter mass above 6.3 mm was denoted as M5.
The method of calculation for the sintering index was as follows: M1 is the weight of the sintering charge after mixing with water; M2 is the weight of the remaining sintering charge after loading into sintering pot; M3 is the weight of sinter after experiment; M4 is the weight of sinter that particle size is greater than 5 mm when the falling strength test was completed; M5 is the weight of sinter that particle size is greater than 6.3 mm when tumbler strength test was completed; H: the layer height, 655 mm. The weight of bedding materials used is 4 kg.
(1) Vertical sintering speed V (mm/min):
V = H / t ,
where t is the sintering time.
(2) Yield nnp (%):
n n p = M 4 4 M 3 4 × 100 % .
(3) Utilization coefficient N (t/m2·h):
N = 60 × M 4 4 A × t × 1000 ,
where A is the cross-sectional area of the sintering pot
(4) Tumbler index DI (%):
D I = M 5 7.5 × 100 % .
Meanwhile, the low-temperature reduction degradation index (RDI) was obtained by the reduction experiment. The experiment and calculation method a of RDI−3.15 refer to the GB/T 13242-91.

2.3. Analysis Methods

In order to undertake a qualitative analysis of the mineral phases of different samples, the X-ray diffraction (XRD, X’Pert Pro; PANalyical, Almelo, The Netherlands), which is monochromatic Cu-Ka X-ray radiation and whose wavelength is 1.5406 Å, was used in the study under of 40 kV and 40 mA. The experimental parameters of XRD were as follows: (1) Scanning range: 10~85°; (2) Scanning speed: 6°/min; (3) Step size: 0.05°. The micromorphology of a sample may influence its compressive strength and reduction. So, the scanning electron microscopy, based on energy-dispersive X-ray spectrometer (SEM/EDS; Ultra Plus, Zeiss, Dresden, Germany) and the Schottky-type field-emission (Zeiss, Dresden, Germany), was used in the experiment. The resolution ration is 0.8 nm/15 kV and 1.6 nm/1 kV at 20 V to 30 V, respectively. The mercury porosimeter is used in the study for obtaining the porosity with CS and RCS of a different fine LCM addition. The main principle of mercury porosimeter is that mercury is pressured into the pore and obtains the porosity based on the cylindrical hole mode

3. Results

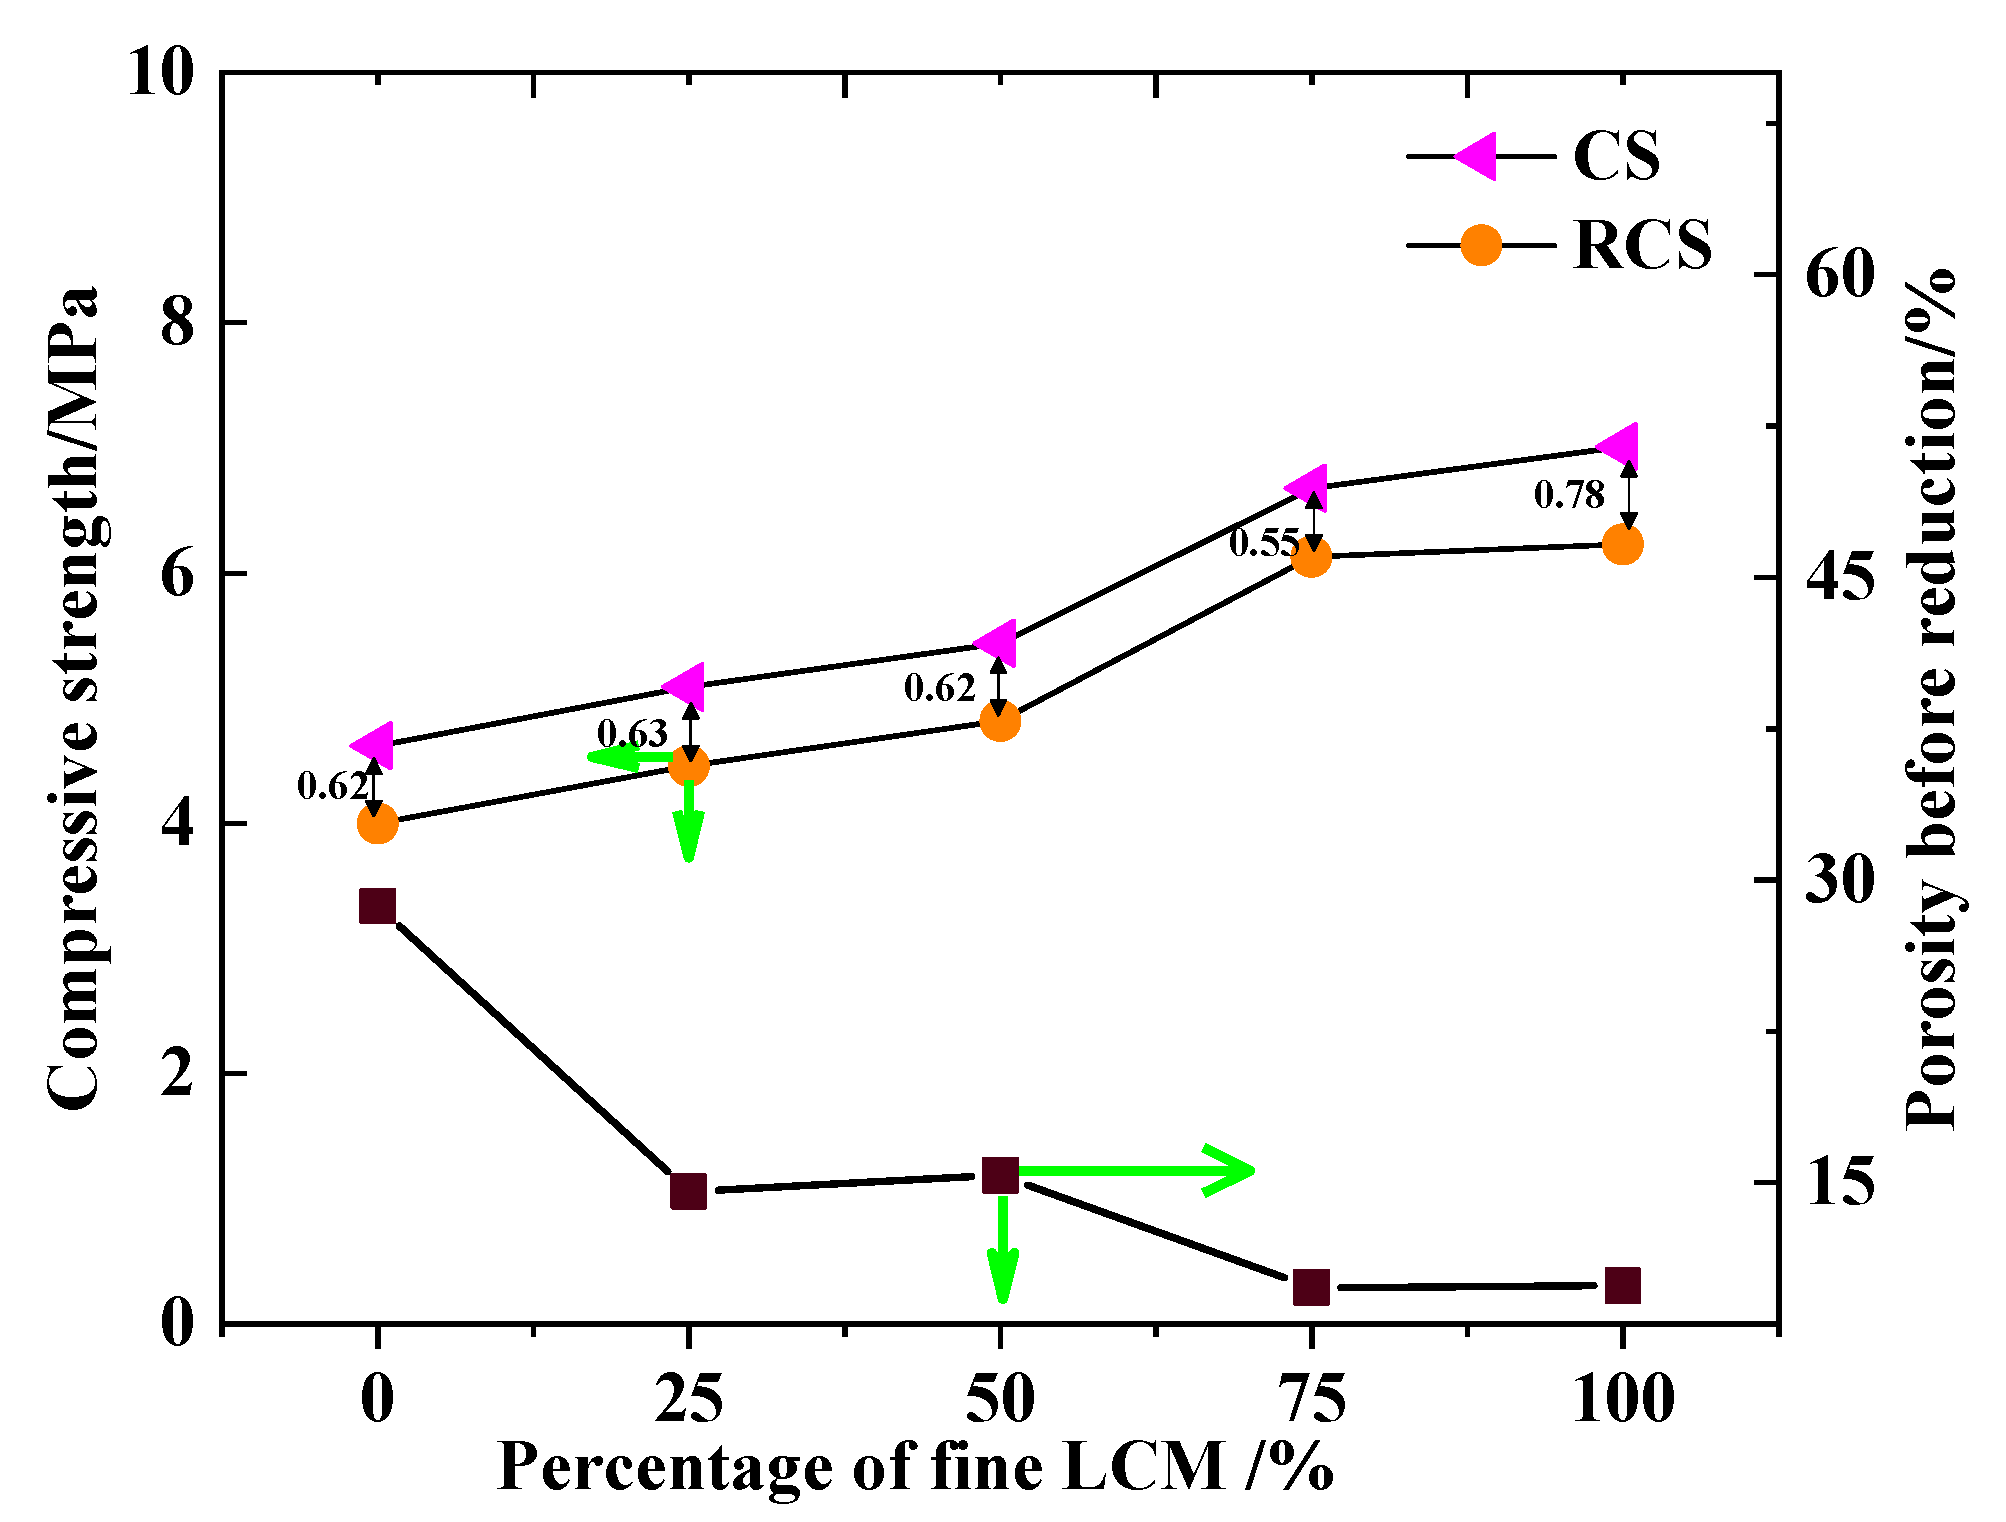
3.1. Experimental Results of Fe2O3-MgO Series and Fe2O3-MgO-CaO Series

The results of CS and RCS with Fe2O3-MgO samples are shown in Figure 6. It could be seen that the CS increased from 5.66 to 7.42 MPa and that the RCS increased from 2.49 to 6.03 MPa with the increase in the fine LCM addition from 0% to 100%. In the case that the level of fine LCM addition was the same, the RCS was significantly lower than the CS; and the differential value between the CS and RCS decreased from 3.17 to 1.39 MPa with the increase in fine LCM addition. Meanwhile, the porosity of a sample before reduction decreased from 40.5% to 25.6% with the increase in fine LCM addition. The porosity of samples and the CS had an inversely proportional relationship, which will be discussed below. The main reason for the decrease in the differential value between CS and RCS was that the generation of more MgO·Fe2O3 could inhibit the low-temperature reduction degradation with the increase in fine LCM addition (refer to XRD and SEM).
The results of CS and RCS with Fe2O3-MgO-CaO samples are shown in Figure 7. It could be seen that the CS and RCS increased from 4.62 to 7.01 MPa and from 4 to 6.23 MPa with the increase in fine LCM addition from 0 to 100%. However, the increasing rate of CS and RCS became low when the fine LCM addition exceeded 75%. The CS was more than RCS of sample when the fine LCM addition was the same. The differential value between CS and RCS increased from 0.62 to 0.78 MPa with the increase in fine LCM addition from 0 to 100%. The main reasons were as follows for the above phenomenon: (1) the formation of more CaO·Fe2O3 could decrease the porosity of sample with the increase in fine LCM addition; (2) The transformation of Fe2O3 to Fe3O4 was inhibited in low-temperature reduction process. Based on the above analysis, the differential value between CS and RCS was similar for different fine LCM addition proportion. The porosity of sample without reduction decreased from 28.7% to 9.9% with the increase in fine LCM addition. However, the porosity was similar when the fine LCM addition exceeded 75%. The transformation regularity of porosity was also a main reason for the change in CS of the sample.
The relationship between compressive strength and porosity is defined in Equation (5), as follows [16]:
S = K d α exp β p ,
where S is the compressive strength; K, α and β are coefficients determined by the particle size, shape and cracks of sample, the sample with different fine LCM amounts exhibit different properties; d is the radius of sample; and p is the porosity. In Equation (5), the compressive strength decreases with an increase in porosity.
The critical rupture stress was explained using the Griffith microcrack theory [17,18]:
σ = Y E γ C ,
where σ is the critical rupture stress, Y is the correlation coefficient determined by the size and shape of the sample and its crack, E is the elastic modular ration, γ is the surface energy, and C is the half-length of the crack.
The relationship between the elastic modular ratio and porosity is expressed as follows:
E E 0 = 1 K 1 p + K 2 p 2
where E0 is the elastic modulus ratio of the sample without any pores, and K1 and K2 are the coefficients determined by the shape and direction of the cracks.
As indicated in Equation (7), when p is small, K2p2 is relatively small and thus can be ignored. Therefore, the relationship between the critical rupture stress and porosity can be expressed as follows:
σ = Y E 0 1 K 1 p γ C
Equation (8) indicated that the critical rupture stress decreases with the increase in porosity. Therefore, the porosity decreased, and compressive strength increased with the increase in fine LCM.

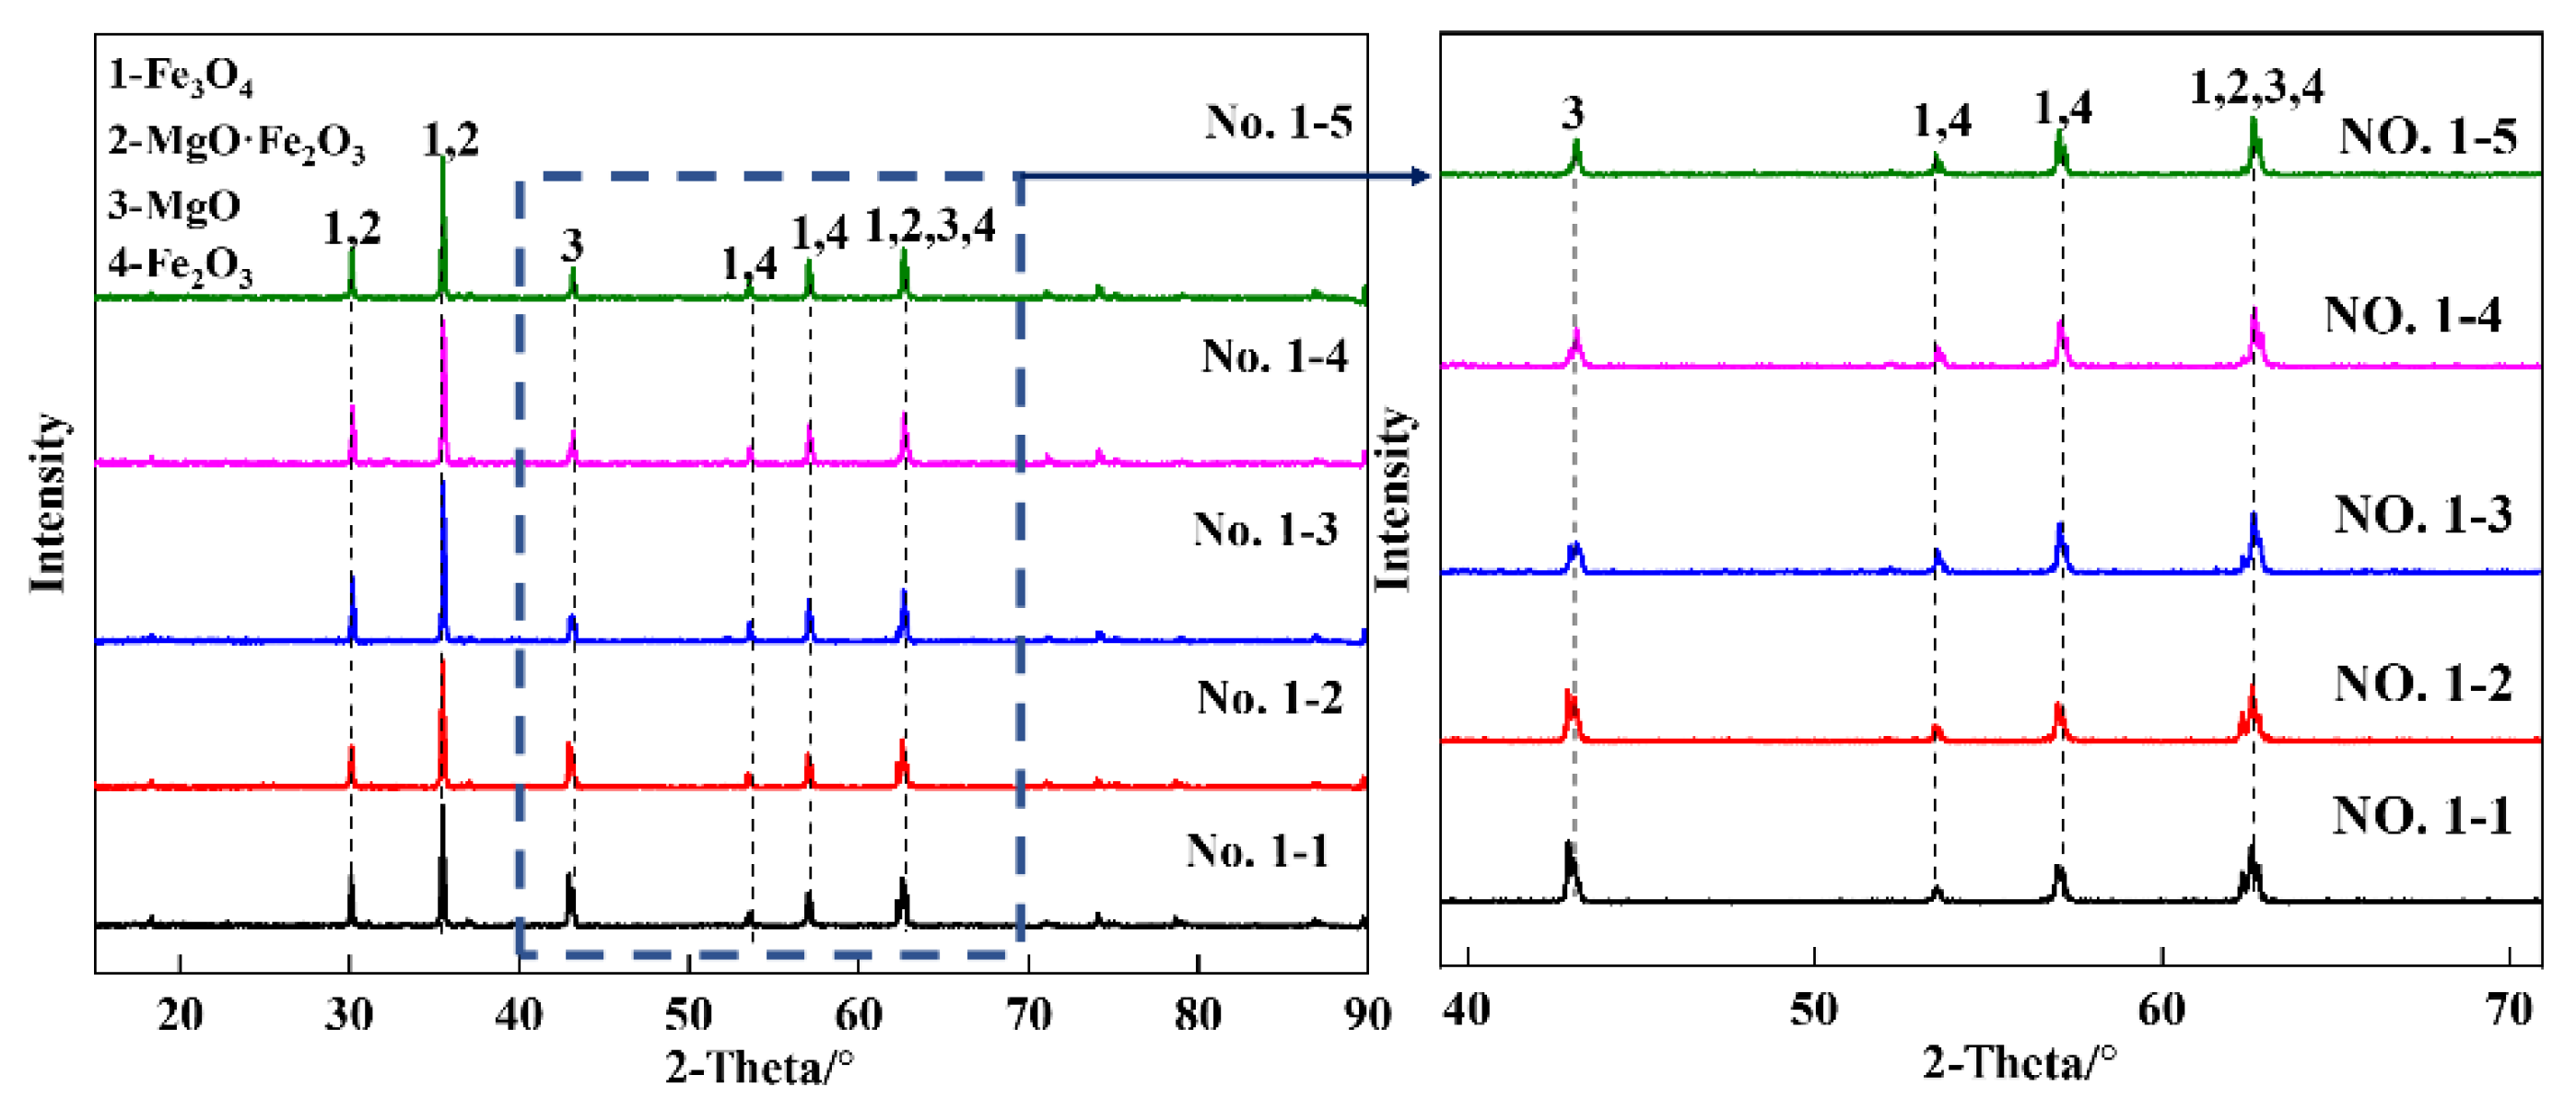
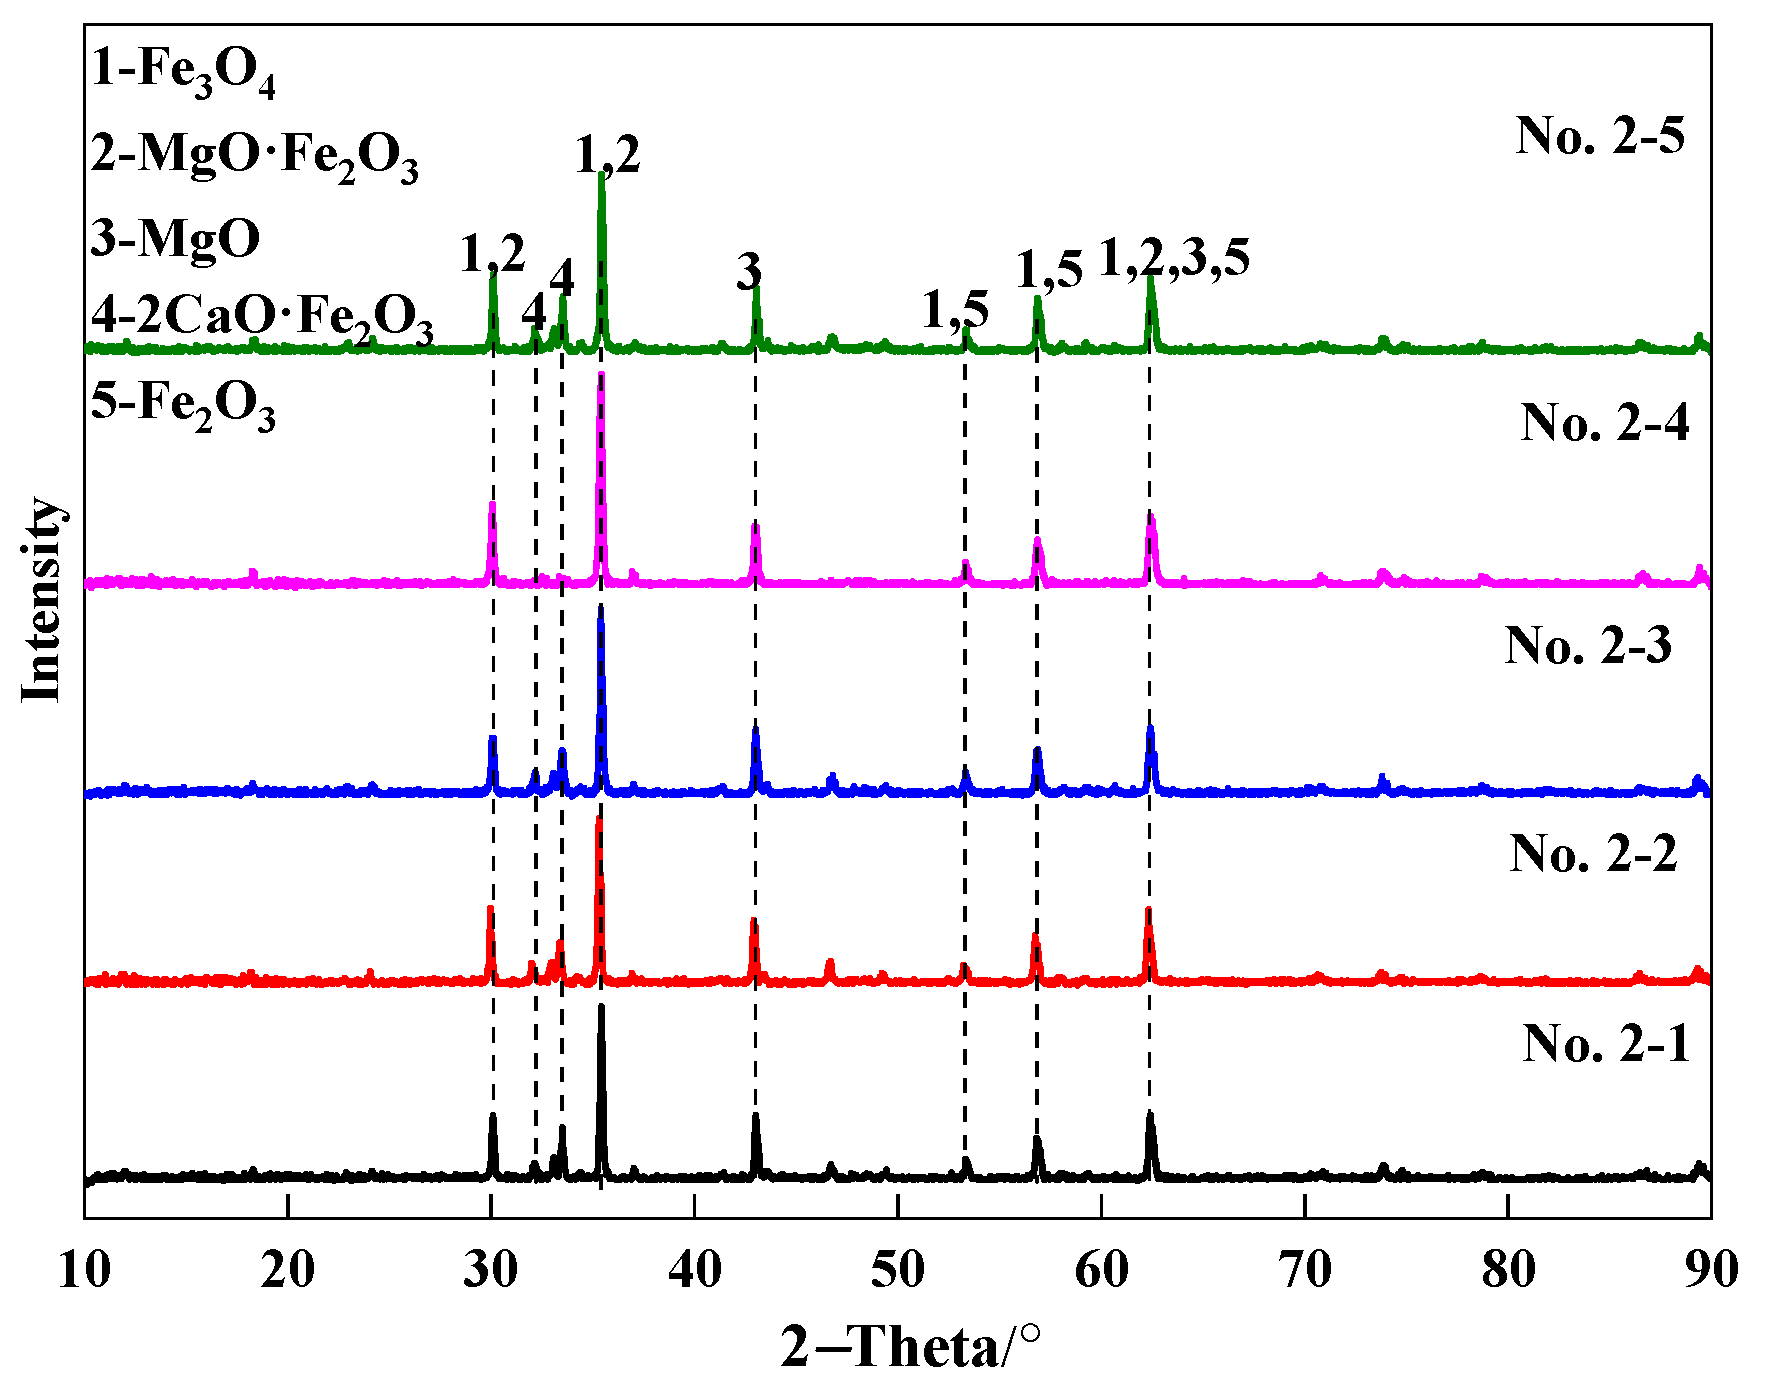
3.2. XRD and SEM Analysis on the Sample of Fe2O3-MgO

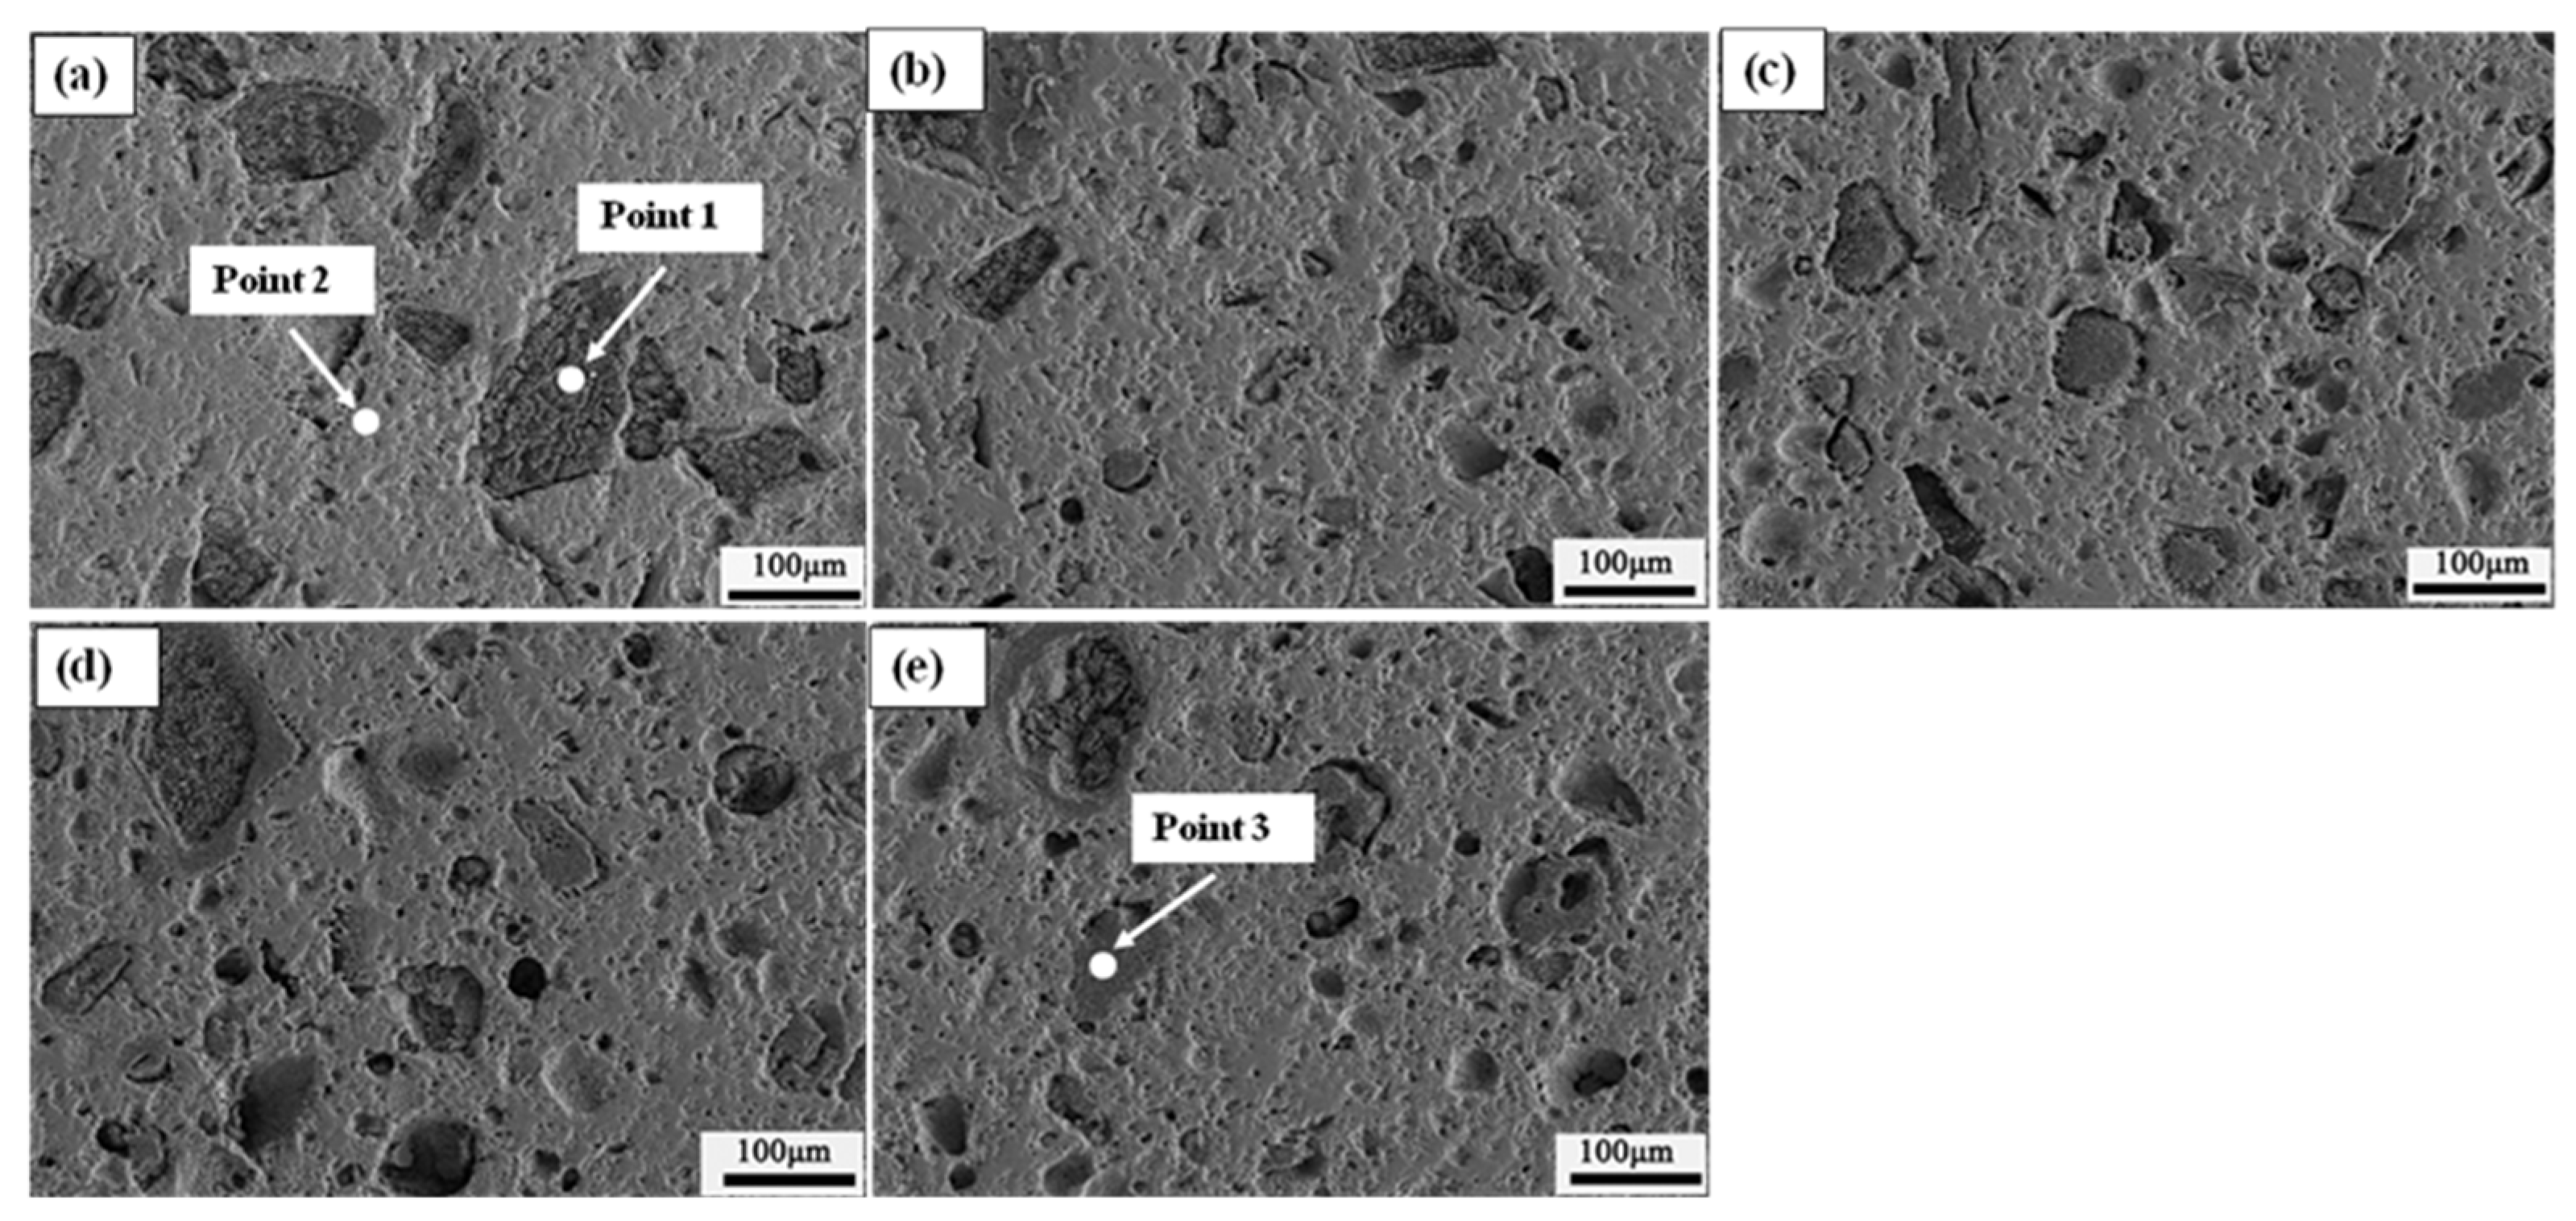
3.2.1. Fe2O3-MgO System Sample before Reduction

Figure 8 presents the XRD patterns of Fe2O3-MgO series samples with different fine LCM addition It could be seen that the main mineral components of the sample were Fe2O3, MgO and MgO·Fe2O3 after roasting. In the case of the increase in the fine LCM addition proportion, the peak corresponding to MgO·Fe2O3 strengthened gradually, whereas that of MgO weakened, and the others mineral compositions had not undergone obvious variation. It could be seen in the XRD local expansion diagram that the peak intensity corresponding to Fe2O3 gradually increased with the increase in the fine LCM addition.
In the roasting process, a part of MgO reacted with Fe2O3 through diffusion to form an MgO·Fe2O3 solid solution, but the other part of MgO still was not fully diffused and existed in the form of free MgO. In the case of that the level of fine LCM addition was lower, there were a greater level of MgO in free state. Therefore, the increase in fine LCM addition could promote the mineralization reaction in the system, and the decrease in unreacted MgO was beneficial to increasing the CS of the sample. (Refer to Figure 8.)
Figure 9 and Table 5 shows SEM images and EDS analysis with different proportion of fine LCM addition. It could be seen that the microstructure had changed obviously with the increase in fine LCM addition. (1) When the fine LCM addition proportion was 0% (Figure 9a), the main phases were Fe2O3 (Point 2) and unmineralized MgO (Point 1). According to EDS analysis, Fe2O3 hardly reacted with MgO, and MgO·Fe2O3 (solid solution) did not appear. (2) When the fine LCM addition proportion was 25%, the distribution of Fe2O3 grains were relatively uniform; compared with Figure 9a, the content of free MgO decreased and the MgO·Fe2O3 appeared. (3) When the fine LCM addition proportion were 50% and 75%, the microstructures were similar and the main phases were Fe2O3 and MgO·Fe2O3. When the fine LCM addition proportion was 100%, all MgO entered into Fe2O3 through mineralization to form MgO·Fe2O3. Then, the structure of the sample became more uniform and compact, and this was the main reason that the fine LCM resulted in the increase in CS in the Fe2O3-MgO series.

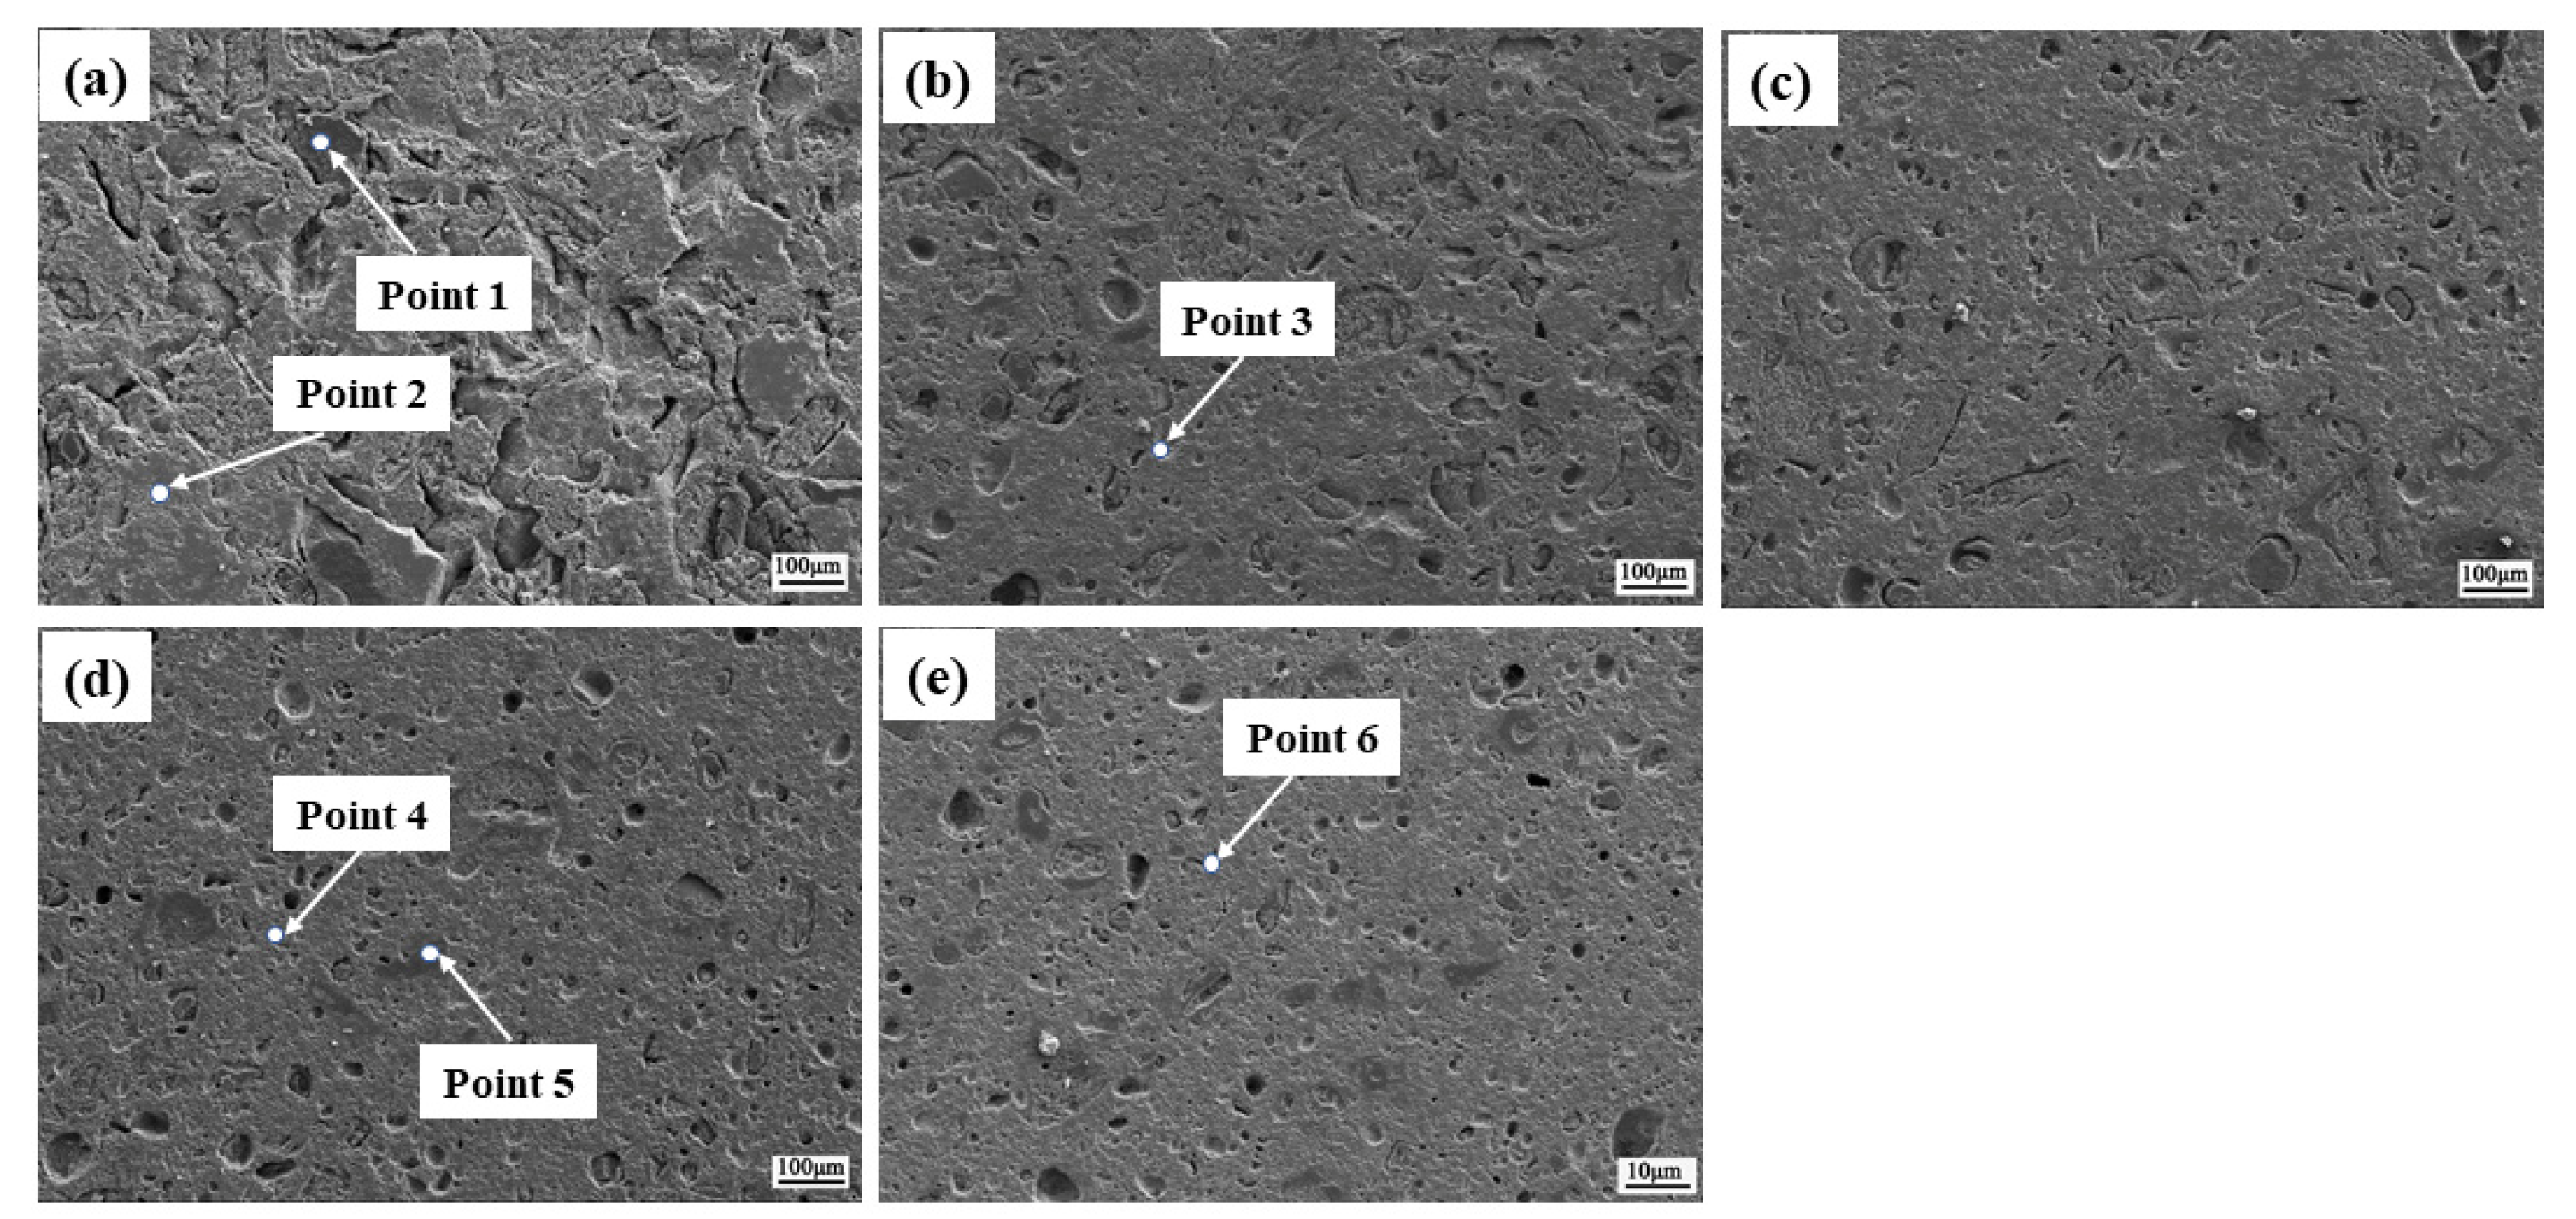
3.2.2. Fe2O3-MgO System Sample after Reduction

Figure 10 shows the XRD patterns of Fe2O3-MgO system samples after reduction with different levels of fine LCM addition. The main minerals of the samples after reduction were Fe3O4, MgO·Fe2O3, MgO and Fe2O3, and there were no diffraction peaks of other phases. As the fine LCM addition proportion gradually increased, the intensity of the diffraction peaks corresponding to Fe3O4 and MgO·Fe2O3 gradually increased and that of MgO weakened. However, based on the previous analysis, it could be seen that the fine LCM could promote the formation of MgO·Fe2O3. Therefore, the Fe3O4 and MgO decreased, and MgO·Fe2O3 increased with the increase in fine LCM addition in the low-temperature reduction process. With the increase in the fine LCM addition, the mineralization reaction was promoted and the Fe2O3 content decreased. Therefore, the fine LCM was beneficial to improving the RCS.
The SEM analysis of Fe2O3-MgO samples after reduction is shown in Figure 11, and the EDS analysis is shown in Table 6. It can be seen that the sample included unmineralized MgO, MgO·Fe2O3 by mineralized and iron oxide (Fe2O3 and Fe3O4). It should be noted that the reduction degree was low in the low-temperature reduction process, and the iron oxide included both unreduced Fe2O3 and reduced Fe3O4. When the f fine LCM addition was 0%, there were more pores on the surface of the sample, and the degree of crystallization was low. The free MgO appeared, however the solid solution of MgO·Fe2O3 was not found. The reduction degree was low, and so it could be determined that the Fe2O3 content in the matrix was higher (Point 2). When the fine LCM addition increased to 25% (Figure 11b), the microstructure changed significantly: the MgO of free decreased and more MgO entered the matrix (Point 3). Subsequently, the mineralization of MgO and Fe2O3 were enhanced, and a small amount of a solid solution of MgO·Fe2O3 appeared.
When the level of fine LCM addition reached 50%, the mineralization was further strengthened. When the fine LCM addition rate reached 75%, the Fe2O3 content decreased and the Fe3O4 was the main component of the matrix (Point 4); the solid solution of MgO·Fe2O3 (Point 5) was uniformly distributed on the surface of the sample and grew gradually and the MgO completely disappeared. When the fine LCM addition level reached 100%, its microstructure was similar to that of 75%, and the MgO content in the matrix was similar. The solid solution of MgO·Fe2O3 was surrounded by reduced Fe3O4 and Fe2O3, and no other components appeared. Therefore, the fine LCM was beneficial to the increase in RCS. The influence mechanism will be explained in detail below.

3.3. XRD and SEM Analysis on the Sample of Fe2O3-MgO-CaO

3.3.1. Fe2O3-MgO-CaO System Sample before Reduction

The XRD analysis of Fe2O3-MgO-CaO system samples is shown in Figure 12. It could be seen that the main minerals were MgO·Fe2O3, CaO·Fe2O3, Fe2O3 and MgO. The peak corresponding to MgO·Fe2O3 and CaO·Fe2O3 strengthened gradually, whereas that of MgO weakened with the increase in fine LCM addition. Based on XRD analysis, a part of MgO and Fe2O3 formed MgO·Fe2O3 through diffusion, and the rest existed in the form of free MgO. Compared with the Fe2O3-MgO, the mineralization reaction of Fe2O3-MgO-CaO samples was promoted by the liquid phase (CaO·Fe2O3), so the level of free MgO was relatively decreased.
Figure 13 and Table 7 show the SEM and EDS analysis of Fe2O3-MgO-CaO samples after roasting. It could be seen that the microstructure had changed significantly with the increase in fine LCM addition. (1) When the fine LCM addition proportion was 0%, there was more non-mineralized MgO, and the particle diameter was larger. (2) When the fine LCM addition proportion was 25%, the mineralization was enhanced. (3) When the fine LCM addition proportion was 100%, the degree of crystallization was significantly enhanced, and the free MgO decreased. When the fine LCM addition proportion was higher than 75%, the microstructure was similar and the porosity was basically the same.

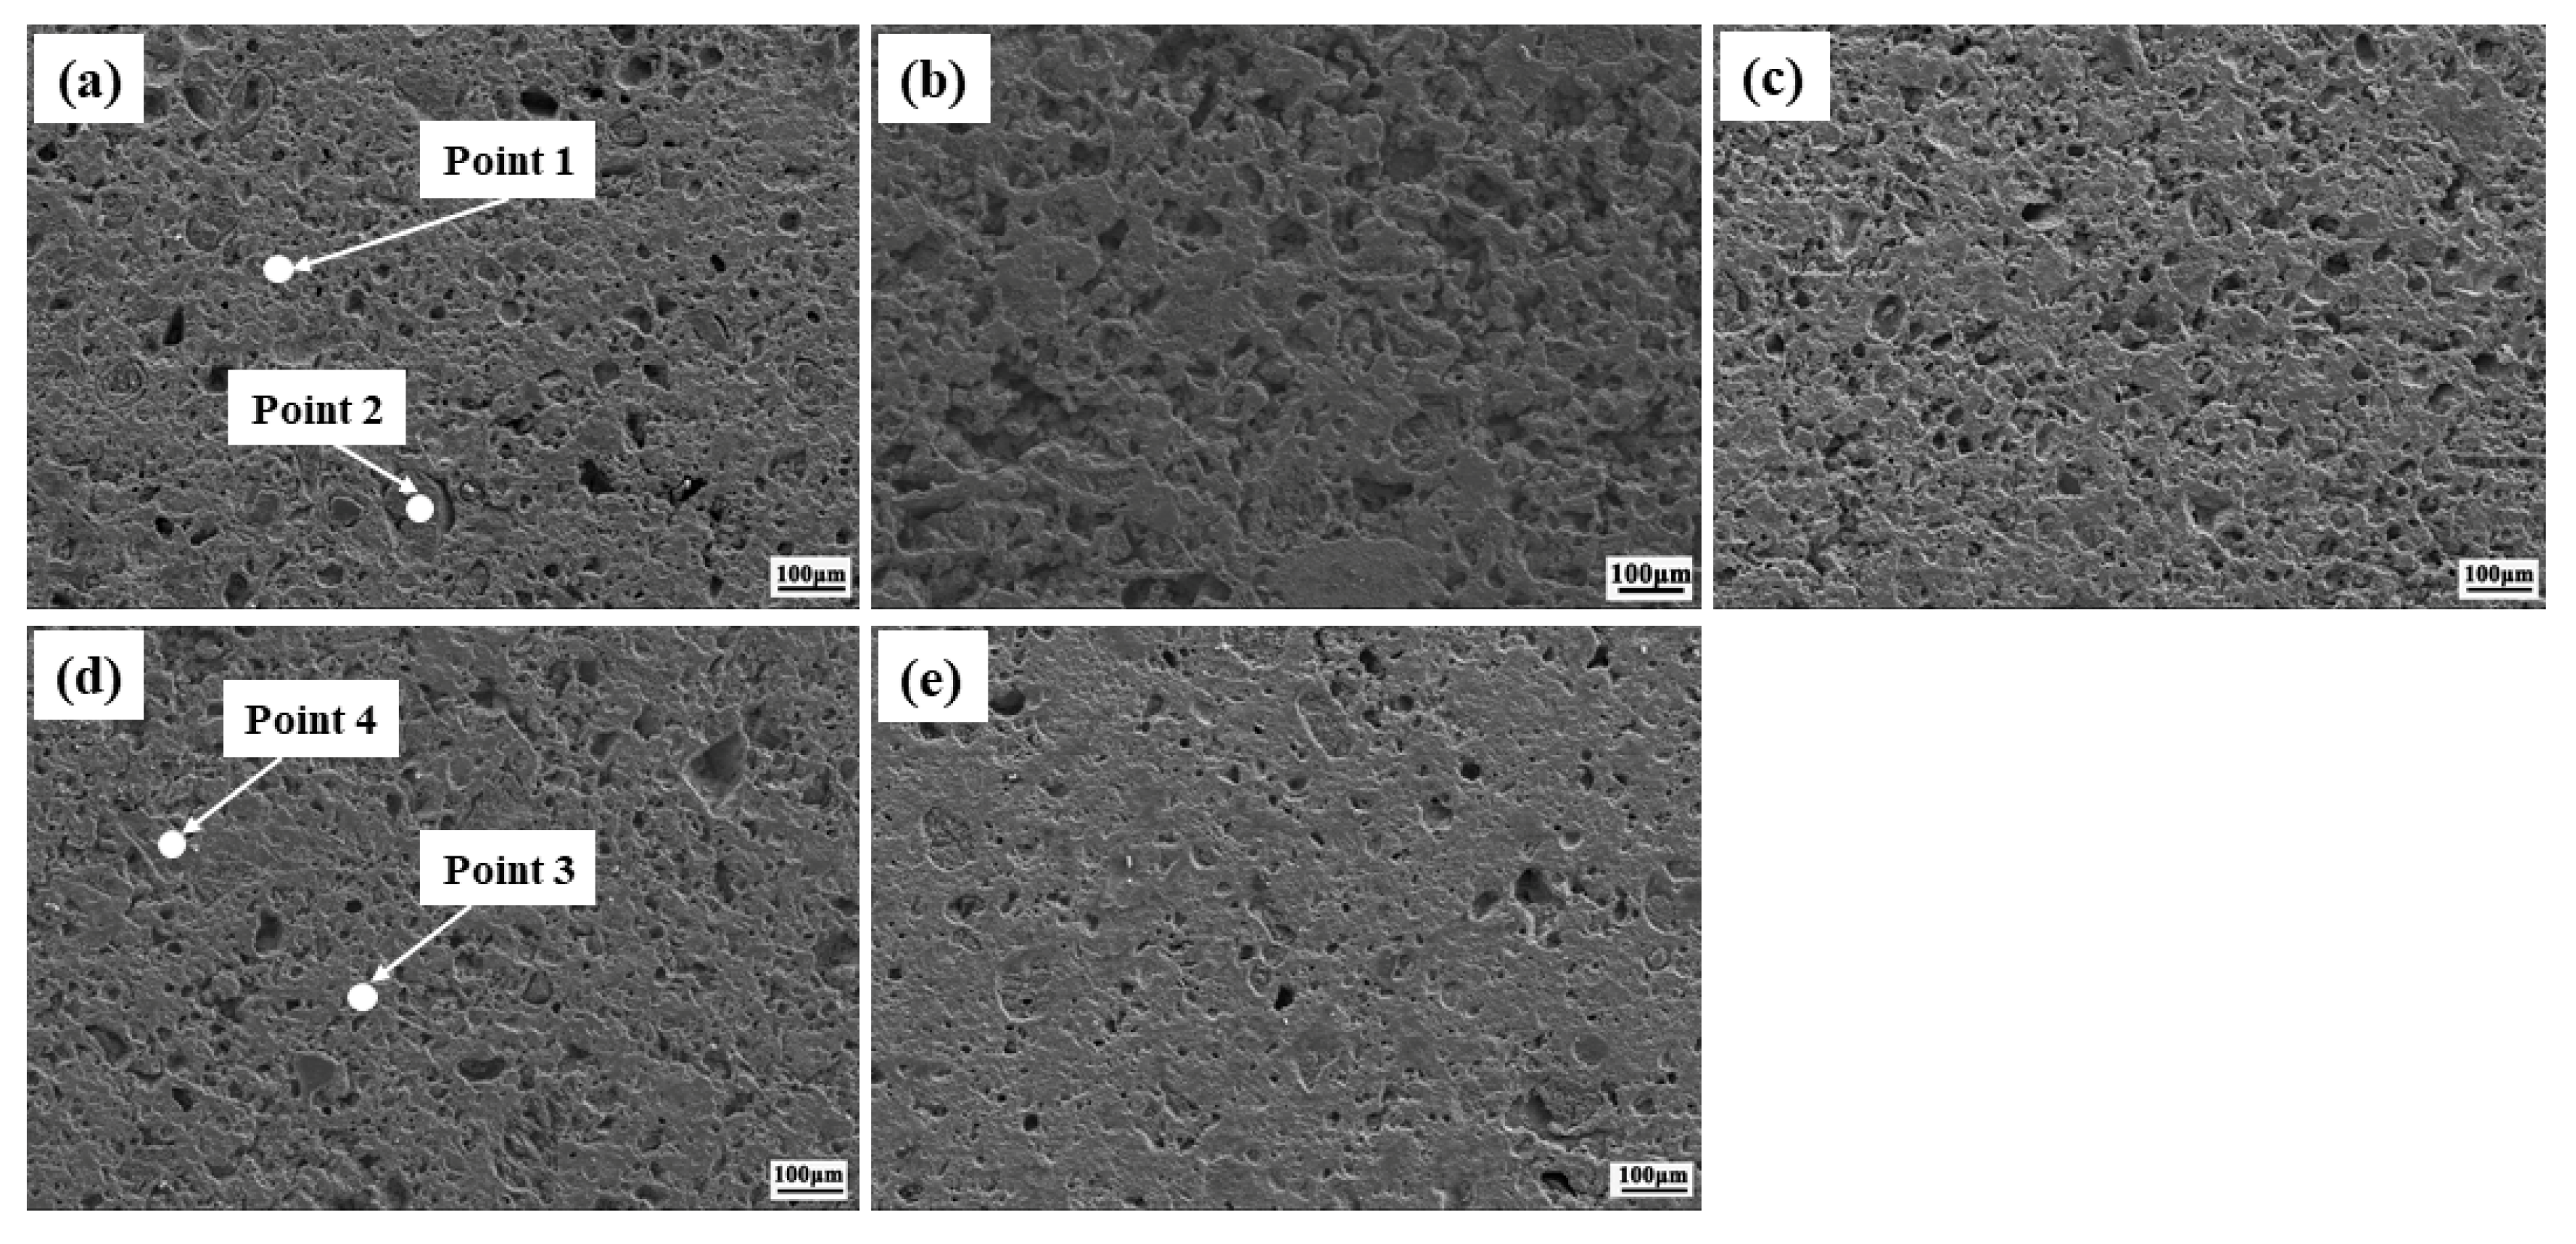
3.3.2. Fe2O3-MgO-CaO System Sample after Reduction

The XRD analysis of Fe2O3-MgO-CaO samples after reduction is shown in Figure 14. It can be seen from the figure: (1) the phase of the sample mainly included Fe2O3, Fe3O4, MgO, 2CaO·Fe2O3 and MgO·Fe2O3; (2) the peak intensity corresponding to MgO·Fe2O3 and Fe3O4 gradually strengthened with the increase in fine LCM addition. However, based on the analysis in the previous section, the content of Fe3O4 decreased and that of MgO·Fe2O3 increased. (3) Compared with Fe2O3-MgO samples, the peak corresponding to 2CaO·Fe2O3 appeared in the sample of Fe2O3-MgO-CaO, and the amount increased with the increase in fine LCM addition. (4) The peak intensity corresponding to Fe2O3 was weaker than those of Fe3O4 and MgO·Fe2O3.
The SEM and EDS analysis of Fe2O3-MgO-CaO of the sample after reduction is shown in Figure 15 and Table 8, respectively. It could be seen from the figure and table: when the fine LCM addition proportion was 0% (Figure 15a), a small amount of MgO (point 2) was distributed between MgO·Fe2O3 and Fe3O4 (point 1). The MgO content decreased and a small amount of MgO·Fe2O3 appeared with the increase to 25% in fine LCM addition. When the fine LCM addition proportion increased to 75% (Figure 15)), the unmineralized MgO decreased significantly, and the degree of crystallization was strengthened in the surface. The 2CaO·Fe2O3 (Point 4) with heteromorphic crystals was distributed between MgO·Fe2O3 and Fe3O4. When the fine LCM addition was 100% (Figure 15e), the surface of the sample had a higher degree of crystallization. Based on XRD and SEM analysis, it could be seen that the phase composition and microstructure had great differences while the fine LCM addition was 0%, 25% and 50%. It should be noted that the phase composition and microstructure were similar during the fine LCM addition were 75% and 100%, and so the RCS was similar.

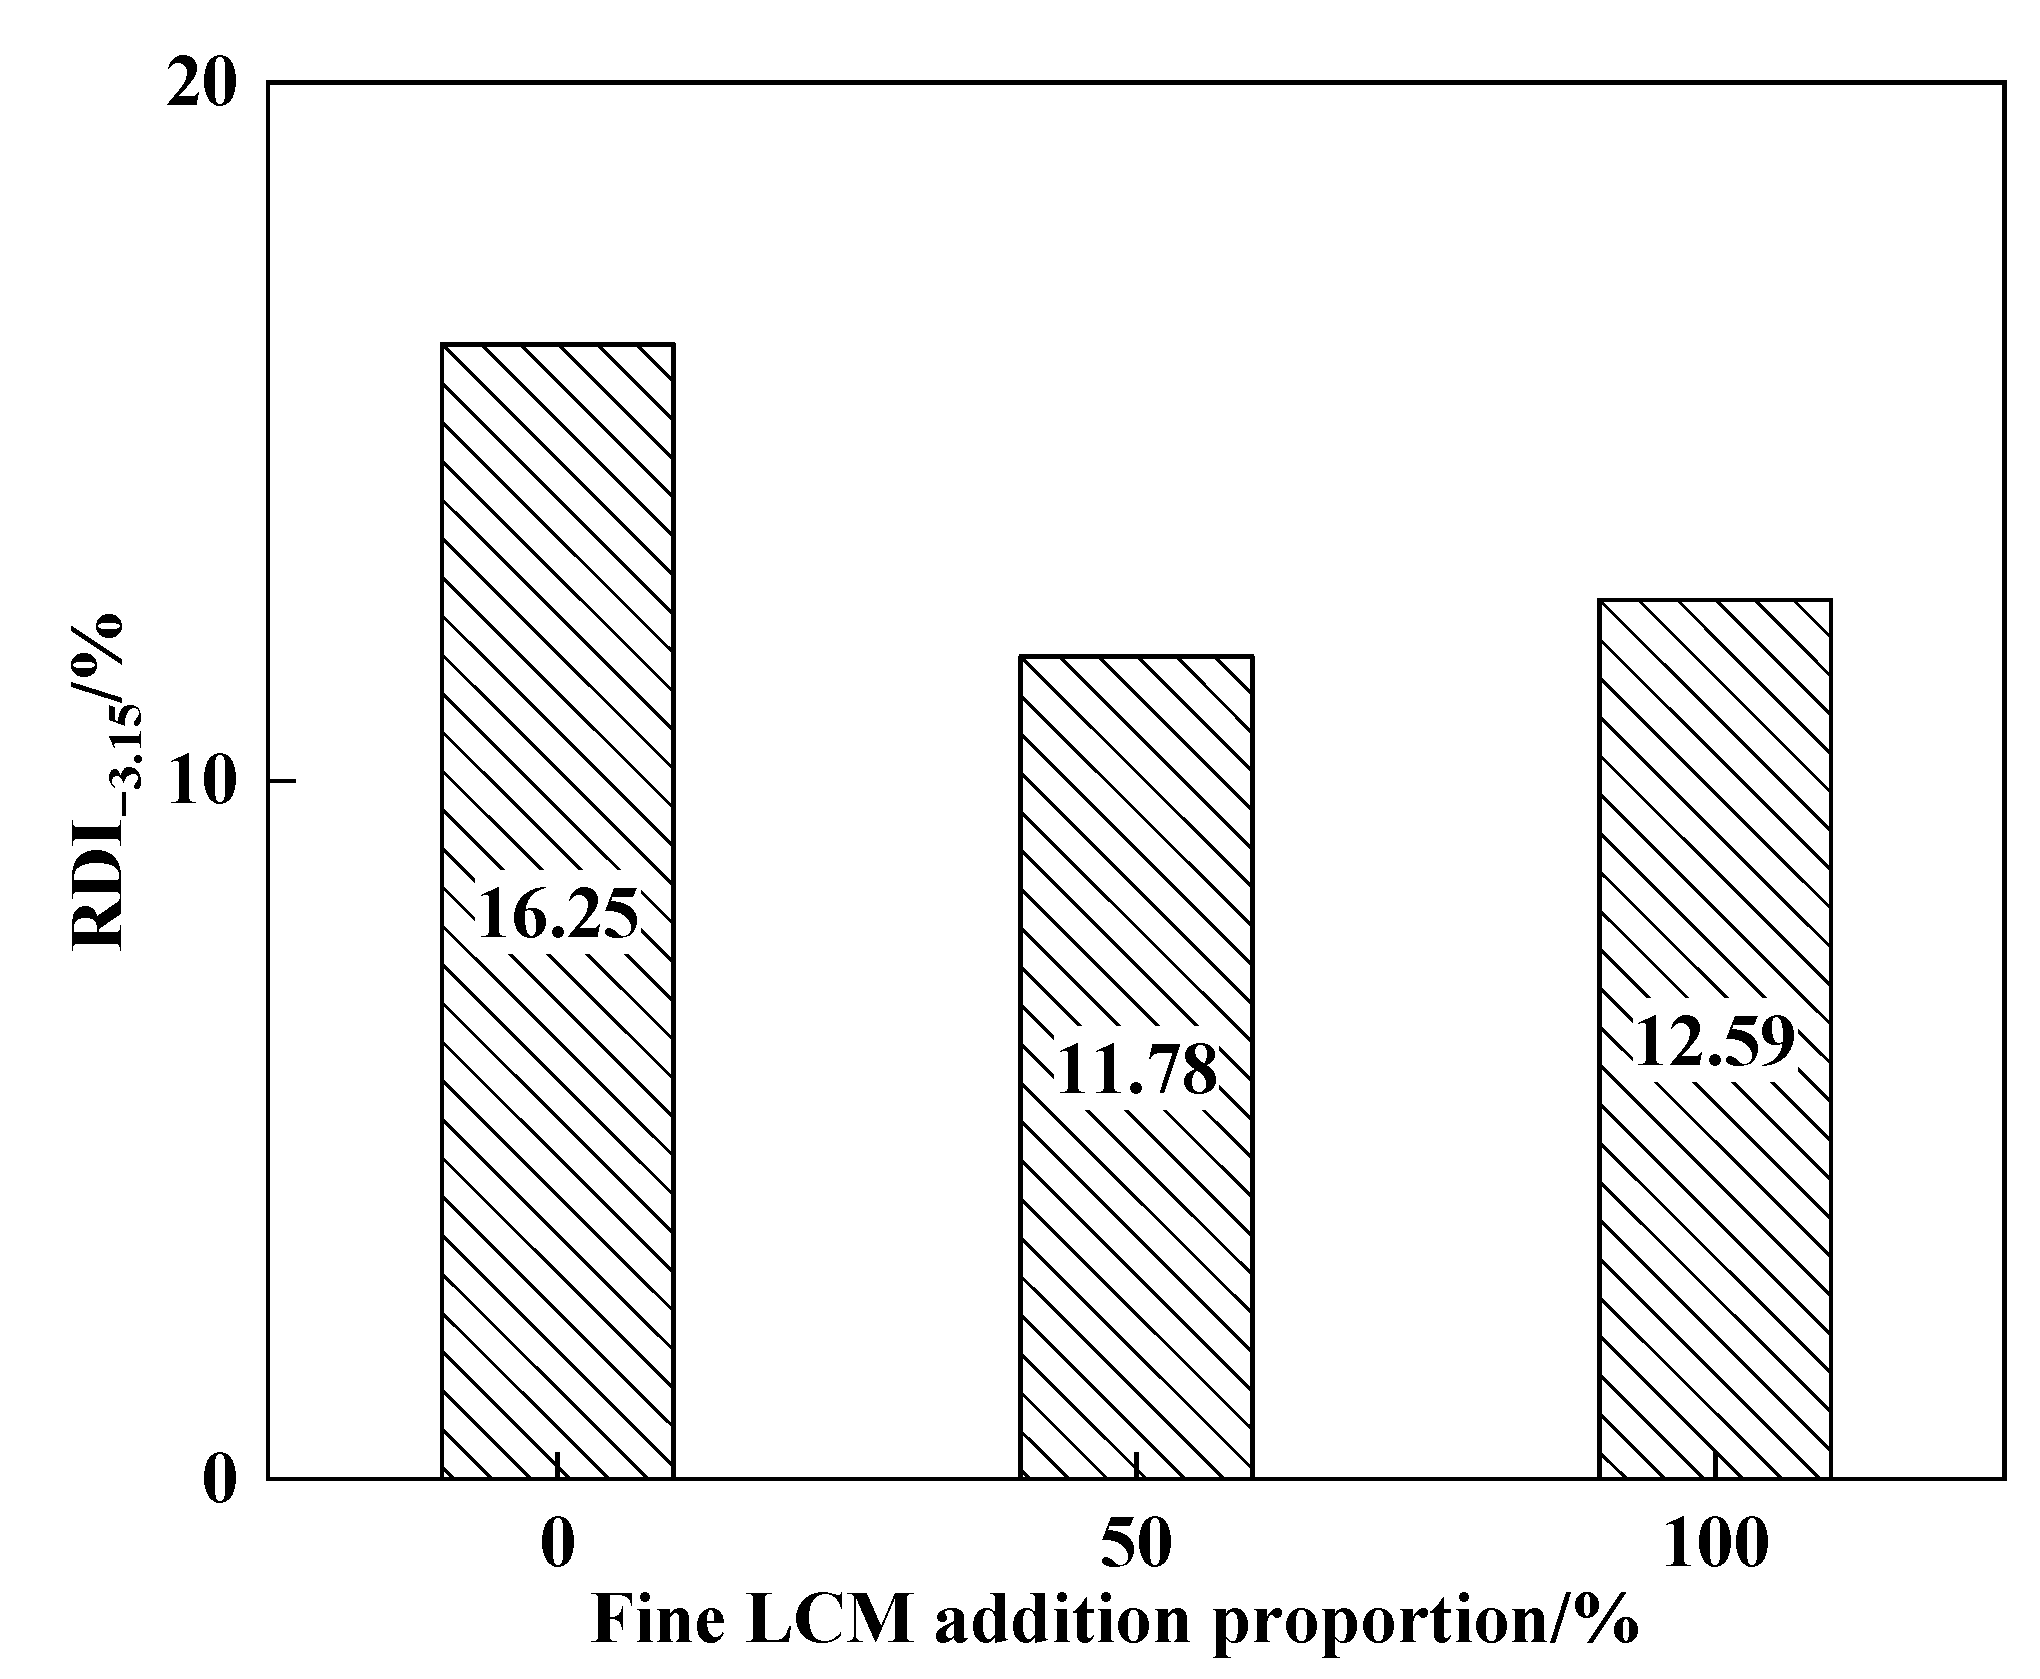
3.4. Results of Sintering Pot

Figure 16 shows the changes that occur during the operating parameters of the sintering process under different levels of fine LCM addition. The vertical sintering speed of a 0% level of fine LCM was the lowest in all the cases, as this had sufficient reaction time to bond with the other raw materials of sintering. The vertical sintering speed was relatively fast when the fine LCM addition was 50%, which resulted in poor metallurgical properties of the sinter. The vertical sintering speed was increased from 25.66 to 31.1 mm·min−1 with the increase in fine LCM addition from 0 to 100%. The tumbler index of a 0% fine LCM was the lowest (74.93%) and that of a 50% was the highest (76.13%). The utilization coefficient first increased from 2.52 to 2.94 t·m−2·h and then decreased from 2.94 to 2.91 t·m−2·h, and the yield increased from 69.41 to 71.32% with the increase in fine LCM addition.
The main reasons for the increase in the trend of tumbler index were twofold. Firstly, the reactions between iron ore powder and fine LCM are more rapid and complete, which can decrease effectively the lowest assimilation temperature. The fluidity of liquid phase is excellent, which is beneficial to improving the bonding effect between iron ore. Secondly, the increase in fine LCM addition can accelerate the mineralization between MgO and iron ore powder, which results in the formation of more magnetite; the intergranular consolidation is effectively strengthened for magnetite. Thirdly, during the cooling process, the fine LCM is more easily soluble in the β-C2S lattice, and the behavior can effectively restraint the phase transition between the lattices. Based on the above interpretation, the fine LCM can result in the increase in tumbler index in the sintering process.
The effects of fine LCM on the RDI−3.15 of sinter are shown Figure 17. It could be seen that the RDI−3.15 decreased from 16.25% to 12.59% with the increase in fine LCM addition from 0% to 100%. The effects of fine LCM on RDI−3.15 became weakening when the fine LCM addition exceeded 50%. In production, it was recommended that a 50% MgO-bearing flux be ground to below −1 mm, and that the RDI−3.15 of sinter could decrease to 4 percentage points under the condition.
The hematite in sinter is mainly divided into two types: (1) the original hematite in iron ore: it is directly brought in sinter and does not take part in any reaction; (2) the other type is that which takes part in the reaction with oxidation–reduction, and finally forms the secondly hematite that it is related to the RDI of the sinter. In the sintering process, the MgO is easily brought into the sinter by a mineralization reaction with the increase in fine LCM addition, which can decrease the imbalance degree of electrovalence; then the stable magnetite forms, and secondly hematite content decreases in the sinter. In addition, the MgO that it is formed in hematite by enhanced dispersion can inhibit the reduction reaction with the increase in fine LCM, and the decrease in RDI of sinter.

4. Discussion

4.1. Effect of Particle Size with LCM on Strength before Reduction

Based on above results, the LCM with different particle size can influence the CS of the sample. The ball-to-ball model is introduced in the study for explaining the result [19]. As shown in the model, the inherent strength of the sample and the percentage of the bonding interface can influence the CS and the bonding interface and ration of the effective contact area between adjacent particles are the proportional relationship. The bonding area between two contacting particles is calculated as follows:
s = π x 2 ,
where x is the median size of coarse and fine LCM and the spherical cross-sectional area (S) is:
S = π r 2 ,
where r is the initial radius of sample, the radius of sample is 4 mm. The ratio (R) of the effective binding area in each particle is expressed as:
R = s S = π x 2 π r 2 = x r 2 .
Then, the R and other parameters of fine and coarse LCM were obtained and listed in Table 9. As shown in Table 9, the specific surface area is larger and the effective binding area is lower in the case of fine LCM. Based on previous study, the ration of the effective contact bonding (specific surface area) between adjacent particles determined the CS. The specific surface area of coarse LCM is 15.541 m2/g and that of fine LCM is 47.447 m2/g, which leads to improvement in the CS. It can be known from the formula that the decrease in particle size and increase in the effective bonding area can benefit the increase in sintering driving force and the CS.
The dolomite-Fe2O3 mineralization reaction experiment was used to explain the influence mechanism of fine MgO-bearing flux on the strength, and its production method could be referred to the relevant literature [20]. It should be noted that the particle size of dolomite is consistent with that of coarse and fine LCM.
The two types of dolomite, coarse and fine, were used in the mineralization rate experiment, and the results are shown in Figure 18. It could be seen that the average diffusion layer thickness increased from 250.8 to 397.1 μm and that the average diffusion rate increased from 12.54 to 19.86 μm·min−1 with the decrease in particles size of dolomite.
The main reaction process is as follows: (1) The dolomite is first thermally decomposed to generate CaO (850 °C) and MgO (780 °C) with the increase in calcination temperature [21]. (2) The CaO·Fe2O3 (CF) formed by the CaO reacts with Fe2O3 (molar ratio of 1:1), and then 2CaO·Fe2O3 (C2F) and CaO·2Fe2O3(CF2) are generated at the CF/CaO interface, respectively. (3) The iron magnesium spinel is (MgO·Fe2O3) generated by the reaction of MgO and Fe2O3. The melting points of CF and CF2, completely turn into liquid phase temperature, are 1216 °C and 1226 °C, respectively. The above phenomena can be summarized by the mechanism diagram, as shown in Figure 19.
Therefore, the generation of liquid phase promotes the reaction between dolomite and Fe2O3. According to the above analysis, the mineralization rate of MgO flux and Fe2O3 increases with the increase in fine MgO-bearing flux, resulting in the appearance with more MgO·Fe2O3 and liquid phase, which eventually leads to improvement in the CS of sample.
Based on the above analysis, the mineralization rate increases, and more MF appears when the fine MgO-fluxed is used. Therefore, there are two primary reasons for improving the CS of the sample: first, a smaller particle size has greater specific surface area and contact area. According to ball-to-ball model, the strength is effectively improved; secondly, the mineralization rate increases for the fine MgO-bearing flux, which improves the content of MF and leads to the increase in CS of sample.

4.2. Effect of Particle Size with LCM on Strength after Reduction

In the case that the reduction temperature is 500 °C, the main reaction of the samples are the change of Fe2O3 to Fe3O4. Therefore, the change in Fe3O4 content is investigated in the present work, which is the main influencing factor for the RCS. The effects of fine LCM on the mineral composition of samples after reduction are shown in Table 10. As shown in Table 10, with the increase in fine MgO-bearing flux addition, the samples of MgO·Fe2O3 (MF) can generate and reaction mineralization is strengthened in the samples. It is clear that the Fe3O4 content decreases with the increase in fine LCM in the Fe2O3-MgO and Fe2O3-MgO-CaO series samples after reduction. It is well known that the lattice transformation, from Fe2O3 to Fe3O4, is the primary reason for the strength loss of iron ore during low-temperature reduction. As a result, the main reason for the increase in RCS with high-percentage fine LCM is that the samples contain more MF and Fe3O4. The MF is more stable than Fe2O3 and has a low reduction degree. The unfavorable effect of lattice transition is alleviated, and the RCS is improved.

5. Conclusions

In this work, the effects of fine LCM on the CS and RCS were investigated. Based on the laboratory model samples’ test, fine LCM could effectively improve the CS and RCS. The XRD and SEM-EDS analyses indicated that the strengthening of mineralization was the major reason for the increase in CS and RCS in the sample. Finally, the mineralization mechanism of fine MgO-bearing flux was investigated. The results confirmed the correctness of all experimental analysis. The main findings could be summarized as follows:
(1) In the case of the MgO-Fe2O3 series, the CS increased from 5.66 to 7.42 MPa and the RCS increased from 2.49 to 6.03 MPa with the increase in fine LCM from 0 to 100%. In the case of the MgO-Fe2O3-CaO series, the CS increased from 4.62 to 7.01 MPa and the RCS increased from 4.00 to 6.23 MPa with the increase in fine LCM from 0 to 100%. The ball-to-ball model was used to explain the reason for the increase in CS of fine LCM; the higher diffusion rate for the fine LCM could increase the CS of a sample.
(2) In the sintering pot experiment, the vertical sintering speed of a 0% fine LCM was the lowest (25.66 mm·min−1) in all the cases and that of a 50% fine LCM had a relatively fast vertical sintering speed (31.1 mm·min−1). The tumbler index of a 0% fine LCM was the lowest (74.93%) and that of a 50% was the highest (76.13%). The utilization coefficient first increased from 2.52 to 2.94 t·m−2·h and then decreased from 2.94 to 2.91 t·m−2·h, and the yield increased from 69.41 to 71.32% with the increase in fine LCM addition.
(3) Less transformation from Fe2O3 to Fe3O4 and microstructures of more compact and uniform increased the RCS of samples. The outcomes of the present work could improve the sinter quality by using the fine MgO-bearing flux in the sintering process.

Author Contributions

J.C. contributed to the material synthesis, performed the experiments, material characterization, and data analysis, and wrote the paper; C.Z. revised the paper and refined the language; S.C. and J.Y. contributed to the design of the experiment. All authors have read and agreed to the published version of the manuscript.

Funding

This research received no external funding.

Data Availability Statement

Data presented in this article are available at request from the corresponding author.

Acknowledgments

The authors wish to acknowledge the contributions of associates and colleagues in Anhui University of Technology of China.

Conflicts of Interest

The authors declare no conflict of interest.

References

  1. Ma, X.D.; Mao, C.; Zhu, J.M.; Xu, H.F.; Wang, G.F.; Zhao, B.J. Properties of Low-MgO ironmaking blast furnace slags. ISIJ Int. 2018, 58, 1402–1405. [Google Scholar] [CrossRef] [Green Version]
  2. Ueda, S.; Kon, T.; Miki, T.; Kim, S.J.; Nogami, H. Effects of Al2O3 and MgO on softening, melting, and permeation properties of CaO-FeO-SiO2 on a coke bed. Metall. Mater. Trans. B. 2016, 47, 2371–2377. [Google Scholar] [CrossRef]
  3. Iljana, M.; Kemppainen, A.; Paananen, T.; Mattila, O.; Heikkinen, E.P.; Fabriitius, T. Evaluating the reduction-softening behaviour of blast furnace burden with an advance test. ISIJ Int. 2016, 56, 1705–1714. [Google Scholar] [CrossRef] [Green Version]
  4. George, H.L.; Monaghan, B.J.; Longbottom, R.J.; Chew, S.J.; Austin, P.R. Flow of molten slag through coke channels. ISIJ Int. 2013, 53, 1172–1179. [Google Scholar] [CrossRef] [Green Version]
  5. Shen, F.M.; Gao, Q.J.; Jiang, X.; Wei, G.; Zhen, H.Y. Effect of magnesia on the compressive strength of pellets. Int. J. Miner. Metall. Mater. 2014, 21, 431–437. [Google Scholar] [CrossRef]
  6. Umadevi, T.; Roy, A.K.; Mahapatra, P.C.; Prabhu, M.; Ranjan, M. Influence of magnesia on iron ore sinter properties and productivity—Use of dolomite and dunite. Steel Res. Int. 2009, 80, 800–807. [Google Scholar]
  7. Shen, F.M.; Jiang, X.; Wu, G.S.; Wei, G.; Li, X.G.; Shen, Y.S. Proper MgO addition in blast furnace operation. ISIJ Int. 2006, 46, 65–69. [Google Scholar] [CrossRef] [Green Version]
  8. Yi, Z.M.; Liu, Q.; Shao, H.J. Effect of MgO on highly basic sinters with high Al2O3. Mining Metall Explor. 2021, 38, 2175–2183. [Google Scholar] [CrossRef]
  9. Higuchi, K.; Nishimura, T.; Shioda, T.; Pettersson, M.; Sikstrom, P. Reaction behaviors of mixed burdens consisting of pellets and sintered ores in an experimental blast furnace. Tetsu-to-Hagane 2021, 107, 336–344. [Google Scholar] [CrossRef]
  10. Zhou, M.; Yang, S.T.; Jiang, T.; Xue, X.X. Influence of MgO in form of magnesite on properties and mineralogy of high chromium, vanadium, titanium magnetite sinters. Ironmak. Steelmak. 2014, 42, 217–225. [Google Scholar] [CrossRef]
  11. Zhang, L.H.; Yang, S.T.; Tang, W.; Xue, X.X. Investigations of MgO on sintering performance and metallurgical property of high-chromium vanadium-titanium magnetite. Minerals 2019, 9, 324. [Google Scholar] [CrossRef]
  12. Guo, H.; Shen, F.M.; Jiang, X.; Gao, Q.J.; Ding, G.G. Effects of MgO additive on metallurgical properties of fluxed-pellet. J. Cent. South. Univ. 2019, 26, 3238–3251. [Google Scholar] [CrossRef]
  13. Zhu, D.Q.; Chou, J.L.; Shi, B.J.; Pan, J. Influence of MgO on low temperature reduction and mineralogical changes of sinter in simulated COREX shaft furnace reducing conditions. Minerals 2019, 9, 272. [Google Scholar] [CrossRef] [Green Version]
  14. Pan, F.; Zhu, Q.S.; Du, Z.; Sun, H.Y. Migration behavior of the MgO and its influence on the reduction of Fe3O4-MgO sinter. ISIJ Int. 2018, 58, 652–659. [Google Scholar] [CrossRef] [Green Version]
  15. Tang, J.; Chu, M.S.; Xue, X.X. Optimized use of MgO flux in the agglomeration of high-chromium vanadium-titanium magnetite. Int. J. Miner. Metall. Mater. 2015, 22, 371–380. [Google Scholar] [CrossRef]
  16. Zhang, Y.M. Pellet Production Technology; Metallurgical Industry Press: Beijing, China, 2005. [Google Scholar]
  17. Suresh, S. Fatigue of Material; Cambridge University Press: New York, UY, USA, 1998. [Google Scholar]
  18. Zhu, D.Q.; Yang, C.C.; Pan, J.; Li, X.B. Comparison of the oxidation behavior of high FeO chromite and magnetite concentrates relevant to the induration of ferrous pellets. Metall. Mater. Trans. B 2016, 47, 2919–2930. [Google Scholar] [CrossRef]
  19. Yan, J.; Zou, G.; Liu, L.; Zhang, D.; Bai, H.; Wu, A.P.; Zhou, Y.N. Sintering Mechanisms and mechanical properties of joints bonded using silver nanoparticles for electronic packaging applications. Weld World 2015, 59, 427–432. [Google Scholar] [CrossRef]
  20. Jing, M.F.; Li, G.S.; Jiang, X.; Shen, F.M. Effect of penetration behavior of calcium ferrite melts into hematite on the strength of sinter. J. NORTHEAST. Univ. 2008, 8, 1135–1138. [Google Scholar]
  21. Eisenhüttenleute, V.D.; Allibert, M. Slag Atlas, 2nd ed.; Verlag Stahleisen GmbH: Düsseldorf, Germany, 1995. [Google Scholar]
Figure 1. The XRD analysis of LCM.
Metals 12 02088 g001
Figure 2. The SEM and particle size with LCM of different kinds. (a) coarse LCM (b) fine LCM.
Metals 12 02088 g002
Figure 3. The mainly experiment process.
Metals 12 02088 g003
Figure 4. Schematic diagram of reduction disintegration equipment.
Metals 12 02088 g004
Figure 5. The test condition of low-temperature reduction.
Metals 12 02088 g005
Figure 6. Effects of fine LCM on CS, RCS and porosity with Fe2O3-MgO.
Metals 12 02088 g006
Figure 7. Effects of fine LCM on CS, RCS and porosity of Fe2O3-MgO-CaO.
Metals 12 02088 g007
Figure 8. The XRD analysis of Fe2O3-MgO.
Metals 12 02088 g008
Figure 9. SEM analysis of the sample of Fe2O3-MgO. (a) 0%; (b) 25%; (c) 50%; (d) 75%; (e) 100%.
Metals 12 02088 g009
Figure 10. The XRD analysis of Fe2O3-MgO of samples after reduction.
Metals 12 02088 g010
Figure 11. SEM analysis of Fe2O3-MgO sample after reduction. (a) 0% (b) 25% (c) 50% (d) 75% (e) 100%.
Metals 12 02088 g011
Figure 12. The XRD analysis of Fe2O3-MgO-CaO.
Metals 12 02088 g012
Figure 13. SEM images and EDS analysis of sample of Fe2O3-MgO-CaO. (a) 0% (b) 25% (c) 50% (d) 75% (e) 100%.
Metals 12 02088 g013
Figure 14. The XRD analysis of Fe2O3-MgO-CaO of samples after reduction.
Metals 12 02088 g014
Figure 15. SEM analysis of Fe2O3-MgO-CaO sample after reduction. (a) 0% (b) 25% (c) 50% (d) 75% (e) 100%.
Metals 12 02088 g015
Figure 16. Effects of fine LCM on sinter index.
Metals 12 02088 g016
Figure 17. Effects of fine LCM addition on RDI−3.15 of sinter.
Metals 12 02088 g017
Figure 18. Effects of particle size with dolomite on mineralization rate of sample. (a) The SEM of mineralization reaction with coarse dolomite; (b) the SEM of mineralization reaction with fine dolomite; (c) the effect of particle size with dolomite on mineralization reaction.
Metals 12 02088 g018
Figure 19. The mechanism diagram of mineralization reaction with different particle sizes of dolomite.
Metals 12 02088 g019
Table 1. Chemical composition of LCM (mass, %).
MgOCaOSiO2Al2O3LOI
71.352.765.780.7417.84
Table 2. Chemical compositions of dolomite (mass, %).
CaOMgOSiO2H2OLOI
31.319.011.360.0744.56
Table 3. The experimental scheme of Fe2O3-MgO and Fe2O3-MgO-CaO.
GroupNo.Fe2O3 (mol)/Weight (g)MgO (mol)/ Weight (g)CaO (mol)/Weight (g)Coarse LCM (%)/Weight (g)Fine LCM (%)/Weight (g)
11–11/0.6401/0.1600100/0.2200
1–21/0.6401/0.160075/0.16525/0.055
1–31/0.6401/0.160050/0.11050/0.110
1–41/0.6401/0.160025/0.05575/0.165
1–51/0.6401/0.16000100/0.220
22–11/0.5001/0.1251/0.175100/0.1750
2–21/0.5001/0.1251/0.17575/0.13125/0.044
2–31/0.5001/0.1251/0.17550/0.08850/0.088
2–41/0.5001/0.1251/0.17525/0.04475/0.131
2–51/0.5001/0.1251/0.1750100/0.175
Table 4. Ore-Matching Scheme of the Sintering Pot Test (Mass, %).
No.Blended OreReturn MineLCMQuickLimeCokeOutsourced CokeFly AshFine LCM Proportion
No.166.6315.573.538.692.701.231.640
No.266.6315.573.538.692.701.231.6450
No.366.6315.573.538.692.701.231.64100
Table 5. EDS analysis of Fe2O3-MgO sample before reduction.
ZoneMass Percent/%Components
MgFeOSiCa
Point 152.355.7940.890.460.51MgO
Point 26.9960.3432.19-0.49Fe2O3
Point 327.259.7843.3616.812.79MgO·Fe2O3
Table 6. EDS analysis of Fe2O3-MgO sample after reduction.
ZoneMass Percent/%Components
MgFeOSiCa
Point 157.231.9940.77--MgO
Point 21.1868.9429.87--Fe2O3
Point 37.0162.3530.64--Fe2O3, Fe3O4, MgO·Fe2O3
Point 49.2758.0732.66--Fe2O3, Fe3O4,
Point 527.6210.1744.4315.452.33MgO·Fe2O3,slag
Point 68.7958.8632.35--Fe3O4
Table 7. EDS analysis of Fe2O3-MgO-CaO sample before reduction.
ZoneMass Percent/%Component
MgFeOSiCa
Point 151.756.5140.970.77-MgO
Point 21.7938.6035.380.9723.26Fe2O3
Point 312.620.9846.2927.0913.02MgO·Fe2O3
Table 8. EDS analysis of Fe2O3-MgO-CaO sample after reduction.
ZoneMass Percent/%Components
MgFeOSiCa
Point 18.1956.9733.01-1.84MgO·Fe2O3
Point 260.211.0138.75--MgO
Point 34.4640.2637.621.1616.51Fe3O4, Fe2O3
Point 41.0335.1736.101.6826.02CaO·Fe2O3
Table 9. Comparison of coarse and fine LCM.
LCMParticle Radius (μm)Surface Area (m2)Density (g/m3)Mass (g)Specific Surface Area (m2/g)R
coarse71.56.42 × 10−827004.131 × 10−915.5413.19 × 10−4
fine23.46.88 × 10−827001.450 × 10−947.4473.42 × 10−5
Table 10. Effect of fine LCM on the mineral composition of sample after reduction.
SampleSystemComponentsEDS PointsChange a
Sample after
reduction
Fe2O3-MgOFe2O3Figure 11-Point 2D
MgOFigure 11-Point 1D
Fe3O4Figure 11-Point 6D
MgO·Fe2O3-I
SlagFigure 11-Point 5I
Fe2O3-MgO-CaOFe2O3-D
MgOFigure 15-Point 2D
Fe3O4-D
MgO·Fe2O3Figure 15-Point 1I
CaO·Fe2O3Figure 15-Point 4I
a Notes: D decrease; I increase.
Publisher’s Note: MDPI stays neutral with regard to jurisdictional claims in published maps and institutional affiliations.

