Article

Microscale Damage Evolution and Failure Behavior of Metal–Composite Friction Spot Joints: Modelling and Experimental Analyses

by
Natalia M. André
1,
Renan Pereira Alessio
1,
Jorge F. dos Santos
1 and
Sergio T. Amancio-Filho
2,*
1
Helmholtz-Zentrum Hereon, Institute of Materials Mechanics, Solid State Materials Processing, 21494 Geesthacht, Germany
2
BMK Endowed Professorship for Aviation, Institute of Materials Science, Joining and Forming, Graz University of Technology—TU Graz, Kopernikusgasse 24/1, 8010 Graz, Austria
*
Author to whom correspondence should be addressed.
Metals 2022, 12(12), 2080; https://doi.org/10.3390/met12122080
Submission received: 28 October 2022 / Revised: 22 November 2022 / Accepted: 28 November 2022 / Published: 4 December 2022
(This article belongs to the Special Issue Hybrid Metal-Polymer Joints)

Abstract

:
This study aimed to understand the damage evolution at the interface of AA2024-T3/CF-PPS friction spot joints. For this purpose, the finite element method was applied and the bonding zones of the joints were discretized based on a traction–separation law. It was observed that the damage had initiated at the AZ (adhesion zone) and then propagated as a symmetric linear front from the edges towards the center of the joined area. Nevertheless, as the damage advanced inside the PDZ (plastically deformed zone), its propagation became an asymmetrical linear front that evolved preferably from the free edge of the composite part due to the higher peeling stresses in this region (asymmetrical secondary bending of the structure). Based on the findings of this study, modifications are proposed to the failure theory previously stated for friction spot joints.

1. Introduction

Metal–polymer composite hybrid structures have been increasingly used to maximize structural strength in cars, airplanes, infrastructure and medical appliances [1]. Considering that metals and polymeric materials have large property dissimilarities, they are not miscible, requiring extensive pre-surface treatments to increase surface energy in adhesive bonding, or the use of mechanical fastener in both state-of-the-art technologies. Adhesive bonding and mechanical fastening are multi-step techniques, usually requiring complex manufacturing steps, thereby increasing manufacturing costs. Lambiase et al. [2] has recently shown that friction-based joining processes are energy efficient processes, with reduced process steps, reduced or absent surface pre-treatments, adhesives or heavy fasteners. Among these class of friction-based joining techniques, Friction Spot Joining (FSpJ) is an alternative technology for joining metal–thermoplastic composite structures [3]. This technology uses a non-consumable tool to generate frictional heat and plastically deform the metallic component of the joint into the composite [4]. Three main bonding zones are found in friction spot joints: the plastically deformed zone (PDZ), the transition zone (TZ), and the adhesion zone (AZ) [5]. PDZ comprises the central region of the bonding area. In this zone, the main bonding mechanisms are macro- and micromechanical interlocking. Macromechanical interlocking results from the metal deformation into the composite, while micromechanical interlocking results from polymer and fiber entrapment on the aluminum surface [5]. AZ is the outer region of the bonding area. The softened/molten polymer displaced from the center of the joint during the joining process accumulates in this region [5]. The main bonding mechanism in AZ is the adhesive forces provided by the reconsolidation of the molten polymeric material [5]. TZ, as the name implies, is the transition zone between PDZ and AZ. This zone is characterized by the presence of air bubbles as a result of the outflow of molten polymer during the joining process [5].
Several combinations of materials have been successfully joined using FSpJ. Goushegir et al. [6] achieved shear strengths of 38–123 MPa for AA2024-T3 and carbon-fiber-reinforced polyphenylene sulfide (CF-PPS) joints. Other combinations of materials, such as AA7075-T6/CF-PPS shown by André et al. [7], AA2024-T3/PPS/CF-PPS shown by André et al. [8], AA6181-T4/CF-PPS shown by Esteves et al. [9], and AZ31-O/CF-PPS shown by Amancio et al. [4], were successfully investigated in recent years. Despite the success in producing friction spot joints with high mechanical performance in previous investigations, the micromechanisms of failure of such joints still remain only partially explained.
In 2016, Goushegir et al. [10] proposed a failure theory for friction spot joints based on the fracture surface analysis. The authors reported that the failure of friction spot joints occur in four stages, which could be identified in the force–displacement curve of the joints. Stage 1 corresponded to the high-stiffness linear-elastic behavior of the joints. It was believed that the crack radially nucleates at the periphery of AZ in this stage. Stage 2 comprised the region of reduction in stiffness of the joint. In this stage, the crack would radially propagate through the AZ until the TZ. The authors believed that the stiffness reduction was due to the complete failure of the AZ. Stage 3 corresponded to the low-stiffness linear-elastic behavior of the joints. In this stage, it is believed that the crack propagated through the TZ and in the PDZ. Finally, stage 4 comprised the final catastrophic failure of the joint as the ultimate lap shear force (ULSF) is reached. Although identifiable in the load–displacement curve of the joints, the hypothetical failure stages were never supported by other experimental or numerical evidences.
In the damage mechanics field, cohesive zone models (CZM) are the most used models to investigate the damage initiation and propagation between two surfaces [11]. The CZMs are based on the creation of cohesive elements to connect planes and tridimensional solids [12]. Thus, the CZMs describe the stress–displacement relationship of each pair of adjacent elements at a given interface [13]. The application of such models requires previous knowledge of critical areas where damage is prone to occur in order to precisely place the cohesive elements [11,12]. Thus, the cohesive elements are assigned specific features related to the interface under investigation. Among these features, there are: The thickness of the region under interest, its stiffness, the allowable stresses and displacements, as well as the fracture energy. In addition, cohesive softening laws can be applied to model the mechanical behavior of these zones such as the triangular, trapezoidal, linear-parabolic, polynomial, or exponential laws [14,15]. Thus, the continuum and the fracture mechanics approaches can be combined to enable the prediction of the damage initiation and evolution in such elements [14].
Although the damage mechanics provides a more complete solution to the failure behavior of the materials and structures, it is also a more complex approach. Therefore, closed-form solutions are often enhanced with the aid of finite element modeling software in damage mechanics [16,17,18,19,20,21,22].
De Moura et al. [21] investigated the residual compressive strength of composite laminates after low-energy impact. The authors used a cohesive zone model based on the triangular traction–separation law to model the delamination damage in the laminates with different stacking sequences. The model was able to predict the different compressive behavior of two types of composite laminates. In addition, the maximum bearable load was fairly accurately predicted.
In another work, Schellekens et al. [23] applied a mixed-mode delamination model to investigate the initiation and propagation of delamination at the free edge of graphite-epoxy composites under uniaxial tensile loading. The model was based on the orthotropic hardening–softening plasticity law. The predictions of the model were validated using in situ X-ray radiography, which demonstrated the good agreement between computational and experimental crack growth behavior.
A damage model was also developed by Allix and Ladevèze et al. [24] to investigate the delamination tolerance of a homogeneously layered laminate. The interlaminar interfaces were modeled as a two-dimensional entity, and the displacement/traction were transferred from one layer to another. The authors concluded that with a few intrinsic properties of the interface such as shear strength and stiffness, it is possible to predict the tendency of a structure to delaminate. Finally, the authors validated the approach by accurately predicting the delamination initiation and propagation of a CF-epoxy laminate under static shear loading.
The current paper is devoted to better understand and describe the microscale damage evolution at the interface of the friction spot joints under shear stresses. For this purpose, FEM and analytical characterization of the joints were integrated. Firstly, a finite element model to predict the static strength of the friction spot joints is validated using lap shear test. Next, the model is applied to assess the development of stresses at the interface regarding the shear load levels applied to the joint. Moreover, the finite element model is used to describe for the first time in the literature, the damage evolution at the interface of the friction spot joints. The damage evolution is described regarding levels of applied stress and the different bonding zones of the joints. Furthermore, the prediction of the damage evolution is integrated with loading-unloading hysteresis curves of the joint to clarify the damage micromechanisms in the different bonding zones according to load levels. The influence of the bonding zones on the mechanical behavior of the joints is also addressed using FEM. Finally, this paper is concluded with the proposal of an updated theory of failure for the friction spot joints based on the new findings of this study.

2. Materials and Methods

2.1. Aluminum Alloy 2024-T3

The aluminum alloy 2024-T3 was selected as the metallic part to produce the joints in the investigation. This is a precipitation hardenable alloy with Cu and Mg as the principal alloying elements. The addition of copper and magnesium provides high strength to the alloy through pinning of dislocations. Copper acts through solid solution strengthening, while Mg creates precipitates by natural aging [25]. The AA2024-T3 is widely used in the aircraft industry due to its high strength and excellent fatigue performance [26]. The 2 mm-thick rolled sheets, provided by Constellium (Paris, France), were used in this work. Table 1 presents the nominal chemical composition of the alloy. Table 2 lists selected physical and mechanical properties of this alloy [27].

2.2. Carbon-fiber-reinforced Polyphenylene Sulfide (CF-PPS)

Carbon-fiber-reinforced polyphenylene sulfide (CF-PPS) was selected as the composite part to produce the joints in this work. CF-PPS retains an outstanding performance at high temperatures and is used for several applications in aerostructures [28]. Exemplary applications are the “J-Nose” sub-frame wings of Airbus A380 and the engine pylon cover of Airbus A340-500/600 [28]. This quasi-isotropic laminate composite consists of seven carbon-fiber-fabric reinforcement plies in the [(0.90)/(±45)]3/(0.90) sequence. In this work, a 2.17 mm-thick laminate with 43 wt% carbon fibers, produced by Tencate (Almelo, The Netherlands), was used. Table 3 presents a selection of physical and mechanical properties of the CF-PPS.

2.3. Experimental Procedure

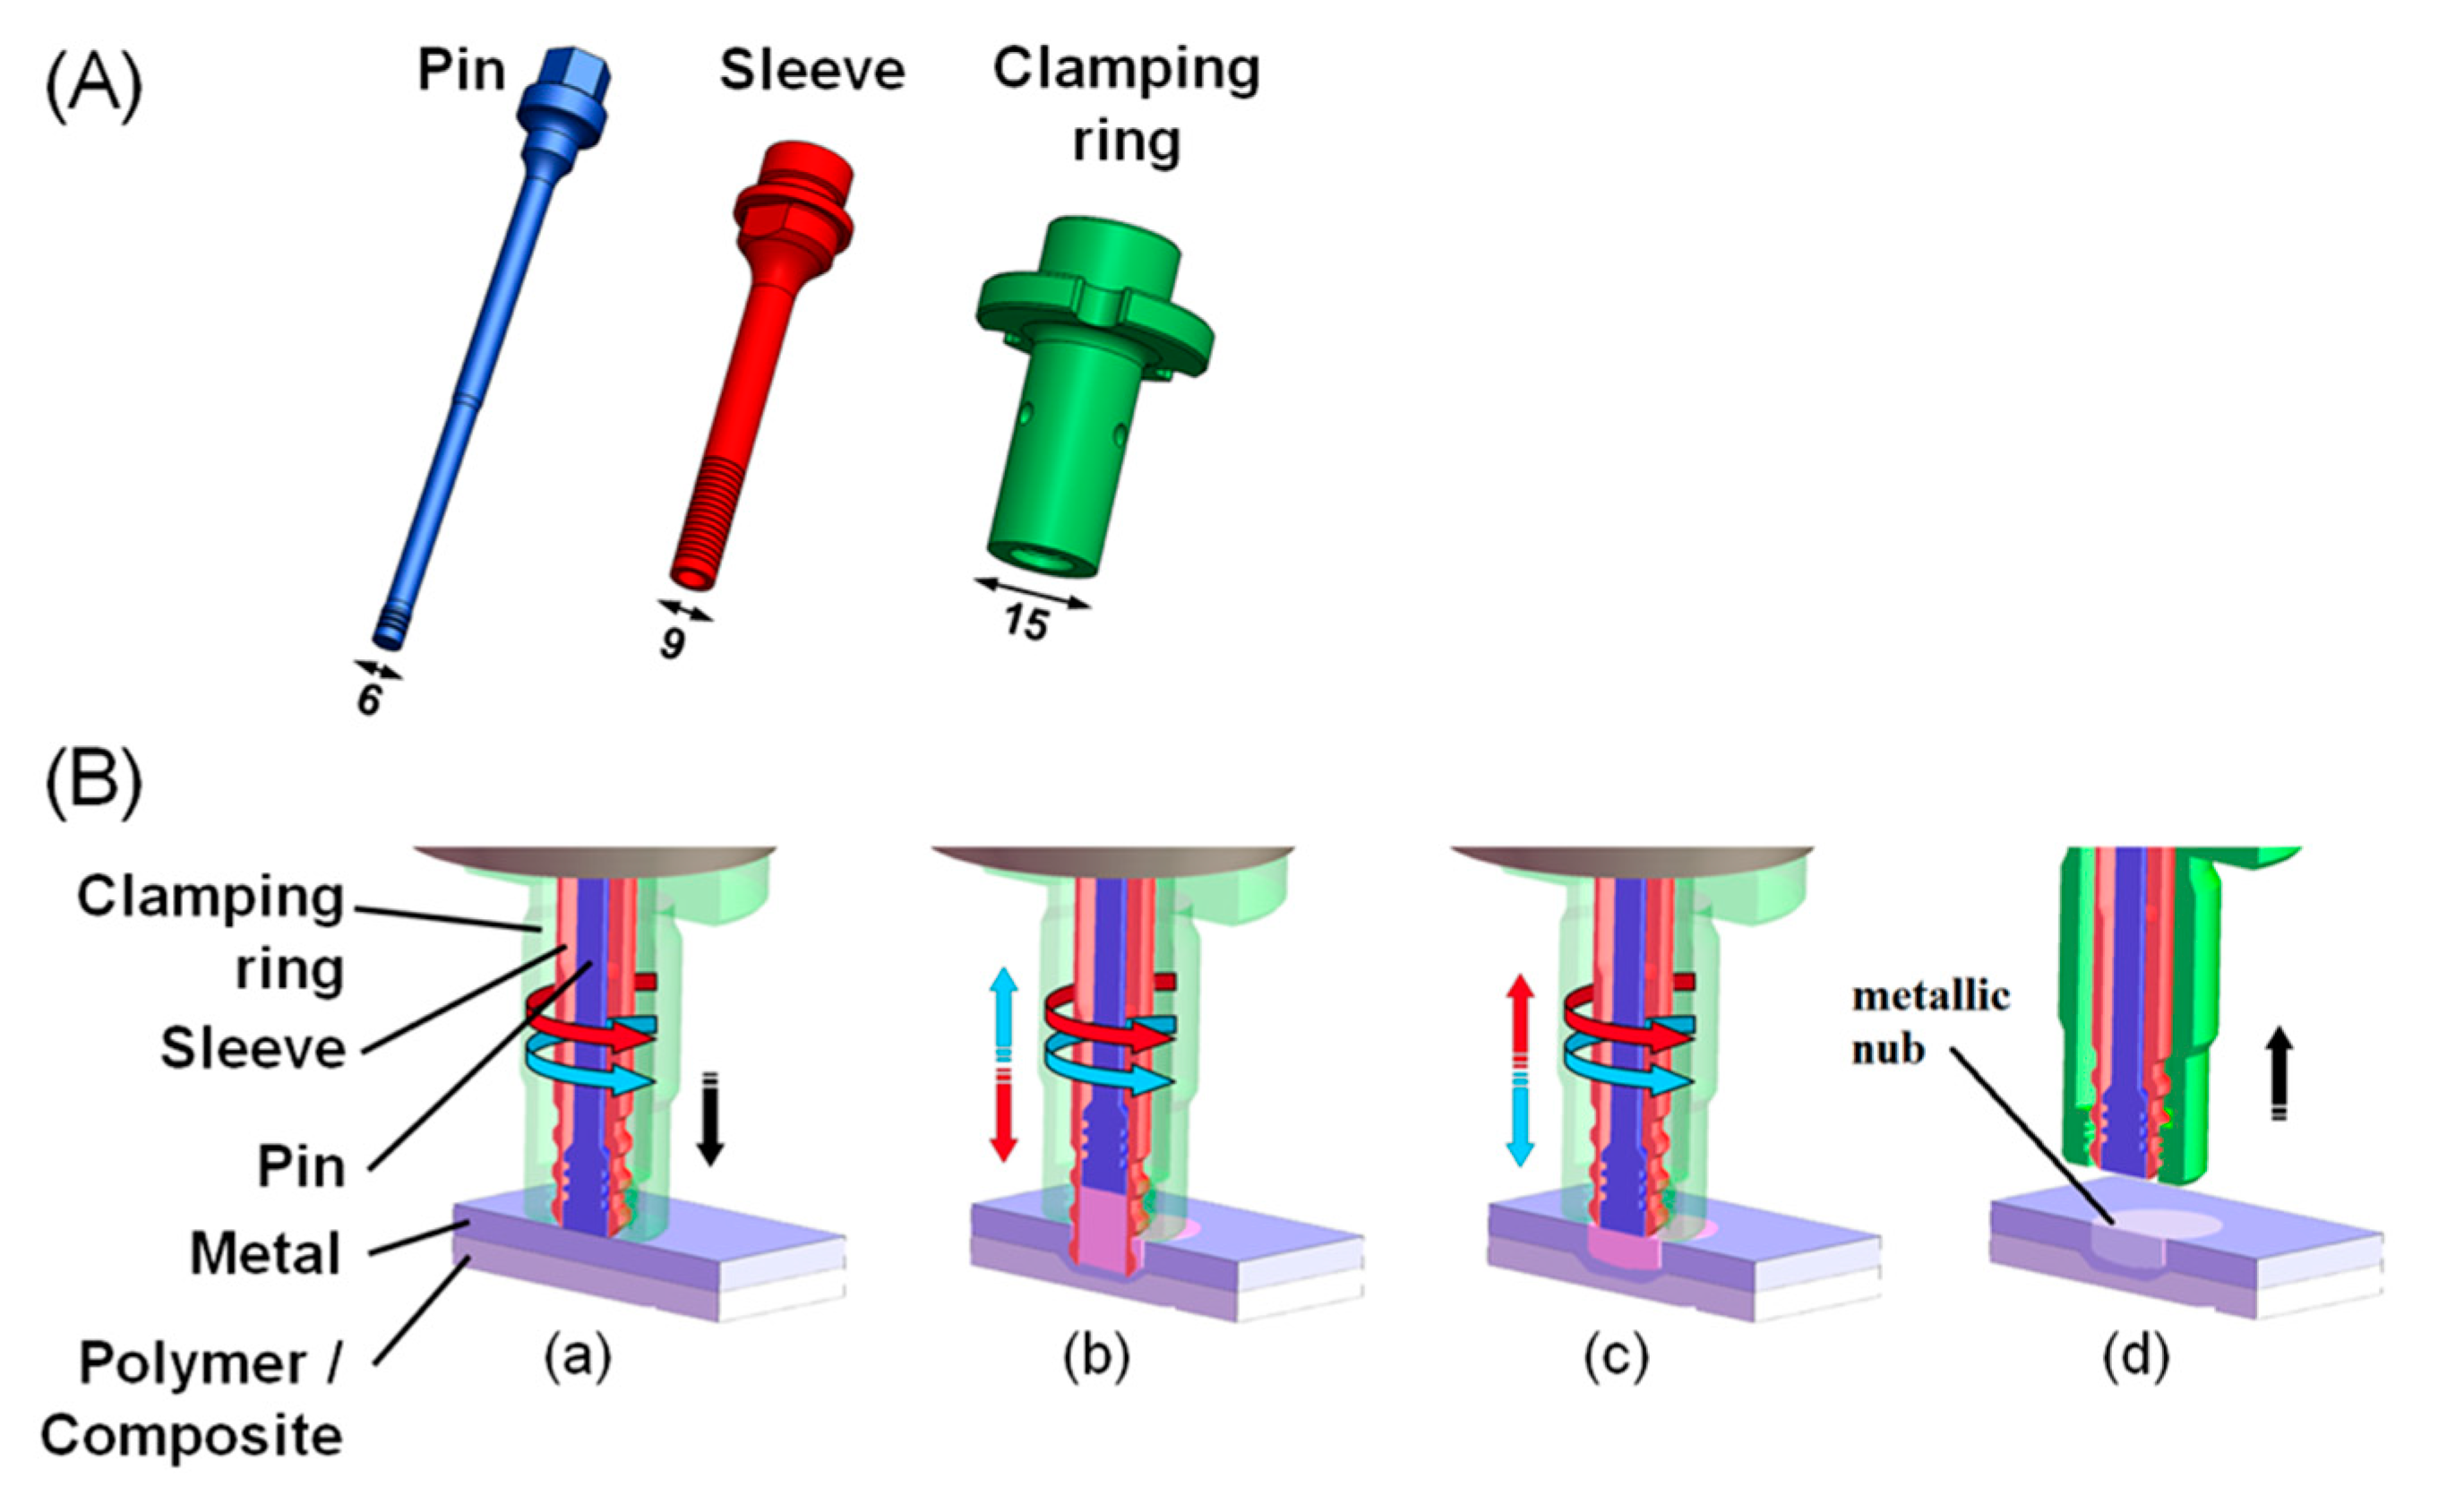
2.3.1. Production of the Joints

Sandblasting was used on the aluminum alloy before the joining process to increase its surface roughness and adhesion to the composite [6,29]. Alumina corundum was used as the medium (Al2O3, average particle size: 100–150 µm). Sandblasting was performed for 10 s from a distance of 20 cm and an incidence angle of 45° between the blasting pistol and the aluminum part. The average surface roughness (Ra) obtained was 6.7 ± 0.4 µm.
The joints were produced in a single overlap configuration (Figure 1) to allow their mechanical testing after the exposure to salt spray. The joining equipment RPS 200 (Harms & Wende, Hamburg, Germany) was employed in this study. A non-consumable tool made of molybdenum-vanadium hot-work tool steel was used (Figure 2A). The sleeve-plunge variant of FSpJ was employed to produce the joints in this study. Figure 2B presents the steps of the FSpJ process: (a) positioning of the parts and the tool, (b) plunging of the sleeve and plasticization of the metal part, (c) refilling of the keyhole formed by the sleeve plunging, and (d) consolidation of the joint under pressure. For details about the FSpJ process, please refer to [4]. The joints were produced using the following joining parameters: 2900 rpm of rotational speed, 0.8 mm of plunge depth, 8 s of joining time, and 6 kN of joining force. This combination of joining parameters was obtained from a previous statistical optimization (design of experiments combined with analysis of variance) to maximize the lap shear strength of the joints. The optimization study is beyond the scope of this work and therefore will be published elsewhere.

2.3.2. Lap Shear Test

Lap shear tests were employed to evaluate the quasi-static mechanical performance of the joints in this study. The tests were carried out using a universal testing machine, Zwick/Roell 1478 (Zwick/Roell, Ulm, Germany), with a cross-head speed of 1.27 mm·min−1 at room temperature. Specimens with dimensions of 100 mm × 45 mm (2025 mm2 of overlap area) were tested, as depicted in Figure 1. The average shear strength of the joints was evaluated based on five replicates.

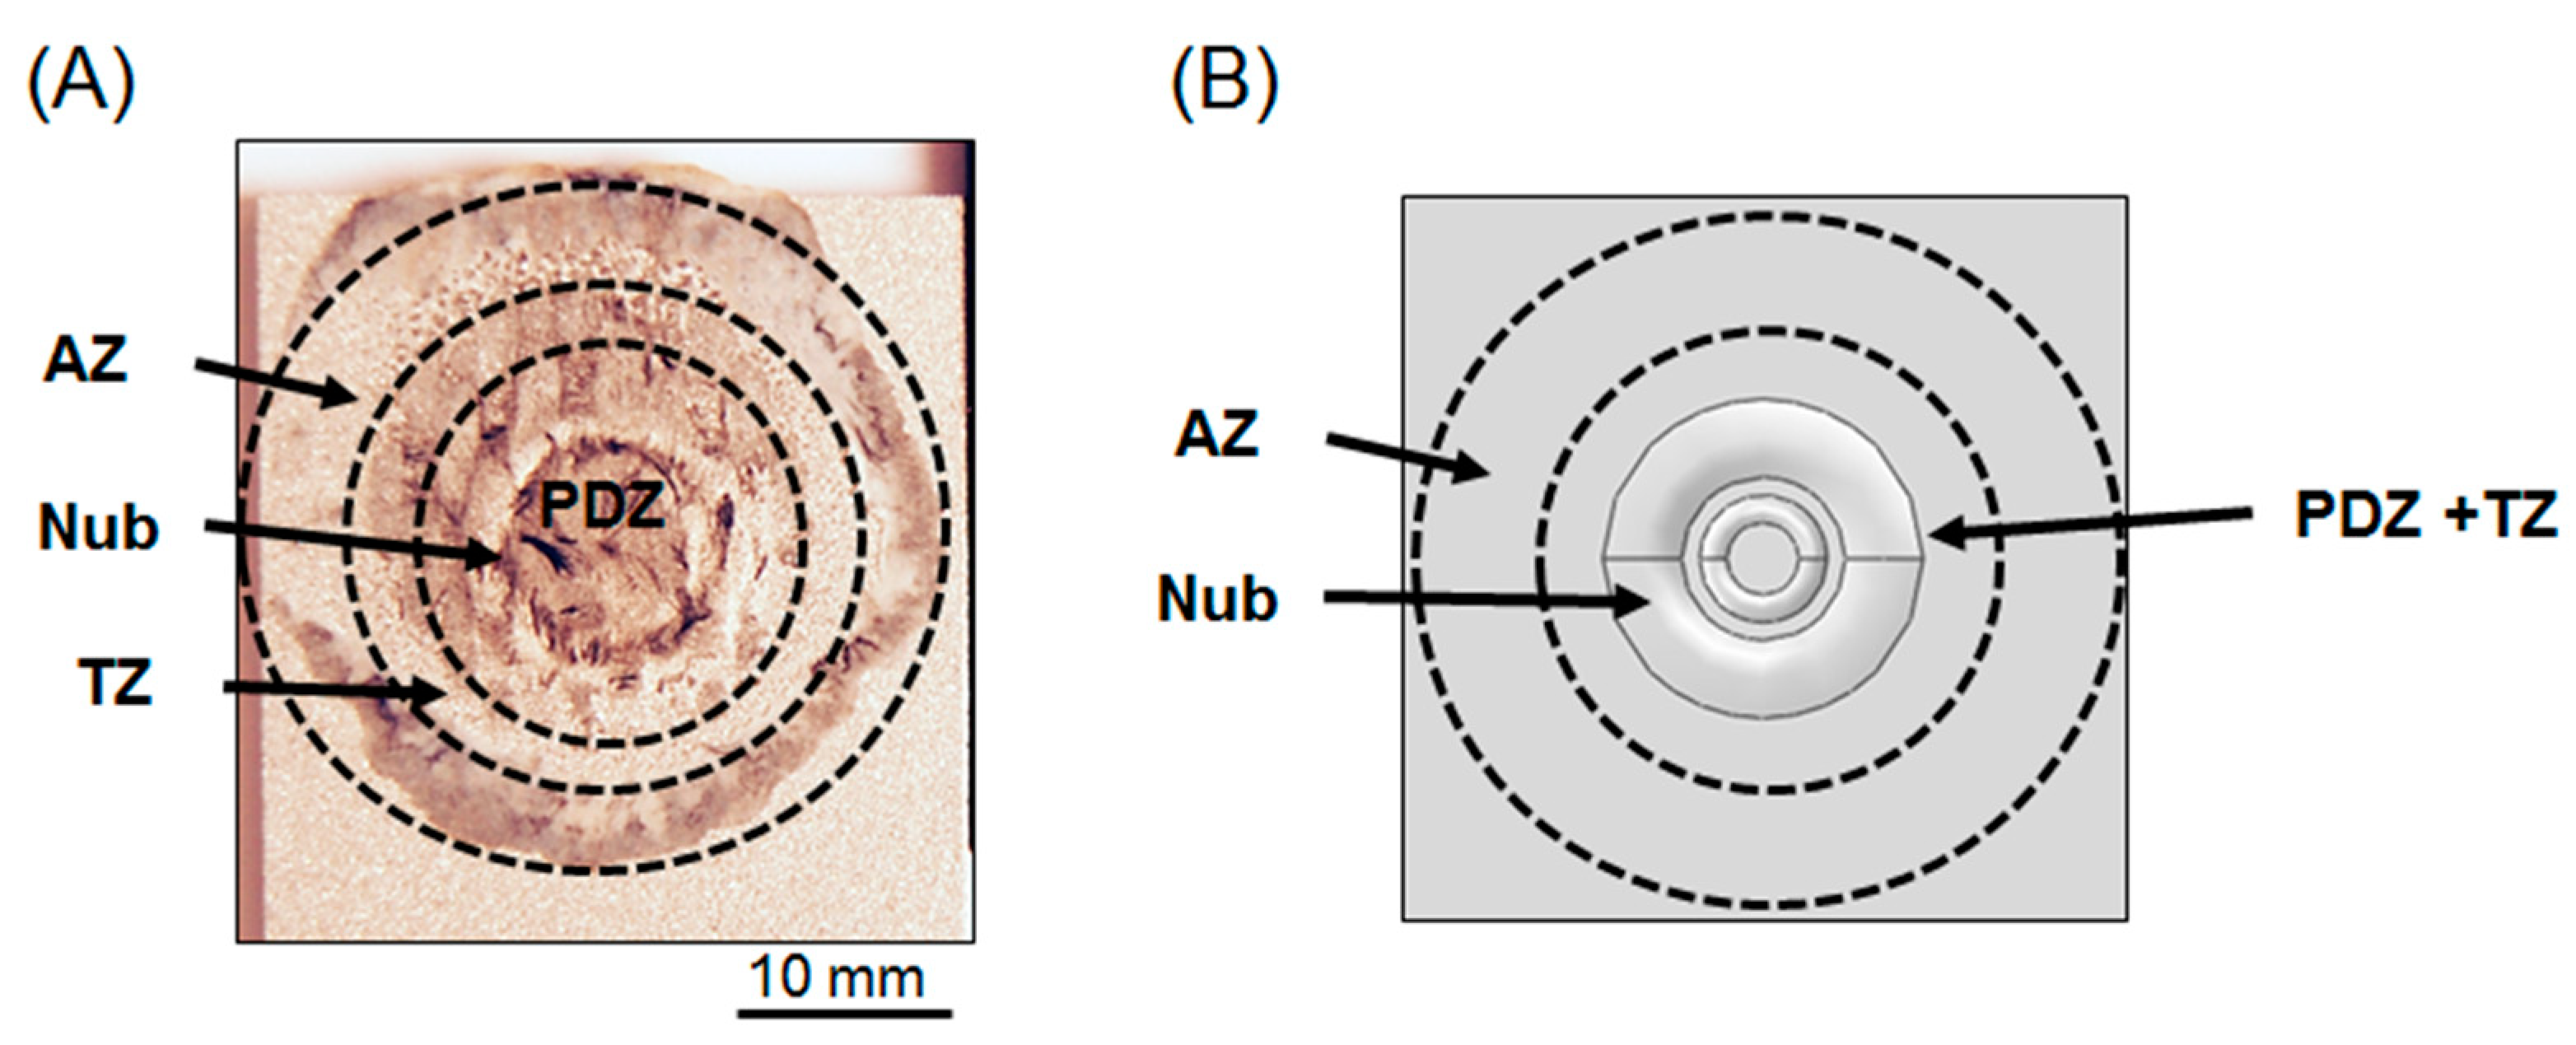
2.3.3. Fracture Surface Analysis

The failure micromechanisms of the joints were analyzed using scanning electron microscopy (SEM). The fractured surfaces of the joints were gold sputtered and then analyzed by SEM (FEI, QUANTA FEG 650, FEI Company, Hillsboro, OR, USA). A voltage of 10 kV and a working distance of 10 mm were utilized.

2.4. Modelling Procedure

Finite element modeling (FEM) was used in this work to predict the damage evolution in the different bonding zones of the friction spot joints. The geometry used was the same as in the lap shear test (Figure 1), since the validation of the model was performed using this test. The software Abaqus (version v. 6.14-1, Dassault Systèmes Simulia Corp, Providence, RI, USA) was used to perform the simulations.

2.4.1. Discretization of the Interface

The joined area of the joints was modelled based on the discretization of its bonding zones and the metallic nub geometry. The joined area of a friction spot joint consists of three bonding zones: PDZ, TZ, and AZ. For simplification purposes and owing to its reduced area compared to both AZ and PDZ, the TZ was coupled with the PDZ in this study (Figure 3). The area of each zone was approximated to the values obtained from the fracture surfaces of the joints after mechanical testing. The PDZ has an area of 197 ± 12 mm2 and the AZ of 268 ± 9 mm2. Figure 3 presents (A) a real fracture surface along with the bonding zones and (B) the discretized zones in the model for a friction spot joint. In addition to the discretization of the bonding zones, the geometry of the metallic nub was also included. The nub geometry was modeled based on a typical cross-section of a friction spot joint, as indicated in Figure 4.

2.4.2. Interface Interaction

A variety of options is offered by Abaqus to define contact and model the interface of the joints [31]. In this study, the cohesive behavior feature was employed. This feature applies the fundaments of damage mechanics to model the behavior of an interface by using cohesive zone models. This strategy has been widely used to investigate the fracture behavior of composites and adhesive joints [20,22,32,33,34,35,36]. Cohesive behavior can be applied to surfaces having direct contact (cohesive surfaces) or to a layer of elements located between two surfaces (cohesive elements) [31]. Owing to its simplicity and good agreement with the failure mode of the joints, the cohesive surfaces option was employed in this study.
Cohesive behavior is developed according to the traction–separation law [31,37]. The uncoupled traction–separation behavior was selected to simplify the model. In this way, the input to the law is just the cohesive stiffness coefficients in the pure normal (nn), tangential (tt), and shear (ss) directions. The force (t) at the contact interface is given through a linear elastic relation between the normal, tangential, and shear stiffness (Knn, Ktt, Kss) and separations (δnn, δtt, δss), respectively [22]. Equation (1) [37] denotes the uncoupled traction–separation law.
t = t n t s t t = K nn 0 0 0 K ss 0 0 0 K tt   δ n δ s δ t = K δ .
The values of stiffness (K) were assigned to the bonding zones considering that the PDZ is the strongest region of the joint [10]. The stiffness parameters were first inferred according to the linear-elastic regime of the lap shear curves. Such regime does not present any damage in the interface of the joint, which allows for a preliminary estimation of its overall initial stiffness. Since it is a lap shear test, the shear stiffness component (Kss) contributes the most to oppose the separation between the surfaces; therefore, a greater magnitude was assigned to it with respect to the normal and tangential components (Knn and Ktt). Once the stiffness components were initially instantiated considering such details, they were optimized for better fitting between experimental and numerical results concerning force–displacement curves and out-of-plane displacements. Table 4 presents the final values of the stiffness coefficients applied to the different bonding zones modeled in this study.

2.4.3. Damage Criteria

The traction–separation law applied to model the properties of the interface was complemented with a damage criterion to model the failure of the joint. The damage criterion employed is based on the separation (displacement) between the surfaces initially in contact. A certain magnitude of separation between the surfaces is allowed without loss of stiffness in the interface. Once the separation reaches a certain threshold, denominated ‘initiation’, the aforementioned stiffness decreases linearly upon further loading. The decrease in stiffness in the interface enables larger separation between the surfaces. Once the maximum set value for separation is reached, the interface can no longer carry loads and the complete failure of the joint is achieved—a consequence of total degradation of the stiffness in the interface. Therefore, the displacement input values for the initiation and completion of damage (the maximum value for separation) in a given bonding zone control the linear damage evolution between the cohesive surfaces. The assumption of linear damage evolution was employed for simplicity. Table 5 presents the values of separation applied to model the damage initiation and complete failure in the different bonding zones of the joint. These values were inferred from the experimental force versus displacement curves coupled with digital image correlation (DIC).

2.4.4. Boundary Conditions

The boundary conditions were set to simulate the mechanical tests to which the specimens were experimentally subjected. The lap shear test of the overlap joints was simulated. Therefore, the aluminum part was fixed, while the composite part was subjected to a constant and uniform displacement by imposing shear loading to the interface of the joint (Figure 1).

2.4.5. Modelling of base Materials

Plastic deformation of the composite matrix in the PDZ of friction spot joints is the main micromechanism of failure in this zone [10]. Therefore, the composite was modeled with an elasto-plastic behavior, while the aluminum was assigned an elastic behavior. The elasto-plastic behavior of the CF-PPS was modeled by the load–displacement curve of the material under tensile load provided by its manufacturer. The elastic properties of the aluminum alloy as well as it Poisson ratio are given in Table 2.
Both base materials were meshed with hexahedral eight-node elements with quadratic interpolation and reduced integration (Abaqus C3D20R).

3. Results and Discussion

3.1. Prediction of Damage Evolution at the Interface of the Joint using Finite Element Method

Figure 5 presents the force–displacement curves obtained from lap shear tests and the finite element model developed in this study. One observes that the experimental average ultimate lap shear force (ULSF) is 3770 ± 288 N, while the simulation presents 4061 N of ULSF. It demonstrates that the model predicted the failure load of the friction spot joints with a deviation of 8%. Regarding the displacement at failure of the joints, the FE model showed 0.61 mm, while the experimental average was 0.62 ± 0.15 mm; a deviation of 1.6%. Both deviations, for ULSF and displacement at failure, are below 10%, indicating a very good agreement between the numerical output and the experimental data to evaluate the mechanical performance of the friction spot joints.
Figure 6 depicts the stress development at the interface and through the cross-section of the friction spot joint during shear loading. One observes that the stress concentration is asymmetrical. The stress rise is most pronounce at the free edge of the CF-PPS (Figure 6B,C). As the loading of the structure progresses, the composite bends in an attempt by its lower surface to displace in the loading direction despite the connection of the upper surface to the aluminum surface (Figure 6D–G). The same phenomenon is observed for the aluminum part (Figure 6D–G). This bending effect is known as secondary bending and it is a result of the eccentric load path induced by the overlap configuration of the joints [38,39]. McCarthy et al. [40] and Egan et al. [41] reported increased stress concentration and reduced joint stiffness as a result of secondary bending in bolted joints. Additionally, Ekh et al. [42] demonstrated that secondary bending strongly influences the failure mode of composite bolted joints. In addition, the secondary bending has also proven to be a critical factor for the fracture behavior of adhesive bonded joints [43,44,45,46]. Lee et al. [44] investigated the mechanical behavior of adhesive bonded double-strap and supported single-lap GFRP joints. The authors showed that the joint strength was almost independent of the adhesive type. Nevertheless, the peeling effect created by the secondary bending of the structure was crucial to the failure behavior of the joints.
One observes that the out-of-plane displacement resultant from the secondary bending is less expressive for the aluminum part due to its higher stiffness in comparison to the CF-PPS (EAA2024-T3 = 73 GPa, ECF-PPS = 53 GPa). The cross-sectional views of the joint in Figure 6 display a more pronounced bending at the free edge of the composite on the right-hand side of the overlap area. The secondary bending of the composite implies the opening of the interface, thereby increasing the concentration of tractive stresses in this half of the joined area (yellow-red field in Figure 6D–G). Hence, a strong stress concentration is seen around the nub on the right-hand side of the joined area (bright red fields in Figure 6F,G). It indicates the bearing of load through the anchoring effect provided by the metallic nub into the composite. Finally, a small field of compression stress is identified on the left-hand side of the joined area, close to the free edge of the aluminum part (dark blue fields in Figure 6D–G). It is believed that such compression stresses are generated due to the bending of the composite part, which leads to the compression of the aluminum surface by the composite in that region. Additionally, the relative movement between aluminum and composite also squeezes the walls of the metallic nub against the composite during shear loading, thus contributing to the compressive stresses in this region. Note that the compressive stresses are also observed through the thickness of the aluminum part in Figure 6F,G due to the anchoring of the nub into the composite.
The damage evolution at the interface of the joints is given in Figure 7. One observes that the damage of the interface initiates at the borders of the AZ (Figure 7B). Further, the damage propagates with a linear front from the edges to the center of the joined area (Figure 7B). One observes that the damage in the AZ evolves rapidly. The finite element model showed that the damage initiates at approximately 30 N and completes at 750 N in the AZ (Figure 7B–E). From 750 N until 1500 N, it is believed that the stresses are borne by the mechanical anchoring of the metallic nub. Thus, at 1500 N, damage starts to occur inside the PDZ (Figure 7F). As the damage advances inside the PDZ, one observes that its propagation turns into an asymmetrical linear front (Figure 7G,H). The damage evolves preferably from the free edge of the composite part as a result of the asymmetrical out-of-plane-displacement expressively developed for loads superior than 1500 N (seen in Figure 6D–G). As a result of the asymmetrical stress concentration seen in Figure 6, the damage evolves preferably from the free edge of the composite part. It is possible to observe that, at 3500 N, the damage starts to propagate also on the opposite side of the PDZ, close to the free edge of the aluminum part (Figure 7I). Nevertheless, the damage in the PDZ already reached the nub at 3500 N, propagating from the free edge of the composite (Figure 7I). Therefore, rapid damage propagation is observed, leading to the total failure of the interface at approximately 4000 N (Figure 7J).

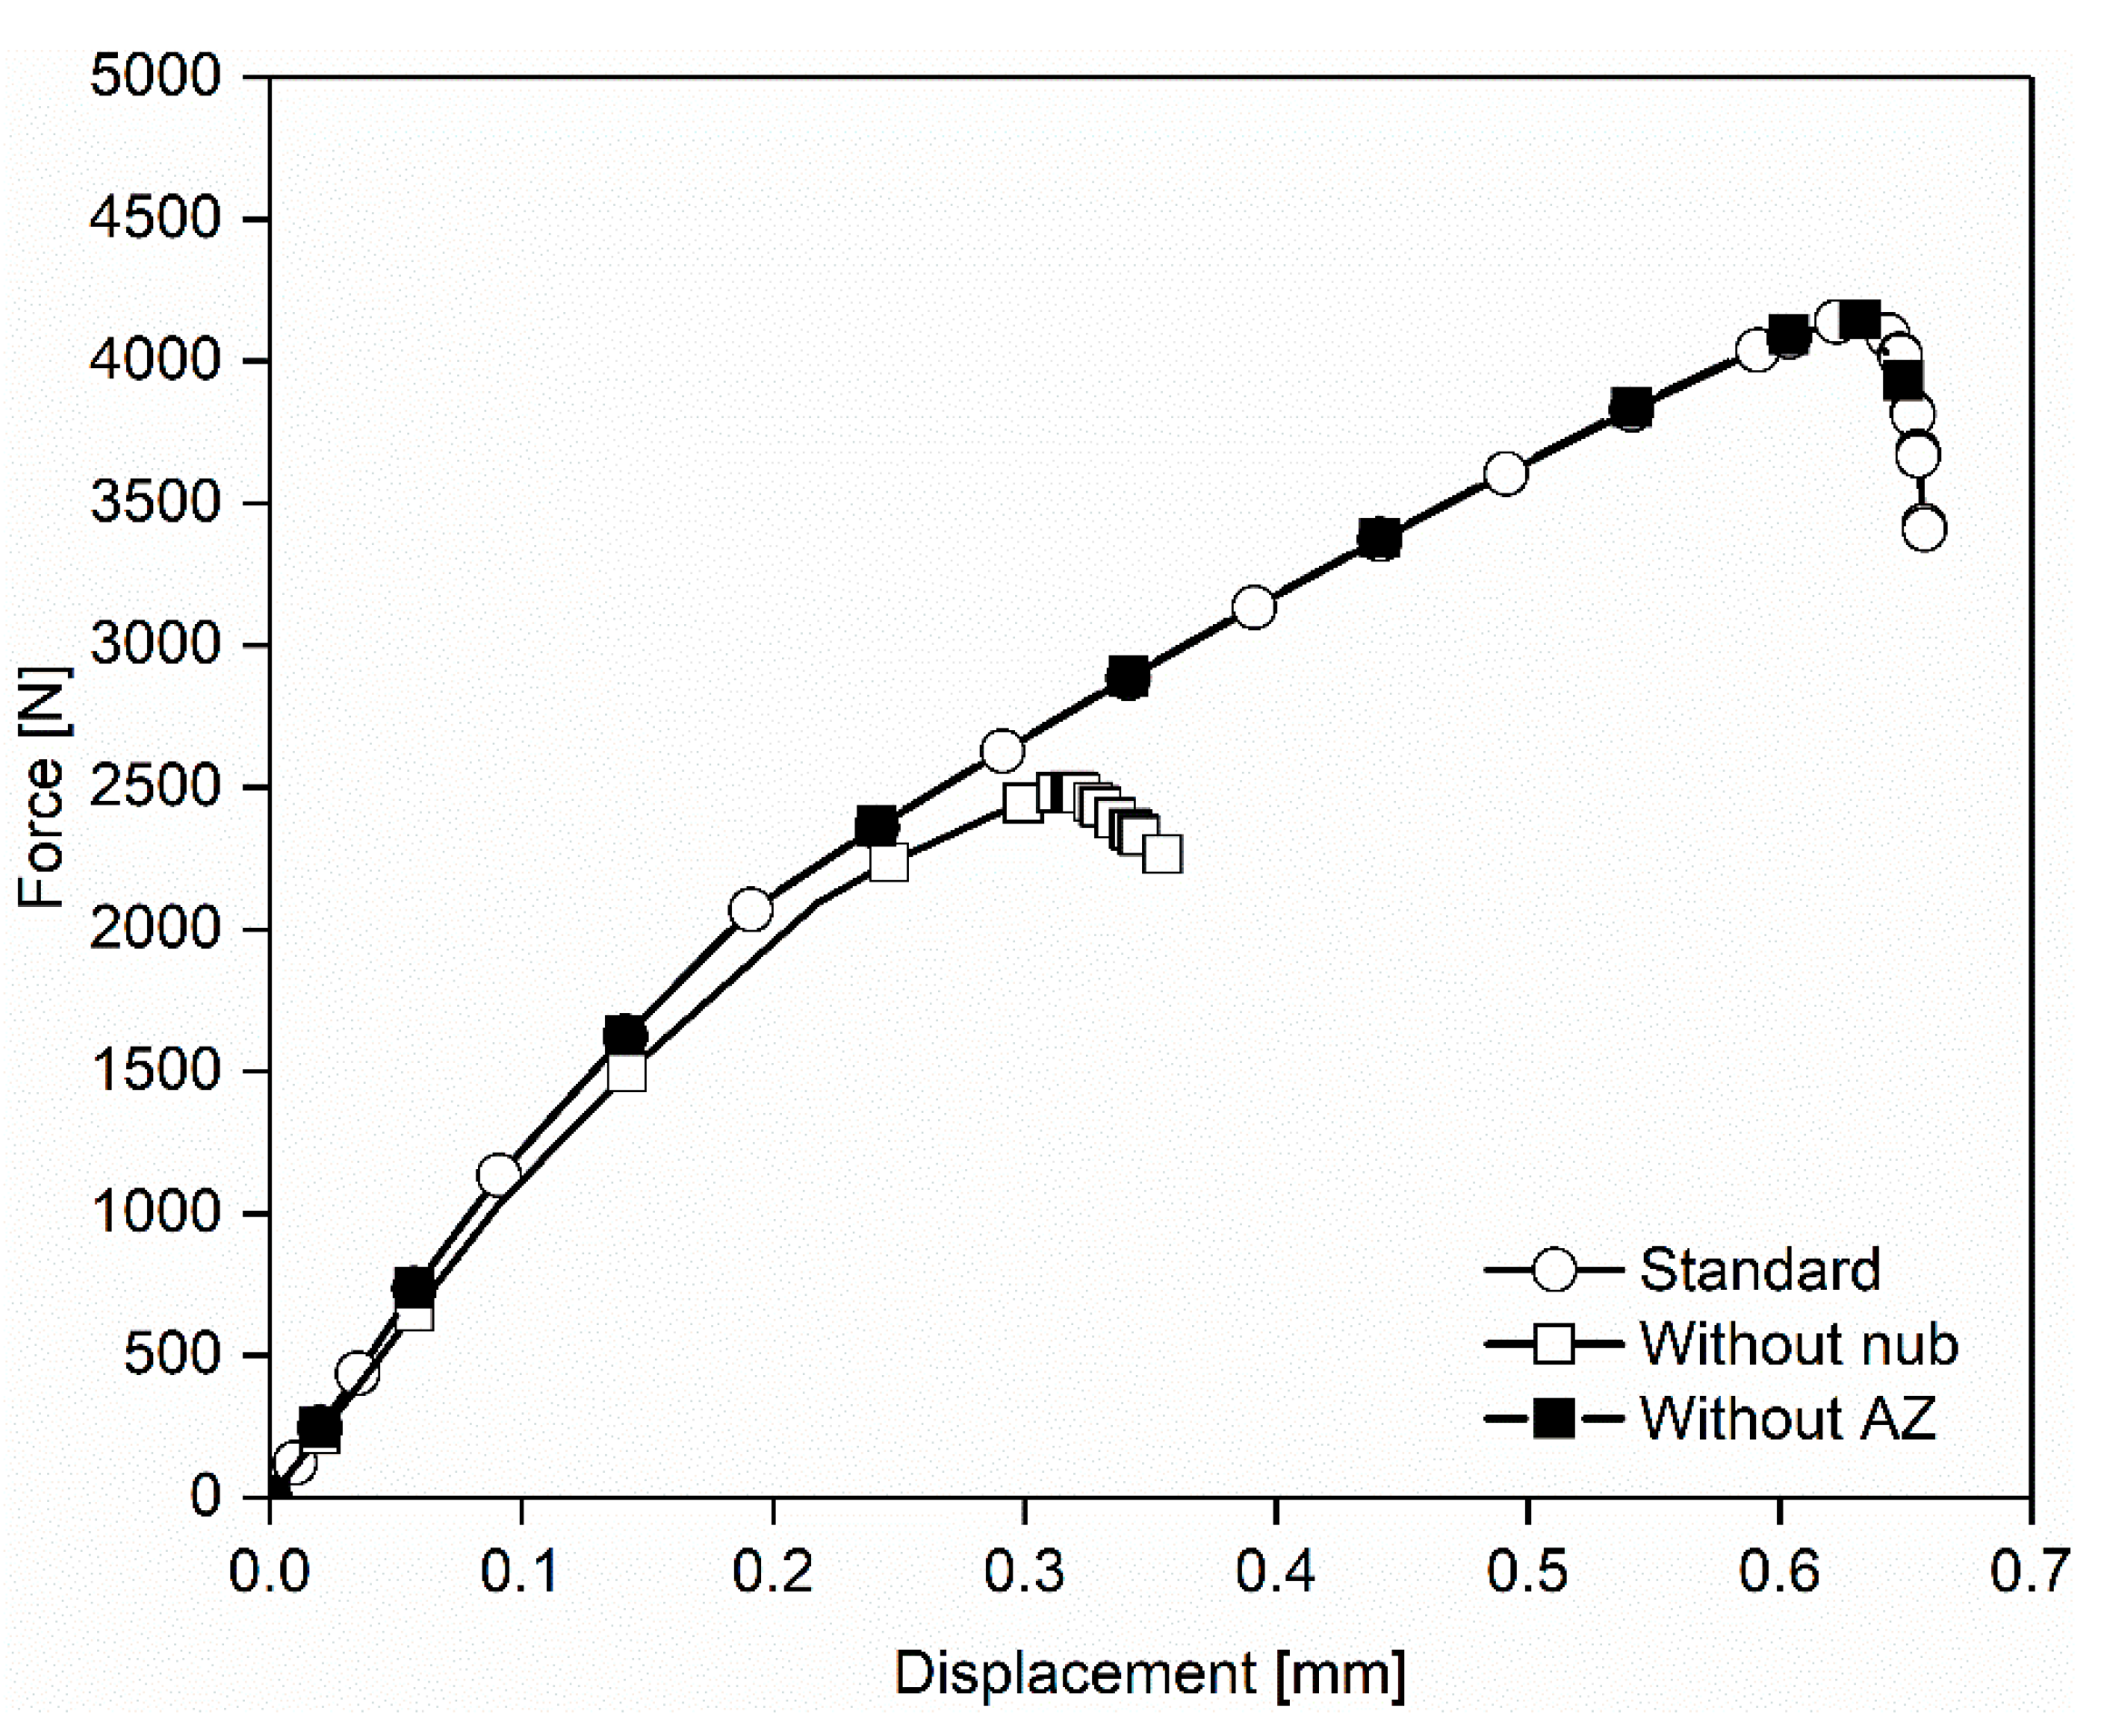
3.2. Influence of the Bonding Zones in the Mechanical Behavior of Friction Spot Joints

Combining the force–displacement curves (Figure 5) and the damage evolution presented in Figure 7, it is possible to infer the damage evolution rate at the AZ and the PDZ. Table 6 summarizes the initiation and completion of the damage in each bonding zone. The AZ presents a damage evolution rate of 0.14% N−1, while the PDZ fails at a rate of 0.04% N−1, which is approximately 3 fold slower than the degradation rate of the AZ. It demonstrates once more that the PDZ is the strongest zone of the friction spot joints [5]. As discussed previously, in the PDZ, the main bonding mechanism in the PDZ is the mechanical interlocking provided by the metallic nub (macro scale), and the polymer and fiber attachment to the aluminum surface (microscale). In contrast, in the AZ, the parts are connected through adhesion forces. Thus, a higher level of efficiency is expected from the mechanical interlocking in comparison to the adhesion forces, leading to a lower degradation rate of the PDZ than that of the AZ.
These observations indicate significant differences in the contributions of the different bonding zones to the mechanical performance of the friction spot joints. Using FEM, the mechanical behavior of the joints without the AZ and without the metallic nub (flat interface) under shear loading was investigated.
Figure 8 displays the force–displacement curves obtained for the joints without AZ and without the metallic nub and compares them with a standard joint containing all the typical features of friction spot joints.
One observes that the joint without AZ presents a mechanical behavior practically identical to the standard joint (Figure 8). No changes in stiffness, ultimate lap shear force, or displacement at failure are observed. It suggests that the AZ does not contribute to the overall mechanical performance of friction spot joints. Additionally, it is important to note that although AZ does not contribute to the mechanical performance of the joints, this zone has an important role in the corrosion protection of friction spot joints [47].
In contrast, the mechanical behavior of the joint without the metallic nub strongly differs from the mechanical behavior observed for the standard joint (Figure 8). The initial stiffness of the joint without the nub is slightly lower than that of the standard joint, which is approximately 8.3 kN mm−1 for the standard joint and 8.0 kN mm−1 for the joint without nub. This result suggests that the initial stiffness of friction spot joints is mainly dictated by the PDZ, since it did not significantly change when AZ and the nub were removed (Figure 8). Additionally, one observes that the elongation of the joint decreased drastically when the nub was removed. The joint without nub prematurely failed at 0.32 mm of displacement, while the standard joint extended until 0.61 mm (Figure 8). Considering the damage evolution presented in Figure 7, the joint without nub failed rapidly after the damage reached the PDZ. The bearing of load in the PDZ seems to mostly be due to the shearing between the metallic nub and the volume of composite around it. Therefore, this zone is weakened without the nub. This observation indicates that the nub strongly contributes to the bearable load of the PDZ and consequently to the ductility of the joint.
The geometry of the nub also demonstrated to have strongly influenced the mechanical behavior of friction spot joints. Details of this investigation are found in [7].

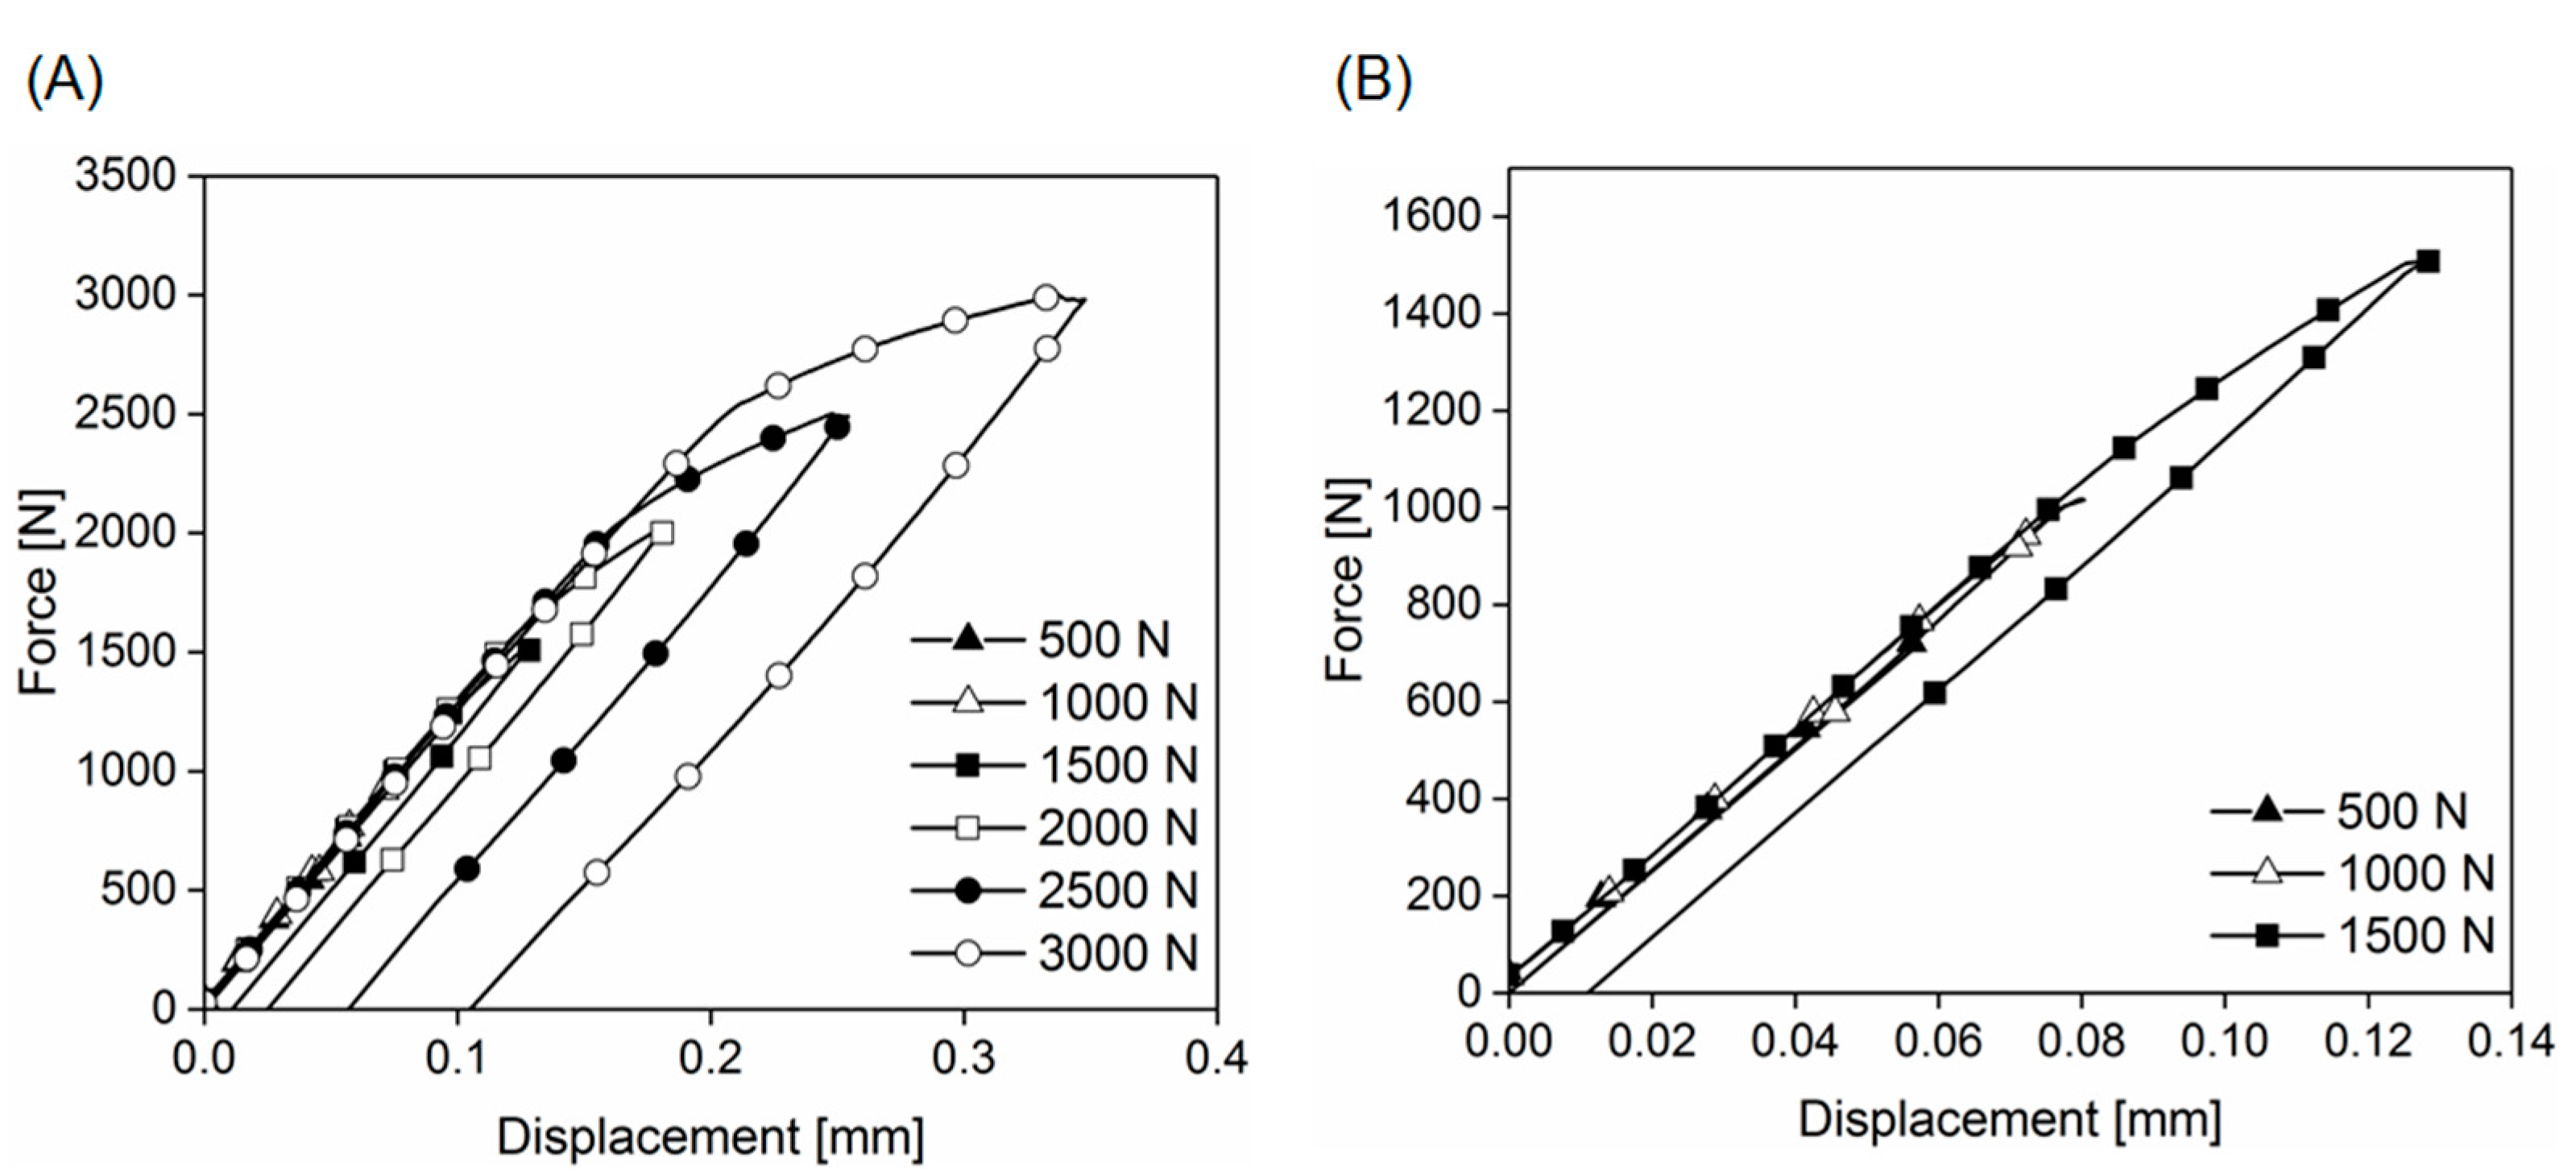
3.3. Damage Evolution and Its Mechanisms

In this section, the damage mechanisms are described considering the different load levels and bonding zones of the joints. For these purposes, one friction spot joint was subjected to subsequent loading and unloading steps. Six levels of maximum load were investigated: 500 N, 1000 N, 1500 N, 2000 N, 2500 N, and 3000 N. At the attempt of a final load level of 3500 N, the joint failed due to the accumulated damage. The hysteresis curves are presented in Figure 9.
The unloading section of the hysteresis curves demonstrates that up to 1000 N there was no permanent displacement when the joint was totally unloaded, as indicated by the close-up in Figure 9B. It demonstrates that the joint did not plastically deform up to this load level. Considering the damage evolution presented in Figure 7, the damage propagation at 1000 N is retained in the AZ. Therefore, it is concluded that the damage mechanism in this bonding zone does not include plastic deformation. Figure 10 shows details of the fracture surface of a friction spot joint in the AZ. The reconsolidated polymer layer that composes the AZ is identified in Figure 10B with a featureless surface. As also reported by Goushegir et al. [10], the featureless fracture surface in the AZ indicates that the crack propagated through the interface in this region. In this case, the adhesive failure mode is predominant and the main failure mechanism is the simple decoupling of the interface. Nevertheless, Figure 10C,D show signs of plastic deformation and tearing at the borders of the polymer layer in the AZ. Therefore, it is expected that the mechanism of damage changed as the damage evolves from the AZ to the center of the joint as the load increases.
Starting from the load step of 1500 N, permanent displacements are observed after the unloading of the joint (Figure 9B). The impossibility to return to zero displacement after the complete unloading indicates the occurrence of plastic deformation during the loading of the joint to 1500 N (1). In addition, Figure 7 demonstrates that the damage starts to propagate into the PDZ also at 1500 N (2). The observations (1) and (2) indicate that the main failure mechanism in the PDZ is plastic deformation. The fracture surface analysis of the joint shows the plastic deformation of the PPS matrix in different regions inside the PDZ (Figure 11). Plastic deformation of the PPS in a matrix-rich area on the composite fracture surface is observed in Figure 11B. Figure 11C shows fibrils of PPS close to the center of the joint (nub region), indicating extensive plastic deformation in this area. Additionally, plastic deformation of the PPS matrix around the fibers attached to the aluminum surface is observed in Figure 11D. As discussed previously, plastic deformation was also identified in the PDZ by Goushegir et al. [10] in the failure mechanism analysis for friction spot joints.
Figure 9A also shows that the permanent displacement after unloading continuously increased from 0.01 mm (1500 N) up to 0.11 mm (3000 N), indicating progressive plastic deformation in the PDZ until the final failure of the joint. Although the damage at the interface progressively increases at each loading step, the initial stiffness of the joint did not significantly change until the load level of 2500 N was reached (Figure 12). The joint presented an initial stiffness of 13.1 kN mm−1 until the loading step of 2500 N. After this step, the stiffness decreased to 12.5 kN mm−1 until the final failure of the joint, a decrease of approximately 5%.
As discussed in Section 3.2, the finite element model indicated that the initial stiffness of the friction spot joints is mainly dictated by the PDZ (Figure 8). In addition, the main damage mechanism of the PDZ was demonstrated to be plastic deformation (Figure 9 and Figure 10). The plastic deformation of semi-crystalline polymers, such as the PPS in this study, is a complex phenomenon and it is still discussed nowadays [48,49]. Nevertheless, several authors have agreed on the occurrence of strain hardening due to the orientation of the amorphous phase in semi-crystalline polymers [48,50]. Such phenomenon occurs through the disentanglement and orientation of the macromolecules in the amorphous phase between the crystallites [48,49]. This strengthening mechanism comprises overcoming the secondary bonds between the entangled macromolecules in the amorphous phase, thereby orientating the chains in the direction of load. At the maximum orientation of the chains, the load is borne by the primary bonds in the highly oriented bundles of macromolecules [51,52]. Therefore, strengthening is observed for the material under load before its failure.
Thus, the minimal decrease in stiffness of the joint (Figure 12), even at stages of extensive damage at the interface (Figure 7), may be a result of strain hardening due to the plastic deformation of PPS in the PDZ (Figure 11). Evidences of strain hardening were also identified for the friction spot joints under cyclic loading [53]. In that case, bundles of the stretched PPS matrix were found widely distributed in the fracture surface. Besides, the cyclic loading initiated crazes in the deformed PPS matrix. Crazes are a result of localized yielding of the polymer [49]. They appeared as apertures between bundles of highly oriented macromolecules, indicating the occurrence of strain hardening [22].

3.4. Failure Theory for Friction Spot Joints: A Summary

In 2016, Goushegir et al. [10] proposed a failure theory for friction spot joints based on the fracture surface analysis. The authors reported that the failure of friction spot joints occur in four stages, which could be identified in the force–displacement curve of the joints. Figure 13 depicts the typical force–displacement curve for friction spot joints divided into the four stages of failure, previously proposed by Goushegir et al. [10].
Stage 1 corresponded to the high-stiffness linear-elastic behavior of the joints. It was believed that the crack radially nucleates at the periphery of AZ in this stage.
Stage 2 comprised the region of reduction in stiffness of the joint. In this stage, the crack would radially propagate through the AZ until the TZ. The authors believed that the stiffness reduction was due to the complete failure of the AZ.
Stage 3 corresponded to the low-stiffness linear-elastic behavior of the joints. In this stage, it is believed that the crack propagated through the TZ and in the PDZ.
Finally, Stage 4 comprised the final catastrophic failure of the joint as the ULSF is reached.
The failure theory proposed by Goushegir et al. [10] has greatly contributed to the understanding of the damage evolution in friction spot joints and instigated further investigations in this topic. Thus, the findings of the present study add and clarify important aspects of the failure behavior of the joints, thereby refining Goushegir’s failure theory for friction spot joints.
Based on the results discussed earlier in this chapter, modifications and reaffirmations are proposed to the four stages of the failure theory of Goushegir et al. [10]. Figure 14 summarizes the new failure theory for friction spot joints based on the findings of this study.
Stage 1 comprises the high-stiffness linear-elastic behavior of the joints, as previously proposed [10] (Figure 14). The hysteresis curves presented in Figure 9 do not indicate the occurrence of plastic deformation until 1000 N, thus confirming the linear-elastic behavior up to this load. Hence, Stage 1 occurs approximately from 0 to 1000 N (Figure 14). Additionally, the damage evolution prediction using FEM demonstrated that the crack initiates and propagates through the AZ, leading to the total failure of this zone at 750 N (Figure 7). Therefore, it is believed that Stage 1 actually comprises the complete failure of the AZ. This contradicts the previous theory, which assumed only nucleation of the crack at the borders of the AZ in this stage. In addition, the crack was shown to have a linear front of propagation (Figure 7), contradicting the radial crack propagation formerly suggested by Goushegir et al. [10].
Stage 2 remains characterized by the reduction in stiffness of the joint. This stage occurs approximately from 1000 to 2000 N (Figure 14). Previously, it was believed that such stiffness reduction was due to the complete failure of the AZ. However, the FEM damage prediction indicates that the stiffness reduction matches with the evolution of the damage from the AZ to the PDZ. Both phenomena occur around 1500 N (Figure 5 and Figure 7). Concomitantly, the hysteresis curves presented in Figure 9 demonstrate the onset of plastic deformation at this load level. These observations indicate that the stiffness reduction observed in the force–displacement curves is actually due to the damage initiation in the PDZ through plastic deformation.
Stage 3 comprises the propagation of the damage in the PDZ, as depicted in Figure 7. This stage occurs approximately from 2000 N until the ULSF is reached (Figure 14). The hysteresis curves presented in Figure 9 confirm the progress of plastic deformation in this stage. Starting from 1500 N, the permanent displacement after unloading continuously increases from 0.01 mm (1500 N) up to 0.11 mm (3000 N) (Figure 9). Therefore, this stage may no longer be characterized as a low-stiffness linear-elastic behavior, since plastic deformation is observed. Additionally, one also notes that Stage 3 becomes practically non-existent when the nub is removed from the PDZ (Figure 7). Therefore, it is believed that the plastic deformation in this stage is mostly due to shearing between the metallic nub and the volume of composite around it. This demonstrates the major role of the metallic nub in the ductility of friction spot joints.
Finally, Stage 4 remains as the point when the USLF is reached and the joint catastrophically fails, as previously formulated in [10].

4. Conclusions

Finite element modelling (FEM) and experiments were integrated to understand the damage evolution at the interface of friction spot joints under shear stresses. It was observed that the stresses developed asymmetrically in the joined area due to the asymmetrical secondary bending of the structure were because of the dissimilar materials in the joint. Thus, the damage initiated at the adhesion zone (AZ) and propagated as a linear front from the edges to the center of the joined area. As the damage advanced inside the plastically deformed zone (PDZ), its propagation became an asymmetrical linear front.
The influence of the bonding zones in the mechanical behavior of the joints was also evaluated. The AZ presented a damage evolution rate of 0.14 % N−1, while the PDZ fails at a rate of 0.04 % N−1, which is approximately 3 fold slower than the degradation rate of the AZ. This result demonstrated a higher efficiency of the bonding mechanisms of the PDZ (i.e., the region with the nub and micromechanical interlocking) compared to the adhesion forces of AZ. Using FEM, the influence of the bonding zones in the joint’s mechanical behavior was also evaluated. It was observed that the joint without the nub failed rapidly after the damage reached the PDZ. This indicates that the nub strongly contributes to the bearable load of the PDZ, and consequently to the ductility of the joint.
Based on the new findings of this study, modifications were proposed to the failure theory of friction spot joints proposed by Goushegir et al. [10], helping to shed light on the general quasi-static failure of metal–composite spot joints.

Author Contributions

Conceptualization, N.M.A.; data curation, N.M.A. and R.P.A.; formal analysis, N.M.A. and R.P.A.; funding acquisition, S.T.A.-F.; investigation, N.M.A. and R.P.A.; methodology, N.M.A.; project administration, S.T.A.-F.; resources, S.T.A.-F.; visualization, N.M.A. and R.P.A.; writing—original draft, N.M.A. and R.P.A.; writing—review and editing, N.M.A., R.P.A., J.F.d.S. and S.T.A.-F. All authors have read and agreed to the published version of the manuscript.

Funding

This work was supported by the Helmholtz Association (Germany) and the National Council for Scientific and Technological Development (Brazil, Process 200694/2015-4). S.T. Amancio-Filho would like to acknowledge the Austrian aviation program “TAKE-OFF” and from the Austrian Ministry for Climate Action, Environment, Energy, Mobility, Innovation and Technology, BMK (Austria).

Institutional Review Board Statement

Not applicable.

Informed Consent Statement

Not applicable.

Data Availability Statement

The data presented in this study are available on request from the corresponding author. The data are not publicly available as they are part of an ongoing project.

Acknowledgments

The authors would like to acknowledge the Open Access Funding by the Graz University of Technology.

Conflicts of Interest

The authors declare no conflict of interest.

References

  1. Amancio-Filho, S.T.; Blaga, L.-A. Joining of Polymer-Metal Hybrid Structures: Principles and Applications; John Wiley & Sons Inc: Hoboken, NJ, USA, 2018; 416p. [Google Scholar]
  2. Lambiase, F.; Balle, F.; Blaga, L.-A.; Liu, F.; Amancio-Filho, S.T. Friction-based processes for hybrid multi-material joining. Comp. Struct. 2021, 266, 113828. [Google Scholar] [CrossRef]
  3. Amancio-Filho, S.T.; dos Santos, J.F. European Patent 2329905B1, 30 May 2012.
  4. Amancio-Filho, S.T.; Bueno, C.; dos Santos, J.F.; Huber, N.; Hage, E. On the Feasibility of Friction Spot Joining in Magnesium/Fiber-Reinforced Polymer Composite Hybrid Structures. Mater. Sci. Eng. A 2011, 528, 3841–3848. [Google Scholar] [CrossRef] [Green Version]
  5. Goushegir, S.M.; dos Santos, J.F.; Amancio-Filho, S.T. Friction Spot Joining of Aluminum AA2024/Carbon-Fiber Reinforced Poly(Phenylene Sulfide) Composite Single Lap Joints: Microstructure and Mechanical Performance. Mater. Des. 2014, 54, 196–206. [Google Scholar] [CrossRef]
  6. Goushegir, S.M. Friction Spot Joining (FSpJ) of Aluminum-CFRP Hybrid Structures. Weld. World 2016, 60, 1073–1093. [Google Scholar] [CrossRef] [Green Version]
  7. André, N.M.; dos Santos, J.F.; Amancio-Filho, S.T. Evaluation of Joint Formation and Mechanical Performance of the AA7075-T6/CFRP Spot Joints Produced by Frictional Heat. Materials 2019, 12, 891. [Google Scholar] [CrossRef] [PubMed] [Green Version]
  8. André, N.M.; Goushegir, S.M.; dos Santos, J.F.; Canto, L.B.; Amancio-Filho, S.T. Friction Spot Joining of Aluminum Alloy 2024-T3 and Carbon-Fiber-Reinforced Poly(Phenylene Sulfide) Laminate with Additional PPS Film Interlayer: Microstructure, Mechanical Strength and Failure Mechanisms. Compos. Part B Eng. 2016, 94, 197–208. [Google Scholar] [CrossRef]
  9. Esteves, J.V.; Goushegir, S.M.; dos Santos, J.F.; Canto, L.B.; Hage, E.; Amancio-Filho, S.T. Friction Spot Joining of Aluminum AA6181-T4 and Carbon Fiber-Reinforced Poly(Phenylene Sulfide): Effects of Process Parameters on the Microstructure and Mechanical Strength. Mater. Des. 2015, 66, 437–445. [Google Scholar] [CrossRef] [Green Version]
  10. Goushegir, S.M.; dos Santos, J.F.; Amancio-Filho, S.T. Failure and Fracture Micro-Mechanisms in Metal-Composite Single Lap Joints Produced by Welding-Based Joining Techniques. Compos. Part A Appl. Sci. Manuf. 2016, 81, 121–128. [Google Scholar] [CrossRef] [Green Version]
  11. Chaves, F.J.P.; da Silva, L.F.M.; de Moura, M.F.S.F.; Dillard, D.A.; Esteves, V.H.C. Fracture Mechanics Tests in Adhesively Bonded Joints: A Literature Review. J. Adhes. 2014, 90, 955–992. [Google Scholar] [CrossRef]
  12. Allix, O.; Corigliano, A. Modeling and Simulation of Crack Propagation in Mixed-Modes Interlaminar Fracture Specimens. Int. J. Fract. 1996, 77, 111–140. [Google Scholar] [CrossRef]
  13. de Moura, M.F.S.F.; Gonçalves, J.P.M. Cohesive Zone Model for High-Cycle Fatigue of Composite Bonded Joints under Mixed-Mode I+II Loading. Eng. Fract. Mech. 2015, 140, 31–42. [Google Scholar] [CrossRef]
  14. Chen, J. Predicting Progressive Delamination of Stiffened Fibre-Composite Panel and Repaired Sandwich Panel by Decohesion Models. J. Thermoplast. Compos. Mater. 2002, 15, 429–442. [Google Scholar] [CrossRef]
  15. Chandra, N.; Li, H.; Shet, C.; Ghonem, H. Some Issues in the Application of Cohesive Zone Models for Metal-Ceramic Interfaces. Int. J. Solids Struct. 2002, 39, 2827–2855. [Google Scholar] [CrossRef]
  16. Schellekens, J.C.J.; de Borst, R. A Non-Linear Finite Element Approach for the Analysis of Mode-I Free Edge Delamination in Composites. Int. J. Solids Struct. 1993, 30, 1239–1253. [Google Scholar] [CrossRef] [Green Version]
  17. de Moura, M.F.S.F.; Gonçalves, J.P.M.; Magalhães, A.G. A Straightforward Method to Obtain the Cohesive Laws of Bonded Joints under Mode i Loading. Int. J. Adhes. Adhes. 2012, 39, 54–59. [Google Scholar] [CrossRef] [Green Version]
  18. Sørensen, B.F. Cohesive Law and Notch Sensitivity of Adhesive Joints. Acta Mater. 2002, 50, 1053–1061. [Google Scholar] [CrossRef]
  19. Yang, Q.D.; Thouless, M.D.; Ward, S.M. Numerical Simulations of Adhesively-Bonded Beams Failing with Extensive Plastic Deformation. J. Mech. Phys. Solids 1999, 47, 1337–1353. [Google Scholar] [CrossRef]
  20. Xu, X.P.; Needleman, A. Numerical Simulations of Fast Crack Growth in Brittle Solids. J. Mech. Phys. Solids 1994, 42, 1397–1434. [Google Scholar] [CrossRef]
  21. Moura, M.F.S.F.D.; Gonçalves, J.P.M.; Marques, A.T.; Castro, P.M.S.T.D. Prediction of Compressive Strength of Carbon-Epoxy Laminates Containing Delamination by Using a Mixed-Mode Damage Model. Compos. Struct. 2000, 50, 151–157. [Google Scholar] [CrossRef]
  22. Turon, A.; Costa, J.; Camanho, P.P.; Dávila, C.G. Simulation of Delamination in Composites under High-Cycle Fatigue. Compos. Part A Appl. Sci. Manuf. 2007, 38, 2270–2282. [Google Scholar] [CrossRef]
  23. Schellekens, J.C.J. Computational Strategies for Composite Structures. Ph.D. Thesis, TU Delft, Delft, The Netherlands, 1992. Available online: http://resolver.tudelft.nl/uuid:ecc16ece-34b5-4df3-90aa-83f8e8bc31a7 (accessed on 2 August 2022).
  24. Allix, O.; Ladevèze, P. Interlaminar Interface Modelling for the Prediction of Delamination. Compos. Struct. 1992, 22, 235–242. [Google Scholar] [CrossRef]
  25. Davis, J. Aluminum and Aluminum Alloys; ASM International: Materials Park, OH, USA, 1993. [Google Scholar]
  26. American Society for Metals Metals Handbook; American Society for Metals: Metals Park, OH, USA, 1981; Volume 2.
  27. Aluminium Alloy 2024-T3 Technical Datasheet; Constellium: Paris, France, 2012.
  28. Tencate Advanced Composites. CETEX® PPS Tech Datasheet and Guidelines. Available online: https://www.toraytac.com/media/221a4fcf-6a4d-49f3-837f-9d85c3c34f74/smphpw/TAC/Documents/Data_sheets/Thermoplastic/UD%20tapes,%20prepregs%20and%20laminates/Toray-Cetex-TC1100_PPS_PDS.pdf (accessed on 2 August 2022).
  29. André, N.M.; Goushegir, S.M.; Scharnagl, N.; dos Santos, J.F.; Canto, L.B.; Amancio-Filho, S.T. Composite Surface Pre-Treatments: Improvement on Adhesion Mechanisms and Mechanical Performance of Metal–Composite Friction Spot Joints with Additional Film Interlayer. J. Adhes. 2018, 94, 723–742. [Google Scholar] [CrossRef]
  30. Goushegir, S.M.; dos Santos, J.F.; Amancio-Filho, S.T. Influence of Aluminum Surface Pre-Treatments on the Bonding Mechanisms and Mechanical Performance of Metal-Composite Single-Lap Joints. Weld. World 2017, 61, 1099–1115. [Google Scholar] [CrossRef]
  31. Abaqus v. 6.14-1 software documentation, under License for Helmholtz-Zentrum Hereon (Formerly Helmholtz-Zentrum Geesthacht GmbH), Germany. Available online: http://130.149.89.49:2080/v6.14/ (accessed on 2 August 2022).
  32. Cui, W.; Wisnom, M.R. A Combined Stress-Based and Fracture-Mechanics-Based Model for Predicting Delamination in Composites. Composites 1993, 24, 467–474. [Google Scholar] [CrossRef]
  33. Needleman, A. A Continuum Model for Void Nucleation by Inclusion Debonding. J. Appl. Mech. 1987, 54, 525. [Google Scholar] [CrossRef]
  34. Chen, J.L.; Crisfield, M.; Kinloch, A.J.; Busso, E.P.; Matthews, F.L.; Qiu, Y. Predicting Progressive Delamination of Composite Material Specimens via Interface Elements. Mech. Compos. Mater. Struct. 1999, 6, 301–317. [Google Scholar] [CrossRef]
  35. Mi, Y.; Crisfield, M.A.; Davies, G.A.O.; Hellweg, H.B. Progressive Delamination Using Interface Elements. J. Compos. Mater. 1998, 32, 1246–1272. [Google Scholar] [CrossRef]
  36. Tvergaard, V.; Hutchinson, J.W. The Relation between Crack Growth Resistance and Fracture Process Parameters in Elastic-Plastic Solids. J. Mech. Phys. Solids 1992, 40, 1377–1397. [Google Scholar] [CrossRef]
  37. Barenblatt, G.I. The Mathematical Theory of Equilibrium Cracks in Brittle Fracture. Adv. App. Mech. 1962, 7, 55–129. [Google Scholar]
  38. McCarthy, C.T.; Gray, P.J. An Analytical Model for the Prediction of Load Distribution in Highly Torqued Multi-Bolt Composite Joints. Compos. Struct. 2011, 93, 287–298. [Google Scholar] [CrossRef]
  39. Ireman, T. Three-Dimensional Stress Analysis of Bolted Single-Lap Composite Joints. Compos. Struct. 1998, 43, 195–216. [Google Scholar] [CrossRef]
  40. McCarthy, M.A.; McCarthy, C.T.; Padhi, G.S. A Simple Method for Determining the Effects of Bolt-Hole Clearance on Load Distribution in Single-Column Multi-Bolt Composite Joints. Compos. Struct. 2006, 73, 78–87. [Google Scholar] [CrossRef]
  41. Egan, B.; McCarthy, C.T.; McCarthy, M.A.; Frizzell, R.M. Stress Analysis of Single-Bolt, Single-Lap, Countersunk Composite Joints with Variable Bolt-Hole Clearance. Compos. Struct. 2012, 94, 1038–1051. [Google Scholar] [CrossRef] [Green Version]
  42. Ekh, J.; Schön, J. Effect of Secondary Bending on Strength Prediction of Composite, Single Shear Lap Joints. Compos. Sci. Technol. 2005, 65, 953–965. [Google Scholar] [CrossRef]
  43. Yeh, H.-Y. Mixed Mode Fracture Analysis of the Lap Shear Specimen Test Per ASTM D1002. J. Reinf. Plast. Compos. 2005, 24, 839–853. [Google Scholar] [CrossRef]
  44. Lee, H.K.; Pyo, S.H.; Kim, B.R. On Joint Strengths, Peel Stresses and Failure Modes in Adhesively Bonded Double-Strap and Supported Single-Lap GFRP Joints. Compos. Struct. 2009, 87, 44–54. [Google Scholar] [CrossRef]
  45. da Silva, L.F.M.; das Neves, P.J.C.; Adams, R.D.; Wang, A.; Spelt, J.K. Analytical Models of Adhesively Bonded Joints-Part II: Comparative Study. Int. J. Adhes. Adhes. 2009, 29, 331–341. [Google Scholar] [CrossRef]
  46. da Silva, L.F.M.; das Neves, P.J.C.; Adams, R.D.; Spelt, J.K. Analytical Models of Adhesively Bonded Joints-Part I: Literature Survey. Int. J. Adhes. Adhes. 2009, 29, 319–330. [Google Scholar] [CrossRef]
  47. André, N.M.; Bouali, A.; Maawad, E.; Staron, P.; do Santos, J.F.; Zheludkevich, M.L.; Amancio-Filho, S.T. Corrosion Behavior of Metal–Composite Hybrid Joints: Influence of Precipitation State and Bonding Zones. Corros. Sci. 2019, 158, 108075. [Google Scholar] [CrossRef]
  48. Hiss, R.; Hobeika, S.; Lynn, C.; Strobl, G. Network Stretching, Slip Processes, and Fragmentation of Crystallites during Uniaxial Drawing of Polyethylene and Related Copolymers. A Comparative Study. Macromolecules 1999, 32, 4390–4403. [Google Scholar] [CrossRef]
  49. Maes, D.; Groeninckx, G.; Ravenstijn, J.; Aerts, L. A Molecular Model for Structural Changes during Shear Yielding and Crazing in Amorphous Polymers. Polym. Bull. 1986, 16, 363–370. [Google Scholar] [CrossRef]
  50. Haward, R.N. Strain Hardening of Thermoplastics. Macromolecules 1993, 26, 5860–5869. [Google Scholar] [CrossRef]
  51. Liu, A.F. Mechanics and Mechanisms of Fracture: An Introduction; ASM International: Materials Park, OH, USA, 2005. [Google Scholar]
  52. Canevarolo, S.V., Jr. Ciência Dos Polímeros. 2°. Edição; Artliber: São Paulo, Brazil, 2006. [Google Scholar]
  53. Goushegir, S.M.; dos Santos, J.F.; Amancio-Filho, S.T. Fatigue Performance of Metal–Composite Friction Spot Joints. Materials 2021, 14, 4516. [Google Scholar] [CrossRef] [PubMed]
Figure 1. Configuration and dimensions of the joints (in mm).
Metals 12 02080 g001
Figure 2. (A) Tool used in this work (dimensions in mm). (B) Steps of the FSpJ process: (a) positioning of parts and tool, (b) plunging of the sleeve and plasticization of the metal, (c) refilling of the keyhole, and (d) joint consolidation (Adapted with permission from ref. [30]. 2017 Copyright Springer Nature).
Metals 12 02080 g002
Figure 3. (A) Typical fracture surface of friction spot joints and (B) discretized bonding zones and nub geometry on the surface of the aluminum part for the finite element model.
Metals 12 02080 g003
Figure 4. Cross-sections showing the nub geometry of (A) a real friction spot joint and (B) the joint in the finite element model.
Metals 12 02080 g004
Figure 5. Force–displacement curves obtained from lap shear tests and the finite element model.
Metals 12 02080 g005
Figure 6. Shear stress profile at the interface (aluminum surface) and through the cross-section of the joint during loading. (A) 0 N, (B) 500 N, (C) 1500 N, (D) 2500 N, (E) 3000 N, (F) 3500 N, and (G) 4000 N.
Metals 12 02080 g006
Figure 7. Damage evolution at the interface of the joints during shear loading. (A) 0 N, (B) 30 N, (C) 150 N, (D) 500 N, (E) 750 N, (F) 1500 N, (G) 2500 N, (H) 3000 N, (I) 3500 N, and (J) 4000 N.
Metals 12 02080 g007
Figure 8. Prediction of the influence of the bonding zones and the metallic nub in the mechanical behavior of friction spot joints using FEM.
Metals 12 02080 g008
Figure 9. (A) Hysteresis curves for shear loading and unloading of friction spot joints. (B) Detail of (A) for the load levels 500 N, 1000 N and 1500 N.
Metals 12 02080 g009
Figure 10. (A) Typical fracture surface of a friction spot joint showing details of AZ. (B) Featureless fracture surface of the polymer layer in AZ. (C) Detachment of the borders of the polymer layer in AZ. (D) Signs of plastic deformation at the borders of the polymer layer in AZ.
Metals 12 02080 g010
Figure 11. (A) Typical fracture surface of a friction spot joint showing details of the PDZ. (B) Plastic deformation of PPS in a matrix-rich area in the PDZ. (C) Fibrils of PPS in the PDZ. (D) Plastic deformation of the PPS matrix around the fibers.
Metals 12 02080 g011
Figure 12. Detail of Figure 9A showing the devolution of the initial stiffness of the joint in accordance with the loading steps. The joint failed during the load step of 3500 N.
Metals 12 02080 g012
Figure 13. Four stages of the failure theory proposed by Goushegir et al. for friction spot joints (Reproduced with permission from ref. [10], 2016, Elsevier).
Metals 12 02080 g013
Figure 14. Proposal of failure theory for friction spot joints based on the new findings of this study.
Metals 12 02080 g014
Table 1. Nominal chemical composition of AA2024-T3.
ElementCuMgMnFeZnSiTiCrAl
Wt%4.551.490.450.170.160.100.02<0.01Bal.
Table 2. Selected physical and mechanical properties of AA2024-T3; data from [27].
PropertyValue
Tensile Strength (TL direction) [MPa]437
Yield Strength (TL direction) [MPa]299
Tensile Modulus [GPa]73
Shear Modulus [GPa]28
Incipient Melting Temperature [°C]502
Density [g·cm−3]2.78
Poisson Ratio0.33
Table 3. Selected physical and mechanical properties of the CF-PPS; data from [28].
PropertyValue
Tensile Strength (warp/weft) [MPa]790/750
In-Plane Shear Strength [MPa]119
Tensile Modulus [GPa]53
Flexural Modulus (warp/weft)60/45
Glass Transition Temperature [°C]120
Melting Temperature [°C]280
Density [g·cm−3]1.35
Poisson Ratio0.2
Table 4. Cohesive stiffness coefficients used as input to model the different bonding zones of the joints in this work.
Bonding ZoneKnn [N·m−1]Kss [N·m−1]Ktt [N·m−1]
AZ106107105
PDZ3.6 × 10103.6 × 10113.6 × 109
Table 5. Displacements for initiation and completion of damage in the bonding zones of the joint in this model.
Bonding ZoneInitiation—δ nn, ss, tt [mm] Complete Failure—δmax [mm]
AZ10−30.10
PDZ0.080.62
Table 6. Damage evolution rate of the bonding zones of the friction.
Bonding ZoneDamage Initiation [N]Complete Failure [N]Damage Evolution Rate [% N−1 of Applied Force]
AZ297260.14
PDZ153240610.04
Publisher’s Note: MDPI stays neutral with regard to jurisdictional claims in published maps and institutional affiliations.

