

Numerical and Experimental Studies on the Load Characteristics of Geometric Interference of Steel-Aluminum Knurled Interference Fit


Abstract
1. Introduction
2. Methodology and Materials of the Experiment
2.1. Design Parameters and Jointing Process
- KIF area diameter of shaft D1;
- The height of shaft H1;
- Shaft height of the other sections H2, H3, H4;
- Shaft diameter D2;
- Shaft chamfer angle φ;
- Outer diameter of hub DoH;
- Inner diameter of hub DiH;
- pitch t;
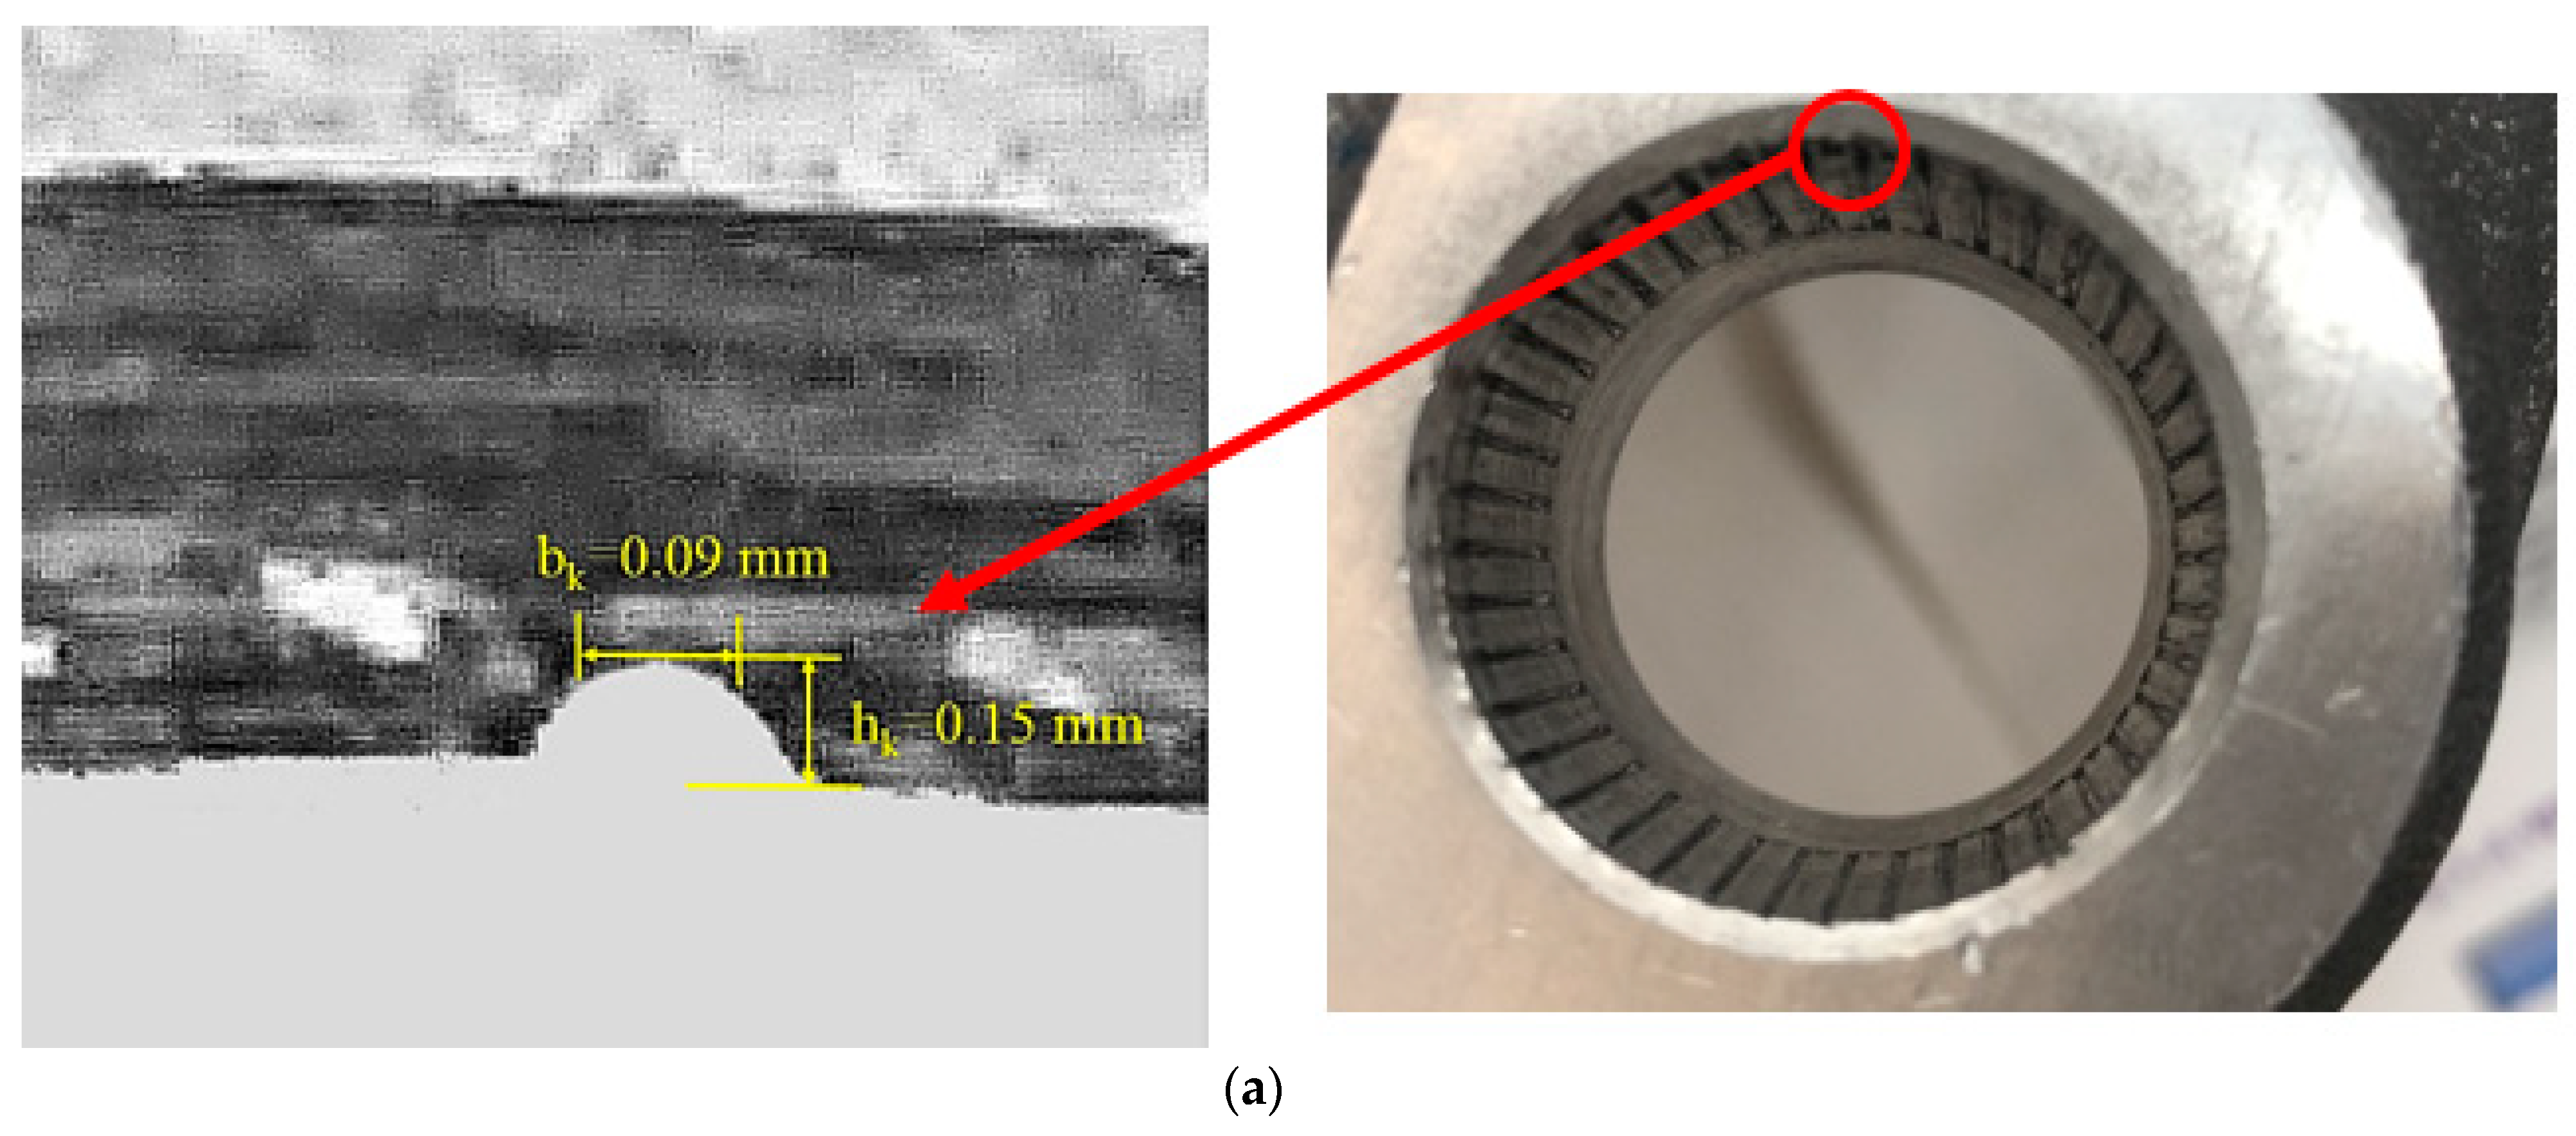
- Tooth height Hk.

2.2. Shaft Design and Dimensions of Hubs
3. Finite Element Method (FEM) Model and Experimental Validation
4. Results and Discussion
5. Conclusions
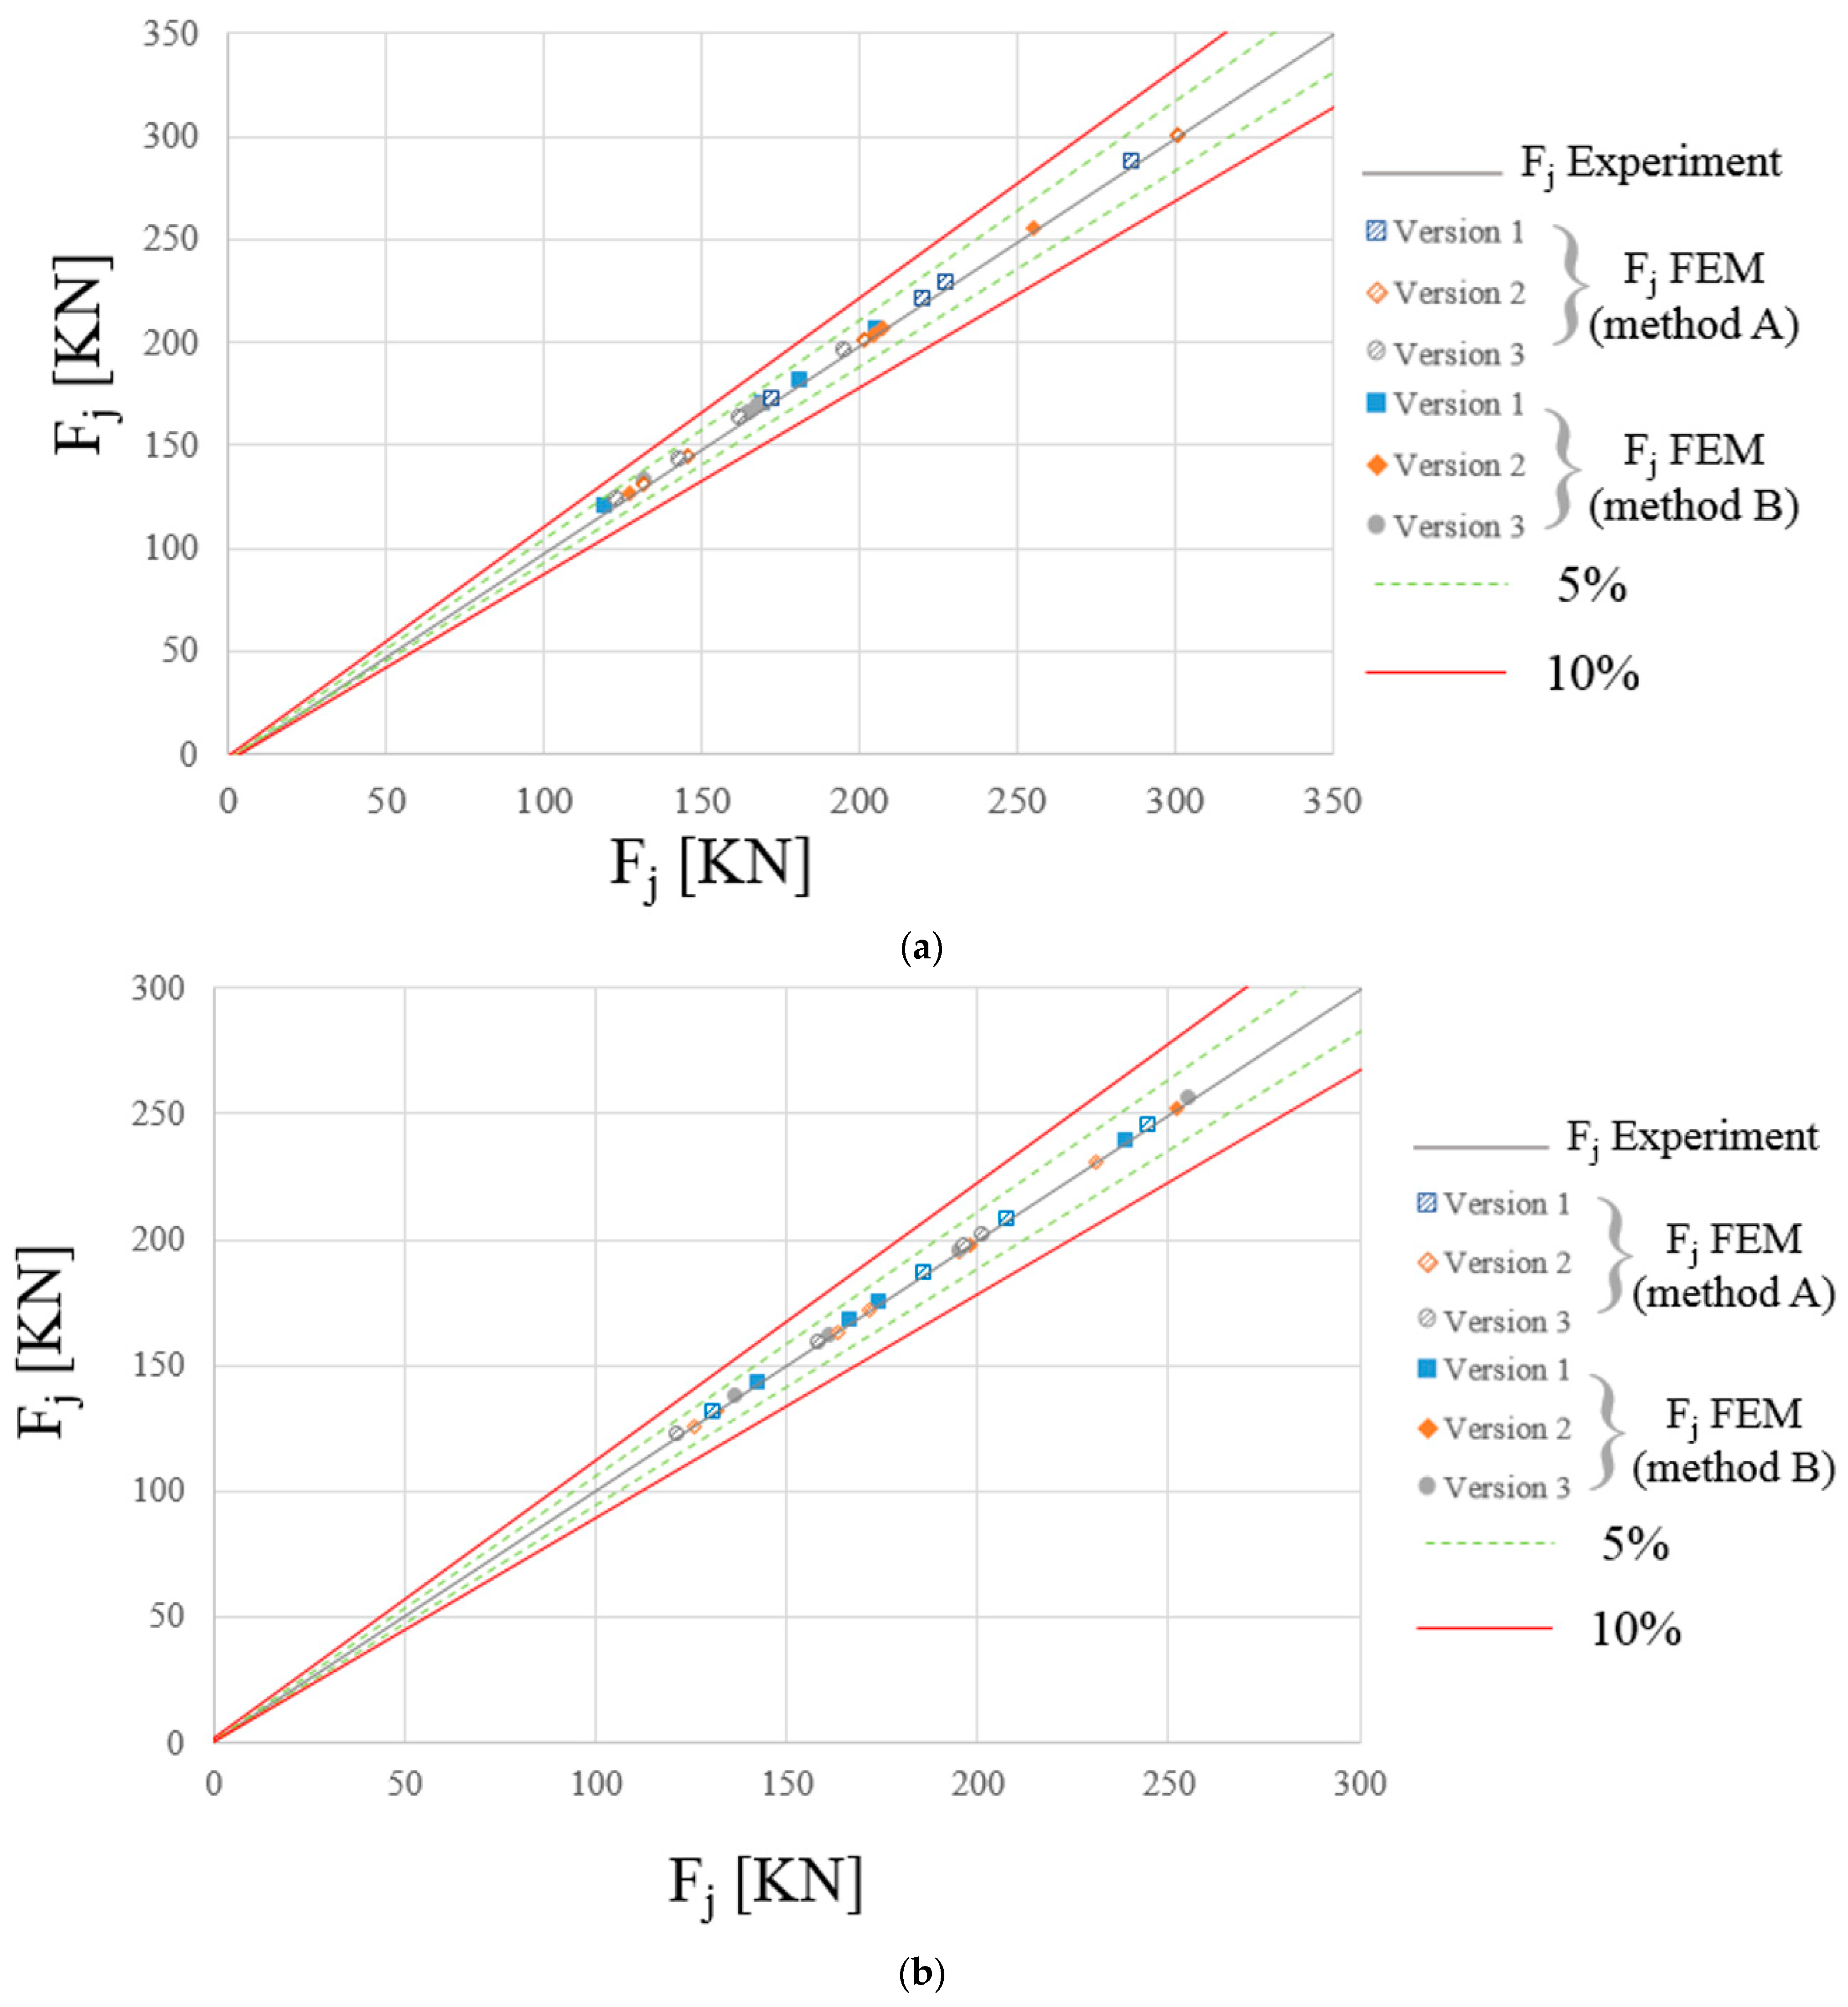
- The average deviations of the two finite element simulation methods proposed in this study were less than ±5% in the jointing force in comparison with the experiment, indicating that the finite element method can be accurately applied in the experimental analysis of KIF.
- According to the statistics of the jointing force data and the hoop deformation analysis, the thickness of the hub has little effect on the KIF jointing force and hoop dimension; there is no absolute correlation between the two.
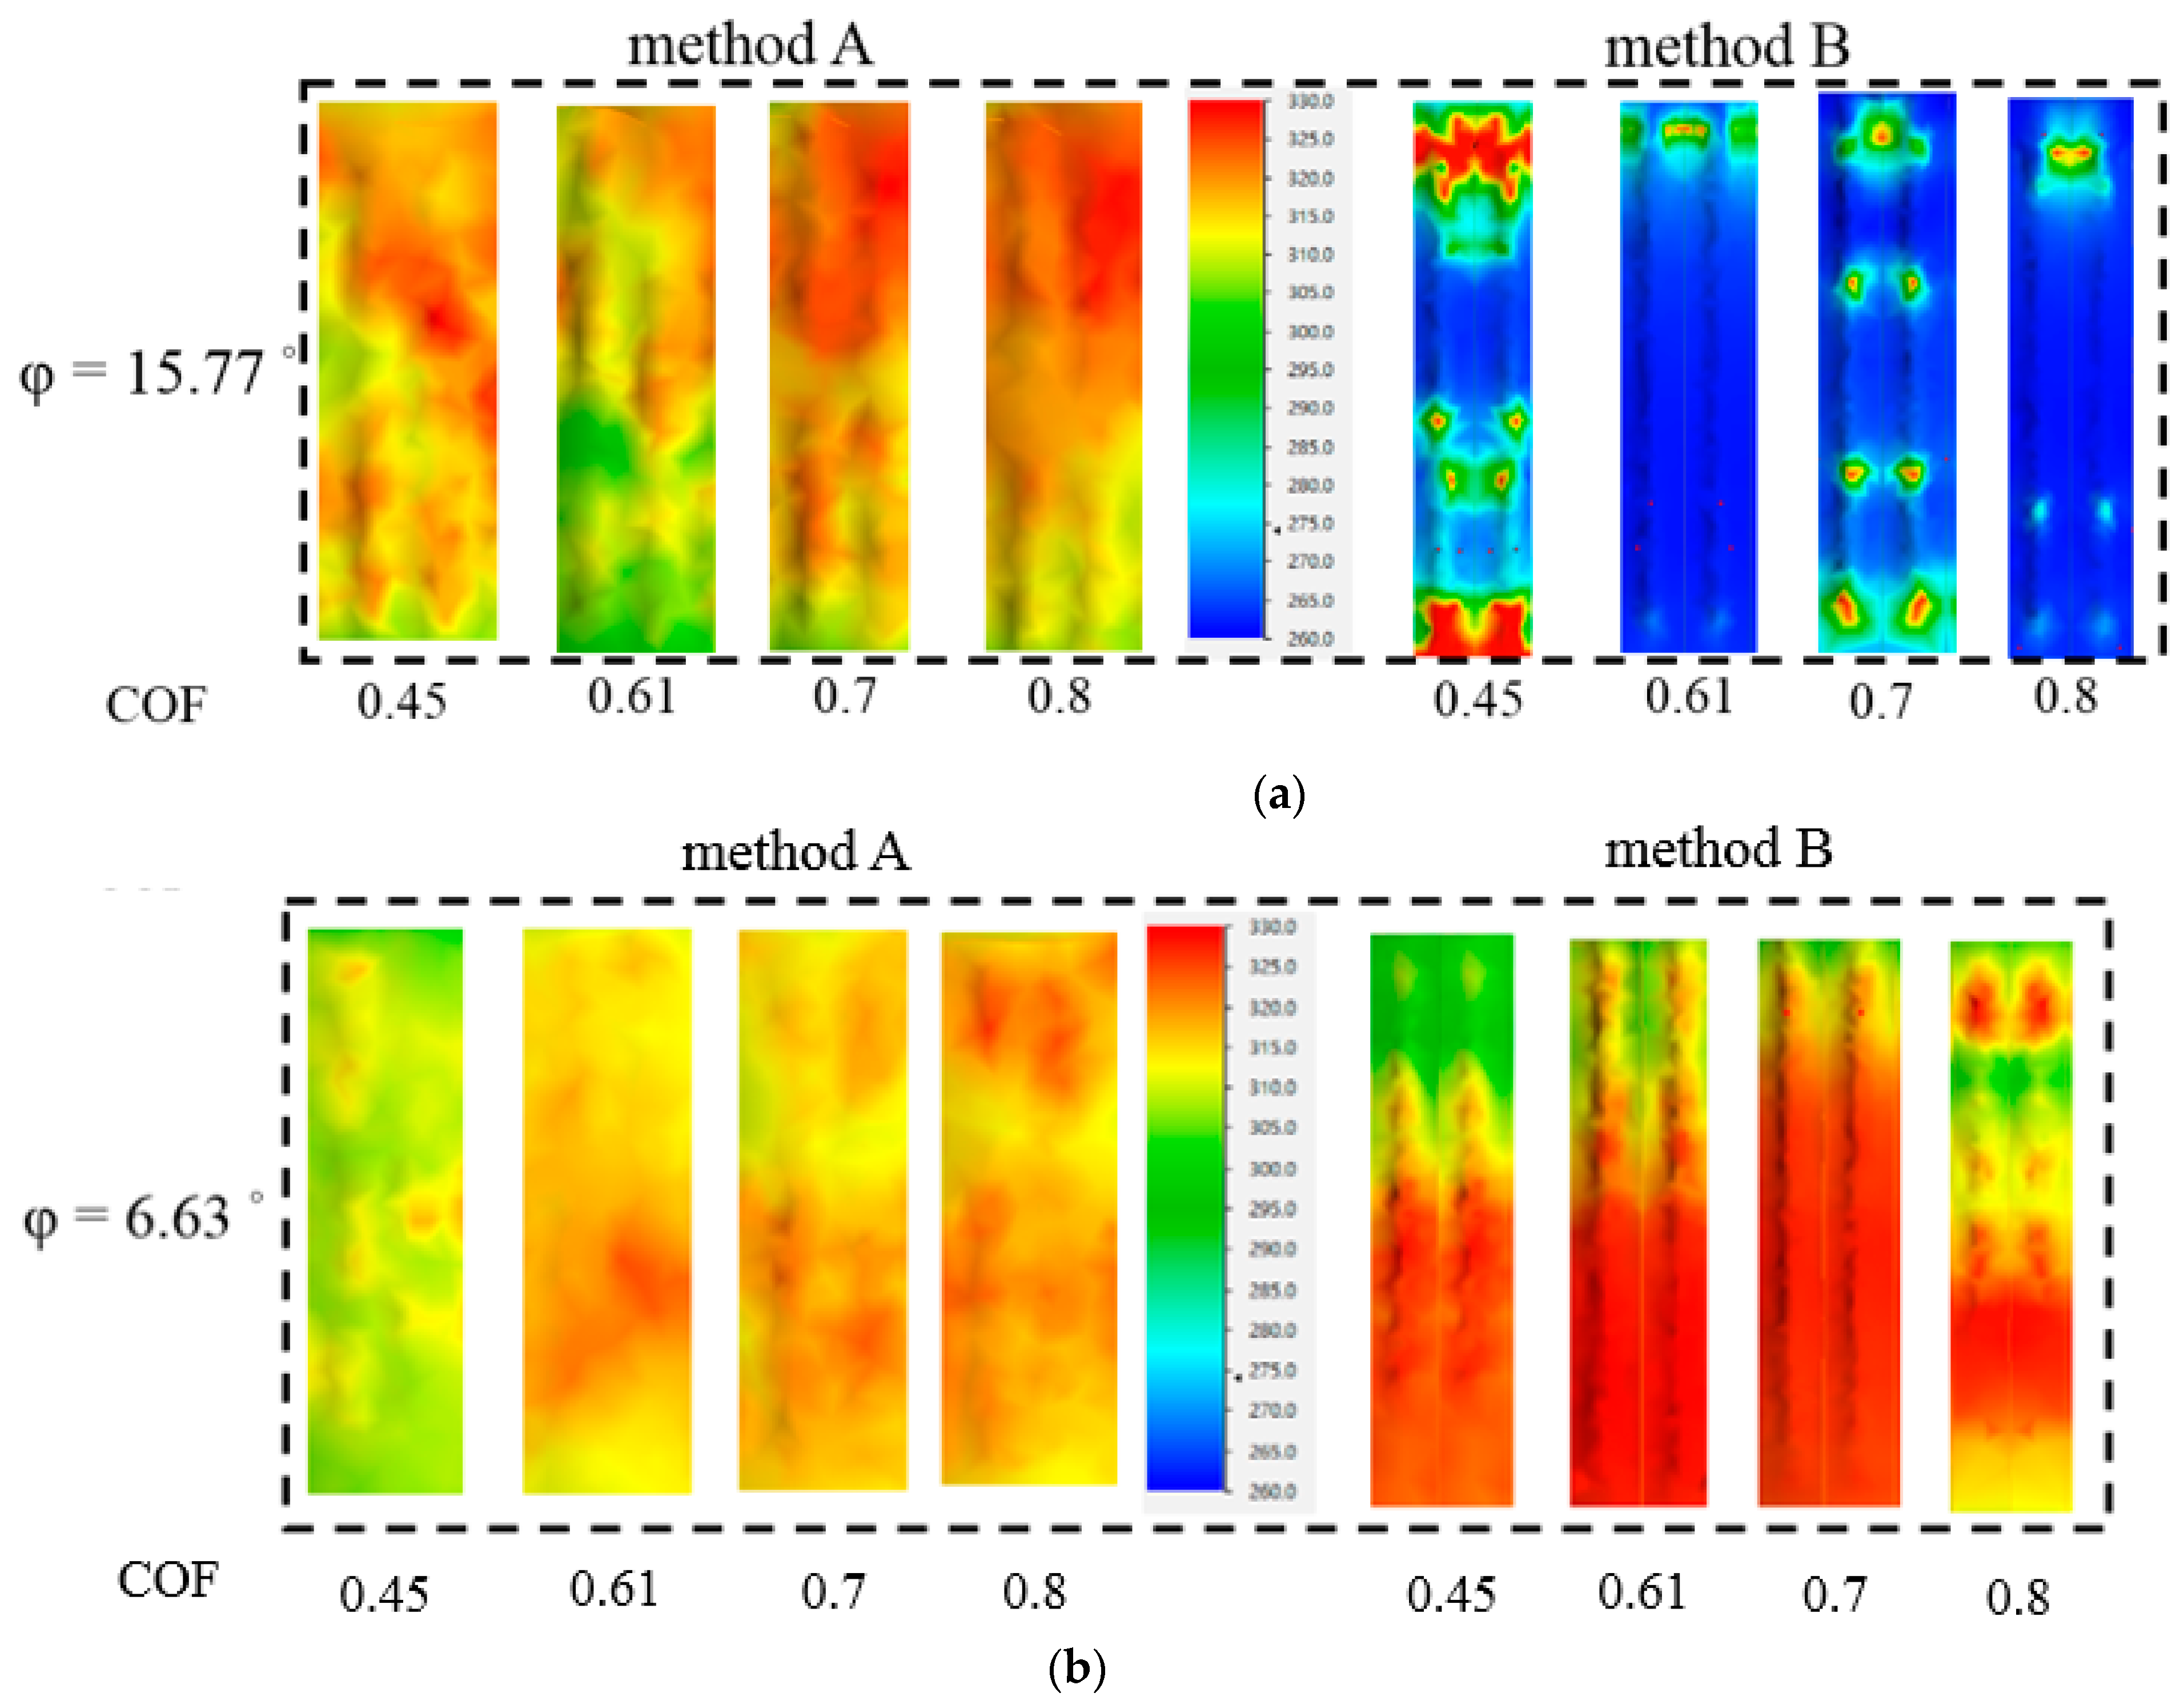
- The shaft design of version 3 had the lowest jointing force (156~158 KN) and the smallest error in the simulated and experimental data, meaning version 3 was the best shaft design in this study. The shaft design of version 3 has a smaller chamfer angle (6.63°) than the shaft design of version 1, which can reduce the KIF engagement force and manufacturing cost.
- According to the comparative analysis of the jointing force and the tooth profile of different shaft designs, the error between the jointing force of the simulation and the experimental value was smallest in method B (mean ratio of joining force accuracy was more than 97%), and the average value of the tooth profile difference was higher (average height accuracy was more than 99%), which means simulation method B should be selected as the best simulation method. The results show that in the finite element simulation method, for the analysis of small deformation, the mesh size in simulation analysis will greatly affect the accuracy of the analysis results.
- By comparing the jointing force values of different shaft designs, it was found that the jointing force was proportional to the COF value. Therefore, to improve the torque force of the KIF structure, process conditions with a larger COF value should be selected. However, if the COF value is too high, it is easy to cause an excessive jointing force and increase the manufacturing cost. Therefore, a moderate COF value should be selected. A COF of 0.61 is the best friction coefficient value observed in this study.
Author Contributions
Funding
Institutional Review Board Statement
Informed Consent Statement
Data Availability Statement
Conflicts of Interest
References
- Deng, L.; Xia, J.; Wang, X. Precision Forging Technology and Equipment for Aluminum Alloy, 1st ed.; The Gateway; Springer: Singapore, 2022; pp. 11–40. [Google Scholar]
- Panwar, N.; Chauhan, A.; Pali, H.S.; Sharma, M.D. Fabrication of aluminum 6061 red-mud composite using stir casting and micro structure observation. Mater. Today Proc. 2020, 21, 2014–2023. [Google Scholar] [CrossRef]
- Lee, I.K.; Lee, S.Y.; Lee, S.K.; Jeong, M.S.; Kim, B.J.; Joo, W.G. Study on effect of shapes of serration of joining plane on joining characteristics for the aluminum–steel multi-materials press joining process. Materials 2020, 13, 5611. [Google Scholar] [CrossRef] [PubMed]
- Raj, A.P.; Bhatti, A.; Dhanish, P.B. Combined effect of cylindricity, roundness and roughness on axial load-carrying ability of interference fits. Proc. Inst. Mech. Eng. Part J.-J. Eng. Tribol. 2020, 234, 1697–1711. [Google Scholar] [CrossRef]
- Sohrabpoor, H.; Mousavian, R.T.; O’Halloran, S.; Benyounis, K.Y.; Baraheni, M.; Obeidi, M.A.; Ahad, I.U.; Raghavendra, R.; Brabazon, D. Experimental and empirical model analysis of microsurface texturing on 316 L press-fit joints fabricated by selective laser melting. J. Adv. Manuf. Technol. 2020, 108, 2687–2699. [Google Scholar] [CrossRef]
- Lü, X.; Zhao, J.; Hu, L.; Wang, H. Effect of interference fits on the fatigue lives of bolted composite joints. J. Shanghai Jiaotong Univ. Sci. 2016, 21, 648–654. [Google Scholar] [CrossRef]
- Romanov, A.V.; Shchenyatsky, A.V.; Petrov, A.V. Hydropress assembling automation of interference fits with steel and titanium parts. IOP Conf. Ser. Mater. Sci. Eng. 2020, 971, 042064. [Google Scholar] [CrossRef]
- Obeidi, M.A.; McCarthy, E.; Brabazon, D. Methodology of laser processing for precise control of surface micro-topology. Surf. Coat. Technol. 2016, 307, 702–712. [Google Scholar] [CrossRef]
- Hirot, K.; Kitamura, K.; Ukai, Y.; Matsunaga, K. Mechanical joining of shaft and holed disc in rotational and axial directions. Procedia Eng. 2017, 207, 980–985. [Google Scholar] [CrossRef]
- McMillan, M.D.; Booker, J.D.; Smith, D.J.; Onisa, C.F.; Korsunsky, A.M.; Song, X.; Baimpas, N.; Evans, A. Analysis of increasing torque with recurrent slip in interference-fits. Eng. Fail. Anal. 2016, 62, 58–74. [Google Scholar] [CrossRef]
- Wang, Y.; Lee, S.H. Design and analysis on interference fit in the hardwood dowel-glued Joint by finite element method. Procedia Eng. 2014, 79, 166–172. [Google Scholar] [CrossRef][Green Version]
- Jin, J.S.; Xia, J.C.; Wang, X.Y.; Hu, G.A.; Liu, H. Die design for cold precision forging of bevel gear based on finite element method. J. Cent. South Univ. Technol. 2009, 16, 546–551. [Google Scholar] [CrossRef]
- Seifi, R.; Abbasi, K. Friction coefficient estimation in shaft/bush interference using finite element model updating. Eng. Fail. Anal. 2015, 57, 310–322. [Google Scholar] [CrossRef]
- Lou, Z.; Wang, X.; Wang, Y.; Wang, X.; Xu, C.; Wang, Z. Precision assembly method of a kind of small interference fitting parts. Sādhanā 2019, 44, 144. [Google Scholar] [CrossRef]
- Wang, X.; Lou, Z.; Wang, X.; Xu, C. A new analytical method for press-fit curve prediction of interference fitting parts. J. Mater. Process. Technol. 2017, 250, 16–24. [Google Scholar] [CrossRef]
- Zhang, P.; Kou, S.; Lin, B.; Wang, Y. Optimization for radial knurling connection process of assembled camshaft using response surface method. J. Adv. Manuf. Technol. 2014, 77, 653–661. [Google Scholar] [CrossRef]
- Lanoue, F.; Vadean, A.; Sanschagrin, B. Finite element analysis and contact modelling considerations of interference fits for fretting fatigue strength calculations. Simul. Model. Pract. Theory 2009, 17, 1587–1602. [Google Scholar] [CrossRef]
- Izard, E.; Garcia, R.; Manuel, R.M.; Lorenzo, M. Finite element analysis of the reduction in stress concentration factors in shrink fits by using contact rings. Appl. Sci. 2022, 12, 10037. [Google Scholar] [CrossRef]
- Brake and Front End. Available online: https://www.brakeandfrontend.com/complete-wheel-bearing-service/ (accessed on 30 October 2022).
- Kleditzsch, S.; Awiszus, B.; Lätzer, M.; Leidich, E. Numerical and analytical investigation of steel–aluminum knurled interference fits: Joining process and load characteristics. J. Mater. Process. Technol. 2015, 219, 286–294. [Google Scholar] [CrossRef]
- Ludwik, P. Elemente der Technologischen Mechanik, 1st ed.; Springer: Berlin/Heidelberg, Germany, 1909; pp. 11–35. [Google Scholar]
- SEYI. Available online: https://zh-tw.seyi.com/index.php?s=spec_search&c=search901 (accessed on 30 October 2022).


| AA 6061 (wt%) | Al | Mg | Si | Cu | Mn | Fe | Cr | Zn |
| >97.00 | <0.90 | <0.80 | <0.30 | <0.20 | <0.40 | <0.02 | <0.18 |
| ASTM-H13 (wt%) | C | V | Si | Mn | P | S | Cr |
| 0.32–0.45 | 0.8–1.2 | 0.8–1.2 | 0.2–0.5 | 0 ≤ 0.03 | 0 ≤ 0.03 | 4.75–5.5 |
| Hub Material | AA6061 |
|---|---|
| Hub temperature | 20 °C |
| Shaft material | ASTM-H13 |
| Shaft temperature | 20 °C |
| Coefficient of friction (COF) | 0.45~0.8 |
| Heat transfer coefficient | 0.3 |
| Environment temperature | 20 °C |
| Element style | Tetrahedron |
| Mesh size of blank | 1 mm |
| Mesh size of dies | 1–16 mm |
| Contact definition | Frictional contact |
| Parameter | Version 1 | Version 2 | Version 3 | |||||||||
| Test No. | ||||||||||||
| 1 | 2 | 3 | 4 | 5 | 6 | 7 | 8 | 9 | 10 | 11 | 12 | |
| Shaft chamfer angle ϕ (◦) | 15.77 | 6.63 | ||||||||||
| Shaft diameter Ds (mm) | D1 | D1 ± 0.01 | ||||||||||
| Geometric interference Igeo (mm) | 0.2 | 0.2 ± 0.01 | ||||||||||
| Coefficient of friction (COF) | 0.45 | 0.61 | 0.7 | 0.8 | 0.45 | 0.61 | 0.7 | 0.8 | 0.45 | 0.61 | 0.7 | 0.8 |
| Hub thickness (Dio − DiH) | 10 mm & 15 mm | |||||||||||
| Pitch t (mm) | 1.8 | |||||||||||
| Joining length (mm) | 26 | |||||||||||
| Hub Thickness | Simulation Method A | Mean Ratio of Joining Force Difference (FEM and Experiment) | Simulation Method B | Mean Ratio of Joining Force Difference (FEM and Experiment) | |
|---|---|---|---|---|---|
| Version 1 | 10 mm | 226.88 KN | 78.63% | 169.30 KN | 95.76% |
| 15 mm | 180.92 KN | 180.93 KN | |||
| Version 2 | 10 mm | 194.61 KN | 84.28% | 198.25 KN | 83.17% |
| 15 mm | 194.27 KN | 194.27 KN | |||
| Version 3 | 10 mm | 156.21 KN | 97.72% | 158.90 KN | 96.91% |
| 15 mm | 187.45 KN | 187.45 KN |
| 10 mm | ||||
| POS | D1 | D2 | D3 | D4 |
| COF | ||||
| 0.45 | 24.17 | 24.22 | 23.48 | 23.50 |
| 0.61 | 23.75 | 23.29 | 23.40 | 23.80 |
| 0.7 | 23.55 | 23.65 | 23.39 | 23.39 |
| 0.8 | 23.48 | 24.00 | 23.50 | 24.0 |
| AVG | 23.73 | 23.79 | 23.44 | 23.67 |
| 15 mm | ||||
| POS | D1 | D2 | D3 | D4 |
| COF | ||||
| 0.45 | 24.82 | 23.51 | 23.47 | 23.34 |
| 0.61 | 24.19 | 24.04 | 23.71 | 23.49 |
| 0.7 | 23.61 | 23.48 | 23.43 | 23.43 |
| 0.8 | 23.63 | 24.45 | 24.00 | 23.35 |
| AVG | 24.06 | 23.87 | 23.65 | 23.40 |
| 10 mm | ||||
| POS | D1 | D2 | D3 | D4 |
| COF | ||||
| 0.45 | 23.60 | 23.68 | 23.86 | 23.61 |
| 0.61 | 23.45 | 23.47 | 23.55 | 23.63 |
| 0.7 | 23.44 | 23.47 | 23.55 | 23.63 |
| 0.8 | 23.38 | 23.48 | 23.92 | 24.26 |
| AVG | 23.46 | 23.52 | 23.72 | 23.78 |
| 15 mm | ||||
| POS | D1 | D2 | D3 | D4 |
| COF | ||||
| 0.45 | 23.47 | 23.61 | 23.79 | 23.40 |
| 0.61 | 23.51 | 23.31 | 23.66 | 23.31 |
| 0.7 | 23.39 | 23.31 | 23.39 | 23.22 |
| 0.8 | 23.67 | 23.56 | 23.63 | 23.52 |
| AVG | 23.51 | 23.44 | 23.61 | 23.46 |
Publisher’s Note: MDPI stays neutral with regard to jurisdictional claims in published maps and institutional affiliations. |
© 2022 by the authors. Licensee MDPI, Basel, Switzerland. This article is an open access article distributed under the terms and conditions of the Creative Commons Attribution (CC BY) license (https://creativecommons.org/licenses/by/4.0/).
Share and Cite
Chen, C.-P.; Ho, M.; Li, T.-T.; Fuh, Y.-K. Numerical and Experimental Studies on the Load Characteristics of Geometric Interference of Steel-Aluminum Knurled Interference Fit. Metals 2022, 12, 2078. https://doi.org/10.3390/met12122078
Chen C-P, Ho M, Li T-T, Fuh Y-K. Numerical and Experimental Studies on the Load Characteristics of Geometric Interference of Steel-Aluminum Knurled Interference Fit. Metals. 2022; 12(12):2078. https://doi.org/10.3390/met12122078
Chicago/Turabian StyleChen, Chi-Peng, Marlon Ho, Tomi-T. Li, and Yiin-Kuen Fuh. 2022. "Numerical and Experimental Studies on the Load Characteristics of Geometric Interference of Steel-Aluminum Knurled Interference Fit" Metals 12, no. 12: 2078. https://doi.org/10.3390/met12122078
APA StyleChen, C.-P., Ho, M., Li, T.-T., & Fuh, Y.-K. (2022). Numerical and Experimental Studies on the Load Characteristics of Geometric Interference of Steel-Aluminum Knurled Interference Fit. Metals, 12(12), 2078. https://doi.org/10.3390/met12122078