Article

Experimental Investigation of the Isothermal Section in the Al–Si–Y System at 773 K

1
Guangxi Key Laboratory of Information Materials, School of Material Science and Engineering, Guilin University of Electronic Technology, Guilin 530004, China
2
Guangxi Key Laboratory of Superhard Material, National Engineering Research Center for Special Mineral Material, China Nonferrous Metal (Guilin) Geology and Mining Co., Guilin 541004, China
*
Authors to whom correspondence should be addressed.
Metals 2022, 12(12), 2020; https://doi.org/10.3390/met12122020
Submission received: 24 October 2022 / Revised: 20 November 2022 / Accepted: 22 November 2022 / Published: 25 November 2022
(This article belongs to the Section Computation and Simulation on Metals)

Abstract

:
The phase equilibrium and phase transformation of the Al–Si–Y ternary system were investigated in 80 annealed alloys using an electron probe microanalysis (EPMA), X-ray diffractometry (XRD) and differential scanning calorimetry (DSC). The phase equilibrium at 773 K was determined, and the phase distribution and solid solubility of the Al–Si–Y isothermal section at 773 K were obtained. A total of 23 three-phase zones and 4 two-phase zones were obtained, and 2 new ternary compounds, AlSi4Y5 and Al2Si3Y5, were identified from the non-aluminum-rich corner. Additionally, the phase transition temperatures of representative alloys were determined by the DSC method, and then the phase transition temperatures were processed to obtain the experimental points of vertical sections. In the Al–Si–Y alloy system, the phase diagrams of the vertical sections with X(Al) = 90 at.%, 80 at.%, 70 at.% and 60 at.% at the aluminum-rich corner were calculated, and then the experimental points were inserted into the vertical section phase diagrams. The results of the vertical sectional experiments obtained from the validation experiments are in good agreement with the vertical sectional data obtained from the calculations, indicating that the validated thermodynamic description is useful for the microstructure design of the aluminum-rich corner of the Al–Si–Y ternary alloy.

1. Introduction

Cast Al-Si alloys are ideal for the manufacture of cylinders and pistons and are widely used in the military, automotive and general engineering industries because of their wear resistance, heat resistance, corrosion resistance, low coefficient of thermal expansion and good volume stability and excellent mechanical properties over a wide temperature range [1]. When the metal element Y is added to the Al-Si alloy, a thermal insulation coating is formed on the surface of the alloy, which further improves the wear resistance, heat resistance, corrosion resistance and other properties of the alloy [2]. In recent years, Al–Si–Y alloys have received much attention due to their unique properties. However, there are limited reports on the phase equilibria of alloys in the Al–Si–Y system [3]. In order to improve the performance of Al–Si–Y alloy materials more effectively and to design experiments, knowledge of their accurate phase diagrams and thermodynamic data is required.
The first was Snyder et al. in 1960, who used thermal analysis, X-ray diffraction and metallography to establish the Al-Y binary phase diagram [4], followed by Lundin et al., who used XRD, metallography and early melt observations to study the phase equilibrium of the system and found that the mutual solubility between Al and Y was less than 0.1 wt.%, while some of the published reaction data showed significant differences from the previous ones [5]. Subsequently, Yamishchikov et al. used the electromotive forces (EMF) method to measure the solubility of Y in Al over the temperature range 665–837 °C, and the data obtained were consistent with the liquid phase line proposed by Snyder [6]. It was recently found that Liu et al. investigated the best thermodynamic dataset for the Al-Y binary system by combining the latest published experimental phase diagram data with rigorously evaluated literature data and found that the calculated phase diagrams and thermodynamic properties were in better agreement with the experimental results [7]. The calculated phase diagram of the Al–Y system is shown in Figure 1a.
As for the Si-Y binary system, the Si-Y phase diagram was first constructed by Lundin from four compounds—SiY, Si3Y5, Si4Y5 and Si5Y3—based on the results of X-ray diffraction (XRD) and metallographic analysis [8]. Gokhale et al. systematically evaluated the phase equilibrium and crystal structure in the Si-Y system and first measured the key phase diagram data of the system by means of X-ray diffraction (XRD) and Lundin’s metallographic method [9]. Button et al. reconstructed the Si-Y phase diagram from differential thermal analysis (DTA), metallography, XRD and microhardness measurements, in which the SiY, Si3Y5, Si4Y5 and Si5Y3 phases were stably present. Polotskaya et al. used the electromotive forces (EMF) method to measure the Si-Y compounds using Gibbs’s free energy. A thermodynamic description of the Si-Y binary system based on the available experimental data was carried out by Ran et al. The Si–Y binary system was re-evaluated by Shukla et al. by examining and considering the results of the thermal analysis of Button et al. [10]. Zhang et al. evaluated the Si–Y binary system by considering first-principles phonon calculations and the homogeneity range of the Si2Y and Si3Y5 phases (less than 1.5 at.%), and the system was re-optimized [11].
In the latest study, Xu et al. re-evaluated and optimized the Si–Y binary system by means of CALPHAD (CALculation of PHAse Diagrams) and adjusted some eutectic reaction temperatures to obtain more complete thermodynamic data for the Si–Y binary system [12,13]. The calculated phase diagram of the Si–Y system is shown in Figure 1b. In the Al-Si binary system, the thermodynamic parameters of the Al-Si binary system were extracted and the Al-Si binary phase diagram was obtained using CALPHAD (CALculation of PHAse Diagrams) by Xu et al. [14]. The calculated phase diagram of the Al–Si system is shown in Figure 1c. Moreover, Xu et al. also coupled the thermodynamic databases of the Al–Y, Si–Y and Al–Si binary systems and obtained the complete Al–Si–Y ternary system using the CALPHAD (CALculation of PHAse Diagrams) approach and first-principles calculations [15]. The isothermal sections of the Al–Si–Y ternary system at 773 K obtained by the calculation are shown in Figure 2. The thermodynamic database of the Al–Si–Y ternary system was also partially experimented on in the aluminum-rich corner of the phase diagram of the Al–Si–Y ternary system, and it was found that the phase diagram was in general agreement with the calculated one, thus verifying the thermodynamic data of the Al–Si–Y ternary system.
Therefore, in order to gain a complete understanding of the phase equilibrium and solidification process of the Al–Si–Y ternary alloy system and to provide a basis for further material design of the Al–Si–Y ternary alloy system, this paper will investigate the Al–Si–Y ternary alloy system through experiments and phase diagram calculations. In this work, after literature research on the system, experimental data gaps in the thermodynamics of the non-aluminum-rich corner of the Al–Si–Y ternary system are supplemented, and isothermal sections at a measured temperature of 773 K are determined in conjunction with practical applications. After obtaining the complete phase diagram information, the thermodynamic database of the system is established, and the thermodynamic parameters of the system are optimized, thus laying the experimental basis for the design of high-performance aluminum alloys.

2. Experimental Procedure

First, the elements are weighed using an electronic balance according to the mass of each element designed for the alloy composition, after which the elements are placed in the vacuum melting furnace in an orderly manner [16]. The samples (total weight of each sample is 3 g) are in a pure argon protective atmosphere (argon, an inert gas, does not react chemically with the casting and melting of metals and is also a stable, safe and good barrier to the intrusion of harmful gases, with a relatively low cost. It also rarely use other gases to make protective gas, such as nitrogen; theoretically nitrogen is able to do heat treatment protective gas. If the nitrogen is impure and contains impurities that can generate gaseous substances with carbon, it will react with carbon to generate gaseous substances into the furnace gas and decarbonize, such as CO, CO2, CH4, etc., which increases the possibility of decarbonization, and nitrogen is unstable under high temperatures. Hydrogen is flammable and cannot be used as a protective gas.), and the ternary alloy of aluminum, silicon and yttrium was prepared by arc melting on a water-cooled copper furnace with a non-consumable tungsten electrode in an argon-arc furnace (WKDHL-I, Opto-electronics Co. Ltd., Guilin, China) [17]. The alloy melted in this work contains rare-earth elements that are prone to oxidation, so three high-purity argon gas washes are required, followed by vacuum pumping inside the melting furnace to 3.0 × 10⁻³ Pa. After the vacuum level is reached, high-purity argon gas is flushed in, and the melting of the sample begins again. In order to make the sample homogeneous as a whole, the sample is melted four times on both sides. The starting materials for the synthesis of these alloys were high-purity commercial metals (Al 99.99 wt.%, Si 99.99 wt.%, Y 99.99 wt.%). A total of 80 alloy samples were prepared, each with less than 1% weight lost after melting [18]. The compositions, heat treatment methods and analytical methods of all alloys are shown in Table 1.
The cast alloy samples were sealed in quartz tubes, which were then placed in a tube furnace and annealed with the annealing furnace setting program. The samples were annealed at 500 °C for 6 weeks to obtain the best homogenization and quenched in an ice–water mixture directly after annealing, and then placed in liquid nitrogen to maintain their high-temperature phase. Afterwards, 1 g of each sample was ground into an agate mortar and sieved through a 300-mesh sieve. Finally, all sample buttons were powdered and examined by XRD on a Rigaku D/Max 2500 V diffractometer using Cu Ka radiation and working on a 40 kV, 200 mA graphite monochromator [19]. After the measurements were completed, phase analysis was performed using the material data software Jade 6.0 and powder diffraction files and plotted using Origin. The three phase zones were established primarily by studying XRD results for at least three alloys in each zone [20].
For this experiment, optical microscopy was chosen to examine metallographic samples of the alloy in the cast or annealed condition, followed by scanning electron microscopy (SEM)/back-scattered electron image (BSE) (JXA-8530, JEOL, Tokyo, Japan) of pure Al (99.99 wt.%), Si (99.99 wt.%) and Y (99.99 wt.%) and an electron probe microanalyzer (EPMA) (JXA-8230 JEOL, Tokyo, Japan) [21,22]. Its analytical accuracy is better than 1% and spatial resolution is greater than 0.1 μm, and the maximum magnification is 300,000 times. EPMA measurements were analyzed at 15 kV and 4 × 10⁻⁹ A [23]. Quantitative analysis (EPMA-WDS, using the standard sample method) was carried out by EPMA, and definitive phase analysis was carried out by XRD. The solid solution of elements can be determined by combining EPMA and XRD, i.e., EPMA determines the atomic percentage of each element in a phase, while XRD performs a fixed-phase analysis of the phase. This allows the determination of the solid solubility of an element in this phase and thus the solid solubility interval of the phase. Eventually, the solid solution interval and phase zone distribution are determined.
Finally, the phase transition temperatures on the annealed No.1–44 alloy samples (20 mg taken from each alloy sample) were measured by differential scanning calorimetry (DSC) (DSC404C, Netzsch, Berlin, Germany). The measurements were performed between room temperature and 1400 °C with a heating and cooling rate of 5 K/min in an argon atmosphere, using a Pt-Pt/Rh thermocouple. The accuracy of the temperature measurements was estimated by measuring the melting temperatures of some pure metals (In, Sn, Zn, Al, Ag, Au, Bi, Ni) in the tested temperature range to ± 2 K. The constant temperatures were determined from the beginning of the heating phase and the thermal effect of the cooling phase and were determined from the average value of the heating curve. By obtaining the phase equilibrium data and phase change temperatures obtained from the DSC, finally, the calculated results were compared with the experimental results [24]. By these methods, the phase diagram of the Al–Si–Y ternary system at 773 K was determined, and an accurate phase zone distribution was obtained.

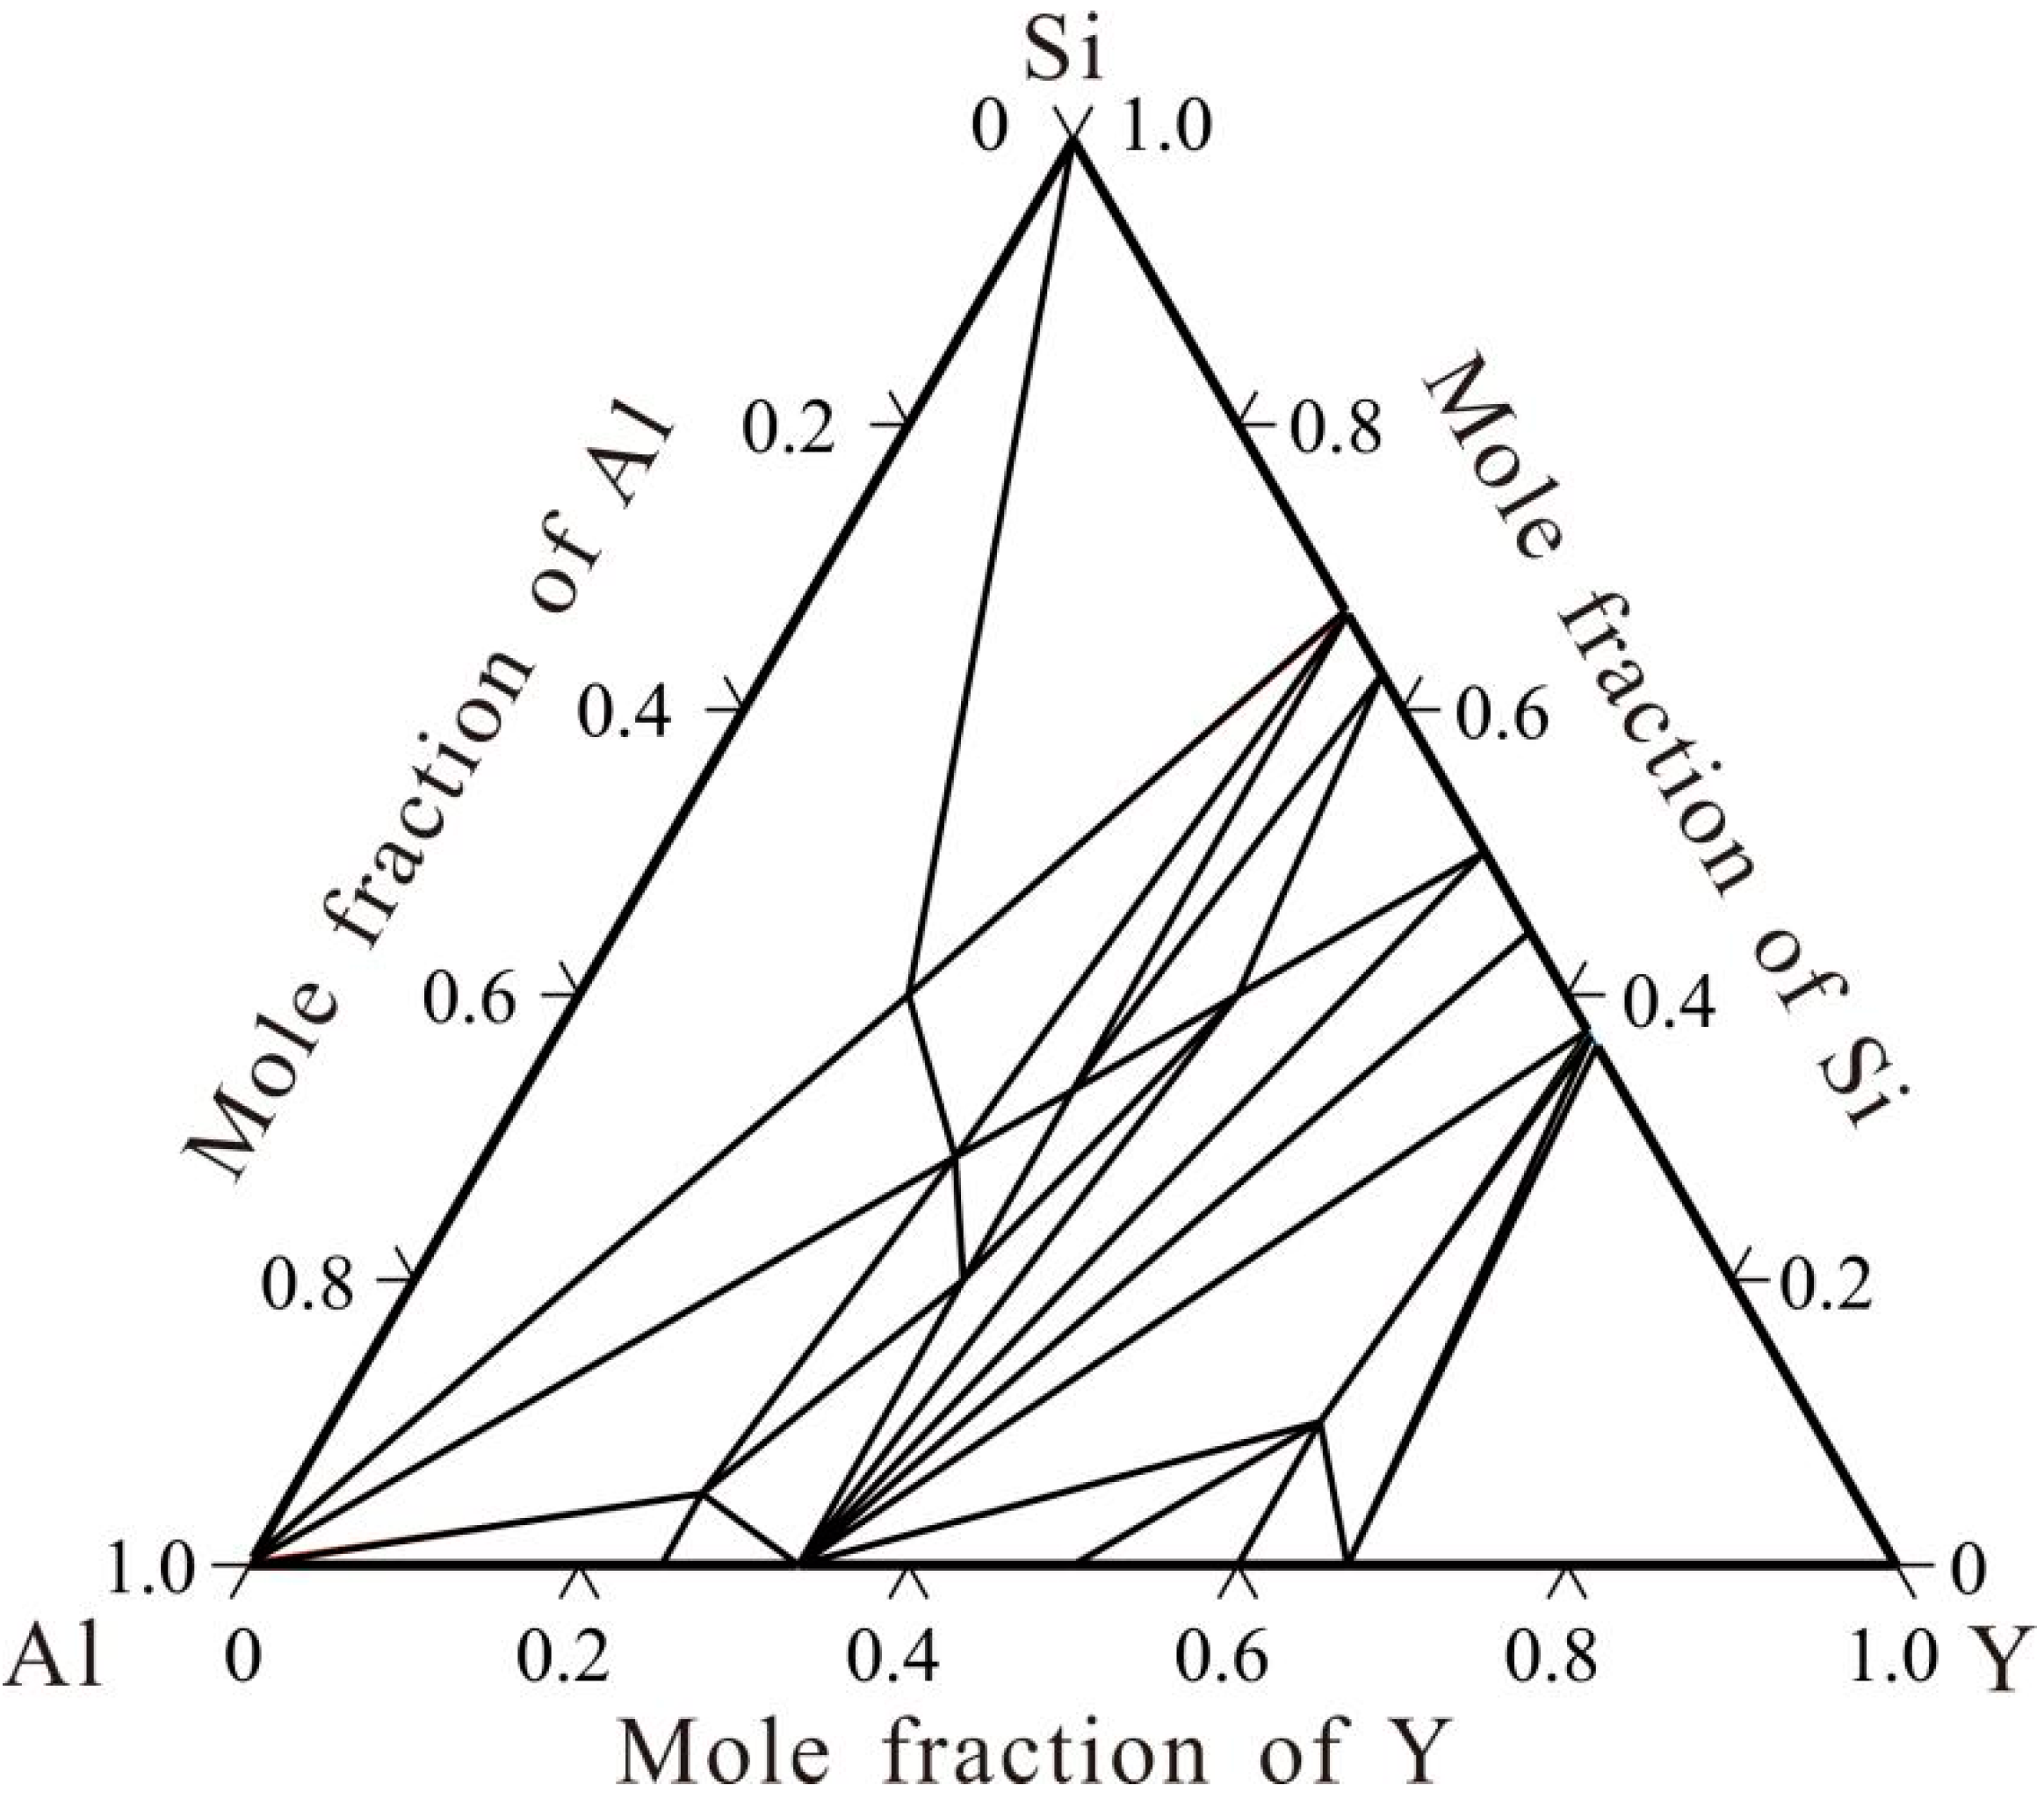
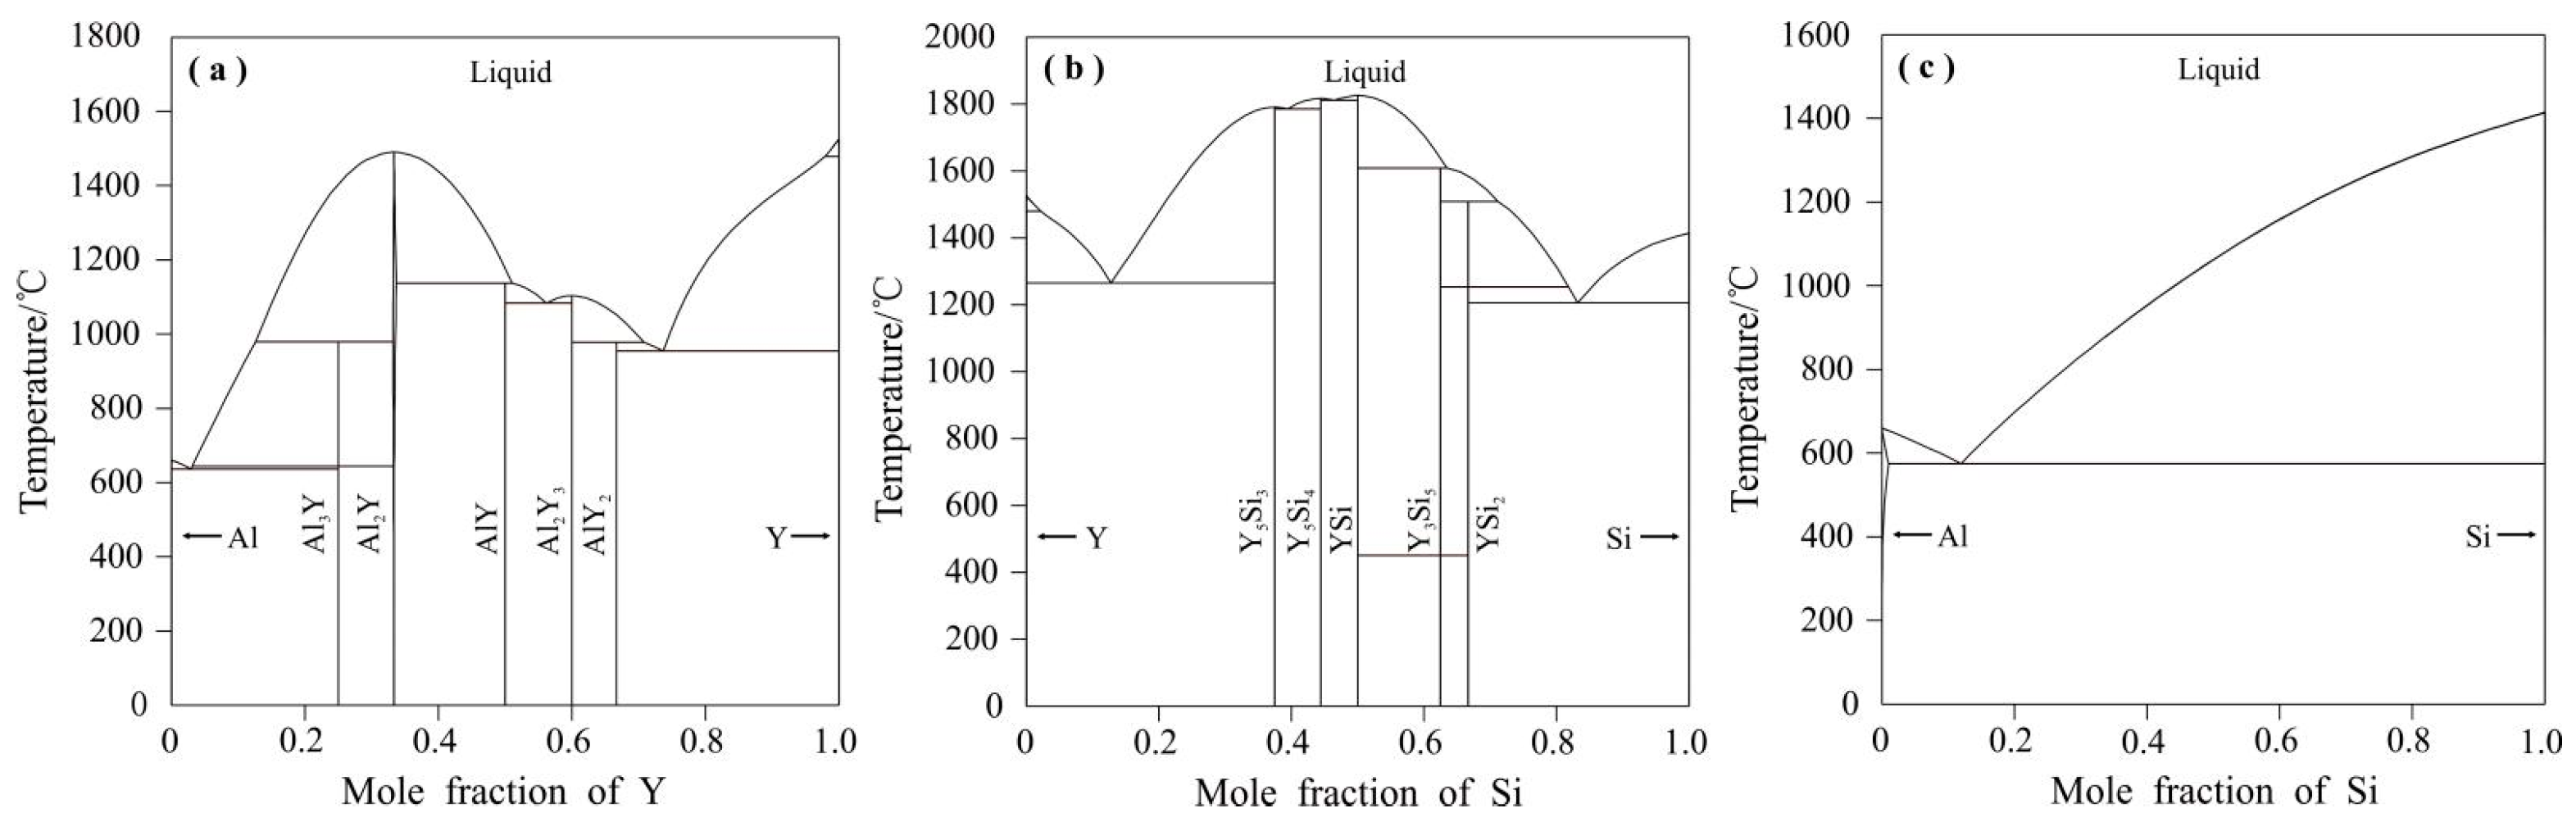
3. Results and Discussion

In the present work, Al–Si, Al–Y and Si–Y were studied at 773 K, and binary compounds were identified prior to the analysis of the ternary system. In the Al-Y system, the presence of Al3Y, Al2Y, Al2Y3, AlY and AlY2 was confirmed at 773 K, which is in agreement with previous studies. In the Si–Y system, the presence of Si2Y, Si5Y3, SiY, Si4Y5 and Si3Y5 was confirmed at 773 K. In the Al-Si system, no binary compounds were present at 773 K. In this work, 80 alloy samples were designed to determine the isothermal sections of the Al–Si–Y ternary system at 773 K and to study the equilibrium phase relations of the system. The results of the phase analysis for the EPMA study of representative annealed samples are listed and analyzed as shown in Table 2.

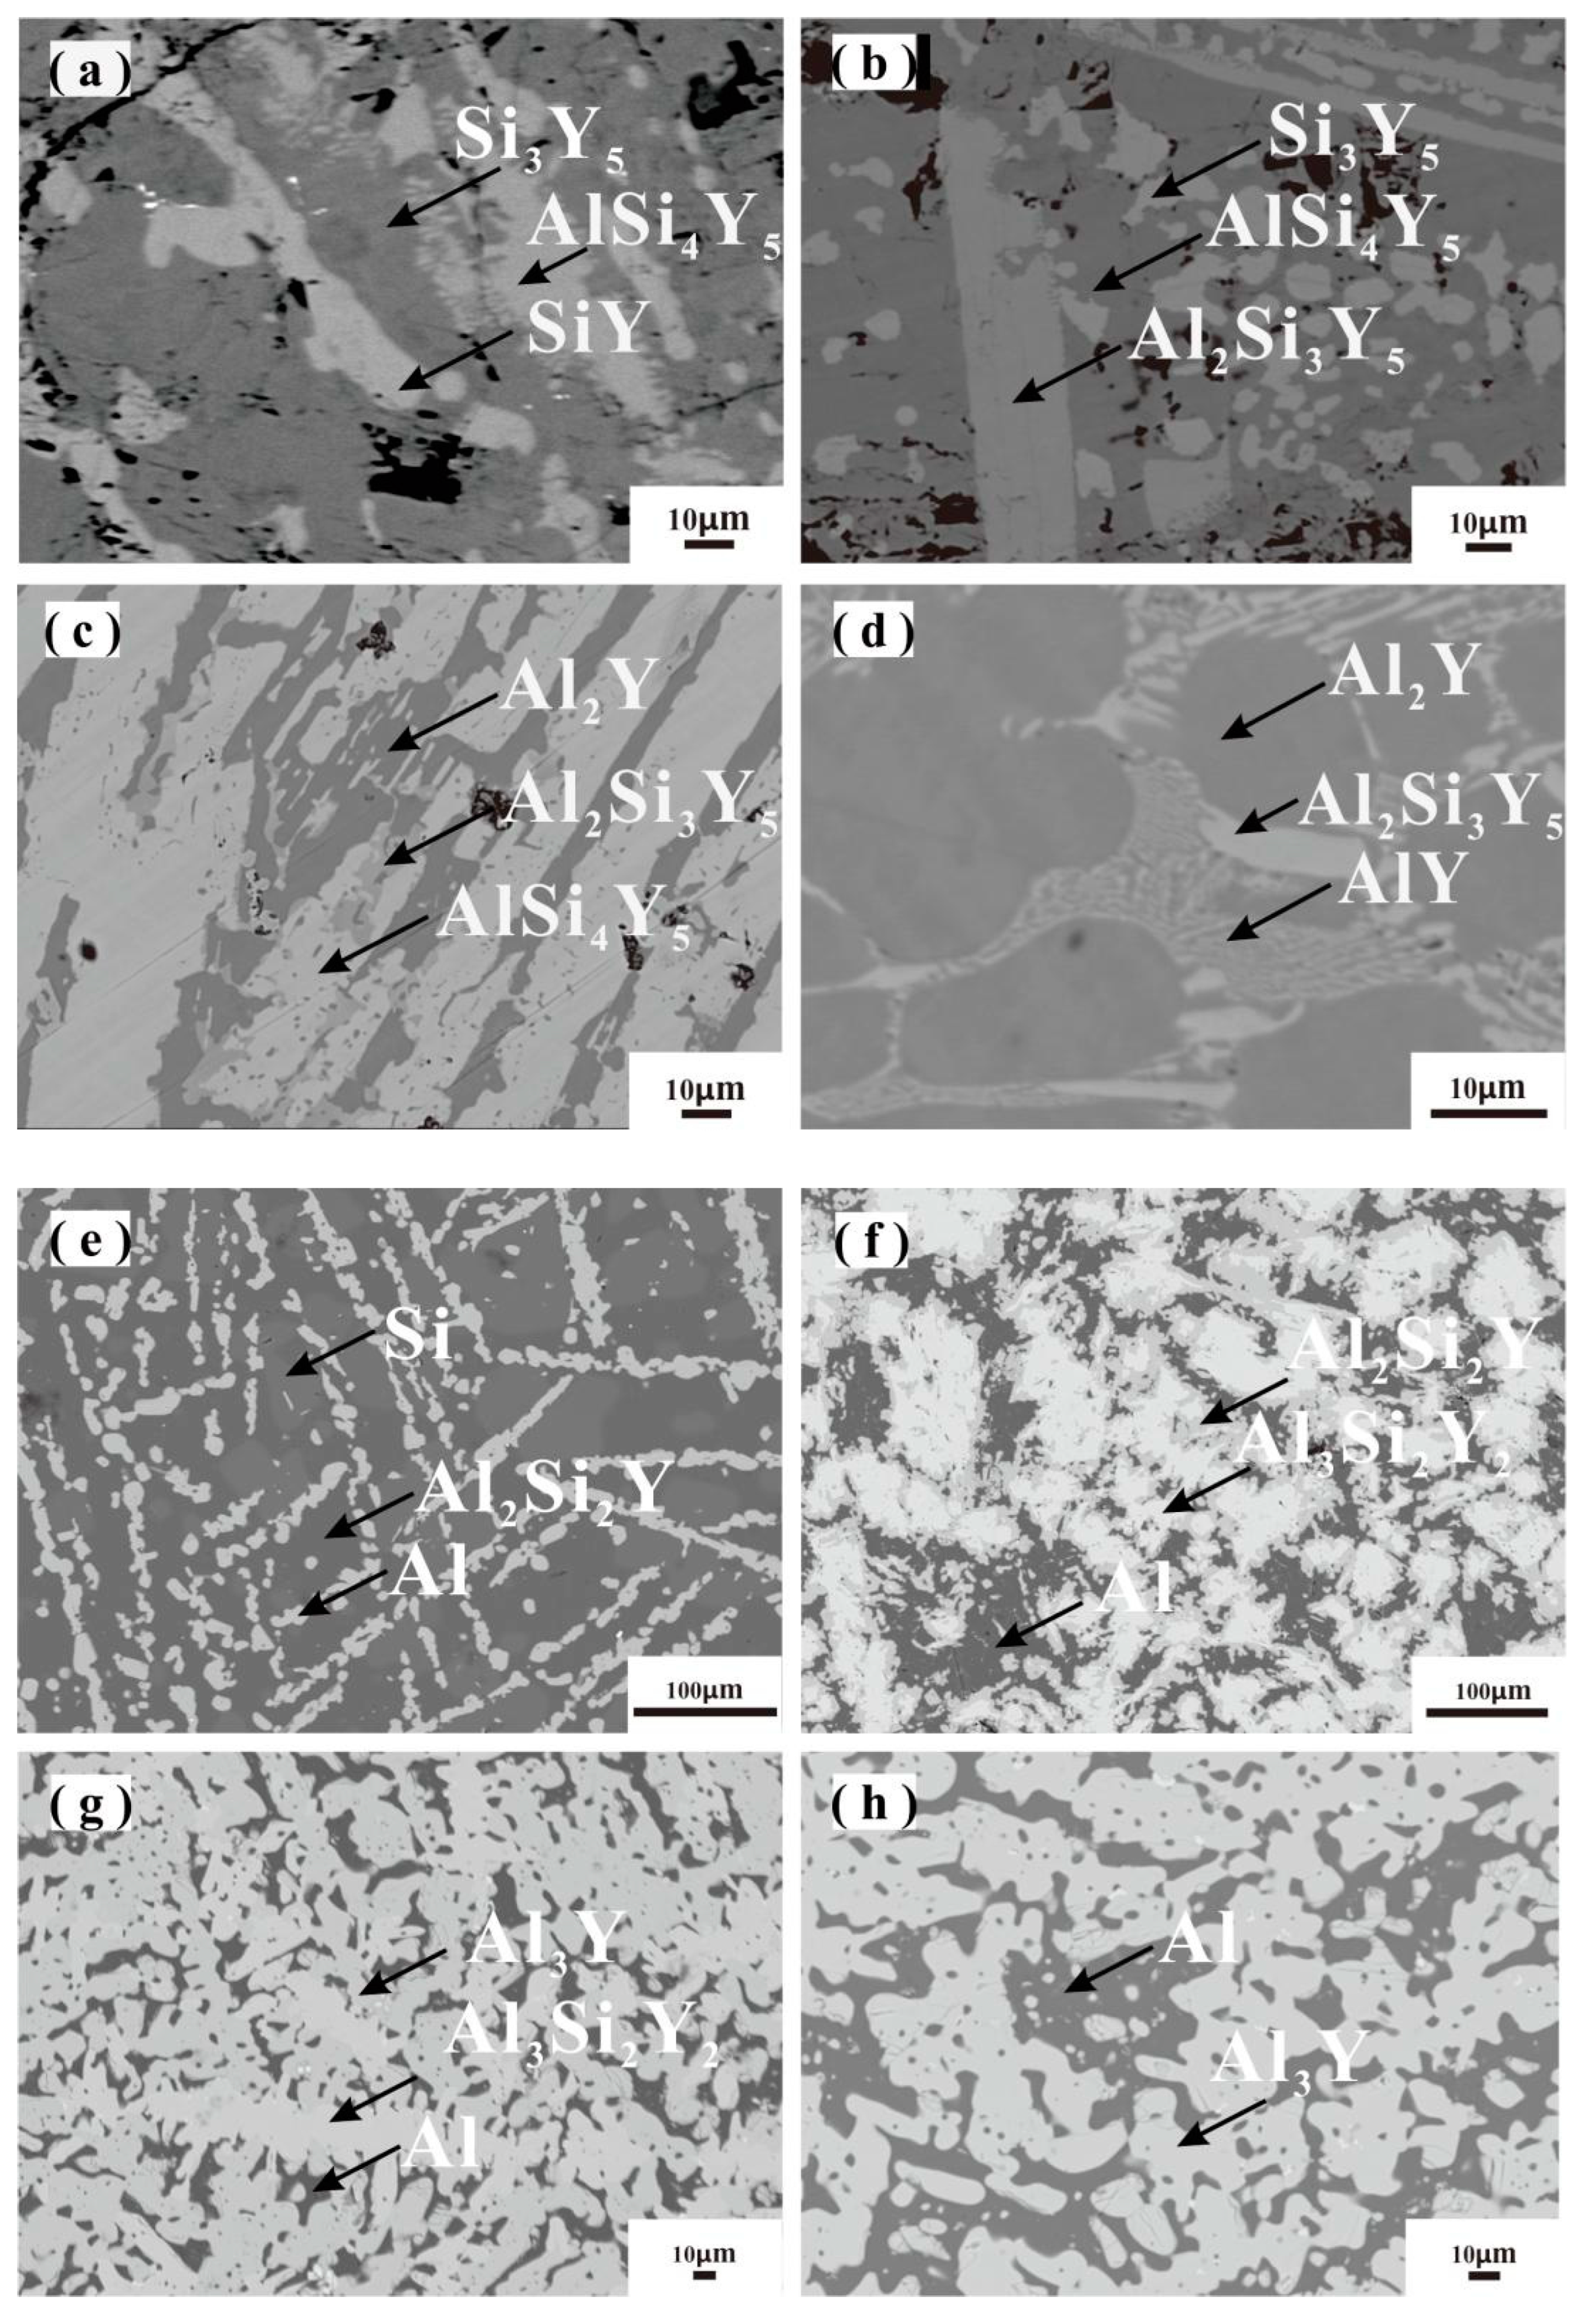
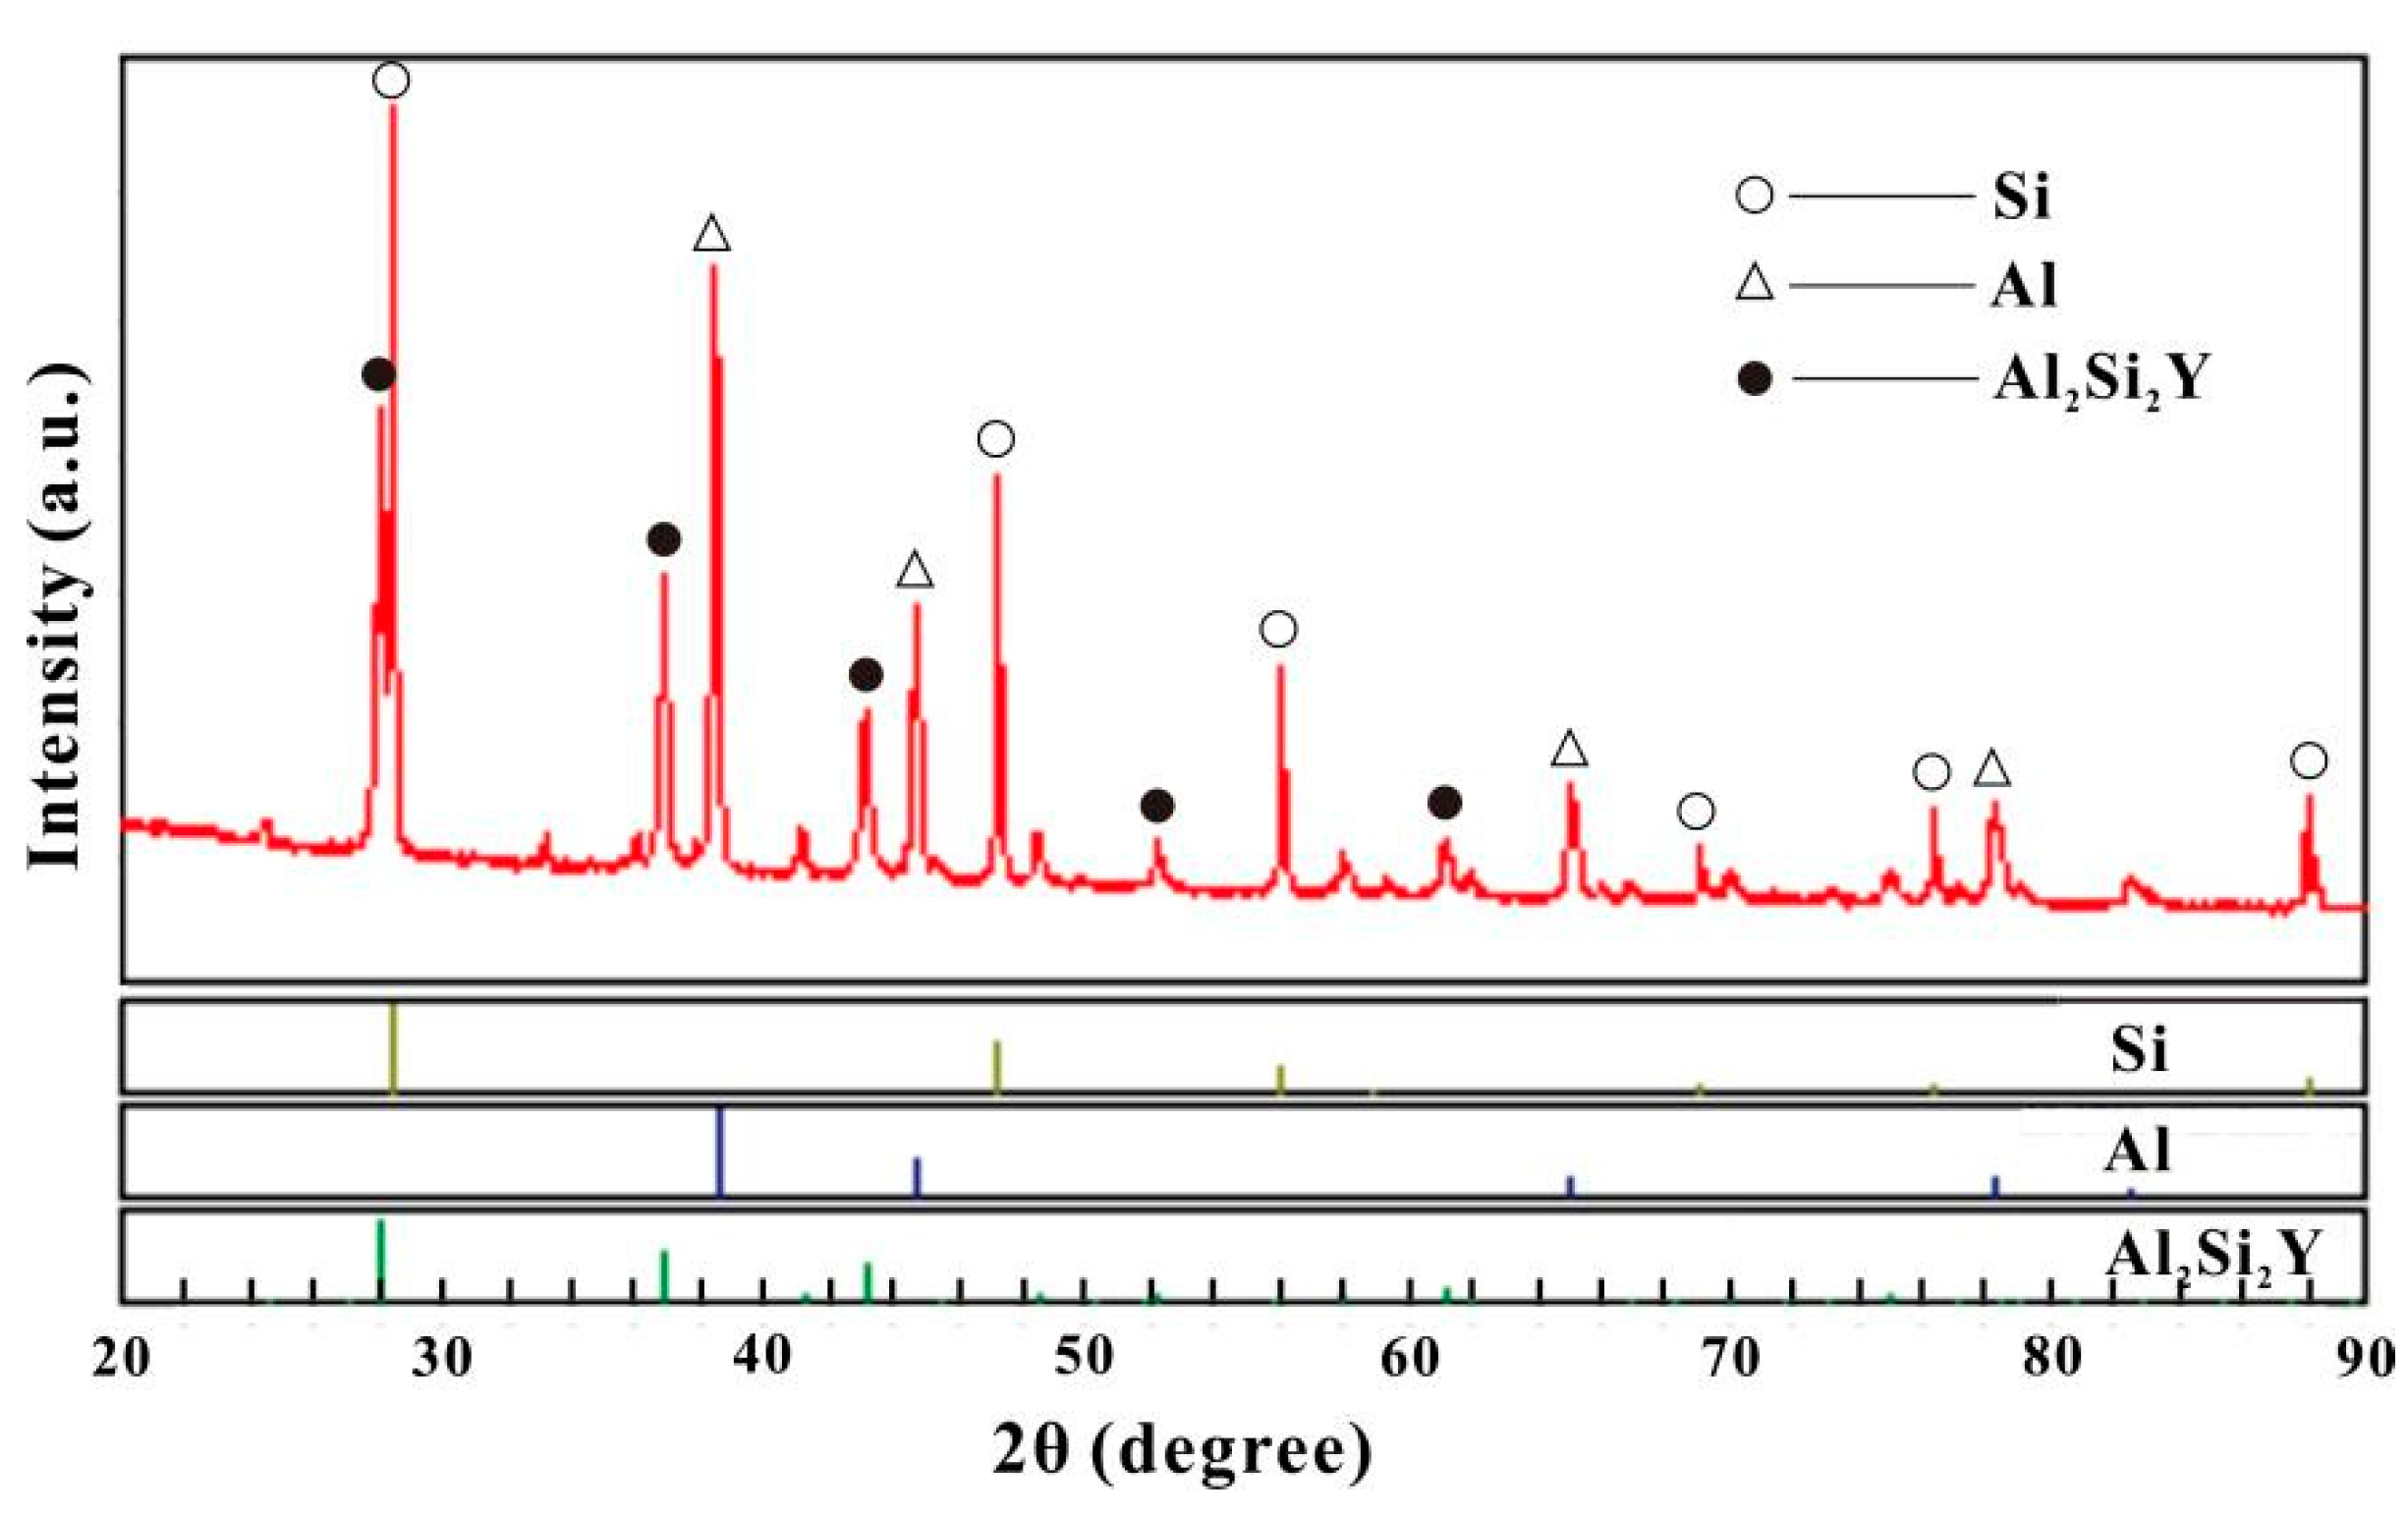
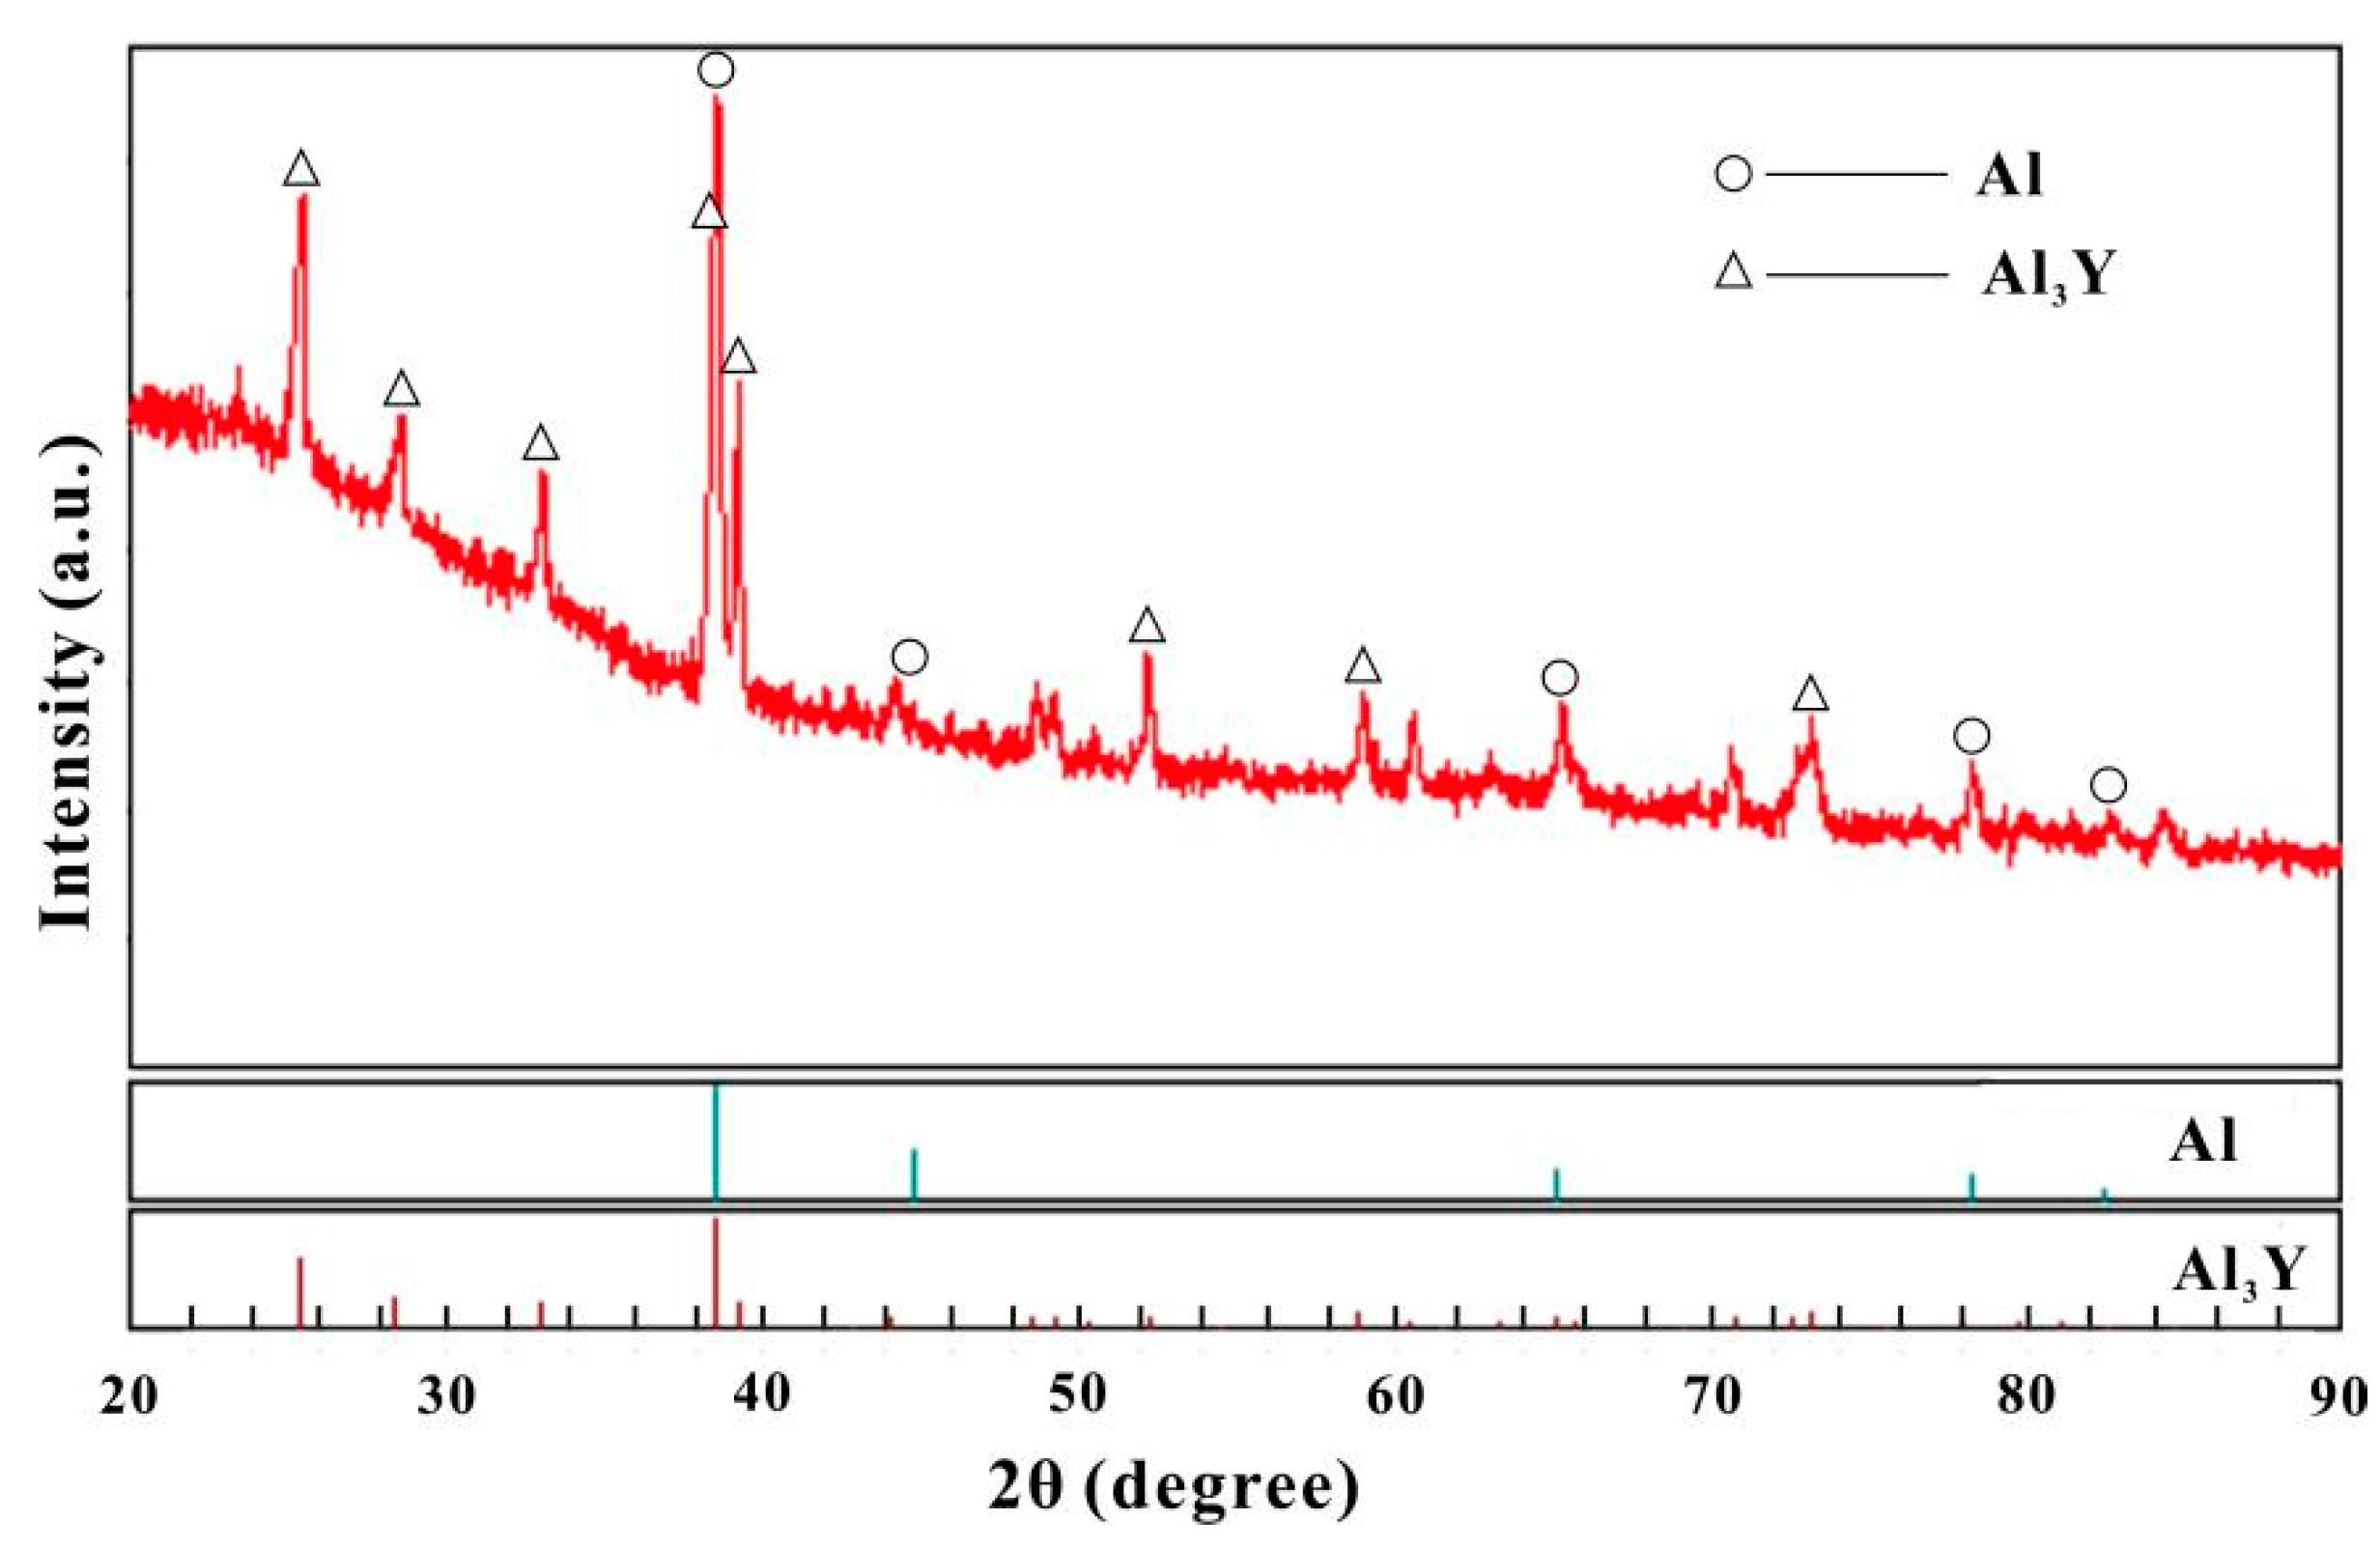
3.1. Aluminum-Rich Corner

The BSE picture of alloy sample No. 32 (Al60Si36Y4) and the results of the XRD analysis are shown in Figure 3e. The EPMA-WDS results show that the composition of the matrix of alloy sample No. 32 is Al41.8Si18.1Y20.1 for the black phase, Al98.8Si1.2Y for the white phase and Al0.4Si99.6Y, and combined with the diffraction peaks of the XRD experimental results, a three-phase equilibrium of Si+Al+Al2Si2Y was found to exist. The XRD patterns confirm these results, where the hollow, triangular and solid circles correspond to the three phases Si, Al and Al2Si2Y, respectively, as shown in Figure 4 [25]. Thus, the accuracy of the experimental results of others is favorably confirmed, and the correctness of the thermodynamic data of the Al–Si–Y ternary system is further corroborated [26].
With similar methods, the phase analysis for the remaining alloys is conducted. The BSE image of alloy sample No. 36 (Al60Si23Y17) shows the presence of three distinct linerings, as shown in Figure 3f. After EPMA-WDS and XRD analysis, it can be determined that two of the linerings represent the black phase Al, and the grey phase Al2Si2Y and the white phase Al3Si2Y2. The composition of the alloy was verified using XRD fluorescence spectrometry, and the XRD pattern is shown in Figure 5. The phase compositions determined by XRD are consistent with that of EPMA-WDS. Therefore, the accuracy of the distribution of this three-phase region is ensured.
The BSE pattern of alloy sample No. 26 (Al70Si10Y20) is shown in Figure 3g, and the black phase of Al and the light-gray phase of Al3Y were determined by EPMA-WDS. However, in the EPMA-WDS results, the chemical composition of the white phase of the matrix was determined to be Al44Si27.2Y28.8, and the chemical composition of the Al–Si–Y ternary compound Al3Si2Y2 was Al42.8Si28.6Y28.6, which was close to the chemical composition of the white phase, and only the light gray phase was initially considered to be Al3Si2Y2 by EPMA-WDS. After the XRD analysis of the metal powder sample made of alloy sample No. 26, the diffraction peaks of the experimental results were also found to be close to the characteristic peaks of the PDF card, and the XRD pattern is shown in Figure 6.
The stable phases observed in sample No. 15 (Al80Si2.5Y17.5) are Al and Si at 773 K, and the BSE picture of alloy sample No. 15 was found to have only 2 lining degrees evident, as shown in Figure 3h. The black phase was detected as Al, and the white phase as Al3Y, according to EPMA-WDS. The XRD result of alloy sample No. 15 indicates the two-phase equilibrium of Al+Al3Y, where the hollow circle represents the Al phase and the triangle represents the Al3Y phase, the XRD pattern of which is shown in Figure 7. Thus, the phase compositions determined by XRD are consistent with the results of EPMA-WDS.
The specific distribution of the aluminum-rich corner phase region was obtained from the analysis of the experimental results of EPMA-WDS and XRD for alloy samples No. 32, No. 36, No. 26 and No. 15. DSC tests were also carried out on X(Al) = 90 at.%, 80 at.%, 70 at.% and 60 at.% vertical sections at the aluminum-rich corner, and the experimental results were analyzed in detail to obtain the phase diagrams at the Al–Si–Y alloy system with the vertical sections at the aluminum-rich corner X(Al) = 90 at.%, 80 at.%, 70 at.% and 60 at.% and inserted into the experimental data, respectively, as shown in Figure 8a–d. The experimental data of the vertical sections obtained from the validation experiments are in general agreement with the results of the data obtained from the calculations, thus further verifying the accuracy of the thermodynamic database for the aluminum-rich corner of the Al–Si–Y alloy system.
Based on the analysis of the experimental results of EPMA-WDS and XRD of alloy sample No. 32, No. 36, No. 26 and No. 15, the specific distribution of the aluminum-rich corner-phase region was obtained, and it was found to be consistent with the aluminum-rich corner-phase region obtained from the calculation [27]. DSC tests were also performed on 44 samples at the aluminum-rich corner with X(Al) = 90 at.%, 80 at.%, 70 at.% and 60 at.% vertical sections, and the experimental results were analyzed in detail to obtain the phase transition temperatures of representative alloys, and then the phase transition temperatures were processed to obtain the experimental points of the vertical sections [28]. In the Al–Si–Y alloy system, the phase diagrams of the vertical sections with X(Al) = 90 at.%, 80 at.%, 70 at.% and 60 at.% at the aluminum-rich corner were calculated, and then the experimental points were inserted into the vertical section phase diagrams as shown in Figure 8a–d. The experimental points of the vertical sections obtained from the verification experiments are in general agreement with the results of the phase diagram data of the vertical sections obtained from the calculations, thus further verifying the accuracy of the thermodynamic database of the aluminum-rich corner of the Al–Si–Y alloy system [29].

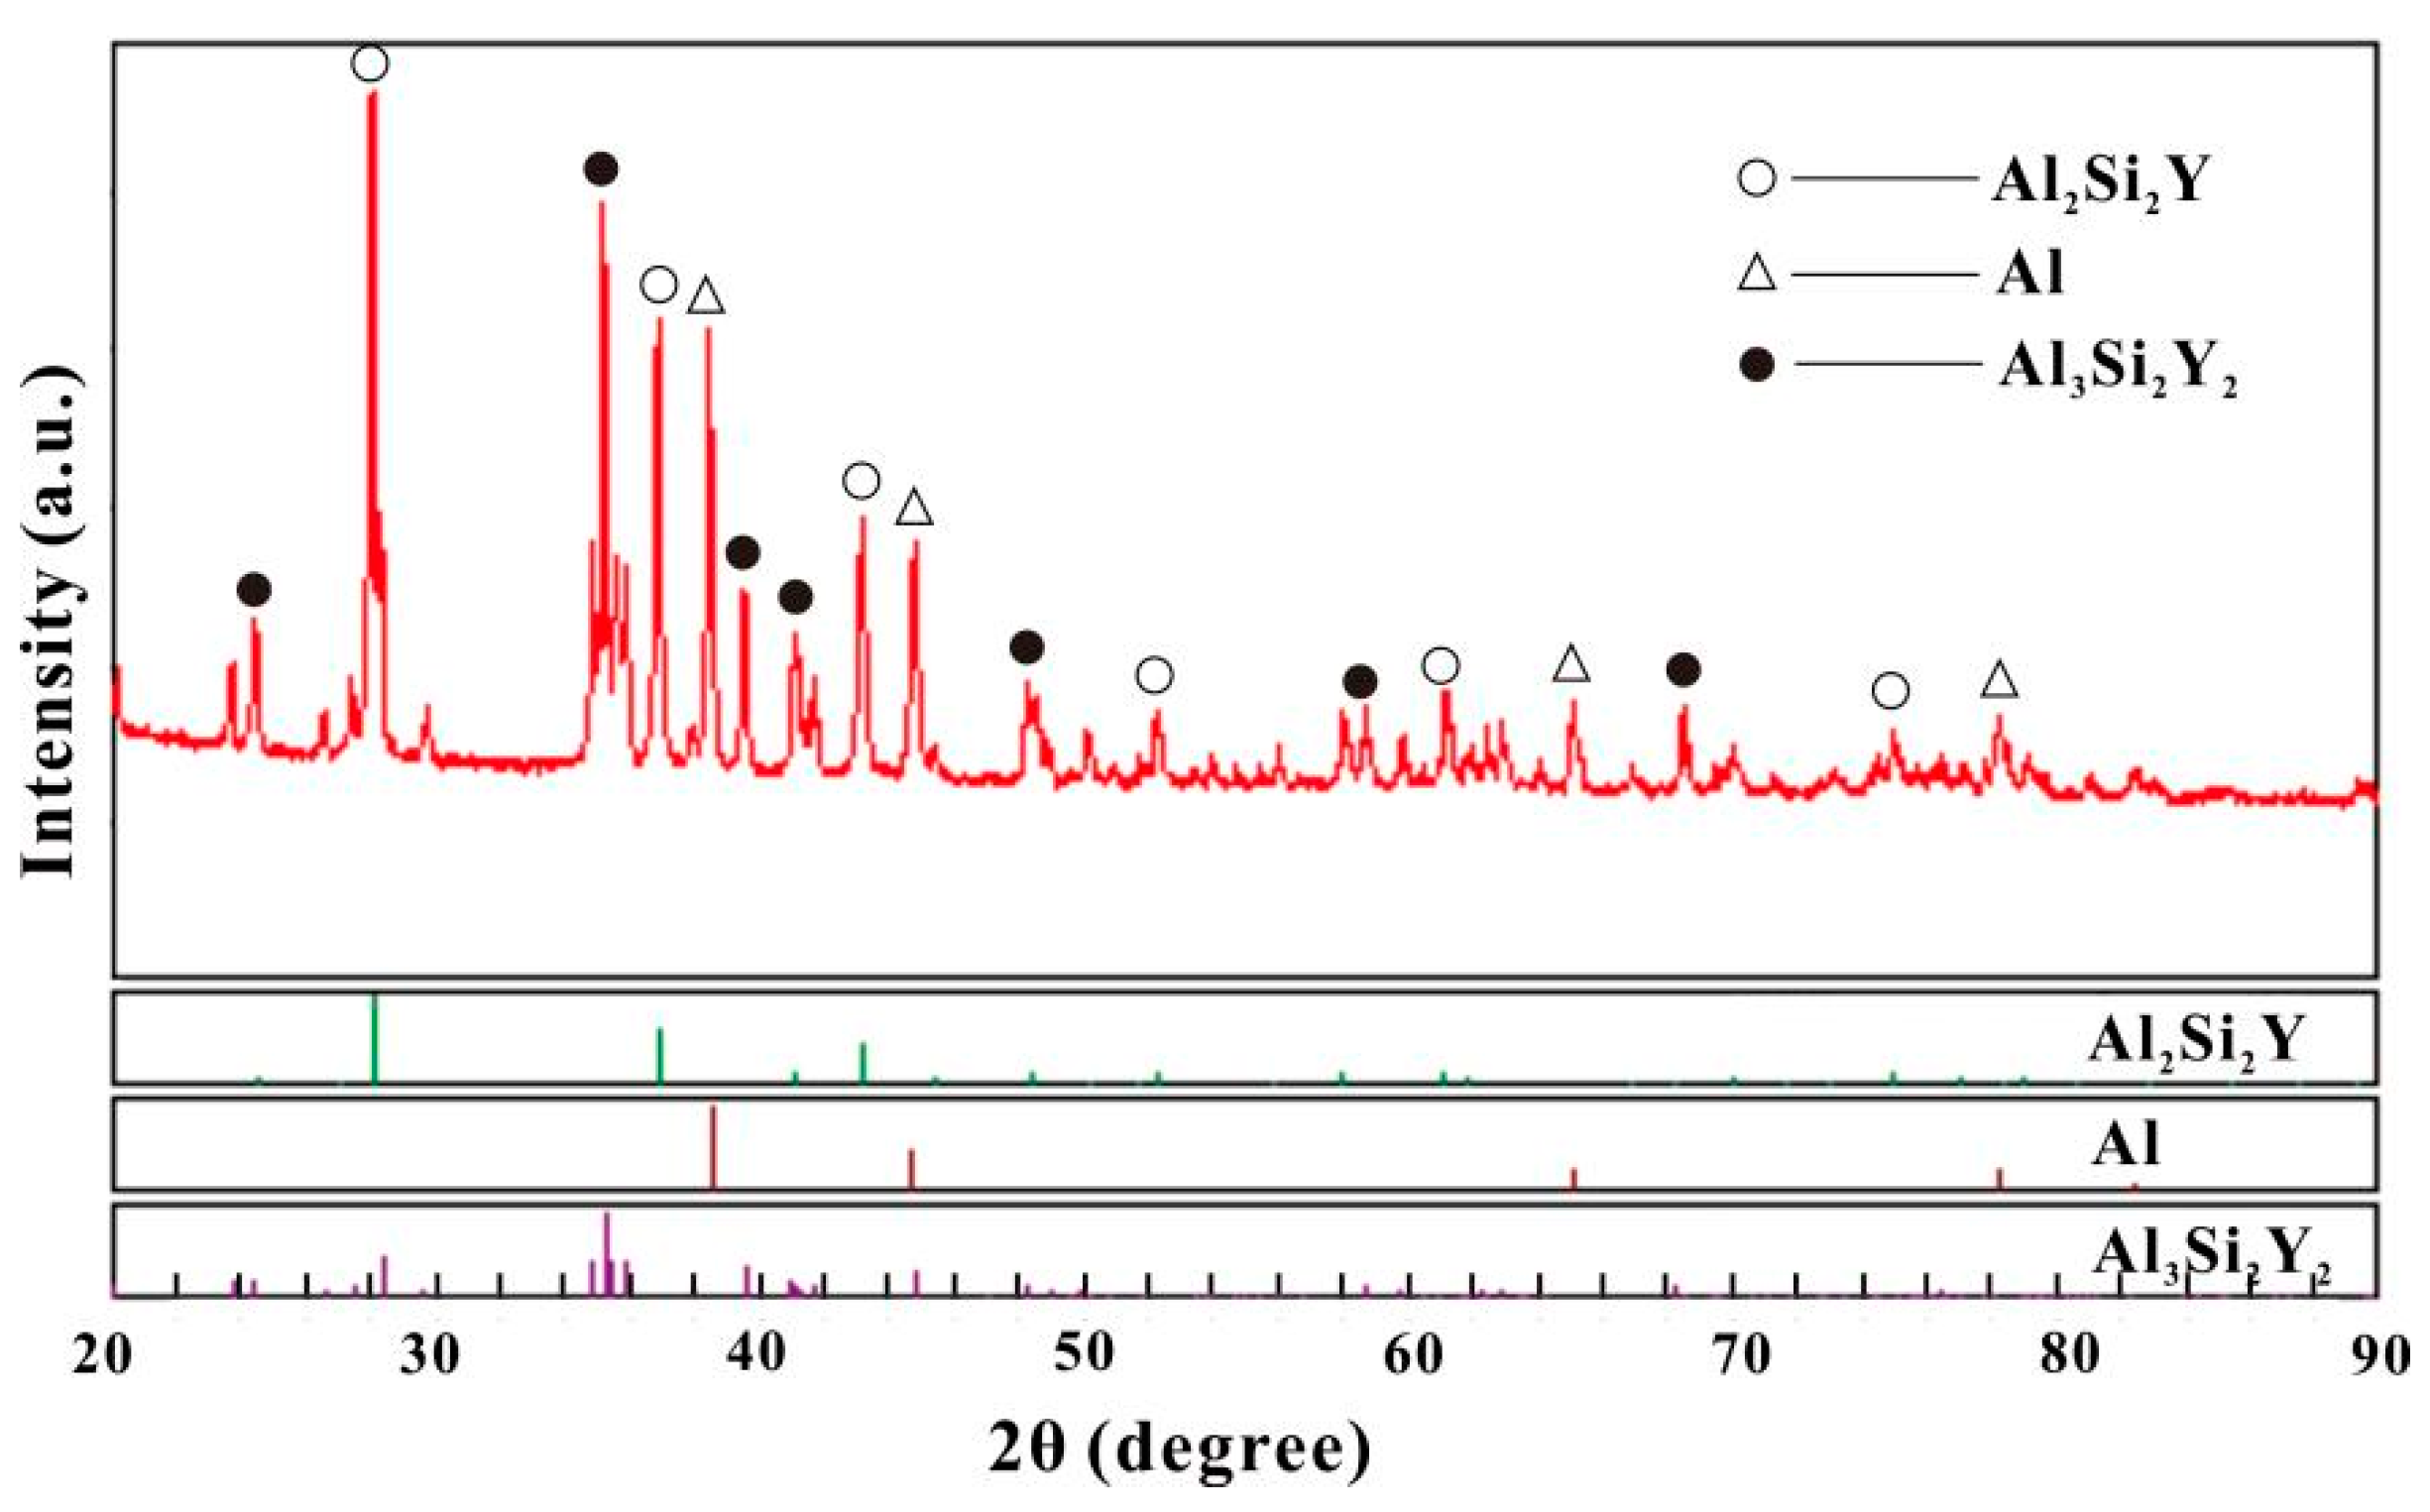
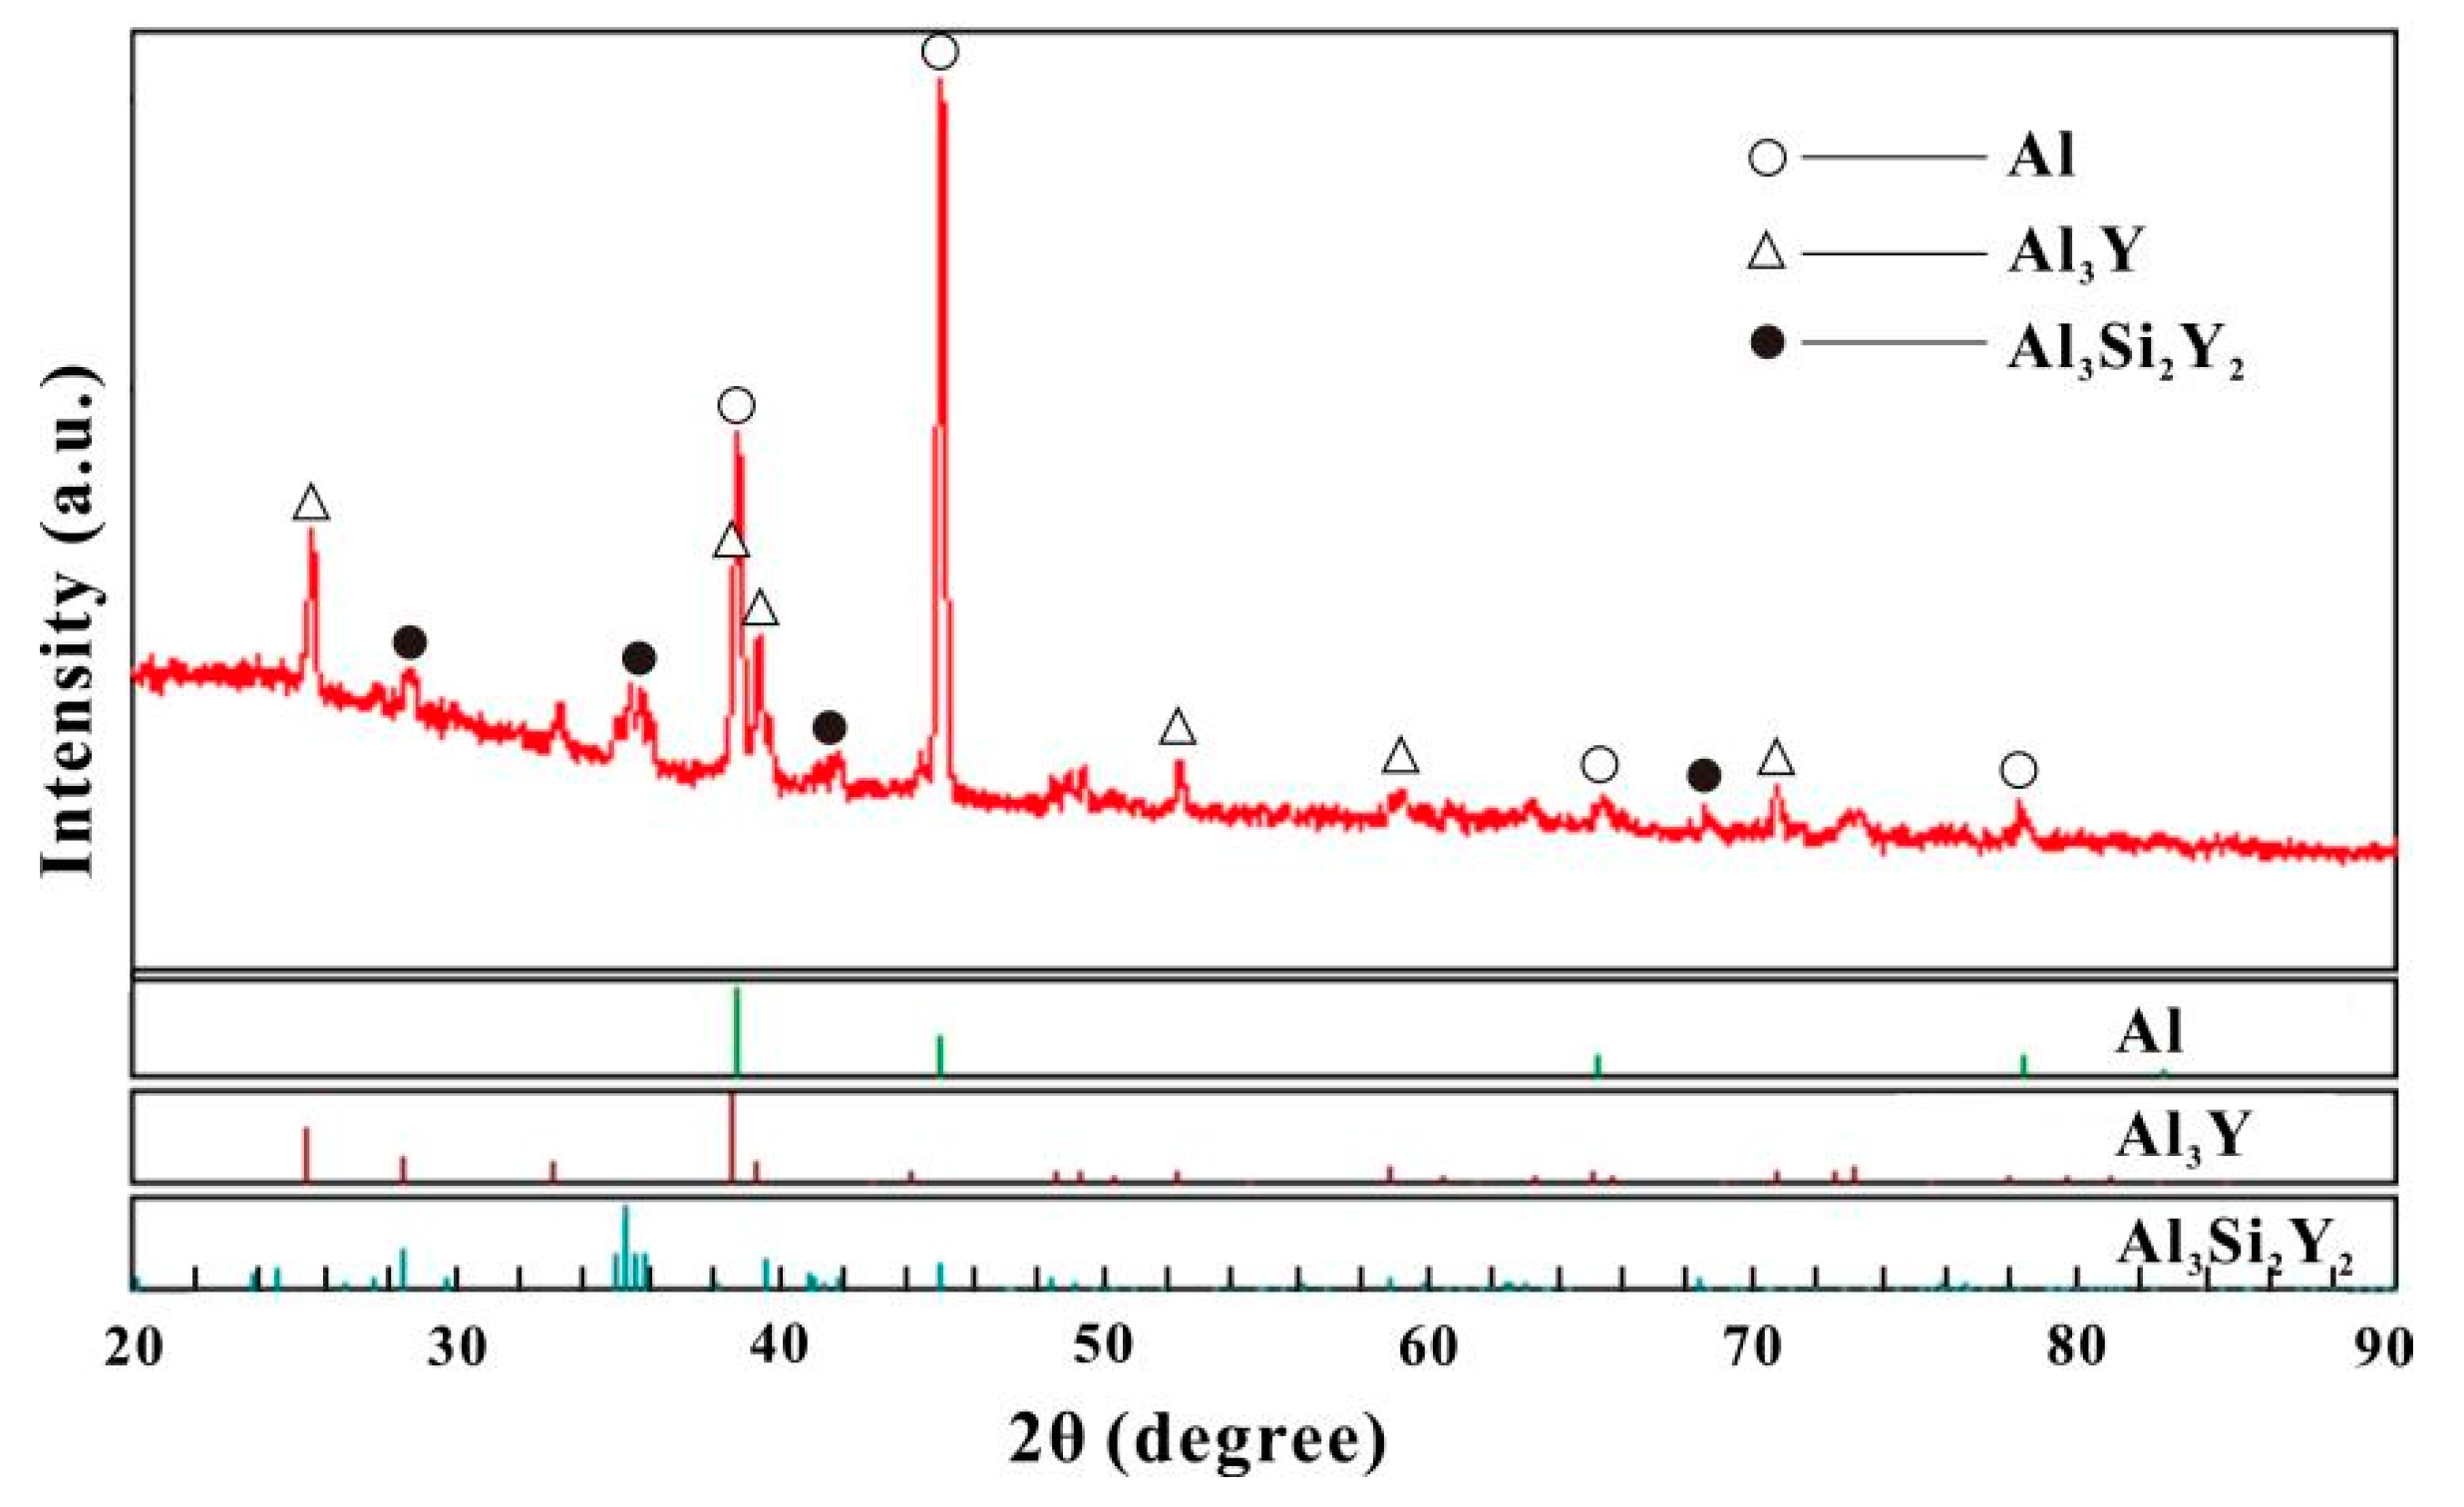
3.2. Non-Aluminium-Rich Corner

In one of the BSE pictures of alloy sample No. 55 (Al5.2Si42Y52.8), there are clearly two different lining degrees, which were obtained after EPMA-WDS analysis; they are the black matrix phase as Si3Y5 and the grey matrix phase as SiY, while the other grey-white matrix phase has a composition of Al10.7Si37.9Y51.4, very close to AlSi4Y5, indicating the presence of a new phase, as shown in Figure 3a. The BSE picture of alloy sample No. 56 (Al10.6Si36.2Y53.2) was found to have three different colors of lining, which were obtained using EPMA-WDS analysis: where the black matrix phase was AlSi4Y5, the greyish white matrix phase was Si3Y5, and the light grey matrix with a composition of Al20.5Si28.8Y50.7, close to Al2Si3Y5. The presence of a new phase Al2Si3Y5 was likewise found, as shown in Figure 3b.
As can be seen from the BSE picture of alloy sample No. 72 (Al23.3Si30.5Y46.2), there are clearly three liner degrees, as shown in Figure 3c. Using EPMA-WDS analysis, it was concluded that they distinguishably represent three different phases, with the black matrix phase being Al2Y, the white matrix phase being AlSi4Y5 and the grey matrix phase being Al2Si3Y5, constituting a three-phase region. According to the BSE picture of alloy sample No. 43 (Al60Si4Y36), three different lining levels were found, which were determined by EPMA-WDS analysis, with the black matrix phase being A2Y, the white matrix phase being Al2Si3Y5 and the light-grey matrix phase being AlY, indicating the existence of a three-phase region, as shown in Figure 3d.
The results of EPMA-WDS measurements on alloy samples No. 55, No. 56, No. 72 and No. 43 revealed the presence of two new phases at the non-aluminum-rich corner, AlSi4Y5 and Al2Si3Y5. In this work, isothermal sections of the Al–Si–Y ternary system at 773 K were plotted based on phase equilibrium data at 773 K for a total of 80 alloy samples at the aluminum-rich and non-aluminum-rich corners, as shown in Figure 9. A total of 23 three-phase zones and 4 two-phase zones, 7 ternary compounds and 8 binary compounds were obtained from the determination at the temperature of 773 K [30]. The dashed sections plotted in the figure are the predicted three-phase zones based on the phase diagram laws.

4. Conclusions

In this study, the isothermal cross section of the Al–Si–Y ternary system at 500 °C was obtained by the equilibrium alloy method, combined with EPMA, XRD and DSC detection, and the phase equilibrium relationship of the system was systematically investigated, which will provide new phase diagram data for the thermodynamic evaluation of the system. A total of 23 three-phase zones, 4 two-phase zones, 7 ternary compounds and 8 binary compounds were measured, with 3 solid solutions: Al3Y, Al2Y and AlY. At 773 K, the maximum solid solution of Al3Y to Si was 4.9 % (atomic fraction), Al2Y to Si was 0.9 % (atomic fraction) and AlY to Si was 0.8 % (atomic fraction). The new ternary compounds AlSi4Y5 and Al2Si3Y5 determined in this work do not have accurate crystal structure information, as their single phases were not obtained, and further studies are required.

Author Contributions

Conceptualization, H.Q., K.H., Z.L., Q.Y. (Qingrong Yao), J.D., L.C., Q.L., J.W. and H.Z.; Data curation, L.Y., Q.Y. (Qingkai Yang), K.H. and C.H.; Formal analysis, L.Y.; Funding acquisition, Q.Y. (Qingrong Yao); Investigation, L.C., J.W. and H.Z.; Methodology, L.Y., H.Q., Q.Y. (Qingkai Yang), J.D., Q.L. and J.W.; Project administration, Z.L. and Q.Y. (Qingrong Yao); Software, L.Y. and C.H.; Writing—review & editing, L.Y. and Z.L. All authors have read and agreed to the published version of the manuscript.

Funding

This work was supported by the National Natural Science Foundation of China (grant nos: 52061007, 51871066), the Science and Technology Project of Guangxi (grant nos: AB21220028, AA22068084, AA18242023), the Natural Science Foundation of Guangxi (grant nos: 2021GXNSFDA075009), Guangxi Key Laboratory of Information Materials (grant nos: 191012-Z, 211034-Z), Basic scientific research of young teachers in Guangxi universities (grant nos: 2021KY0198) and the innovation program for University students (grant nos: 201910595037) are acknowledged.

Institutional Review Board Statement

Not applicable.

Informed Consent Statement

Not applicable.

Data Availability Statement

Not applicable.

Conflicts of Interest

The authors declare no conflict of interest.

References

  1. Pukas, S.; Lasocha, W.; Gladyshevskii, R. Phase equilibria in the Er–Al–Si system at 873 K. Calphad 2009, 33, 23–26. [Google Scholar] [CrossRef]
  2. Rashno, S.; Reihanian, M.; Ranjbar, K. Tensile and creep properties of Al–7Si–0.3Mg alloy with Zr and Er addition. Mater. Sci. Technol. 2020, 36, 1603–1613. [Google Scholar] [CrossRef]
  3. Xu, K.; Chang, K.; Yu, M.; Zhou, D.; Du, Y.; Wang, L. Design of novel NiSiAlY alloys in marine salt-spray environment: Part II. Al-Ni-Si-Y thermodynamic dataset. J. Mater. Sci. Technol. 2021, 89, 186–198. [Google Scholar] [CrossRef]
  4. Magazu, S.; Migliardo, F.; Caccamo, M.T. Innovative wavelet protocols in analyzing elastic incoherent neutron scattering. J. Phys. Chem. B 2012, 116, 9417–9423. [Google Scholar] [CrossRef]
  5. Liu, X.; Wang, C.; Wen, M.; Chen, X.; Pan, F. Thermodynamic database of the phase diagrams in the Mg-Al-Zn-Y-Ce system. Rare Met. 2006, 25, 441–447. [Google Scholar] [CrossRef]
  6. Liu, S.; Du, Y.; Chen, H. A thermodynamic reassessment of the Al–Y system. Calphad 2006, 30, 334–340. [Google Scholar] [CrossRef]
  7. Liu, S.; Du, Y.; Xu, H.; He, C.; Schuster, J.C. Experimental investigation of the Al–Y phase diagram. J. Alloy. Compd. 2006, 414, 60–65. [Google Scholar] [CrossRef]
  8. Hennet, L.; Cristiglio, V. Aerodynamic levitation and laser heating. Eur. Phys. J. Spec. Top. 2011, 196, 151–165. [Google Scholar] [CrossRef]
  9. Bellissent, R.; Magazu, S.; Majolino, D.; Migliardo, P. Structural Properties of Amorphous Bulk Fe, CO and Fe-Co Binary Alloys. Phys. Scr. 1995, T57, 79. [Google Scholar] [CrossRef] [Green Version]
  10. Shukla, A.; Kang, Y.B.; Pelton, A.D. Thermodynamic assessment of the Ce–Si, Y–Si, Mg–Ce–Si and Mg–Y–Si systems. Int. J. Mater. Res. 2009, 100, 208–217. [Google Scholar] [CrossRef]
  11. Zhang, Z.; Chu, M.Y.; Zhao, X.S.; Li, K.; Shang, S.L.; Liu, Z.K.; Shen, J.Y. Thermodynamic modeling of the Si-Y system aided by first-principles and phonon calculations. Calphad 2019, 65, 282–290. [Google Scholar] [CrossRef]
  12. Xu, K.; Zou, H.; Chang, K.; Deng, Z.; Zhou, X.; Huang, Y.; Chen, L.; Huang, F.; Huang, Q. Thermodynamic description of the sintering aid system in silicon carbide ceramics with the addition of yttrium. J. Eur. Ceram. Soc. 2019, 39, 4510–4519. [Google Scholar] [CrossRef]
  13. Pan, Z.; Fabrichnaya, O.; Seifert, H.J.; Neher, R.; Brandt, K.; Herrmann, M. Thermodynamic evaluation of the Si-C-Al-Y-O system for LPS-SiC application. J. Phase Equilibria Diffus. 2010, 31, 238–249. [Google Scholar] [CrossRef]
  14. Xu, K.; Chang, K.; Du, Y.; Wang, L. Design of novel NiSiAlY alloys in marine salt-spray environment: Part I. Al-Si-Y and Ni-Si-Y subsystems. J. Mater. Sci. Technol. 2021, 88, 66–78. [Google Scholar] [CrossRef]
  15. Pukas, S.; Lutsyshyn, Y.; Manyako, M.; Gladyshevskii, E. Crystal structures of the RAlSi and RAlGe compounds. J. Alloys Compd. 2004, 367, 162–166. [Google Scholar] [CrossRef]
  16. Yin, T.; Ma, Z.; Chen, H.; Luo, Q.; Zhang, J.; Wu, G. Phase Equilibria of the Mg-Zn-Sm System in Mg-Rich Corner at 320 °C and 400 °C. Metals 2022, 12, 1553. [Google Scholar] [CrossRef]
  17. Huang, K.L.; Xiao, L.M.; Yang, Q.K.; Yang, L.; Li, Z.B.; Lu, Z.; Yao, Q.R.; Deng, J.Q.; Cheng, L.C.; Huang, C.M.; et al. Experimental Investigation of Isothermal Section in the La–Co–Ni System at 723 K. Metals 2022, 12, 1747. [Google Scholar] [CrossRef]
  18. Mezbahul-Islam, M.; Kevorkov, D.; Medraj, M. Experimental Study of the Mg-Ni-Y System at 673 K Using Diffusion Couples and Key Alloys. Metals 2015, 5, 1746–1769. [Google Scholar] [CrossRef] [Green Version]
  19. Magazu, S.; Migliardo, F.; Caccamo, M.T. Upgrading of Resolution Elastic Neutron Scattering (RENS). Adv. Mater. Sci. Eng. 2013, 2013, 1–7. [Google Scholar] [CrossRef] [Green Version]
  20. Wang, C.; Zhang, X.; Li, L.; Pan, Y.; Chen, Y.; Yang, S.; Lu, Y.; Han, J.; Liu, X. Phase Equilibria of the Co-Ti-Ta Ternary System. Metals 2018, 8, 958. [Google Scholar] [CrossRef]
  21. Magazu, S. IQENS-dynamic light scattering complementarity on hydrogenous systems. Phys. B Condens. Matter 1996, 226, 92–106. [Google Scholar] [CrossRef]
  22. Magazu, S. NMR, static and dynamic light and neutron scattering investigations on polymeric aqueous solutions. J. Mol. Struct. 2000, 523, 47–59. [Google Scholar] [CrossRef]
  23. Jannelli, M.P.; Migliardo, P.; Aliotta, F.; Tettamanti, E. Transport properties of liquid alcohols investigated by IQENS, NMR and DLS studies. J. Phys. Condens. Matter 1996, 8, 8157–8171. [Google Scholar] [CrossRef]
  24. Zhang, F.; Qin, A.; Liu, S.; Wang, J.; Du, Y. Phase equilibria and solidification characteristics of the Al–Sc–Si alloys. J. Mater. Sci. 2015, 51, 1644–1658. [Google Scholar] [CrossRef]
  25. Liu, X.J.; Wu, D.; Zhang, J.; Yang, M.; Zhu, J.; Li, L.; Chen, Y.; Yang, S.; Han, J.; Lu, Y.; et al. Experimental Investigation of Phase Equilibria in the Co-Re-Ta Ternary System. Metals 2018, 8, 911. [Google Scholar] [CrossRef] [Green Version]
  26. Liu, X.; Du, Y.; Liu, S.; Cheng, K.; Zhang, Z. Phase equilibria and crystal structure of ternary compounds in Al-rich corner of Al-Er-Y system at 673 K and 873 K. J. Mater. Sci. Technol. 2021, 60, 128–138. [Google Scholar] [CrossRef]
  27. Wang, J.; Liu, L.; Zhang, L.; Tuo, B.; Bai, W.; Wu, D. Experimental Investigation of the Ti-Nb-Sn Isothermal Section at 1173 K. Metals 2016, 6, 60. [Google Scholar] [CrossRef] [Green Version]
  28. Luo, Q.; Li, Q.; Zhang, J.Y.; Chen, S.L.; Chou, K.C. Experimental investigation and thermodynamic calculation of the Al–Si–Ti system in Al-rich corner. J. Alloys Compd. 2014, 602, 58–65. [Google Scholar] [CrossRef]
  29. Schick, C. Differential scanning calorimetry (DSC) of semicrystalline polymers. Anal. Bioanal. Chem. 2009, 395, 1589–1611. [Google Scholar] [CrossRef] [PubMed]
  30. Zhao, F.; Zhang, L.; Wang, H.; Liu, L. Phase equilibria investigation of the Al–Ni–Er ternary system at 600 °C and 700 °C. Calphad 2021, 75, 102353. [Google Scholar] [CrossRef]
Figure 1. (a) The calculated phase diagram of the Al–Y system; (b) the calculated phase diagram of the Si–Y system; (c) the calculated phase diagram of the Al–Si system.
Metals 12 02020 g001
Figure 2. Calculated isothermal section of the Al–Si–Y system at 773 K.
Metals 12 02020 g002
Figure 3. The BSE images of No. 55, No. 56, No. 72, No. 43, No. 32, No. 36, No. 26 and No. 15 alloy samples: (a) No. 55. Al5.2Si42Y52.8; (b) No. 56. Al10.6Si36.2Y53.2; (c) No. 72. Al23.3Si30.5Y46.2; (d) No. 43. Al60Si4Y36; (e) No. 32. Al60Si36Y4; (f) No. 36. Al60Si23Y17; (g) No. 26. Al70Si10Y20; (h) No. 15. Al80Si2.5Y17.5.
Metals 12 02020 g003
Figure 4. XRD pattern of alloy sample No. 32.
Metals 12 02020 g004
Figure 5. XRD pattern of alloy sample No. 36.
Metals 12 02020 g005
Figure 6. XRD pattern of alloy sample No. 26.
Metals 12 02020 g006
Figure 7. XRD pattern of alloy sample No. 15.
Metals 12 02020 g007
Figure 8. The computed vertical sections of Al–Si–Y system with the experimental data. (a) X(Al) = 90 at.%; (b) X(Al) = 80 at.%; (c) X(Al) = 70 at.%; (d) X(Al) = 60 at.%.
Metals 12 02020 g008
Figure 9. Constructed isothermal section of the Al–Si–Y system at 773 K based on the experimental results.
Metals 12 02020 g009
Table 1. Alloy compositions, heat treatment schedule and the analysis methods in the Al–Si–Y system.
Sample No.Nominal Composition (at.%)Treatment, Analysis
1Al90Si9Y1As-cast, 500 °C/6 weeks, DSC/XRD/EPMA
2Al90Si7.5Y2.5As-cast, 500 °C/6 weeks, DSC/XRD/EPMA
3Al90Si5.5Y4.5As-cast, 500 °C/6 weeks, DSC/XRD/EPMA
4Al90Si4Y6As-cast, 500 °C/6 weeks, DSC/XRD/EPMA
5Al90Si2.5Y7.5As-cast, 500 °C/6 weeks, DSC/XRD/EPMA
6Al90Si1Y9As-cast, 500 °C/6 weeks, DSC/XRD/EPMA
7Al80Si19Y1As-cast, 500 °C/6 weeks, DSC/XRD/EPMA
8Al80Si17Y3As-cast, 500 °C/6 weeks, DSC/XRD/EPMA
9Al80Si15Y5As-cast, 500 °C/6 weeks, DSC/XRD/EPMA
10Al80Si12.5Y7.5As-cast, 500 °C/6 weeks, DSC/XRD/EPMA
11Al80Si11Y9As-cast, 500 °C/6 weeks, DSC/XRD/EPMA
12Al80Si9Y11As-cast, 500 °C/6 weeks, DSC/XRD/EPMA
13Al80Si7Y13As-cast, 500 °C/6 weeks, DSC/XRD/EPMA
14Al80Si5Y15As-cast, 500 °C/6 weeks, DSC/XRD/EPMA
15Al80Si2.5Y17.5As-cast, 500 °C/6 weeks, DSC/XRD/EPMA
16Al80Si1Y19As-cast, 500 °C/6 weeks, DSC/XRD/EPMA
17Al70Si29Y1As-cast, 500 °C/6 weeks, DSC/XRD/EPMA
18Al70Si27Y3As-cast, 500 °C/6 weeks, DSC/XRD/EPMA
19Al70Si24.5Y5.5As-cast, 500 °C/6 weeks, DSC/XRD/EPMA
20Al70Si22.5Y7.5As-cast, 500 °C/6 weeks, DSC/XRD/EPMA
21Al70Si20Y10As-cast, 500 °C/6 weeks, DSC/XRD/EPMA
22Al70Si18Y12As-cast, 500 °C/6 weeks, DSC/XRD/EPMA
23Al70Si16Y14As-cast, 500 °C/6 weeks, DSC/XRD/EPMA
24Al70Si14Y16As-cast, 500 °C/6 weeks, DSC/XRD/EPMA
25Al70Si12Y18As-cast, 500 °C/6 weeks, DSC/XRD/EPMA
26Al70Si10Y20As-cast, 500 °C/6 weeks, DSC/XRD/EPMA
27Al70Si8Y22As-cast, 500 °C/6 weeks, DSC/XRD/EPMA
28Al70Si5Y25As-cast, 500 °C/6 weeks, DSC/XRD/EPMA
29Al70Si4Y26As-cast, 500 °C/6 weeks, DSC/XRD/EPMA
30Al70Si2Y28As-cast, 500 °C/6 weeks, DSC/XRD/EPMA
31Al60Si39Y1As-cast, 500 °C/6 weeks, DSC/XRD/EPMA
32Al60Si36Y4As-cast, 500 °C/6 weeks, DSC/XRD/EPMA
33Al60Si32Y8As-cast, 500 °C/6 weeks, DSC/XRD/EPMA
34Al60Si29Y11As-cast, 500 °C/6 weeks, DSC/XRD/EPMA
35Al60Si26Y14As-cast, 500 °C/6 weeks, DSC/XRD/EPMA
36Al60Si23Y17As-cast, 500 °C/6 weeks, DSC/XRD/EPMA
37Al60Si19Y21As-cast, 500 °C/6 weeks, DSC/XRD/EPMA
38Al60Si17Y23As-cast, 500 °C/6 weeks, DSC/XRD/EPMA
39Al60Si14Y26As-cast, 500 °C/6 weeks, DSC/XRD/EPMA
40Al60Si12Y28As-cast, 500 °C/6 weeks, DSC/XRD/EPMA
41Al60Si9Y31As-cast, 500 °C/6 weeks, DSC/XRD/EPMA
42Al60Si7Y33As-cast, 500 °C/6 weeks, DSC/XRD/EPMA
43Al60Si4Y36As-cast, 500 °C/6 weeks, DSC/XRD/EPMA
44Al60Si2Y38As-cast, 500 °C/6 weeks, DSC/XRD/EPMA
45Al14.9Si65.3Y19.8As-cast, 500 °C/6 weeks, XRD/EPMA
46Al8.4Si59.6Y32As-cast, 500 °C/6 weeks, XRD/EPMA
47Al39.1Si33.6Y27.3As-cast, 500 °C/6 weeks, XRD/EPMA
48Al30.7Si39.1Y30.2As-cast, 500 °C/6 weeks, XRD/EPMA
49Al25Si44.4Y30.6As-cast, 500 °C/6 weeks, XRD/EPMA
50Al20.3Si42.4Y37.3As-cast, 500 °C/6 weeks, XRD/EPMA
51Al20Si38.1Y41.9As-cast, 500 °C/6 weeks, XRD/EPMA
52Al14.1Si41.9Y44As-cast, 500 °C/6 weeks, XRD/EPMA
53Al15.2Si39Y45.8As-cast, 500 °C/6 weeks, XRD/EPMA
54Al9.8Si42.4Y48.8As-cast, 500 °C/6 weeks, XRD/EPMA
55Al5.2Si42Y52.8As-cast, 500 °C/6 weeks, XRD/EPMA
56Al10.6Si36.2Y53.2As-cast, 500 °C/6 weeks, XRD/EPMA
57Al28Si19.6Y52.4As-cast, 500 °C/6 weeks, XRD/EPMA
58Al17.1Si27.5Y55.4As-cast, 500 °C/6 weeks, XRD/EPMA
59Al32.1Si11.6Y56.3As-cast, 500 °C/6 weeks, XRD/EPMA
60Al23.5Si17.9Y58.6As-cast, 500 °C/6 weeks, XRD/EPMA
61Al36.3Si4.1Y59.6As-cast, 500 °C/6 weeks, XRD/EPMA
62Al29Si4.5Y66.5As-cast, 500 °C/6 weeks, XRD/EPMA
63Al7.6Si23.4Y69As-cast, 500 °C/6 weeks, XRD/EPMA
64Al17.1Si14Y68.9As-cast, 500 °C/6 weeks, XRD/EPMA
65Al6.3Si52.6Y41.1As-cast, 500 °C/6 weeks, XRD/EPMA
66Al41.9Si27.8Y30.2As-cast, 500 °C/6 weeks, XRD/EPMA
67Al35.4Si29.4Y35.2As-cast, 500 °C/6 weeks, XRD/EPMA
68Al23.9Si36.4Y39.7As-cast, 500 °C/6 weeks, XRD/EPMA
69Al64Si5.9Y30.1As-cast, 500 °C/6 weeks, XRD/EPMA
70Al44.6Si15.2Y40.2As-cast, 500 °C/6 weeks, XRD/EPMA
71Al34.2Si22.2Y43.6As-cast, 500 °C/6 weeks, XRD/EPMA
72Al23.3Si30.5Y46.2As-cast, 500 °C/6 weeks, XRD/EPMA
73Al10Si41.8Y48.2As-cast, 500 °C/6 weeks, XRD/EPMA
74Al9.7Si38.2Y52.1As-cast, 500 °C/6 weeks, XRD/EPMA
75Al2.7Si45.5Y51.8As-cast, 500 °C/6 weeks, XRD/EPMA
76Al8.3Si35.3Y56.4As-cast, 500 °C/6 weeks, XRD/EPMA
77Al53.1Si4.5Y42.4As-cast, 500 °C/6 weeks, XRD/EPMA
78Al46.6Si7.5Y45.9As-cast, 500 °C/6 weeks, XRD/EPMA
79Al32Si9Y59As-cast, 500 °C/6 weeks, XRD/EPMA
80Al12.1Si23Y64.9As-cast, 500 °C/6 weeks, XRD/EPMA
Table 2. Phase analysis results of the EPMA investigation of the representative annealed samples in the Al–Si–Y system.
Alloy No.Sample
Composition
Phase Composition (at.%)Treatment, Analysis
AlSiYPhase
55Al5.2Si42Y52.80.536.762.8Si3Y5Annealed at 500 °C for 6 weeks
10.737.951.4AlSi4Y5
3.35046.7SiY
56Al10.6Si36.2Y53.21.134.864.1Si3Y5Annealed at 500 °C for 6 weeks
20.528.850.7Al2Si3Y5
9.240.550.3AlSi4Y5
72Al23.3Si30.5Y46.217.534.647.9Al2Si3Y5Annealed at 500 °C for 6 weeks
9.739.850.5AlSi4Y5
65.80.633.6Al2Y
43Al60Si4Y3641.512.446.1AlYAnnealed at 500 °C for 6 weeks
660.333.7Al2Y
22.328.249.5Al2Si3Y5
32Al60Si36Y441.838.120.1Al2Si2YAnnealed at 500 °C for 6 weeks
0.499.60Al
98.81.20Si
36Al60Si23Y1741.538.819.7Al2Si2YAnnealed at 500 °C for 6 weeks
42.828.828.4Al3Si2Y2
99.20.80Al
26Al70Si10Y204427.228.8Al3Si2Y2Annealed at 500 °C for 6 weeks
70.54.624.9Al3Y
99.70.10.2Al
15Al80Si2.5Y17.5713.825.2Al3YAnnealed at 500 °C for 6 weeks
99.90.10Al
Publisher’s Note: MDPI stays neutral with regard to jurisdictional claims in published maps and institutional affiliations.

