Article

AM60-AlN Nanocomposite and AM60 Alloy Corrosion Activity in Simulated Marine-Coastal Ambience

1
Applied Physics Department, Center for Research and Advanced Studies (CINVESTAV), Merida 97310, Mexico
2
Helmholtz-Zentrum Hereon, Institute of Materials and Process Design, 21502 Geesthacht, Germany
*
Author to whom correspondence should be addressed.
Metals 2022, 12(12), 1997; https://doi.org/10.3390/met12121997
Submission received: 7 November 2022 / Revised: 16 November 2022 / Accepted: 19 November 2022 / Published: 22 November 2022

Abstract

:
The initial stages of AM60-AlN nanocomposite and AM60 corrosion behaviors were compared over 30 days of exposure to solution ( NaCl , Na 2 SO 4 and NaHCO 3 ), simulating the marine-coastal environment (SME). The incorporation of AlN nanoparticles (1.0 wt.%) in the AM60 alloy matrix favored the lower roughness of the AM60-AlN, associated with the grain refinement in the matrix. During the immersion of the alloys, pH of the SME solution shifted to alkaline values >9, and therefore, the solubility of AlN aluminum hydroxide phases were raised, followed by a slightly higher release of Mg-ions and corrosion rate increase. The chloride ions attributed to the unstability of the Al-Mn phase and Al ( OH ) 3 corrosion product was formed in a low content. The composite AM60-AlN presented lower value of the electrochemical noise resistance ( R n ) , suggesting that the corrosion process occurs with less difficulty. The localized corrosion near the Al-Mn cathodes seems to be stronger on the composite surface, in area and depth of penetration. The corrosion current fluctuations suggested that the corrosion is a weakly persistent process, dominated by the fractional Gaussian noise (fGn).

1. Introduction

Magnesium (Mg) and its alloys are alternative materials for aerospace and automotive industries, because of the Mg low density, which benefits the reduction in weight [1], as well as other excellent physical properties such as electromagnetic shielding and thermal conductivity [2,3]. The light materials allow to establish a more sustainable consumption of fuels by transport vehicles and a reduction of CO 2 and SO 2 emission, which will lower the atmospheric pollution [4]. Considering the environmental impact, lightweight automotive parts from magnesium alloys are designed more often [5]. For example, the production of 100 kg of gas emission could be avoided by substituting every 10 kg of steel by 4 kg of Mg [6]. In addition, only 4% of energy is required to produce Mg-alloys, using recycled Mg, due to its relatively low value of melting point and specific head, compared to other metals [4]. Therefore, the application of magnesium alloys has increased due to the prosperity they offer, to care for the environmental pollution [7,8,9].
However, Mg is susceptible to degradation (electrochemical corrosion) and on its surface, the main corrosion product is Mg ( OH ) 2 , assisted by the simultaneous evolution of hydrogen gas ( Mg + 2 H 2 O     Mg ( OH ) 2 + H 2 ) [10,11]. The degradation process is accelerated by the presence of Cl ions, characteristics of the marine-coastal environment [12], because the poorly soluble corrosion product of Mg ( OH ) 2 is partially transformed to highly soluble MgCl 2 ( 56 . 0   g   mL 1 ) [13].
With the addition of Al and Mn to the magnesium matrix, the AM series of alloys present an improved resistance to corrosion degradation, as a result of the Al 2 O 3 oxide passive film on the magnesium surface, and better strength, because of the addition of Mn [14,15]. Likewise, the Mn helps for a lower corrosion rate, eliminating heavy metal particles (as Fe and others), preventing the arrangement of anodic sites of damaging [16]. The secondary phase of β - Mg 17 Al 12 and that of Al-Mn intermetallic particles are the most common in the AM matrix.
After the exposure to a marine atmosphere up to 12 months, AM50 has presented localized surface attacks [17]. The Cl , SO 4 2 and HCO 3 ions, characteristic of the marine environments, may influence the degradation rate of Mg alloys. Exposed to a NaCl-containing atmosphere (in the absence of CO 2 ), the surfaces of AM20 and AM60 alloys presented strong pitting attacks on their surfaces. However, in the presence of CO 2 , the uniform and compact layer of Mg-hydroxy carbonate corrosion product blocked the anodic sites [18], in addition to the main Mg ( OH ) 2 [18]. As the carbonates are not conductive (electron transport), they cannot act as sites for the cathodic H 2 evolution, and the corrosion rate was reduced. Performed laboratory tests have demonstrated the effect of the air relative humidity, temperature and NaCl concentration on the AM50 corrosion rate [19]. Analytical electron microscopy study revealed the role of aluminum distribution on the corroded AM50 surface. At the interface, at specific locations, Al-rich layer of metallic character was identified, while thicker and porous layer of amorphous MgO/Mg(OH)2, and thin film of Al 2 O 3 were formed on the primary α-Mg grains [20]. The effect of several ions ( Ca 2 + , K + , SO42− and Mg 2 + ), present in artificial seawater, has been studied on the Mg corrosion behavior [21]. The results suggested that the incorporation of CaCl 2 (0.05 M) may favor the deposition of CaCO 3 on the Mg surface, acting as a physical barrier, diminishing the ccorrosion rate. It is considered that the SO 4 2 ions may absorb on an Mg surface and thus, inhibit the corrosion process against the aggressive Cl ions.
To improve the Mg-Al alloy deficiencies, particles with a low cost and density (SiC, Al 2 O 3 , TiC ,   TiB 2 , TiO 2 ,   ZrO 2 ,   SiO 2 , AlN, among others) have been introduced as reinforcement in the metal Mg-matrix [22]. In this way, Mg-Al composites (Mg-MMCs) and metal matrix nanocomposites (MMNCs) properties were improved: wear resistance, coefficient of thermal expansion, creep resistance, ductility, Young’s modulus, tensile strength, good process ability, economic efficiency and corrosion resistance [23,24,25,26]. This gain in properties is related to the reduced grain size of Mg-alloys and formed surface layers of lower porosity, introducing reinforcing particles [26]. In this aspect, the AZ and AM series of alloys are considered as structural materials used by the automotive industry [27]. Various techniques have been practiced for the manufacture of MMCs [28,29,30,31,32].
The aluminum nitride (AlN) has been introduced as reinforcement because of the similarity of AlN lattice parameters with those of Mg, diminishing the strain generated by the growth of magnesium structure [33]. The diversity in mechanical properties of AlN particles and Mg alloys and the combination of alloying elements can lead to development of interesting compounds for structural and electronic applications [34]. The incorporation of AlN as reinforcement has been studied [34,35,36,37,38,39,40], observing a refinement in grain size, higher thermal expansion coefficient and conductivity, improving in hardness, ductility, and electrical conductivity. Considering the high electrical resistivity ( 1   ×   10 12     cm ) , the greater (≈10 times) thermal conductivity of AlN than those of alumina [34], a coefficient of thermal expansion similar to that of silicon [41], the AlN reinforcement particles would have a “low galvanic effect” and the corrosion activity of Mg-matrix may decrease. In this aspect, the AlN particles are considered as an excellent choice for grain refinement of magnesium alloys [42,43]. AM60 nanocomposite (MMNc) has been produced by an ultrasound-assisted casting process, and 1 wt.% of AlN particles (≈80 nm of grain average size) has been included into the Mg-matrix [33].
Considering the effect of aggressivity of urban industrial atmospheres on the corrosion of metals, in our previous study [44], the AM60-AlN nanocomposite and AM60 alloy electrochemical activities have been characterized after exposure to an acid rain environment (SAR solution) for up to 30 days, which simulated the formation of aqueous layer at the metal surface at 100% air humidity. A denser and more efficient protective corrosion layer has grown on the composite alloy surface, ascribed to the AlN nanoparticles, which favored the slight grain size refinement of the nanocomposite.
Another very aggressive atmosphere is the marine-coastal, because of the presence of Cl-ions. In Mexico, there are around 11,000 km coastal zones, where the metal structure of the transport vehicles suffer accelerated corrosion process, the main cause for short service life. The purpose of the present research is to compare the AM60-AlN nanocomposite and AM60 alloy corrosion activities, during the exposure up to 30 days in a marine-coastal environment (SME solution), which simulated the formation of an aqueous layer at the metal surface at 100% air humidity. To characterize the process, the change in time of the SME pH and concentration of released Mg2+ ions was monitored, in order to correlate with the mass loss and free corrosion potential (OCP) values. The corrosion current fluctuations were analyzed in the time–frequency domain, examined as electrochemical noise, to identify the dynamics of the corrosion process.

2. Materials and Methods

2.1. Materials and SME Model Solution

According to the producer (Magontec, Bottrop, Germany), the nominal composition (wt.%) of the extruded AM60 alloy wires is: 6.0 Al, 0.2–0.4 Mn and the balance Mg. The aluminum nitride (AlN) nanoparticles (1.0 wt.%, average diameter of ≈80 nm) have been added under stirring (Tomsk State University, Russia) to the AM60 alloy. The characterization of the AlN nanoparticles has been reported [33,44,45]. The surface of the tested samples (10 mm of diameter and thickness of 2 mm) was polished (with SiC paper to 2000 grit), then sonicated in ethanol and dried at room temperature. Some of the samples were used for the immersion tests and others were adapted as electrodes for the electrochemical experiments.
The real-field atmospheric testing may take several years, and the variety of different and specific environmental parameters makes it difficult to compare data. An alternative approach is to use accelerated tests that produce data in a shorter time, or model solutions, simulating the metal interface covered by a thin layer of 100% humidity [44,46]. The model solutions allow one to obtain comparative results and to control the parameters during electrochemical tests.
To simulate the marine-coastal environment, a solution named as SME was prepared with analytical grade reagents, dissolved in ultrapure deionized water (18.2 MΩ): 5 . 84   g   L 1   NaCl , 4 . 09   g   L 1   Na 2 SO 4 and 0 . 20   g   L 1   NaHCO 3 . The as-formed pH solution was 7.94.

2.2. Immersion Test and Analysis of Surface

The samples of AM60 and AM60-AlN were immersed for 1, 7, 10, 15 and 30 days in 20 mL of SME (in triplicate), in independent containers, according to ASTM G31-12a [47]. At the end of the immersion periods, the samples were withdrawn, washed and dried at room temperature. The stored waste solutions were monitored for the change in time of pH and Mg-released ion release (HI83200, Hanna Instruments, Woonsocket, RI, USA). In order to evaluate the mass loss, the layer of corrosion products was chemically removed, according to ASTM G1-03 [48], using the solution of 200   g   L 1 of CrO 3 , 10   g   L 1 of AgNO 3 and 20 g L1 of Ba ( NO 3 ) 2 . To calculate the mass loss, the initial (w0) and final mass (w1) of the samples were measured by an analytical balance (VE-204, Velab, CDMX, México), and the annual corrosion rate (CR) was calculated (Equation (1)) as indicated by ASTM G1-03 [48]:
C R = ( K   ×   W )   ×   ( A   ×   T   ×   D ) 1  
where K is a constant ( 8 . 76   ×   10 4 ) , W is the mass loss (g), A is the surface area ( cm 2 ) , T is the time of exposure (h), and D is the metal density ( g   cm 3 ) .
The roughness of the studied samples was obtained using a 3D optical profilometer (ContourGT-X, Bruker Nano Surfaces, San Jose, CA, USA). The change in the surface morphology and composition of the corrosion layers, also evaluated from the metal cross-sections as well, were acquired by scanning electron microscope and energy dispersive spectroscopy (SEM-EDS, XL-30 ESEM-JEOL JSM-7600, JEOL Ltd., Tokyo, Japan). XPS spectroscopy (K-Alpha Surface Analyzer, Thermo-Scientific, Waltham, MA, USA) was used to provide additional information, normalizing the binding energies of all XPS spectra to the C1s peak at 284.8 eV.

2.3. Electrochemical Methods

The registration of the change in time of free corrosion potential (OCP) values and corrosion current fluctuations (at OCP) was carried out during the immersion of the working electrodes (0.78 cm2) of the studied alloys in SME solution. The saturated calomel reference electrode (SCE, CH Instruments Inc., Austin, TX, USA) and the working electrodes were connected to the potentiostat/galvanostat/ZRA (Gamry Instruments, Philadelphia, PA, USA).
The observed spontaneous corrosion current fluctuations, characteristics of the corrosion phenomena, were recorded over 3 h, using two nominally identical working electrodes ( 0 . 78   cm 2 ) and the saturated reference calomel electrode, connected to a zero-resistance ammeter (ZRA) [49]. The sampling interval was 0.1 s. According to the amplitude of the fluctuations, these were onsidered as electrochemical noise (EN), as described in ASTM G199-09 [49]. The time data were normalized by substrating the mean value and dividing by the standard deviation, and the DC trend has been removed from the current fluctuations, using a third-order detrending method. In order to examine their power spectral density (PSD), the data were analyzed by software (Gamry Instruments, Electrochemical Signal Analyzer ® V.7.0.1, Philadelphia, PA, USA). The values of the β-slope, as an exponent of the PSD slopes, were used to characterize the dynamics of the corrosion process [50,51]. All experiments were carried out at room temperature of 21 °C.

3. Results and Discussion

3.1. Microstructure of AM60-AlN and AM60

In our previous work [44], optical images of AM60-AlN and AM60 (longitudinal section, extrusion direction and cross-section) were reported. The introduction of the AlN nanoparticles resulted in a grain size reduction of 12% and in a slight 7% increase of the Vickers hardness of AM60 alloy. The XRD patterns of AM60-AlN nanocomposite and AM60 alloy revealed the characteristic peaks of the Mg-matrix, and at low intensity, the peaks of Al-Mn intermetallic particles and secondary phase of β-Mg17Al12. The aluminum nitride peaks were not detected, because of the non-uniform surface distribution of AlN nanoparticles. SEM images of AM60-AlN nanocomposite and AM60 surfaces of reference sample are shown in Figure 1. EDS elemental analysis has suggested that on the α-Mg-matrix (zone 1), clusters of intermetallic Mn-rich particles of AlMn appear (zone 2) and the presence of C and O elements was attributed to nucleated particles of Al-C-O ( Al 2 CO ) [52]. The nanoparticles of AlN (zone 3, Figure 1a) seem to be “attached” to AlMn particles, forming a cluster. The β-Mg17Al12 secondary phase (zone 4) is present in both alloys.
Figure 2 compares the average roughness ( R a ) of AM60-AlN nanocomposite and AM60 alloy surfaces. The values suggest that the nanocomposite presents ≈15% decrease in the roughness, compared to that of AM60, attributed to the incorporation of the AlN nanoparticles that allowed the diminishing in grain size.

3.2. Solution Monitoring and Mass Loss

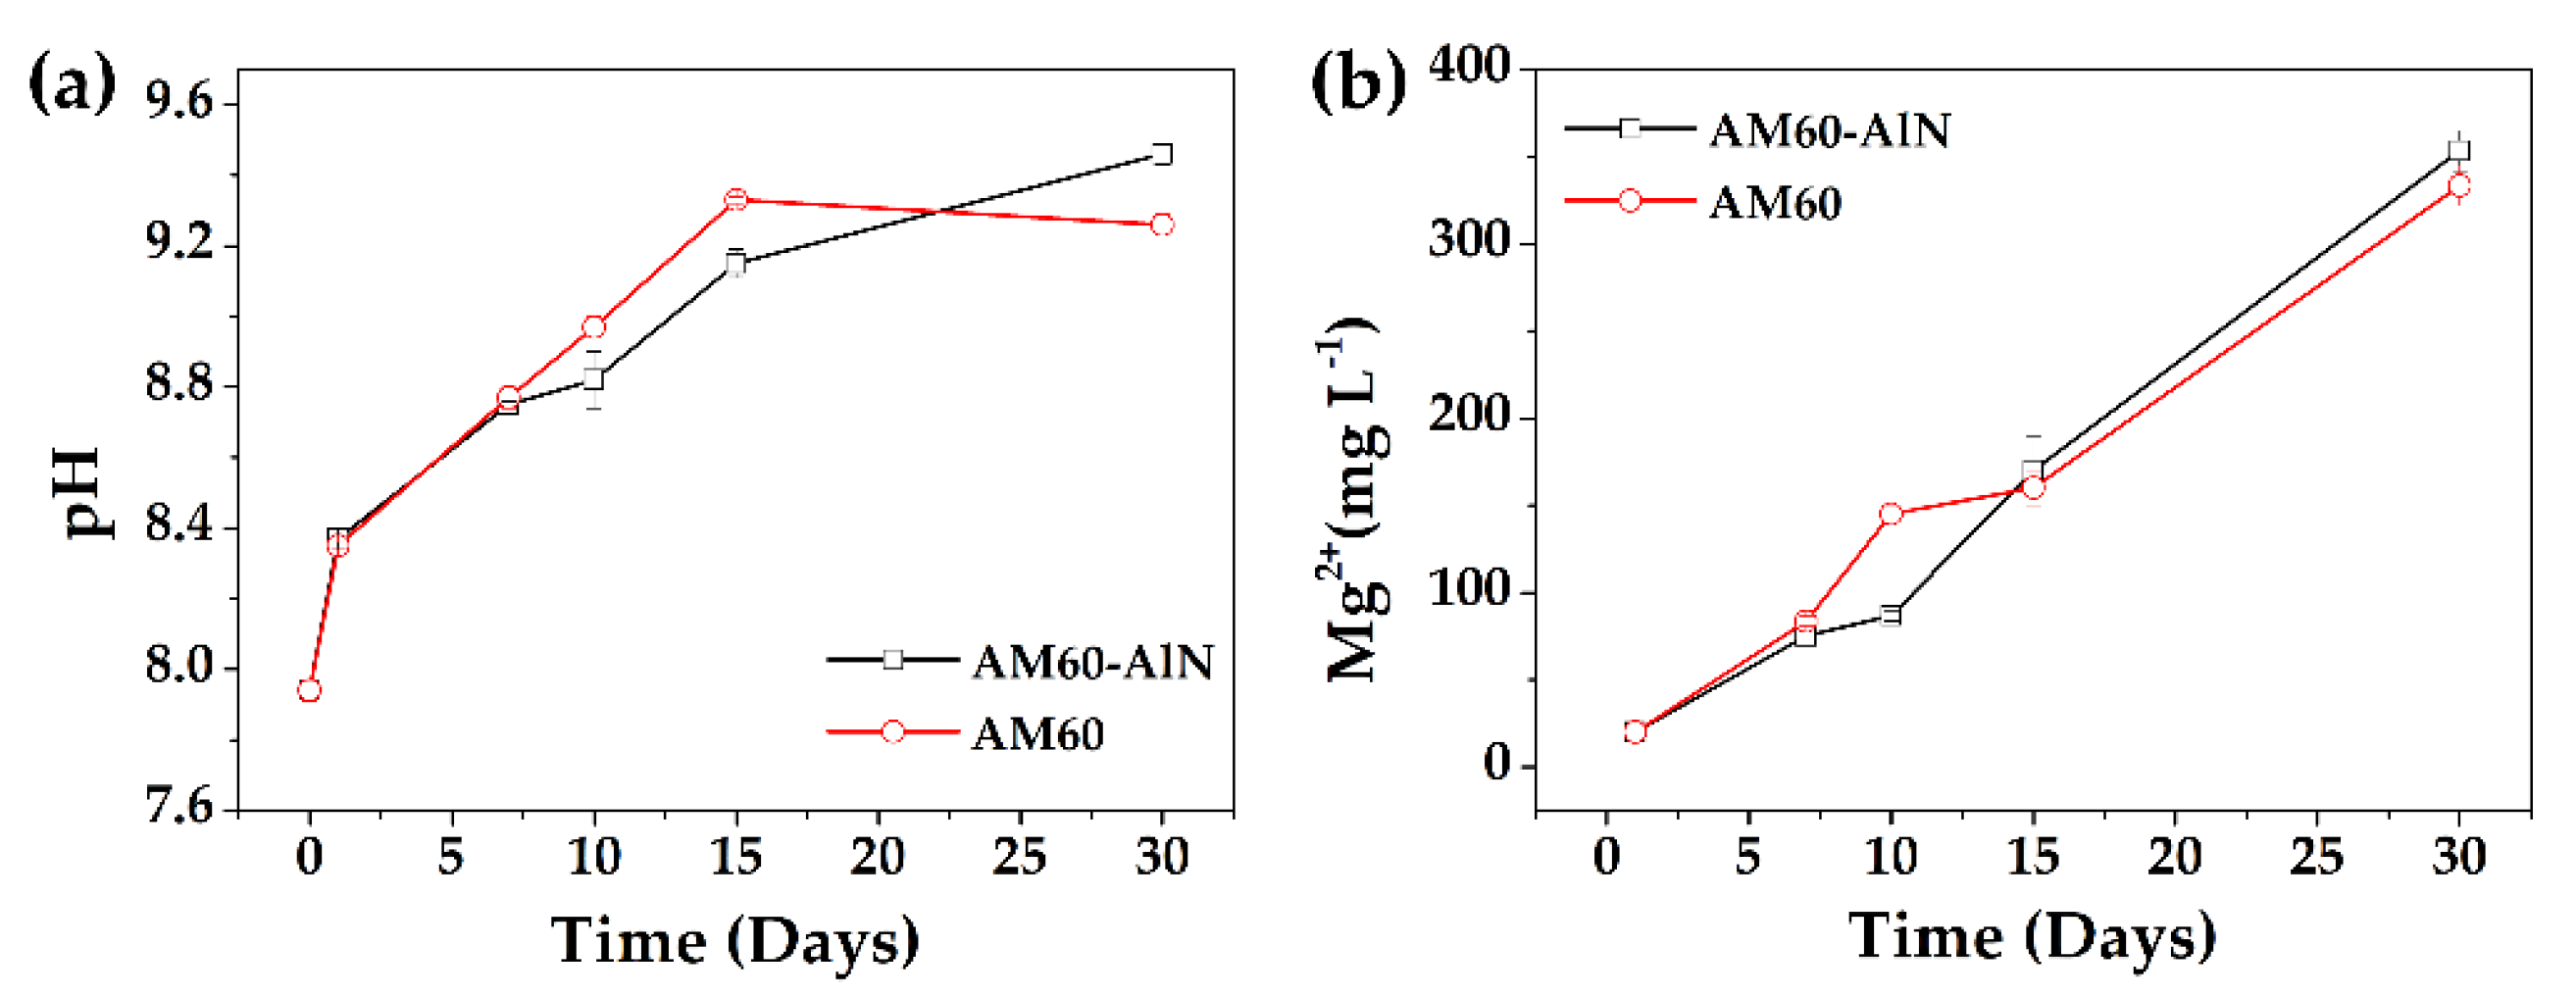
After the first 24 h, the pH of SME solution tends to more alkaline value (pH = 8.35–8.36), gradually rising at 15 days and reaching pH = 9.15 during the exposure of AM60-AlN and pH = 9.36 for AM60 alloy (Figure 3a). However, after 30 days of immersion, and the end of the experiments, pH for the AM60 alloy represented a decrease of approximately 3%, compared to that of AM60-AlN nanocomposite. According to study [41], when there was an over pH range of 5.5–12, the AlN may corrode and its corrosion products (Equations (2)–(4)) act as a protective physical barrier, decreasing the AlN corrosion rate. However, the solubility of the corrosion aluminum hydroxide phases increases at pH > 9.5, and the corrosion of AlN may rise. Due to the porosity of the Al-hydroxide layer, high in a specific surface area, water, anions (such as Cl ions) and hydrated cations may be absorbed reversible.
AlN + H 2 O     AlOOH ( amorph ) + NH 3
NH 3   + H 2 O     NH 4 + + OH
AlOOH ( amorph ) + H 2 O Al ( OH ) 3
The change in time of pH is associated with the progress of Mg-matrix anodic dissolution (corrosion), accompanied by the H 2 gas evolution (the main cathodic reaction), when the insoluble corrosion product of   Mg ( OH ) 2   is formed on the surface [10,53]:
Mg + 2 H 2 O     Mg ( OH ) 2   + H 2
However, the SME solution contains chloride ions (NaCl), which may penetrate the pores of the Mg ( OH ) 2 insoluble corrosion layer ( 0.69   mg   L 1 ), transforming into soluble MgCl 2 ( 56 . 0   mg   L 1 [13]), and the release of   OH and Mg 2 + ions occurs (Equations (6) and (7)):
Mg ( OH ) 2 + 2 Cl     MgCl 2   + 2 OH
MgCl 2 Mg 2 + + 2 Cl
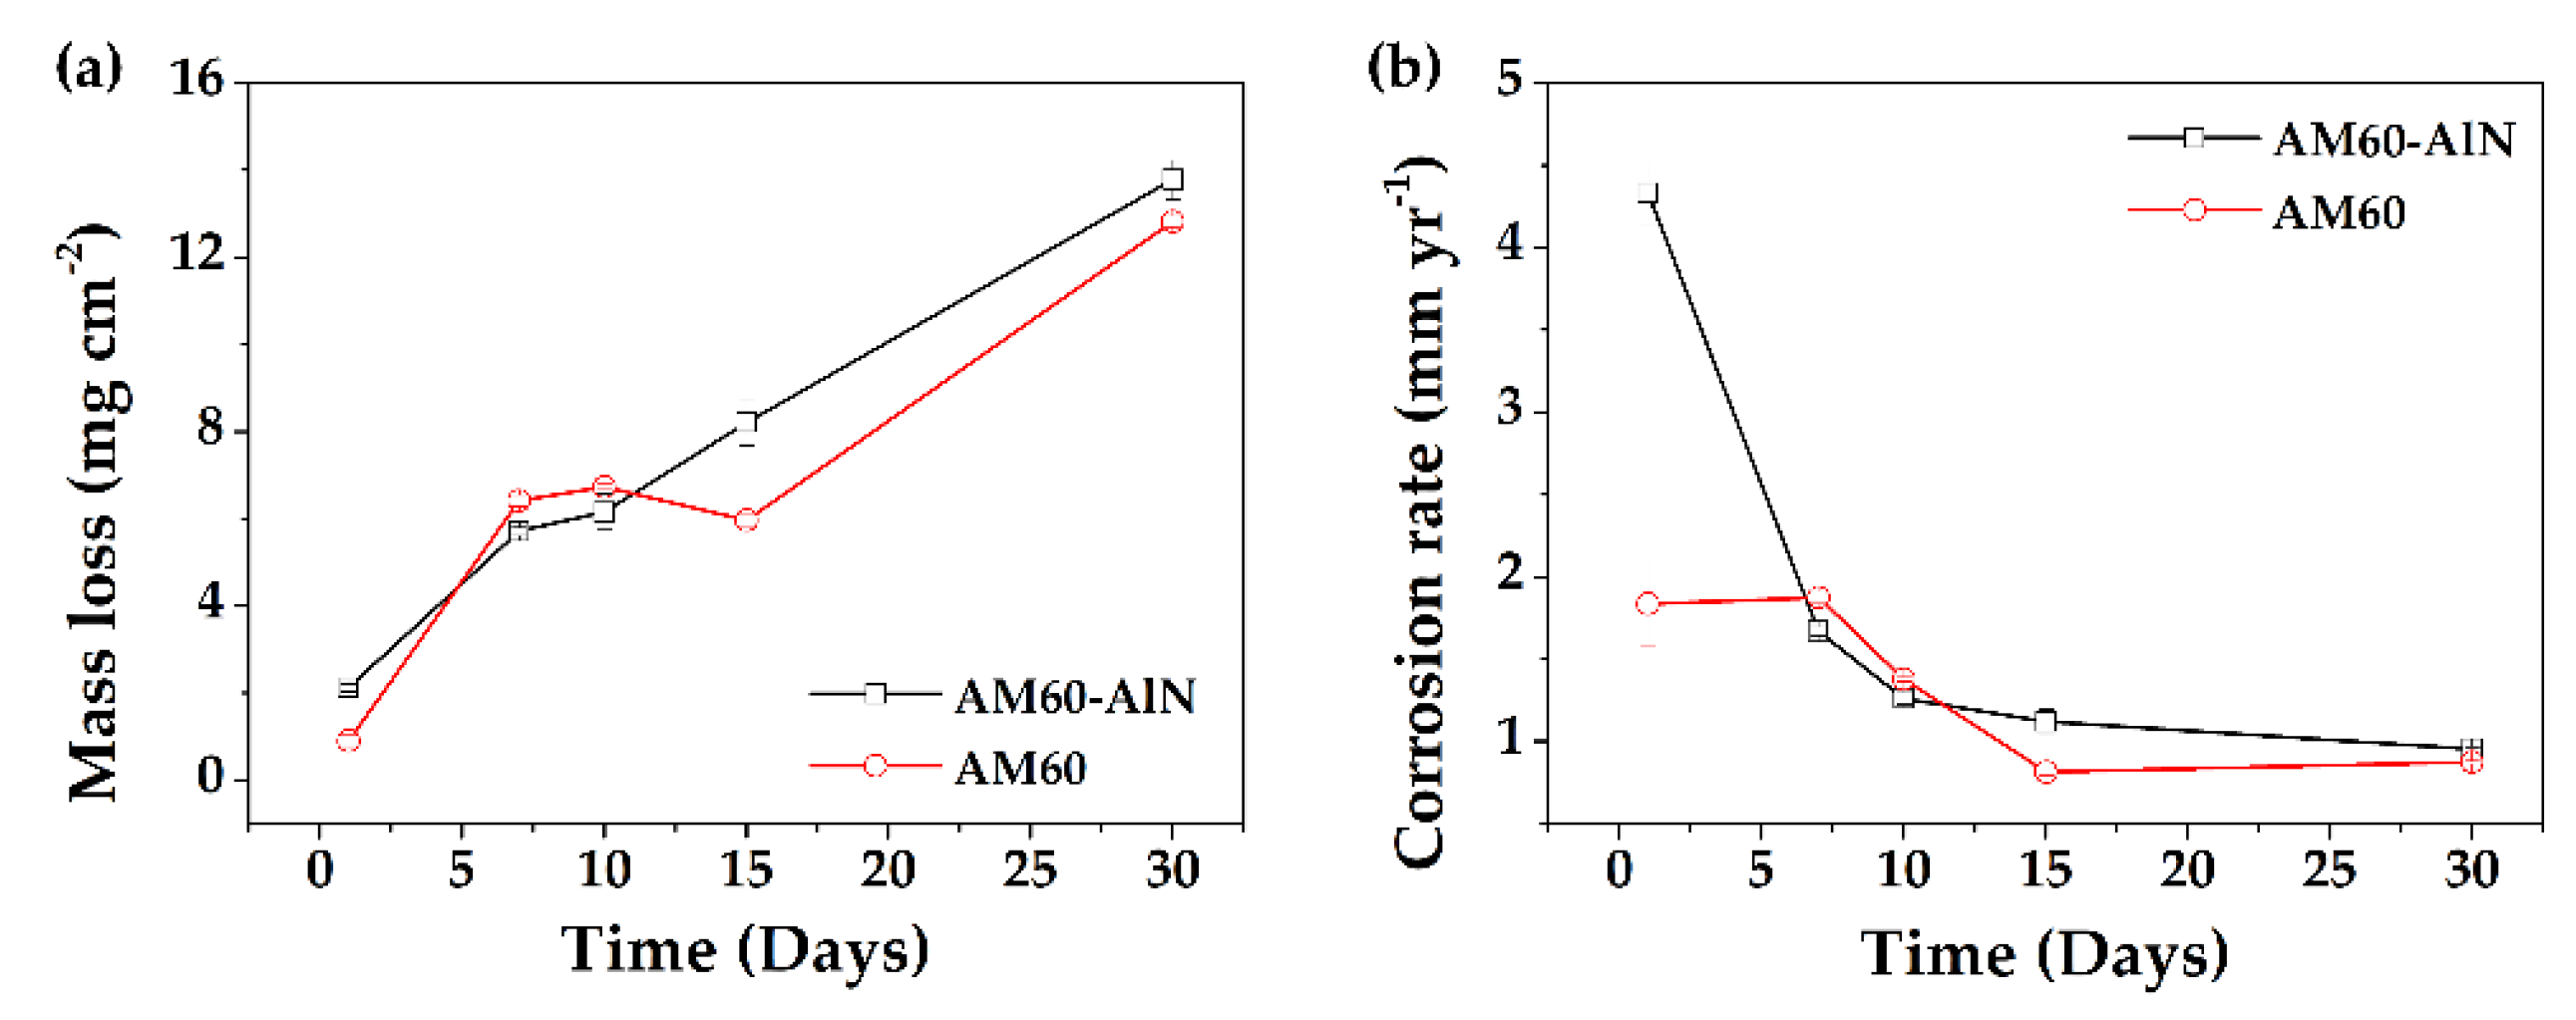
Figure 3b shows that the concentration of the realized Mg 2 + ions increases and after 10 days, the value reaches 86.7   mg   L 1 for AM60-AlN nanocomposite and 145 . 0   mg   L 1 for AM60 alloy, subsequently. However, up to 30 days of immersion, the samples of AM60-AlN and AM60 maintained an increase in the concentration of Mg 2 + , due to the continued influence of the Cl ions. The composite revealed a higher concentration of Mg 2 + as a result of the more alkaline value of pH of SEM solution (Figure 3a), which promoted the solubility of the aluminum hydroxide phases of AlN (Equation (4)). In this way, the efficiency of the protective AlN nanoparticles barrier diminishes, followed by higher corrosion rate of the composite [41]. This fact was confirmed by the rise in the mass loss values of A60-AlN, compared to those of the AM60 alloy (Figure 4).
During the immersion time up to 7 days (Figure 4a), the mass loss of AM60 and AM60-AlN samples (as a measure of the corrosion rate) increased and remained relatively constant ( 6 7   mg   cm 2 ) . This evidence was attributed to an accumulated corrosion layer on their surfaces, preventing the corrosion advance. However, later, the mass loss reached higher values, being greater for the nanocomposite ( 13 . 78   ±   0 . 45   mg   cm 2 ) , when the soluble corrosion layer of Mg ( OH ) 2 was transformed to soluble MgCl 2 (Equations (6) and (7)), influenced by the penetration of chloride ions through the layer pores.

3.3. Electrochemical Measurement

During the immersion of AM60-AlN nanocomposite and AM60 alloy in SME solution up to 30 days, the free corrosion potential (OCP, open circuit potential) shifted to less negative values in ≈90–100 mV (Table 1). This fact was associated with the change in time of the layer composition and its protective efficiency, influenced by the chloride ions [54]. It seems that although the partial dissolution of the soluble corrosion product of MgCl 2 occurs, the layers were maintained on the surface. It may be noted that the OCP value of the composite is in ≈10 mV less positive, ascribed to more tendency for corrosion.
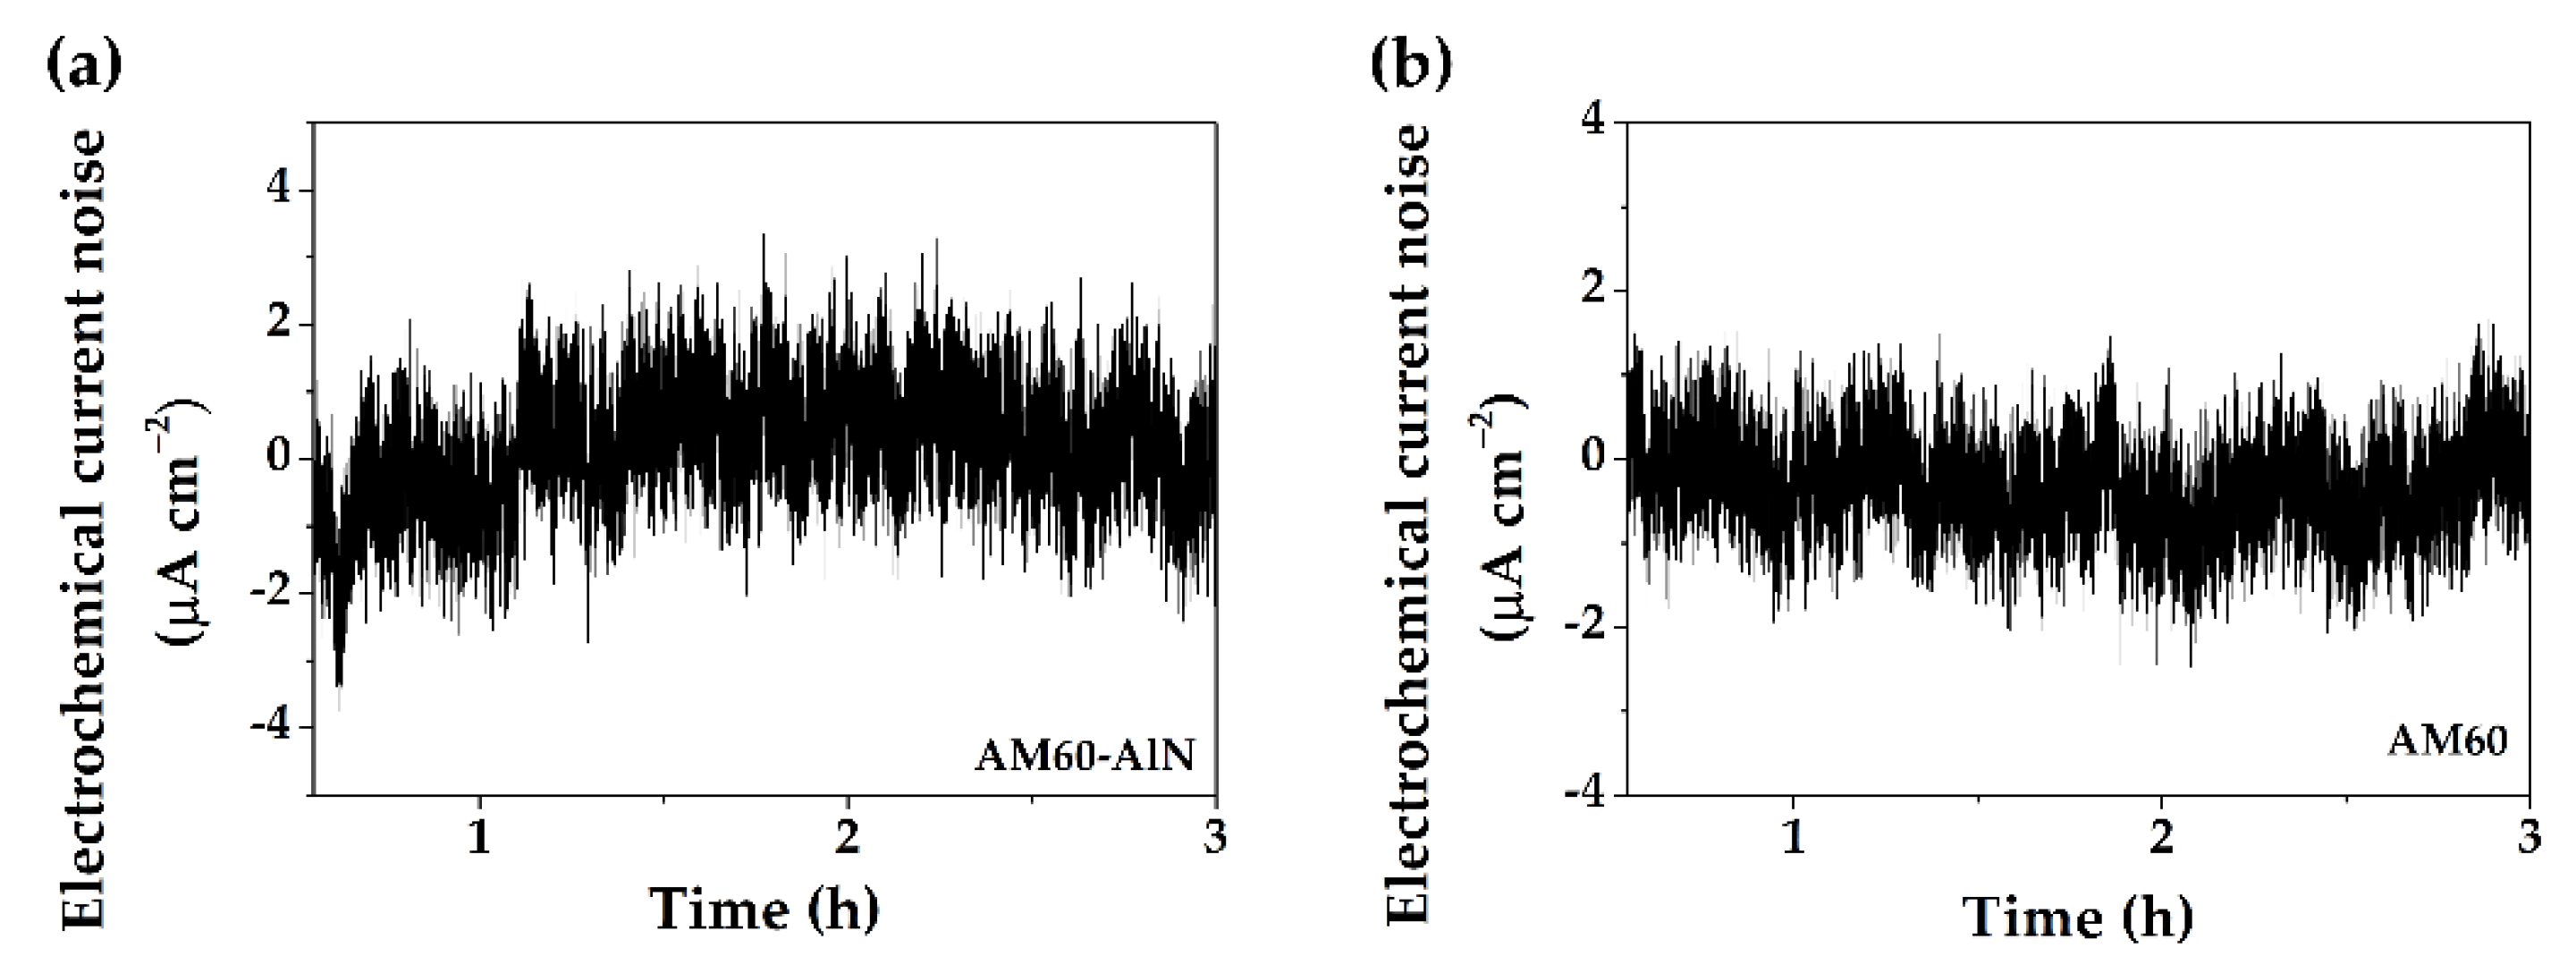
Figure 5 presents the fluctuations in the free corrosion current density (at OCP) at 30 days of immersion in SME model solution of the nanocomposite AM60-AlN (Figure 5a) and AM60 alloy (Figure 5b). The corrosion current signals at the metal surface, being in contact with the solution, were considered as an electrochemical noise (EN), because they are typically of low-level amplitude [49], caused by the spontaneous natural variations in the time of the electrochemical process kinetics [55,56,57,58,59,60,61].
The amplitudes of the EN oscillations are considered usually as an indicator for the initiation and propagation of the localized pitting corrosion at the early stages, changes in the morphology and composition of the layers formed on the surface, influenced by the presence of chloride ions [54], among others. A larger amplitude of the electrochemical current noise can be observed in the case of the AM60-AlN composite (Figure 5a), ascribed to more accelerated corrosion kinetics, than that of AM60-alloy (Figure 5b). These facts correlated well with those of the concentration of Mg 2 + ions release (Figure 3b) and mass loss (Figure 4a), in which values suggested that the AM60-AlN composite has suffered more degradation than AM60 alloy during the immersion in the SME model solution.
The data analysis enabled to calculate the electrochemical noise resistance R n values [49], considered as an equivalent to the values of polarization resistance ( R p ) [55,56,57,58,59,60,61]:
R n = σ E σ I A  
where σ E corresponds to the standard deviation of the potential, σ I is the standard deviation of the current and A is the area.
The change in time of R n values is present in Table 2. It can be noted that the value of AM60-AlN composite at 30 days was lower than that of AM60 alloy, suggesting that the corrosion process of the nanocomposite occurs with less difficulty in the SME solution. This fact collaborates well with the higher mass loss of the composite presented at 30 days of immersion in SME solution (Figure 4).
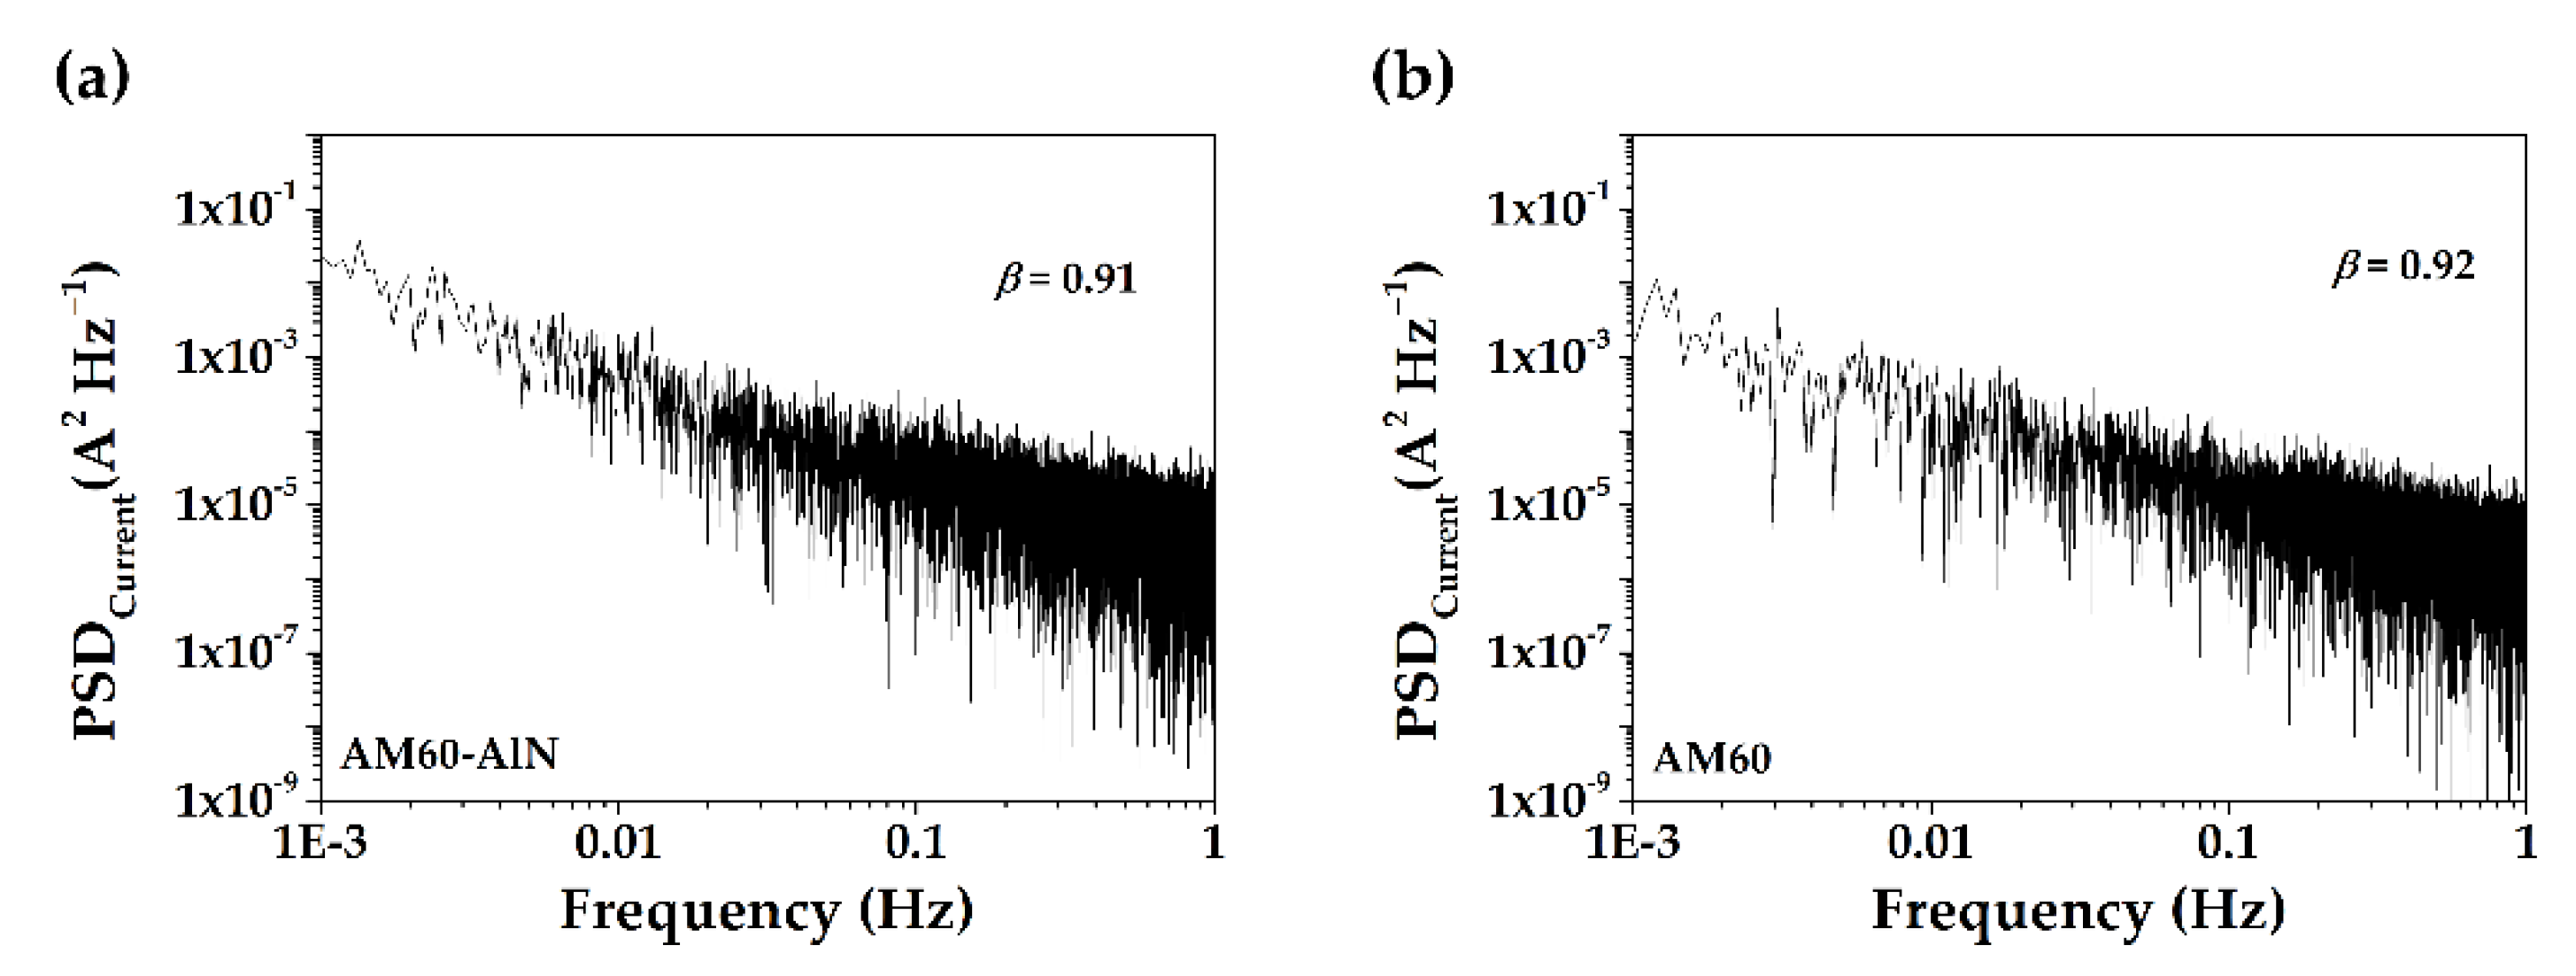
The traditional way to analyze the EN fluctuations has been to transform the time records in the frequency domain, in order to obtain their power spectral density (PSD) plots [59]. Figure 6 compares the PSD for the composite AM60-AlN and AM60 alloy, at 30 days of immersion in the simulated marine-coastal environment (SME model solution). The decrease of the PDS slopes (−β exponent) indicated a release of spontaneous energy from the studied surfaces during their corrosion process. The obtained values of β exponent (0.91 and 0.92) are similar and they could be a consequence of a weakly persistent corrosion process, dominated by fractional Gaussian noise (fGn, −1 < β < 1) [50,51,62]. The localized corrosion attacks on the studied alloy surfaces were confirmed by the SEM images.

3.4. Surface Characterization after Immersion in SME

3.4.1. SEM-EDS Analysis

After 30 days of exposure of AM60-AlN and AM60 to a simulated marine environment (SME) (Figure 7), the layers of corrosion products were cracked (Figure 7a,b), facilitatating the penetration of Cl ions, with posterior release of the Mg 2 + ions and the evolution of H 2 . The fracture and eventual local detachment of the corrosion layer has been probably favored by the H 2 bubble pressure. Figure 7c,d present the surfaces of AM60-AlN and AM60 alloy, after elimination of corrsion layers.
The Al-Mn intermetallic particles of the Mn-rich phase (zone 1) were observed on the corroded surfaces (Figure 7a,b), confirmed by EDS analysis (Table 3), as well as also after the elimination of the corrosion layers (Figure 7c,d). These particles are considered as local efficient cathodes [63,64,65,66], accelerating in their vicinity the corrosion of the Mg-matrix (active anodic area). The chloride ions of the SME solution can lead the Al-Mn to an unstable phase, which corrodes forming Al(OH)3 with its posterior delamination [66]. Thus, it can be considered that to the Al content (zone 1, Table 3) contributed the corrosion products of Al-Mn phase and nanoparticles of AlN (Equations (2)–(4)) at pH > 9. The high Mg and oxygen contents (zones 2 and 3) were ascribed to the main corrosion product of Mg ( OH ) 2 . The β-Mg17Al12 secondary phase was not observed, although its presence on the reference sample surfaces was suggested by the SEM-EDS analysis (Figure 1). The corrosion behavior of Mg and the Mg17Al12 secondary phase has been studied in 3.5% NaCl solution and the results indicated that the corrosion rate of Mg was lower than that of the β-Mg17Al12 phase; on the β-phase surface was observed deep corrosion pitting [62].
The cross-sectional SEM images are examples for the AM60-AlM composite (Figure 7e) and AM60 alloy (Figure 7f), and present the depths of the localized corrosion attacks. On the AM60-AlN surface, the maximum depth of penetration may consider as ≈246.4 µm, with an average of ≈175.7 µm; on the AM60 alloy surface, the maximum depth is ≈178.0 µm, with an average of ≈121.4 µm. The β-Mg17Al12 secondary phase should be considered as surface locations of the corrosion pits [67].

3.4.2. XPS Spectra Analysis

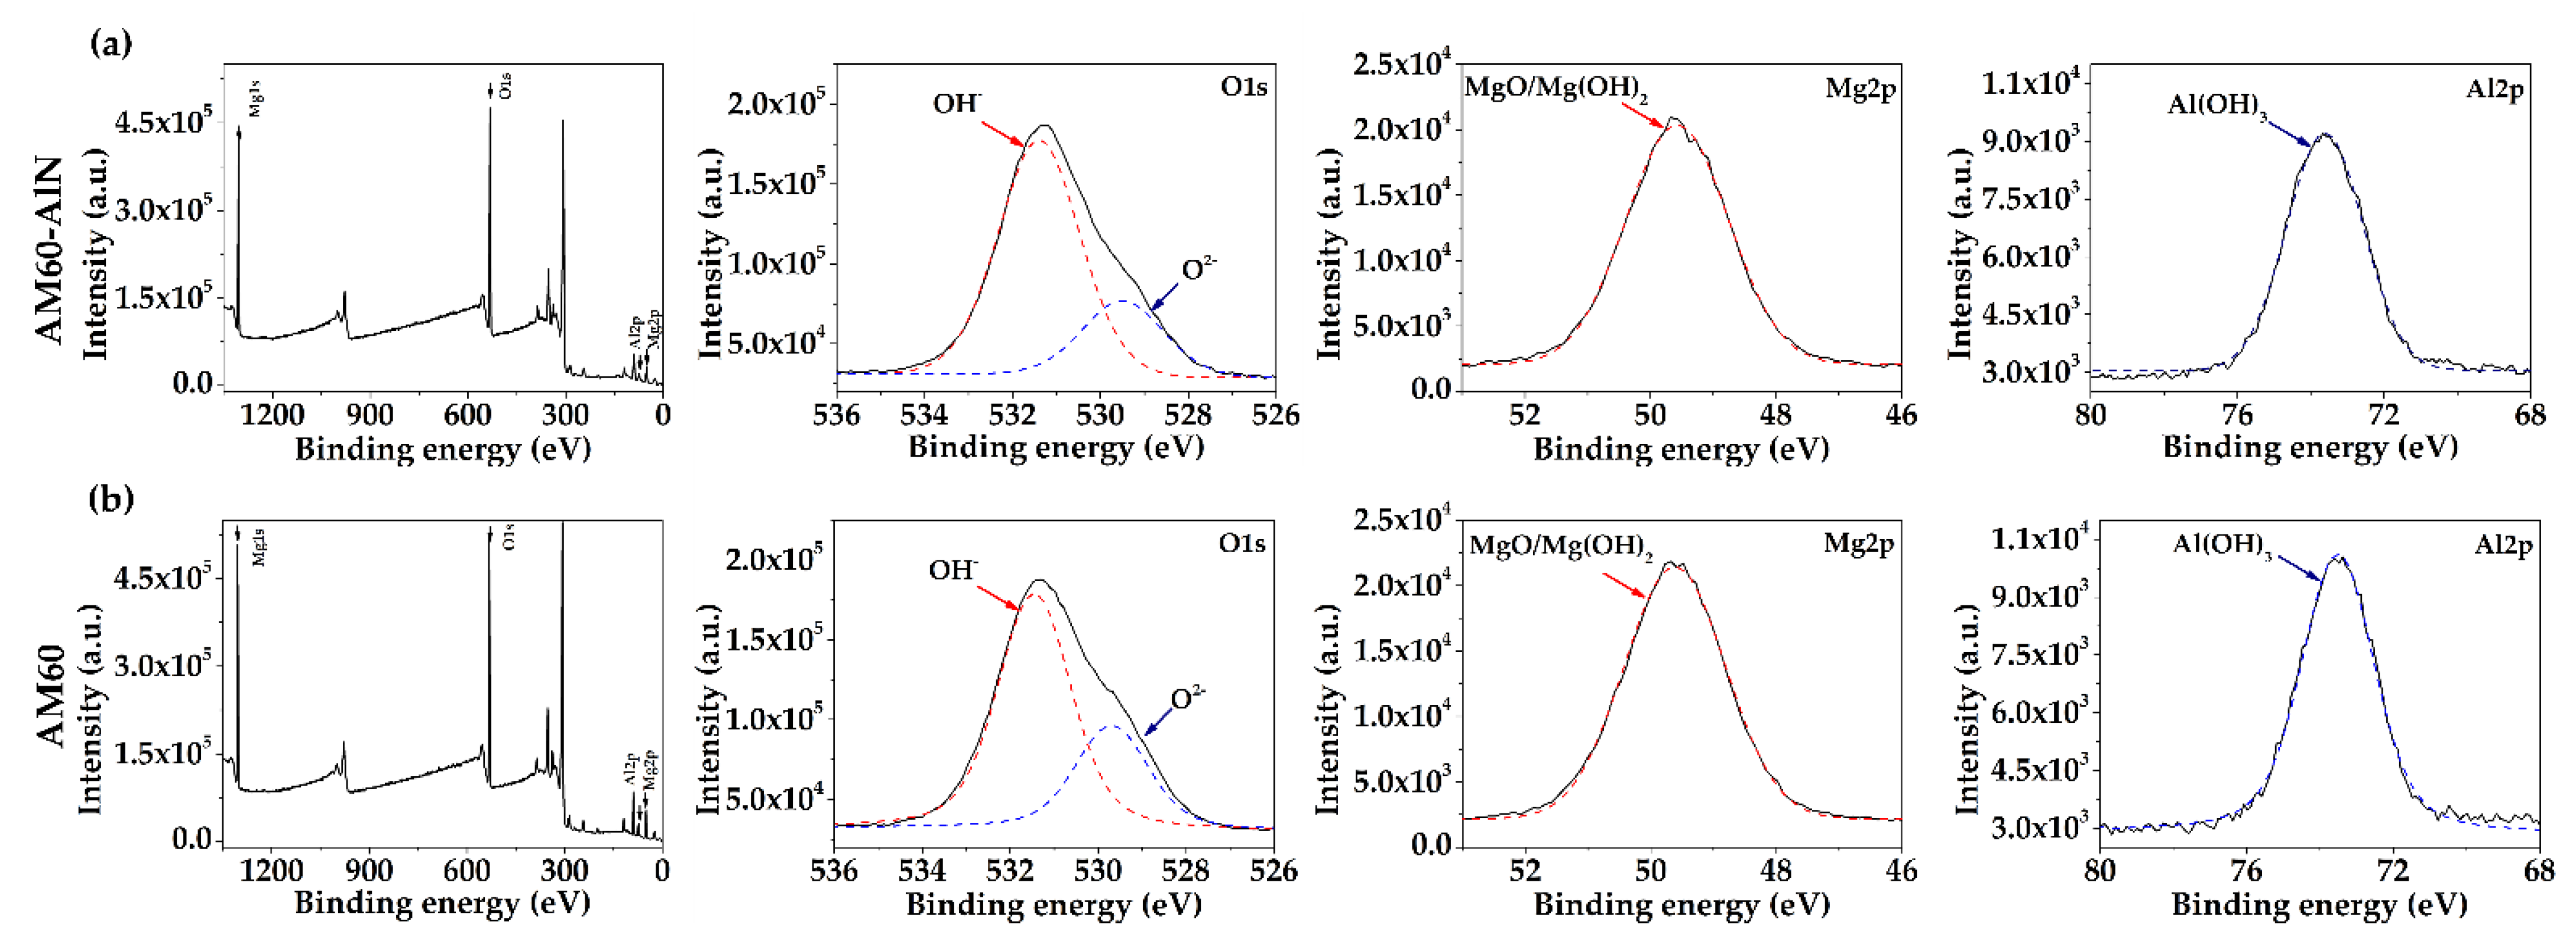
As an auxiliary information to EDS element composition of the corrosion layers (Table 3), XPS spectrum analysis was performed, based on the binding energies of O1s, Mg2p and Al2p (Figure 8). The high signal of O1s peak at 531.6 eV was attributed to OH , assigned to Mg ( OH ) 2 , the main corrosion product and to Al(OH)3 corrosion product. The lower signal of oxygen at 529.9 eV was associated with MgO ( O 2 ) . The Mg2p high-resolution signal makes the contribution of MgO and [68,69,70]. The signal of Al2p suggested the presence of Al ( OH ) 3 corrosion product [71].

4. Conclusions

The corrosion progress of magnesium-aluminum AM60-AlN nanocomposite was compared with that of AM60 alloy, after their immersion for up to 30 days in SME solution, which simulated the marine-coastal environment. According to the SEM-EDS analysis, the secondary phases of β-Mg17Al12 and Mn-rich intermetallic particles (AlMn) are present on the Mg-matrix surface. The AlN nanoparticles are connected to Mn-rich intermetallic particles (AlMn), forming clusters.
  • The nanocomposite presented ≈15% decrease in the roughness, attributed to the incorporation of the AlN nanoparticles that allowed the diminishing in grain size.
  • During the immersion of the studied alloys, the initial pH value (7.94) of the SME solution shifted to more alkaline values (>9), which lead to an instablity of the AlN, followed by a slight rise in the Mg-matrix corrosion and release of Mg-ions over time, influenced by the presence of Cl-ions in the SME solution.
  • According to SEM-EDS and XPS analysis, the main corrosion products of the Mg-matrix was Mg ( OH ) 2 , accompanied by MgO , as well as also by a low content of Al ( OH ) 3 corrosion product, attributed to the Al-Mn phase and AlN particles corrosion at pH >9, in the presence of chloride ions.
  • The corrosion layers on the alloy surfaces showed cracks, which may favor the chloride ion penetration to the Mg-matrix. After removal of the corrosion layers, the Al-Mn intermetallic particles remained on the alloy surfaces and were considered as efficient local cathodes, accelerating in their vicinity the corrosion attack of the Mg-matrix.
  • The electrochemical noise resistance ( R n ) , as an equivalent to the polarization resistance, showed that AM60-AlN nanocomposite value was lower at 30 days than that of AM60 alloy, which in fact suggested that the progress in the corrosion of the nanocomposite occurred with less difficulty.
  • The corrosion current fluctuations were classified as electrochemical noise (EN) and their power spectral density (PSD) plots, β exponent values, suggested that the corrosion process is weakly persistent localized, dominated by fractional Gaussian noise (fGn).
  • Cross-sectional SEM images revealed higher depths of localized corrosion attacks on the AM60-AlN nanocomposite surface. The β-Mg17Al12 secondary phase was considered as surface locations for corrosion pits.
  • The results of this study suggest that the surfaces of the studied alloys will need a posterior treatment and/or application of protective coatings to improve the corrosion resistance in the presence of chloride ions, which are characteristics of the marine-coastal environment.

Author Contributions

L.C. and G.S. performed the corrosion test. H.D. contributed to the microstructural analysis of AM60 and AM60-AlN surfaces. L.C. and L.V. discussed the results and wrote the manuscript. L.V. supervised the project. All correspondence should be addressed to L.V. All authors have read and agreed to the published version of the manuscript.

Funding

FOMIX-Yucatán 2008-108160, CONACYT LAB-2009-01-123913.

Institutional Review Board Statement

Not applicable.

Informed Consent Statement

Not applicable.

Data Availability Statement

Data presented in this study are available upon request from the corresponding author. The data are not public due to privacy issues.

Acknowledgments

Luis Chavez and Gerardo Sánchez acknowledge the Mexican National Council for Science and Technology (CONACYT) for the scholarship granted to them for their Ph.D. study. The authors gratefully thank the National Laboratory of Nano and Biomaterials (LANNBIO-CINVESTAV) for allowing the use of XRD, SEM-EDS and XPS facilities, and to Daniel Aguilar, Victor Rejón and Willian Cauich for their support in data acquisition.

Conflicts of Interest

The authors declare no conflict of interest.

References

  1. Zhang, T.; Shao, Y.; Meng, G.; Wang, F. Electrochemical noise analysis of the corrosion of AZ91D magnesium alloy in alkaline chloride solution. Electrochim. Acta 2007, 53, 561–568. [Google Scholar] [CrossRef]
  2. Schumann, S.; Friedrich, H.E. Engineering Requirements, Strategies and Examplaes. In Magnesium Technology: Metallurgy, Design Data, Applications; Friedrich, H.E., Mordike, B.L., Eds.; Springer: Berlin/Heidelberg, Germany, 2006; pp. 499–632. [Google Scholar] [CrossRef]
  3. Li, S.; Yang, X.; Hou, J.; Du, W. A review on thermal conductivity of magnesium and its alloys. J. Magnes. Alloy. 2020, 8, 78–90. [Google Scholar] [CrossRef]
  4. Watarai, H. Trend of research and development for magnesium alloys-Reducing the weight of structural materials in motor vehicles. Sci. Technol. Trends. 2006, 18, 84–97. [Google Scholar]
  5. Mordike, B.L.; Ebert, T. Magnesium: Properties—Applications—Potential. Mater. Sci. Eng. A 2001, 302, 37–45. [Google Scholar] [CrossRef]
  6. Pardo, A.; Merino, M.C.; Coy, A.E.; Arrabal, R.; Feliú, S., Jr. Influence of microstructure and composition on the corrosion behaviour of Mg/Al alloys in chloride media. Electrochim. Acta 2008, 53, 7890–7902. [Google Scholar] [CrossRef]
  7. Brady, M.P.; Joost, W.J.; Warren, C.D. Insights from a recent meeting: Current status and future directions in magnesium corrosion research. Corrosion 2017, 73, 452–462. [Google Scholar] [CrossRef]
  8. Esmaily, M.; Svensson, J.E.; Fajardo, S.; Birbillis, N.; Frankel, G.S.; Virtanen, S.; Arrabal, R.; Thomas, S.; Johansson, L.G. Fundamentals and advances in magnesium alloy corrosion. Prog. Mater. Sci. 2017, 89, 92–193. [Google Scholar] [CrossRef]
  9. Nguyen, Q.B.; Sim, Y.H.M.; Gupta, M.; Lim, C.Y.J. Tribology characteristics of magnesium alloy AZ31B and its composites. Tribol. Int. 2015, 82, 464–471. [Google Scholar] [CrossRef]
  10. Makar, G.; Kruger, J. Corrosion of magnesium. Int. Mater. Rev. 1993, 38, 138–153. [Google Scholar] [CrossRef]
  11. Pourbaix, M. Atlas of Electrochemical Equilibria in Aqueous Solutions; National Assoc Corrosion Engineers: Houston, TX, USA, 1974. [Google Scholar]
  12. Cui, Z.Y.; Li, X.G.; Dong, C.F.; Liu, Z.Y.; Wang, L.W. Pitting corrosion behaviour of AZ31 magnesium in tropical marine atmosphere. Corros. Eng. Sci. Technol. 2014, 49, 363–371. [Google Scholar] [CrossRef]
  13. Haynes, W.M. Properties of the elements and inorganic compounds. In CRC Handbook of Chemistry and Physics, 97th ed.; Haynes, W.M., Ed.; CRC Press Technology: Boca Raton, FL, USA, 2017; pp. 4–71. [Google Scholar]
  14. Song, G.L.; Atrens, A. Corrosion mechanisms of magnesium alloys. Adv. Eng. Mater. 1999, 1, 11–13. [Google Scholar] [CrossRef]
  15. Polmear, I.; StJhon, D.; Nie, J.-F.; Qian, M. Magnesium alloys. In Light Alloys: Metallurgy of the Light Metals, 5th ed.; Butterworth-Heinemann: Oxford, UK, 2017; pp. 287–367. [Google Scholar]
  16. Cheng, Y.-L.; Qin, T.-W.; Wang, H.-M.; Zhang, Z. Comparison of corrosion behaviors of AZ31, AZ91, AM60 and ZK60 magnesium alloys. Trans. Nonferrous Met. Soc. China 2009, 19, 517–524. [Google Scholar] [CrossRef]
  17. Jönsson, M.; Persson, D.; Leygraf, C. Atmospheric corrosion of field-exposed magnesium alloy AZ91D. Corros. Sci. 2008, 50, 1406–1413. [Google Scholar] [CrossRef]
  18. Lindström, R.; Svensson, J.-E.; Johansson, L.-G. The influence of carbon dioxide on the atmospheric corrosion of some magnesium alloys in the presence of NaCl. J. Electrochem. Soc. 2002, 149, B103–B107. [Google Scholar] [CrossRef]
  19. LeBozec, N.; Jönsson, M.; Thierry, D. Atmospheric Corrosion of Magnesium Alloys: Influence of Temperature, Relative Humidity. Corrosion 2004, 60, 356–361. [Google Scholar] [CrossRef] [Green Version]
  20. Danaie, M.; Asmussen, R.M.; Jakupi, P.; Shoesmith, D.W.; Botton, G.A. The role of aluminum distribution on the local corrosion resistance of the microstructure in a sand-cast AM50 alloy. Corros. Sci. 2013, 77, 151–163. [Google Scholar] [CrossRef]
  21. Cao, F.; Zhao, C.; You, J.; Hu, J.; Zheng, D.; Song, G.-L. The inhibitive effect of artificial seawater on magnesium corrosion. Adv. Eng. Mater. 2019, 21, 1900363–1900376. [Google Scholar] [CrossRef]
  22. Cuevas, A.C.; Bercerril, E.B.; Martínez, M.S.; Ruiz, J.L. Metal Matrix Composites; Springer Nature: Basel, Switzerland, 2018; p. 4. [Google Scholar] [CrossRef]
  23. Chawla, K.K. Metal matrix composite. In Composite Materials: Science and Engineering, 3rd ed.; Chawla, K.K., Ed.; Springer: Birmingham, AL, USA, 2012; pp. 197–248. [Google Scholar] [CrossRef]
  24. Dey, A.; Pandey, K.M. Magnesium Metal Matrix Composites—A Review. Rev. Adv. Mater. Sci. 2015, 42, 58–67. [Google Scholar]
  25. Malaki, M.; Xu, W.; Kasar, A.K.; Menezes, P.L.; Dieringa, H.; Varma, R.S.; Gupta, M. Advanced metal matrix nanocomposites. Metals 2019, 9, 330. [Google Scholar] [CrossRef]
  26. Sathishkumar, P.; Deepakaravind, V.; Gopal, P.; Azhagiri, P. Analysis the mechanical properties and material characterization on Magnesium Metal Matrix Nano composites through stir casting process. Mater. Today: Proc. 2021, 46, 7436–7441. [Google Scholar] [CrossRef]
  27. Haghshenas, M. Metal–matrix composites. Ref. Mod. Mater. Sci. Mater. Eng. 2016, 03950–03953. [Google Scholar] [CrossRef]
  28. Lee, C.J.; Huang, J.C.; Hsieh, P.J. Mg based nano-composites fabricated by friction stir processing. Scr. Mater. 2006, 54, 1415–1420. [Google Scholar] [CrossRef]
  29. Hassan, S.F. Creation of New Magnesium-Based Material Using Different Types of Reinforcements. Ph.D Thesis, National University of Singapore, Singapore, 2006. [Google Scholar]
  30. Tun, K.S. Development and Characterization of New Magnesium Based Nanocomposites. Ph.D. Thesis, National University of Singapore, Singapore, 2009. [Google Scholar]
  31. Choi, H.; Alba-Baena, N.; Nimityongskul, S.; Jones, M.; Wood, T.; Sahoo, M.; Lakes, R.; Kou, S.; Li, X. Characterization of hot extruded Mg/SiC nanocomposites fabricated by casting. J. Mater. Sci. 2011, 46, 2991–2997. [Google Scholar] [CrossRef]
  32. Nie, K.B.; Wang, X.J.; Wu, K.; Hu, X.S.; Zheng, M.Y. Development of SiCp/AZ91 magnesium matrix nanocomposites using ultrasonic vibration. Mater. Sci. Eng. A 2012, 540, 123–129. [Google Scholar] [CrossRef]
  33. Dieringa, H.; Katsarou, L.; Buzolin, R.; Szakácks, G.; Horstmann, M.; Wolff, M.; Mendis, C.; Vorozhtsov, S.; StJhon, D. Ultrasound assisted casting of an AM60 based metal matrix nanocomposite, its properties, and recyclability. Metals 2017, 7, 388. [Google Scholar] [CrossRef] [Green Version]
  34. Bedolla, E.; Lemus-Ruiz, J.; Contreras, A. Synthesis and characterization of Mg-AZ91/AlN composites. Mater. Des. 2012, 38, 91–98. [Google Scholar] [CrossRef]
  35. Cao, G.; Choi, H.; Oportus, J.; Konishi, H.; Li, X. Study on tensile properties and microstructure of cast AZ91D/AlN nanocomposites. Mater. Sci. Eng. A 2008, 494, 127–131. [Google Scholar] [CrossRef]
  36. Sankaranarayanan, S.; Habibi, M.K.; Jayalakshmi, S.; Jia Ai, K.; Almajida, A.; Gupta, M. Nano-AlN particle reinforced Mg composites: Microstructural and mechanical properties. Mater. Sci. Technol. 2015, 31, 1122–1131. [Google Scholar] [CrossRef]
  37. Saboori, A.; Padovano, E.; Pavese, M.; Badini, C. Novel magnesium Elektron21-AlN nanocomposites produced by ultrasound-assisted casting; microstructure, thermal and electrical conductivity. Materials 2018, 11, 27. [Google Scholar] [CrossRef] [PubMed]
  38. Yang, H.; Huang, Y.; Gavras, S.; Kainer, K.U.; Hort, N.; Dieringa, H. Influences of AlN/Al Nanoparticles on the Creep Properties of Elektron21 Prepared by High Shear Dispersion Technology. JOM 2019, 71, 2245–2252. [Google Scholar] [CrossRef]
  39. Giannopoulou, D.; Dieringa, H.; Bohlen, J. Influence of AlN nanoparticle addition on microstructure and mechanical properties of extruded pure magnesium and an aluminum-free Mg-Zn-Y alloy. Metals 2019, 9, 667. [Google Scholar] [CrossRef] [Green Version]
  40. Yang, H.; Zander, D.; Huang, Y.; Kainer, K.U.; Dieringa, H. Individual/synergistic effects of Al and AlN on the microstructural evolution and creep resistance of Elektron21 alloy. Mater. Sci. Eng. A 2020, 777, 139072–139086. [Google Scholar] [CrossRef]
  41. Svedberg, L.M.; Arndt, K.C.; Cima, M.J. Corrosion of aluminum nitride (AlN) in aqueous cleaning solutions. J. Am. Ceram. Soc. 2000, 83, 41–46. [Google Scholar] [CrossRef]
  42. Fu, H.M.; Zhang, M.-X.; Qiu, D.; Kelly, P.M.; Taylor, J.A. Grain refinement by AlN particles in Mg–Al based alloys. J. Alloys Comp. 2009, 478, 809–812. [Google Scholar] [CrossRef]
  43. Lee, Y.C.; Dahle, A.K.; StJohn, D.H. Grain refinement of magnesium. In Essential Readings in Magnesium Technology, 1st ed.; Mathaudu, S.N., Luo, A.A., Neelameggham, N.R., Nyberg, E.A., Sillekens, W.H., Eds.; Springer: Berlin/Heidelberg, Germany, 2016; pp. 247–254. [Google Scholar] [CrossRef]
  44. Chávez, L.; Veleva, L.; Feliu, S.; Giannopoulou, D.; Dieringa, H. Corrosion Behavior of Extruded AM60-AlN Metal Matrix Nanocomposite and AM60 Alloy Exposed to Simulated Acid Rain Environment. Metals 2021, 11, 990. [Google Scholar] [CrossRef]
  45. Lerner, M.I.; Glazkova, E.A.; Lozhkomoev, A.S.; Svarovskaya, N.V.; Bakina, O.V.; Pervikov, A.V.; Psakhie, S.G. Synthesis of Al nanoparticles and Al/AlN composite nanoparticles by electrical explosion of aluminum wires in argon and nitrogen. Powder Technol. 2016, 295, 307–314. [Google Scholar] [CrossRef]
  46. Xia, D.H.; Deng, C.; Macdonald, D.; Jamali, S.; Mills, D.; Luo, J.L.; Strebi, M.G.; Amiri, M.; Jin, W.; Song, S.; et al. Electrochemical measurements used for assessment of corrosion and protection of metallic materials in the field: A critical review. J. Mater. Sci. Technol. 2022, 112, 151–183. [Google Scholar] [CrossRef]
  47. ASTM-NACE/ASTM G31-12a; Standard Guide for Laboratory Immersion Corrosion Testing of Metals. ASTM International: West Conshohocken, PA, USA, 2021. [CrossRef]
  48. ASTM G1-03; Standard Practice for Preparing, Cleaning, and Evaluating Corrosion Test Specimens. ASTM International: West Conshohocken, PA, USA, 2017. [CrossRef]
  49. ASTM G199-09; Standard Guide for Electrochemical Noise Measurement. ASTM International: West Conshohocken, PA, USA, 2020. [CrossRef]
  50. Eke, A.; Herman, P.; Bassingthwaighte, J.; Raymond, G.; Percival, D.; Cannon, M.; Balla, I.; Ikrényi, C. Physiological time series: Distinguishing fractal noises from motions. Pflügers Archiv. 2000, 439, 403–415. [Google Scholar] [CrossRef] [PubMed]
  51. Delignieres, D.; Ramdani, S.; Lemoine, L.; Torre, K.; Fortes, M.; Ninot, G. Fractal analyses for ‘short’ time series: A re-assessment of classical methods. J. Math. Psychol. 2006, 50, 525–544. [Google Scholar] [CrossRef]
  52. Cao, P.; Qian, M.; StJohn, D.H. Effect of iron on grain refinement of high-purity Mg–Al alloys. Scr. Mater. 2004, 51, 125–129. [Google Scholar] [CrossRef]
  53. Song, G.-L. Corrosion electrochemistry of magnesium (Mg) and its alloys. In Corrosion of Magnesium Alloys, 1st ed.; Song, G.L., Ed.; Woodhead Publishing: Cambridge, UK, 2011; pp. 3–65. [Google Scholar] [CrossRef]
  54. Heakal, F.E.-T.; Fekry, A.M.; Fatayerji, M.Z. Influence of halides on the dissolution and passivation behavior of AZ91D magnesium alloy in aqueous solutions. Electrochim. Acta 2009, 54, 1545–1557. [Google Scholar] [CrossRef]
  55. Botana, P.J.; Bárcena, M.M.; Villero, Á.A. Ruido Electroquímico: Métodos de Análisis; Septem Ediciones: Cadiz, Spain, 2002; pp. 50–70. [Google Scholar]
  56. He, L.; Jiang, Y.; Guo, Y.; Wu, X. Electrochemical noise analysis of duplex stainless steel 2101 exposed to different corrosive solutions. Corros Eng. Sci. Techn. 2016, 51, 187–194. [Google Scholar] [CrossRef]
  57. Xia, D.-H.; Song, S.; Behnamian, Y.; Hu, W.; Cheng, Y.F.; Lu, J.-L.; Huet, F. Review-Electrochemical noise applied in corrosion science: Theoretical and mathematical models towards quantitative analysis. J. Electrochem. Soc. 2020, 167, 081507–081521. [Google Scholar] [CrossRef]
  58. Jáquez-Muñoz, J.M.; Gaona-Tiburcio, C.; Cabral-Miramontes, J.; Nieves-Mendonza, D.; Maldonado-Bandala, E.; Olguín-Coca, J.; López-Léon, L.D.; Flores-De los Rios, J.P.; Almeraya-Calderón, F. Electrochemical noise analysis of the corrosion of titanium alloys in NaCl and H2SO4 solutions. Metals 2021, 11, 105. [Google Scholar] [CrossRef]
  59. Cottis, R.A. Interpretation of electrochemical noise data. Corrosion 2001, 57, 265–285. [Google Scholar] [CrossRef]
  60. Bertocci, U.; Gabrielli, C.; Huet, F.; Keddam, M. Noise resistance applied to corrosion measurements: I. Theoretical analysis. J. Electrochem. Soc. 1997, 144, 31–37. [Google Scholar] [CrossRef]
  61. Bertocci, U.; Gabrielli, C.; Huet, F.; Keddam, M. Noise resistance applied to corrosion measurements: II. Experimental tests. J. Electrochem. Soc. 1997, 144, 37–43. [Google Scholar] [CrossRef]
  62. Malamud, B.D.; Turcotte, D.L. Self-affine time series: Measures of weak and strong persistence. J. Stat. Plam. Inference 1999, 80, 173–196. [Google Scholar] [CrossRef]
  63. Lunder, O.; Nordien, J.H.; Nisancioglu, K. Corrosion resistance of cast Mg-Al alloys. Corros. Rev. 1997, 15, 439–470. [Google Scholar] [CrossRef]
  64. Davoodi, A.; Pan, J.; Leygraf, C.; Norgren, S. The role of intermetallic particles in localized corrosion of aluminium alloy studied by SKPFM and integrated AFM/SECM. J. Electrochem. Soc. 2008, 155, C211–C218. [Google Scholar] [CrossRef] [Green Version]
  65. Pawar, S.; Zhou, X.; Thompson, G.E.; Scamans, G.; Fan, Z. The role of intermetallics on corrosion initiation of twin roll cast AZ31 Mg Alloy. J. Electrochem. Soc. 2015, 162, C442–C448. [Google Scholar] [CrossRef]
  66. Asmussen, R.M.; Binns, W.J.; Parfov-Nia, R.; Jakupi, P.; Shoesmith, D.W. The stability of aluminium-manganese intermetallic phases under the microgalvanic coupling conditions. Mater. Corros. 2016, 67, 39–50. [Google Scholar] [CrossRef]
  67. Koç, E. Corrosion behavior of as cast β-Mg17Al12 phase in 3.5 wt % NaCl solution. Acta. Phys. Pol. A 2019, 135, 833–881. [Google Scholar] [CrossRef]
  68. Santamaria, M.; Di Quarto, F.; Zanna, S.; Marcus, P. Initial surface film on magnesium metal: A characterization by X-ray photoelectron spectroscopy (XPS) and photocurrent spectroscopy (PCS). Electrochim. Acta 2007, 53, 1314–1324. [Google Scholar] [CrossRef]
  69. Fournier, V.; Marcus, P.; Olefjord, I. Oxidation of magnesium. Surf. Inter. Anal. 2002, 34, 494–497. [Google Scholar] [CrossRef]
  70. Moulder, J.F.; Stickle, W.F.; Sobol, P.E.; Bomben, K.D. Handbook of X-Ray Photoelectron Spectroscopy; Physical Electronics Inc.: Chanhassen, MN, USA, 1992. [Google Scholar]
  71. Liao, J.; Hotta, M. Corrosion products of field-exposed Mg-Al series magnesium alloys. Corros. Sci. 2016, 112, 276–288. [Google Scholar] [CrossRef]
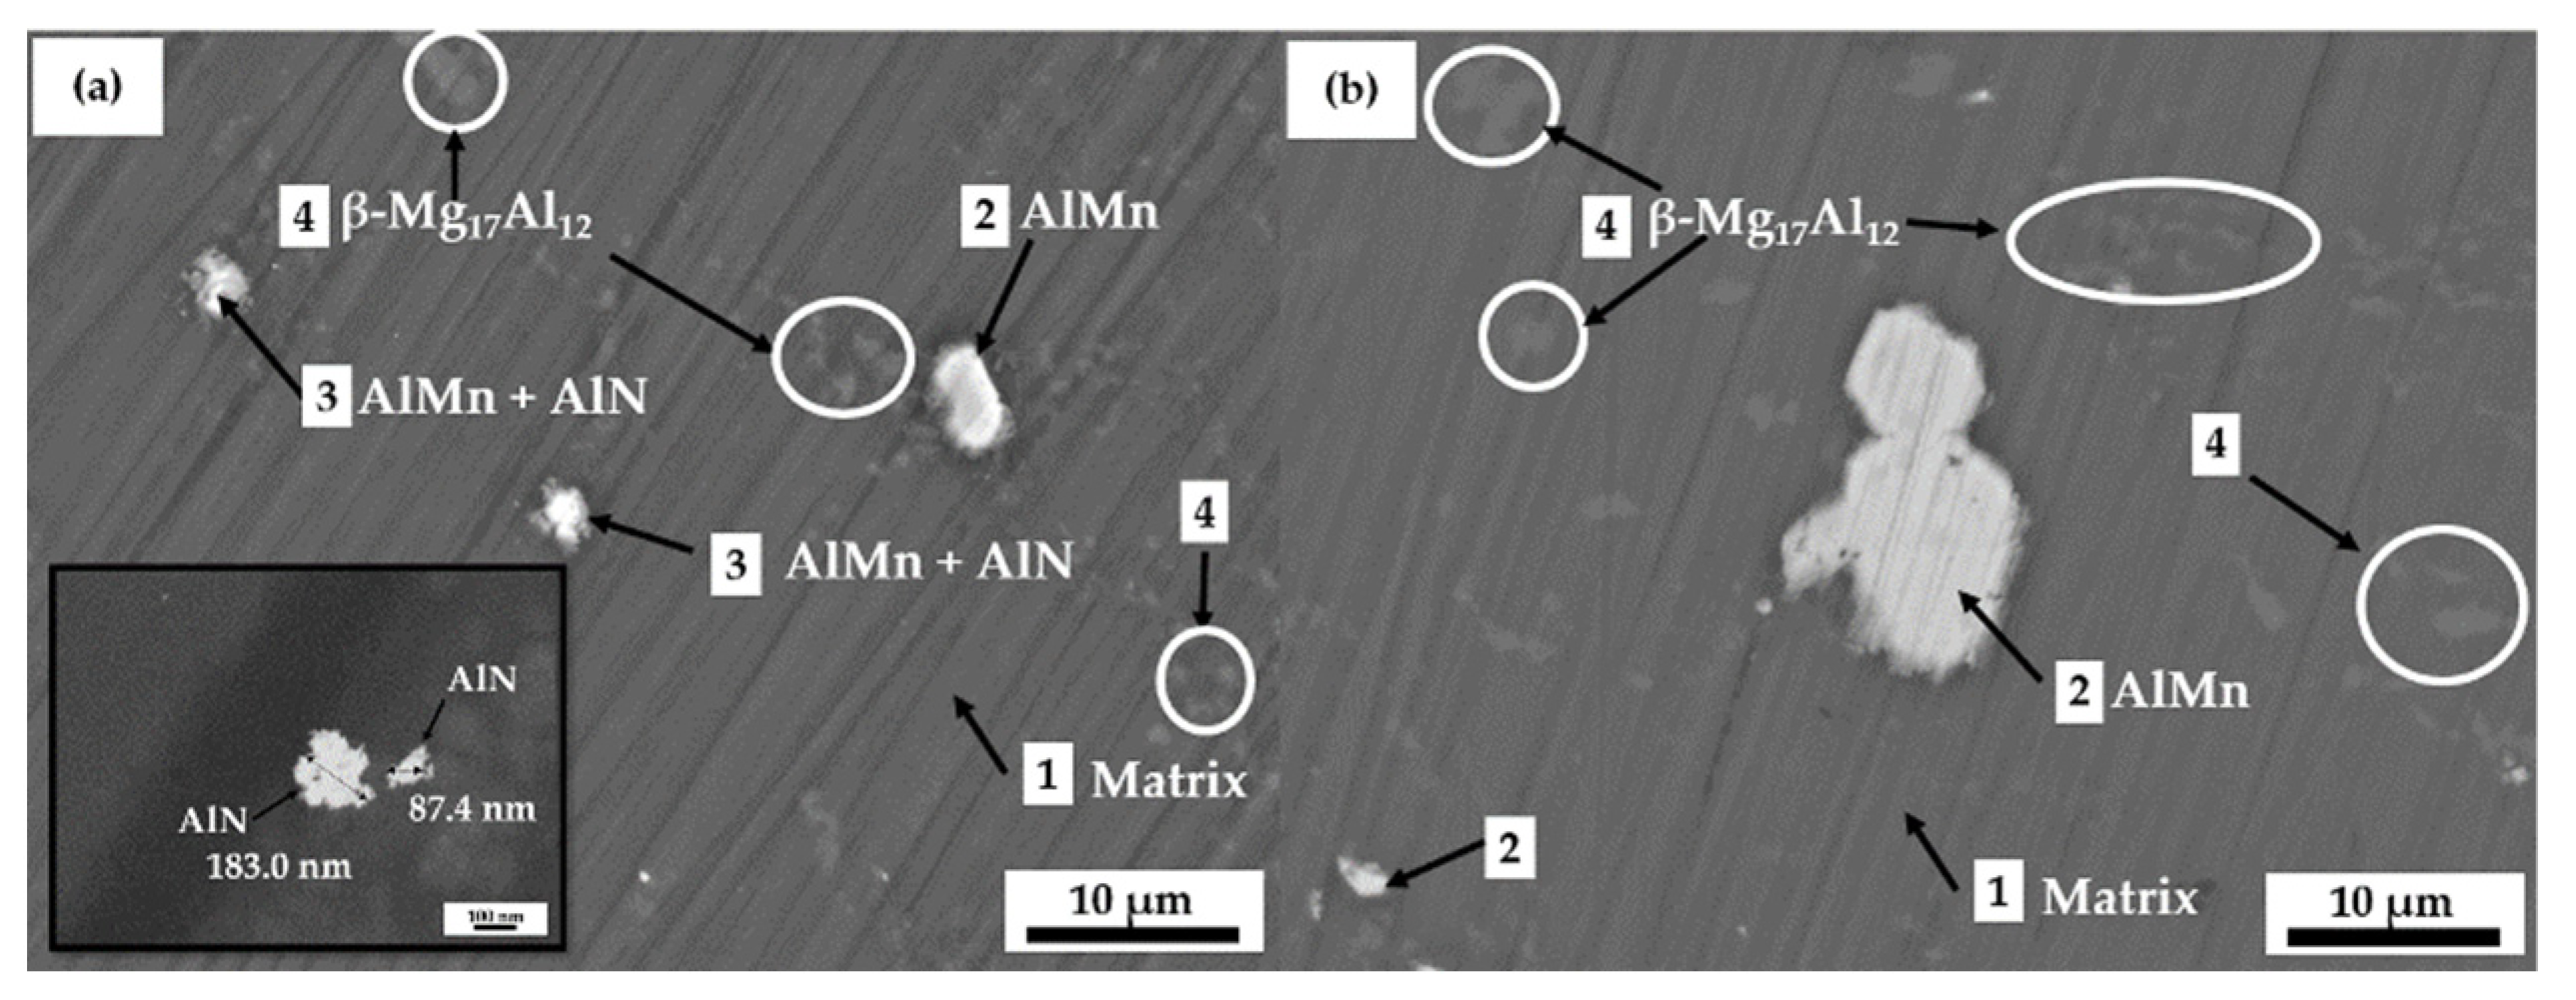
Figure 1. SEM images (×2000) of (a) AM60-AlN nanocomposite and (b) AM60 alloy reference samples [44].
Metals 12 01997 g001
Figure 2. Roughness values ( R a ) of reference samples of (a) nanocomposite AM60-AlN and (b) AM60 alloy.
Metals 12 01997 g002
Figure 3. Changes in time of pH (a) and concentration of released Mg2+ ions (b) after exposure of nanocomposite AM60-AlN and AM60 alloy samples to SME solution for up to 30 days.
Metals 12 01997 g003
Figure 4. Changes in time of (a) mass loss and (b) annual corrosion rates of AM60-AlN and AM60 after exposure to SME solution up to 30 days.
Metals 12 01997 g004
Figure 5. Electrochemical current noise signals (at OCP) of (a) AM60-AlN nanocomposite and (b) AM60 alloy at 30 days of immersion in SME model solution.
Metals 12 01997 g005
Figure 6. Power spectral density (PSD) plots of AM60-AlN (a) and AM60 (b) corrosion current fluctuations at 30 days of exposure to a simulated marine environment solution.
Metals 12 01997 g006
Figure 7. SEM images (×2000) of AM60-AlN nanocomposite and AM60 alloy surface morphology: (a,b) at 30 days of immersion in SME model solution; (c,d) after elimination of corrosion layers; (e,f) cross-sectional SEM images.
Metals 12 01997 g007
Figure 8. XPS spectrum of nanocomposite AM60-AlN (a) and AM60 alloy (b) at 30 days immersion in simulated marine-coastal environment (SME).
Metals 12 01997 g008
Table 1. Free corrosion potential (OCP) values during the exposure of AM60-AlN and AM60 up to 30 days to a simulated marine environment (SME).
OCP (V vs. SCE)
DaysInitial17101530
AM60-AlN−1.61 ± 0.05−1.58 ± 0.02−1.53 ± 0.01−1.54 ± 0.01−1.53 ± 0.02−1.51 ± 0.01
AM60−1.61 ± 0.07−1.58 ± 0.02−1.54 ± 0.01−1.53 ± 0.01−1.52 ± 0.02−1.52 ± 0.01
Table 2. Electrochemical noise resistance ( R n ) values of the nanocomposite AM60-AlN and AM60 alloy during their exposure up to 30 days to a simulated marine environment (SME).
R n ( k Ω   cm 2 )
DaysInitial17101530
AM60-AlN2.332.421.481.521.630.84
AM601.722.091.191.002.091.06
Table 3. EDS analysis (wt.%) of nanocomposite AM60-AlN and AM60 surfaces (in zones labeled in Figure 7), after immersion in SEM model solution up to 30 days.
ZoneCONaMgAlSiSClMn
12.7521.86-7.6422.170.55--45.04
24.7259.970.3227.316.01-0.800.650.61
32.5530.42-61.085.76-0.2--
Publisher’s Note: MDPI stays neutral with regard to jurisdictional claims in published maps and institutional affiliations.