Article

Effect of Heat Input on Hydrogen Embrittlement of TIG Welded 304 Austenitic Stainless Steel

1
School of Mechanical and Automotive Engineering, South China University of Technology, Guangzhou 510641, China
2
Guangdong Key Laboratory of Materials and Equipment in Harsh Marine Environment, Guangzhou Maritime University, Guangzhou 510725, China
3
Guangzhou Institute of Energy Testing, Guangzhou 511447, China
*
Author to whom correspondence should be addressed.
Metals 2022, 12(11), 1943; https://doi.org/10.3390/met12111943
Submission received: 2 October 2022 / Revised: 8 November 2022 / Accepted: 10 November 2022 / Published: 13 November 2022

Abstract

:
Welds made with 304 austenitic stainless steel play an important role in high-pressure hydrogen storage systems. However, there are few investigations of the effect of heat input on the hydrogen embrittlement (HE) of tungsten inert gas (TIG) welded 304 austenitic stainless steel. In this study, the effect of heat input on the HE of TIG welded 304 austenitic stainless steel is investigated. It was found that with the increase in TIG welding heat input, the ferrite content in the weld shows a tendency to first increase and then decrease. From the perspective of morphology, it first changes from lathy ferrite and strip ferrite to dendritic ferrite, and then becomes reticular ferrite and lathy ferrite. Slow strain rate tensile (SSRT) testing shows that with the increase in heat input from TIG welding, the susceptibility of the weld to HE first increases and then decreases. Our study shows that TIG welds of 304 austenitic stainless steel exhibit the best HE resistance when the welding heat input is 0.778 kJ/mm, the relative elongation (RE) is 0.884, and the relative reduction of area (RRA) is 0.721. This work can provide a reference for the optimization of the 304 stainless steel TIG welding process.

1. Introduction

Hydrogen is a form of secondary energy with abundant sources. It is green, low-carbon, and has wide application. It is of great significance to building a clean, low-carbon, safe, and efficient energy system and achieving the goal of a “net zero-emission target [1,2,3]”. However, hydrogen embrittlement (HE) poses a significant challenge for the application of hydrogen storage materials and can cause industrial accidents [4]. HE usually reduces the strength and ductility of stainless steel, resulting in a significant reduction in the service life of stainless steel [5,6,7,8]. Due to their high ductility and lower HE compared to ferritic steels, 304 austenitic stainless steels are widely used for hydrogen applications [9,10,11,12,13,14,15]. In practical industrial applications, due to the large and complex structures of high-pressure hydrogen storage devices, welding 304 austenitic stainless steel is unavoidable [5]. Studies have shown that 304 austenitic stainless has excellent weldability and can be processed using different types of welding processes, e.g., metal inert gas (MIG) welding [16], laser beam welding (LBW) [4], tungsten inert gas (TIG) welding [17], etc. However, the heat input of the welding process makes the microstructure of the weld more complex than the base metal [5], leading to different HE susceptibility between the weld and the base metal.
Researchers have pointed out some critical factors regarding the HE of 304 austenitic stainless steel welds [18]. For example, Luppo et al. [19] believe that the ferrite–austenite interfaces in the weld act as hydrogen traps. Ferrite increases the susceptibility to HE. The greater the quantity of ferrite, the more HE. Our previous work [20] investigated the effect of ferrite morphology on hydrogen diffusion and HE in 304 γ-SS welds using Scanning Kelvin Probe Force Microscopy (SKPFM) combined with Finite Element Method (FEM) techniques. Fu et al. [21,22] investigated the HE susceptibility of different regions of welded stainless steel joints, and the mechanism of crack propagation in specimens. In addition, Fukuyama et al. [23,24,25,26] studied the effect of temperature, stress, and grain size on the HE susceptibility of stainless steel. These previous studies focused on the effect of microstructure on the HE of stainless steel welds. In practice, heat input can affect the HE susceptibility of the weld by changing the morphology of the microstructure [5]. However, the relationship between the effect of welding heat input on HE in TIG welds is still not well understood [27]. Moreover, there are few studies on hydrogen damage in TIG welds, which leads to a lack of sufficient basis for the formulation of TIG welding process parameters in the practical engineering application of 304 austenitic stainless steel in a hydrogen-containment environment. Therefore, it is particularly vital to study the effect of heat input on the HE susceptibility of TIG welded 304 austenitic stainless steel.
In this study, the effect of heat input on the HE sensitivity of TIG welded 304 austenitic stainless steel is investigated using macroscopic mechanical property evaluation, electrochemical charging with hydrogen, and microstructural characterization. The microstructure characteristics of welds with different TIG welding heat inputs, the microstructure evolution characteristics of the weld after hydrogen charging, and the tensile properties of the weld after hydrogen charging were compared. The effect of heat input on the microstructure of the weld is discussed and the relationship between the heat input and the HE susceptibility of the weld is revealed.

2. Experimental Details

The base metal used in this work was type 304 austenitic stainless steel plates with a thickness of 3 mm. The welding wire was 1.2 mm diameter E308 stainless steel. The joints were welded by means of TIG plate butt welding. The welding process was conducted in semi-automatic mode, where the movement of the welding heat source was performed by manual operation and the wire feeding and gas feeding were accomplished by the corresponding mechanical devices. The welding wire feed rate was automatically matched by the welding power source according to the welding current. A shielding gas of 99.99% Ar at 15 L/min was used. Before welding, all the edges of the base metal were polished and cleaned so as to eschew any source of impurity such as dust, rust or oxidation film, etc. The chemical composition of the base metal and the welding wire are shown in Table 1. The tensile properties of the base metal are shown in Table 2. Both the base metal and welding wire meet the standards in GB/T24511-2017, “Stainless steel and heat-resistant steel plates and strips for pressure-bearing equipment” [28] and GB/T983-2012, “Stainless steel welding wire” [29].
The process parameters for TIG welding are shown in Table 3. The welding heat input was calculated according to the following equation:
Q = U × I × k v
where Q is the heat input in kJ/mm, U is the arc voltage in volts (V), I is the welding current in amperes (A), k is the thermal efficiency coefficient, and v is the welding speed in mm/min. The k of TIG is taken as 0.6 [31].
Among the above parameters, T1–T3 are the experimental groups with different welding speeds under a welding current of 200 A. The welding speeds are 150 mm/min, 200 mm/min, and 250 mm/min, and the welding heat input is 0.864 kJ/mm, 0.648 kJ/mm, 0.518 kJ/mm, respectively. Similarly, T4–T6 and T7–T9 are the experimental groups with different welding speeds under the welding currents of 220 A and 240 A, respectively. T1, T4, and T7 were the control groups, with different welding currents of 200 A, 220 A, and 240 A when the welding speed was 150 mm/min. Similarly, the T2, T5, and T8 groups and T3, T6, and T9 groups were control groups with different welding currents when the welding speed was 200 mm/min and 250 mm/min, respectively.
By observing the color of the joint after welding, it could be seen that excellent gas protection was formed during the welding process. The weld metal was inspected using X-rays, showing good quality and no obvious surface defects. The specimens for metallographic characterization were cut into square sheets with dimensions of 20 mm × 10 mm × 3 mm. As shown in Figure 1, the specimens for the tensile test (with a gauge length of 15 mm, gauge width of 2 mm, and thickness of 2 mm) were cut from the weldments, and the weld was located in the middle of the specimen gauge. The specimen was ground with 2000 grit SiC paper and polished to 0.06 μm using an alumina polishing solution. Specimens were then ultrasonically cleaned in ethanol for 5 min, which should be carried out according to the requirements of GB/T 13298-2015, “Metal Microstructure Inspection Method” [30].
In this work, the electrochemical permeation technique was used for the hydrogen-charged test. Specimens were hydrogen pre-charged in 0.2 mol/L H2SO4 solution with 3 g/L thiourea for 24 h at 25 °C at a current density of 50 mA/cm2. The microstructure of the specimens was observed via metallographic microscope. The SSRT test was carried out on the universal testing machine (Instron 8802, Norwood, MA, USA) at a strain rate of 5.5 × 10⁻⁵/s. The macro-tensile properties of the weld were evaluated by an INSTRON 8802 testing machine (Instron, Norwood, MA, USA). The fracture morphology of the tensile specimens was evaluated using a scanning electron microscope (SEM, S-3700N, Hitachi, Tokyo, Japan). The lattice morphology of the weld was studied using electron backscatter diffraction (FESEM, JEOL, JSM-7100F, Tokyo, Japan). The physical phase composition of the 304 stainless steel welds was analyzed by an X-ray diffractometer (X’pert Powder), selecting an operating voltage of 50 kV, Cu as anode target material, scan step of 1°/min and 2 Theta angle range of 40~100°; the XRD data were analyzed using MDI JADE (MDI jade 6.5, Materials Data, Inc, Livermore, CA, USA).

3. Results and Discussion

3.1. Influence of Heat Input on Weld Microstructure

The morphology of 304 austenitic stainless steel is mainly equiaxed austenitic grains. After welding, the ferrite phase appears. Although ferrite helps to improve the hot crack resistance of welded austenitic stainless steel, the presence of ferrite may reduce the strength and ductility of the weld. Lippold et al. [32] analyzed the phase transformation sequence during the welding of austenitic alloys and plotted a schematic pseudo-binary phase diagram of 70% Fe-Cr-Ni. They concluded that the temperature of the two-phase region of austenite and ferrite is mainly between 1150 °C and 1400 °C. There is an austenitic single-phase zone between 1400 °C and the γ solvus line. During welding, when the temperature reaches or exceeds 1150 °C, austenite can be transformed into ferrite through solid-state phase transformation, and ferrite nuclei will first be formed at locations where chromium and other ferrite-forming elements are enriched. Ferritic grain size is related to heating time and heating temperature [33]. The transformation from austenite to ferrite does not generally occur at temperatures below 1150 °C, while partial austenite-to-ferrite transformation occurs at the grain boundaries due to partial elemental segregation resulting from heating, depending on the speed of cooling [34].
As shown in Table 4, during the post-welding cooling process, four different modes are usually considered, namely austenite (A), austenite–ferrite or primary austenite (AF), ferrite–austenite or primary ferrite (FA), and ferrite (F). Different solidification modes may cause differences in ferrite content in austenitic stainless steel welds. The ferrite content of A mode is 0, the ferrite content of AF mode is 0~4%, the ferrite content of FA solidification mode is 4~20%, and the ferrite content of F solidification mode is more than 20%.
After metallographic analysis (Figure 2), it is possible to observe a great difference in terms of the distribution and morphologies of samples. T1–T3 show the metallographic organization at different welding speeds when the welding current was 200 A. Because the welding speed of the T1 weld was low and the heat input was relatively large, the ferrite morphology became a strip with a small number of dendrites. Due to the low cooling rate, the austenite crystals grew for a longer time during the cooling process, and the columnar crystals that formed have larger sizes. When the welding speed was increased, the skeleton ferrite in the T2 weld began to become cohesive and separate from the austenite, and the size of the austenite columnar grains decreased. When the welding speed was further increased, the ferrite morphology in T3 became a reticular structure. Due to the acceleration of the cooling rate, the growth time of austenite crystals was shortened, and the size of the austenite grains formed at this time was smaller than before. According to the microstructure analysis results, T1 had a larger grain size, followed by T2, and T3 had the smallest austenite grain size due to the formation of a reticular ferrite.
When the welding current was 220 A, the metallographic organization of different welding speeds are classified as T4–T6. As the welding current increased, the ferrite morphology became more continuous in T4 than in T3. As shown in T4, ferrite shows a reticular morphology that separates from the austenite, forming elements Ni, N, C, etc. Therefore, when the phase transition from ferrite to austenite occurred, large-sized columnar crystal structures could not be formed due to the depletion of the forming elements in certain regions. When the welding speed increased, the cooling rate of the T5 weld accelerated, and some of the ferrites did not have time to grow into dendrites, which exist in strip morphologies. At this time, austenite crystals exist as small-sized columnar crystal structures near the continuous ferrite. However, near the strip ferrite organization, austenite crystals are seen as large-size columnar crystals. This is because during the formation of austenite, the diffusion of relevant austenite-forming elements is less impeded, and the formation of austenite can be more fully achieved. Due to the high cooling rate of T6, the ferrite morphology also begins to become dispersed, and austenite crystals grow along the edges of ferrite dendrites to form columnar crystals. According to the above analysis, T4 has a smaller austenite grain size due to the formation of a more uniform reticular ferrite, T5 is slightly larger than T4, and T6 is the largest of the three.
When the welding current was increased to 240 A, the metallographic organization of different welding speeds was classified as T7–T9. At this time, due to the increase in welding heat input, ferrite exists mainly in the form of dendrites. The welding speed of T7 is low, and the cooling rate is slow, so the phase transformation process from ferrite to austenite is adequate. At this time, the morphology of ferrite becomes lath and dispersed dendrites, while austenite presents larger-size columnar crystals. The welding speed of a T8 weld is higher than that of a T7; the phase transformation process of ferrite to austenite is shortened, the ferrite is more continuous, and the austenite crystal presents a columnar crystal structure around the dendritic ferrite structure. The welding heat input of T9 is small, and part of the ferrite does not have time to grow into dendrites, so it exists in the form of strip ferrite. At this time, the austenite forms columnar crystals with a relatively large axis width. The grain size of T7 is slightly larger than that of T8, while the austenite present in T9 grows along the strip ferrite to form a grain size that is larger than that of T7.
The ferrite content in each weld was determined by calculating Creq and Nieq and then searching the WRC-1992 diagram. The Creq and Nieq can be calculated by using the composition of the weld metal. The chromium equivalent is given as Creq = Cr + Mo + 0.7Nb and the nickel equivalent as Nieq = Ni + 35C + 20N + 0.25Cu [35,36,37,38]. The ferrite content of the 304 austenitic stainless steel TIG welds is shown in Figure 3. The welding heat input of T3 and T6 is small, and the austenite transformation is not sufficient during the heating process, resulting in a low ferrite content in the corresponding weld. Therefore, it can be observed that when the welding heat input is less than 0.864 kJ/mm and the welding speed is greater than 200 mm/min, the ferrite content increases with an increase in welding heat input. However, when the welding heat input is greater than 0.864 kJ/mm and the welding speed is less than 150 mm/min, with an increase in welding heat input, the ferrite decreases. At this time, the welding heat input is relatively large, while the cooling rate is slow. Then the phase transformation time of ferrite to austenite is sufficient so that the ferrite content will be less than for others.
Therefore, in the process of TIG welding 304 austenitic stainless steel, the changes in welding current, voltage, and speed, as well as other process parameters, will affect the structure of the weld. In the study in this subsection, it was found that the change in welding heat input affects the transformation process from ferrite phase to austenite phase. With the increase in TIG welding heat input, the ferrite content in the weld shows a tendency to first increase and then decrease. The ferrite morphology first changes from lathy ferrite and strip ferrite to dendritic ferrite, and finally becomes reticular ferrite and lathy ferrite.

3.2. Microstructure Evolution

For austenitic stainless steel welds performing in a hydrogen environment, welding will change the lattice morphology of the steel, which affects the hydrogen-induced failure process of the material. In this section, X-ray diffraction (XRD) and electron backscatter diffraction (EBSD) were used to study the phase composition and lattice morphology of the base metal and TIG welds with or without being hydrogen-charged.
The lattice morphology of the 304 austenitic stainless steel base metal was analyzed using EBSD, as shown in Figure 4. It can be seen from the figure that the base metal is mainly composed of equiaxed austenite crystals, which is accompanied by a small number of annealing twins. The average grain size of the 304 austenitic stainless steel base metal calculated by the HKL Tango software is about 45 μm.
Figure 5 shows the IPF of the 304 austenitic stainless steel TIG weld (T8). After the weld was subjected to the welding thermal cycle, the grain size of the weld increased significantly on the base metal, and the annealing twins of the base metal disappeared. The average grain size of the TIG welds calculated by the HKL Tango software is about 20 μm to 310 μm. Compared with the grain size of the base metal, the grain size of the 304 austenitic stainless steel TIG weld increased significantly. Figure 5b shows the IPF of the weld after hydrogen charging. After hydrogen charging, the grain size of the weld is calculated to vary from 20 μm to 315 μm. It is found that the grain size of the weld after hydrogen charging increased slightly [39,40].
The phase map of an uncharged 304 austenitic stainless steel TIG weld is shown in Figure 5c. It can be seen that the phases in TIG welds are mainly austenite (FCC) and ferrite (BCC). Ferrite is mainly distributed at the boundary of austenite crystals, and a small amount is distributed inside austenite. Figure 5d shows the phase map of the TIG weld after hydrogen charging. The results show that the BCC martensite phase is formed in the TIG weld after hydrogen charging. According to EBSD measurement, the martensite content in the weld is 0.367%. Combined with the XRD results, the peak value of the diffraction peak of the TIG weld at (110) also increased after hydrogen charging. The area of the diffraction peak increased by 0.37%, while the original ferrite content in the weld remained unchanged. Thus, 0.37% of martensitic phase was added after hydrogen charging.
The results identified and measured by X-ray diffraction are shown in Figure 6. The diffraction peaks of the base metal XRD pattern mainly appear at 43.6°, 50.7°, 74.6°, 90.5°, and 95.9°, which indicates that the main physical phase in the 304 austenitic stainless steel parent material is the austenitic phase of the crystallographic index (111), (200), (220), (311), and (222). Since 304 austenitic stainless steel is mainly FCC phase austenite, the austenite lattice constant in the base metal was obtained by the JADE software to be 0.3591 nm.
The diffraction peaks of the XRD patterns of 304 austenitic stainless steel TIG welds mainly appear at 43.6°, 44.5°, 50.7°, 74.6°, 90.5°, and 95.8°, etc. This indicates that the phases in the TIG welds are austenitic phases with crystallographic indices (111), (200), (220), (311), and (222) and BCC phases with a crystallographic index of (110). The full width at half maximum (FWHM) of 304 austenitic stainless steel TIG welds was measured using JADE software. The (111), (200), and (220) FWHM are 0.325°, 0.466°, and 0.386°, respectively. The FWHM was also measured for a crystal plane index of (110), and the FWHM obtained was 0.501°.
The diffraction peaks of the XRD patterns of the TIG welds after hydrogen charging mainly appear at 43°, 43.8°, 50.1°, 74.1°, 90°, and 95.4°. This indicates that the phases in the 304 austenitic stainless steel TIG welds are austenitic phases with crystallographic indices (111), (200), (220), (311), and (222) and BCC phases with a crystallographic index of (110). The FWHM of the TIG weld after hydrogen charging was measured using JADE software. At the same time, the FWHM was measured for a crystal surface index of (110), and its FWHM was obtained as 0.511°. After hydrogen charging, the diffraction peak position of the TIG weld was slightly shifted to the left, i.e., the 2 Theta value corresponding to each diffraction peak was reduced. In addition, the lattice constant of the TIG weld increased after hydrogen charging. The lattice constant of the TIG weld was 0.3595 nm, and the lattice constant of the TIG weld after hydrogen charging was 0.3673 nm. The lattice constant increased by 0.0078 nm, and the increase in the lattice constant at this point was due to the dissolution of hydrogen atoms in the grains.
The EBSD results show that after welding, the 304 austenitic stainless steel base metal grain size was significantly increased, and the annealing twins of the base metal disappeared. In addition, calculations of the XRD results based on the Scherrer equation yielded consistent conclusions:
  D = K λ β 1 2 c o s θ
where D is the crystallite size (used to estimate grain size), K is the Scherrer constant (generally 0.89), λ is the X-ray wavelength, β 1 2 is the full width at half maximum (FWHM), and θ is the Bragg angle.
The results of XRD show that there is ferrite with a (110) crystal plane index in the TIG weld. After hydrogen charging, the diffraction peak of the TIG weld shifts to the left. This indicates a lattice expansion in the weld, which is caused by a large amount of solute hydrogen. In addition, the peak value of the diffraction peak of the TIG weld at (110) increased. The area of the diffraction peak has increased by 0.37% and the original ferrite content in the weld remains unchanged. Combined with the EBSD results, the new increase should be from martensite structures [41,42]. Li et al. [43] also found in their study of HE in strain-strengthened austenitic stainless steel welds that when the pre-strain amount increased to 20%, the martensitic structure basically did not appear in the weld. A study by El-Tahawy et al. [44] also found that martensite exists in hydrogen-charged 316 L stainless steel, but the martensite content is less than 4%, and no research has been carried out on martensite.
In this section, the changes in lattice morphology and phase distribution of TIG welds before and after hydrogen charging were explored using EBSD technology, and the phase composition of welds was analyzed using XRD technology. It was found that the grain size increased, and a ferrite phase appeared in the weld after welding. After hydrogen charging, the weld lattice expanded, and a very small amount of martensite appeared in the weld.

3.3. Influence of Heat Input on HE of Welds

After the welding process, the single-phase austenite structure is transformed into a ferrite and austenite two-phase structure. The difference in tensile properties between ferrite and austenite, as well as the difference in hydrogen diffusion characteristics in the two phases, could complicate the process of HE of the weld [45,46,47]. In this section, the HE susceptibility of TIG welds is evaluated by an SSRT test [48,49,50]. The fracture morphology of tensile specimens was analyzed using SEM, and the effect of welding heat input parameters on the HE of the welds was analyzed.
Currently, in relation to the residual ferrite in the austenitic stainless steel weldment after the welding of austenitic stainless steel core support structures and Class 1 and 2 components, Section III of the ASME boiler and pressure vessel code indicates that the ferrite content in the weld filler metal is required, as depicted by a ferrite number (FN), to be between 5 and 20 [51,52]. Since none of the four groups of ferrite content meets the relevant requirements, only five of the nine groups of TIG welds were reserved to evaluate the susceptibility to HE, namely T1, T4, T5, T7, and T8. Figure 7 shows the stress–strain curves of TIG welds before and after hydrogen charging and the corresponding welding heat input. To quantify the influence of hydrogen charging, some indexes are defined to describe the HE susceptibility according to the following equations:
RE = δ y δ n
RRA = ψ y ψ n
where RE is the relative elongation, δy is the elongation (EL) of hydrogen-charged welds, and δn is the EL of uncharged welds. RRA is the relative reduction of area, ψy is the reduction of area (RA) of hydrogen-charged welds, and ψn is the RA of uncharged welds.
The SSRT test results are shown in Figure 7; the tensile specimens under different welding heat inputs were fractured at the weld before and after hydrogen charging. After hydrogen charging, the tensile strength decreased to a certain extent, and the plastic loss was more obvious. Further analysis found that the resistance of the weld to HE with the increase in welding heat input shows a trend of first increasing and then decreasing. From the information in Figure 8, we know that when heat input is 0.778 kJ/mm, the resistance of TIG welds to HE is better; the relative elongation (RE) is 0.884 and the relative reduction of area (RRA) is 0.721.
The results of the tensile property tests of the TIG welds after hydrogen charging show that welds with the same ferrite content exhibit different susceptibility to HE. Based on the analysis in Section 3.1, the ferrite content of the T4 and T8 welds is 6.2%. The ferrite organization in T4 is mainly reticulated, with austenite separated by ferrite. In contrast, T8 welds are dominated by continuous dendritic ferrite, and T8 welds exhibit greater resistance to HE. Although the ferrite content in T5 and T7 is similar, T5 has higher resistance to HE. It shows that the HE susceptibility of welds is not only influenced by the ferrite content but also related to the ferrite morphology.
Figure 9 shows different views of the fracture surfaces of the TIG weld after hydrogen charging. By observing the full view of the fracture surface after hydrogen charging, a minor necking phenomenon can be found, which indicates that the plastic deformation of the specimen is small. This is reflected in the macroscopic properties as lower fracture shrinkage. The center of the T1 weld has a few shear lips (SLs) and dimples, indicating a ductile fracture in the center of the weld. The area where the T1 weld was several microns away from the surface shows intergranular fractures. With the increase in depth, a cleavage surface appears in the fracture. Below this region, the quasi-cleavage (QC) feature of dimples and patterns coexists again. Overall, the T1 welds fracture from along the grain at the edges, to cleavage fracture, then to QC fracture, and finally at the center of the specimen by micro-void coalescence (MVC). The fracture morphology of T5 and T7 welds is similar to that of T1 welds. The difference between the three is that the T5 weld has less region of cleavage and a small portion of the cleavage region along the crystal fracture zone is the QC feature. T7 also has fewer regions of cleavage, but its along-crystal fracture zone extends to a depth of about 30 μm to 40 μm. The intergranular fracture zone of the T4 weld fracture is relatively narrow, mainly extending to the QC zone from the cleavage fracture zone of about 30 microns in the middle. After the T8 weld cracks in an intergranular manner near the surface, it changes from a short cleavage region to a QC fracture.
Based on the above analysis, the fracture centers of the five groups of TIG welds after hydrogen charging have dimple morphology. It indicates that five groups of welds were ultimately fractured by MVC, but there are differences in the characteristics of the five groups of welds at the edge portion of the fracture. The heat input of the T5 weld is small, the ferrite phase mainly exists in the form of strips and dendrites, and the cracks tend to propagate along the dendritic ferrite–austenite interface, forming the characteristics of intergranular fracture. Luppo et al. [19] found that cracks at the ferrite–austenite interface were clearly visible during bending tests of the welds. Buckley et al. [53] found that cracking always occurs at the ferrite–austenite interface and that ferrite is critical to the initiation of the overall fracture process. The heat input of T8 is slightly more than that of T5, the proportion of dendritic ferrite is larger, and the region extending along the grain fracture zone is deeper. The ferrite in the T1 weld exists in the form of lath and strip, and part of the lath ferrite–austenite interface becomes the propagation path of the crack, so that the edge of the T1 weld also has the characteristics of intergranular fracture. The ferrite morphology in the T4 weld is a reticular structure, and there are few regions of intergranular fracture. There are many small facets in the cleavage surface of the T4 fracture, indicating that the ferrite of the reticular structure will replace the austenite. Separately, the crack propagates through the interior of the austenite grain, forming a transcrystalline rupture. The heat input of the T7 weld is relatively large, and the austenite columnar crystal axis that forms has a relatively large width. At this moment, the morphology of the ferrite includes lathy ferrite, stripe ferrite, and dendritic ferrite, so a deep edge appears on the fracture edge. After the crack propagates to the vicinity of the lathy ferrite, it propagates through the austenite grain, and a transcrystalline rupture occurs, forming a glide plane.
Figure 10 shows the side-longitudinal view near the fracture location of the weld fracture before and after hydrogen charging. It can be seen that surface cracks perpendicular to the stretching direction appear on the side of the tensile fracture after hydrogen charging. The surface crack of the T1 weld is basically parallel to the fracture surface. Although the length of the crack is larger, the depth of the crack is basically shallow. The fracture-side morphology of the T4 and T5 welds is mainly long surface cracks, while the depth of the cracks closer to the fracture is relatively large, and the depth of the cracks farther away from the fracture is relatively small. The surface cracks of T7 welds merged with each other, and the width of some cracks increased significantly, indicating that the susceptibility of T7 welds to HE is higher. The number of surface cracks in the T8 weld is less, and the depth is shallower than before, which indicates that the T8 weld has better plasticity.
Hence, it is found that the resistance of the weld to HE is affected by the welding heat input. The continuous dendritic ferrite structure in the weld has high resistance to HE. On the premise of ensuring that the 3 mm 304 austenitic stainless steel is welded through, the appropriate increase in welding current and welding speed will result in a more continuous dendritic ferrite structure in the weld. If performed to the contrary, it will form scattered lathy ferrite. Therefore, the welding heat input can be changed by appropriately increasing the welding current and welding speed, thereby adjusting the microstructure of the weld to improve its HE resistance.

4. Conclusions

In this work, the effect of heat input on the HE sensitivity of 304 austenitic stainless steel TIG welds was investigated using a macroscopic tensile property evaluation method combined with a microstructure characterization technique. The conclusions are as follows:
(1)
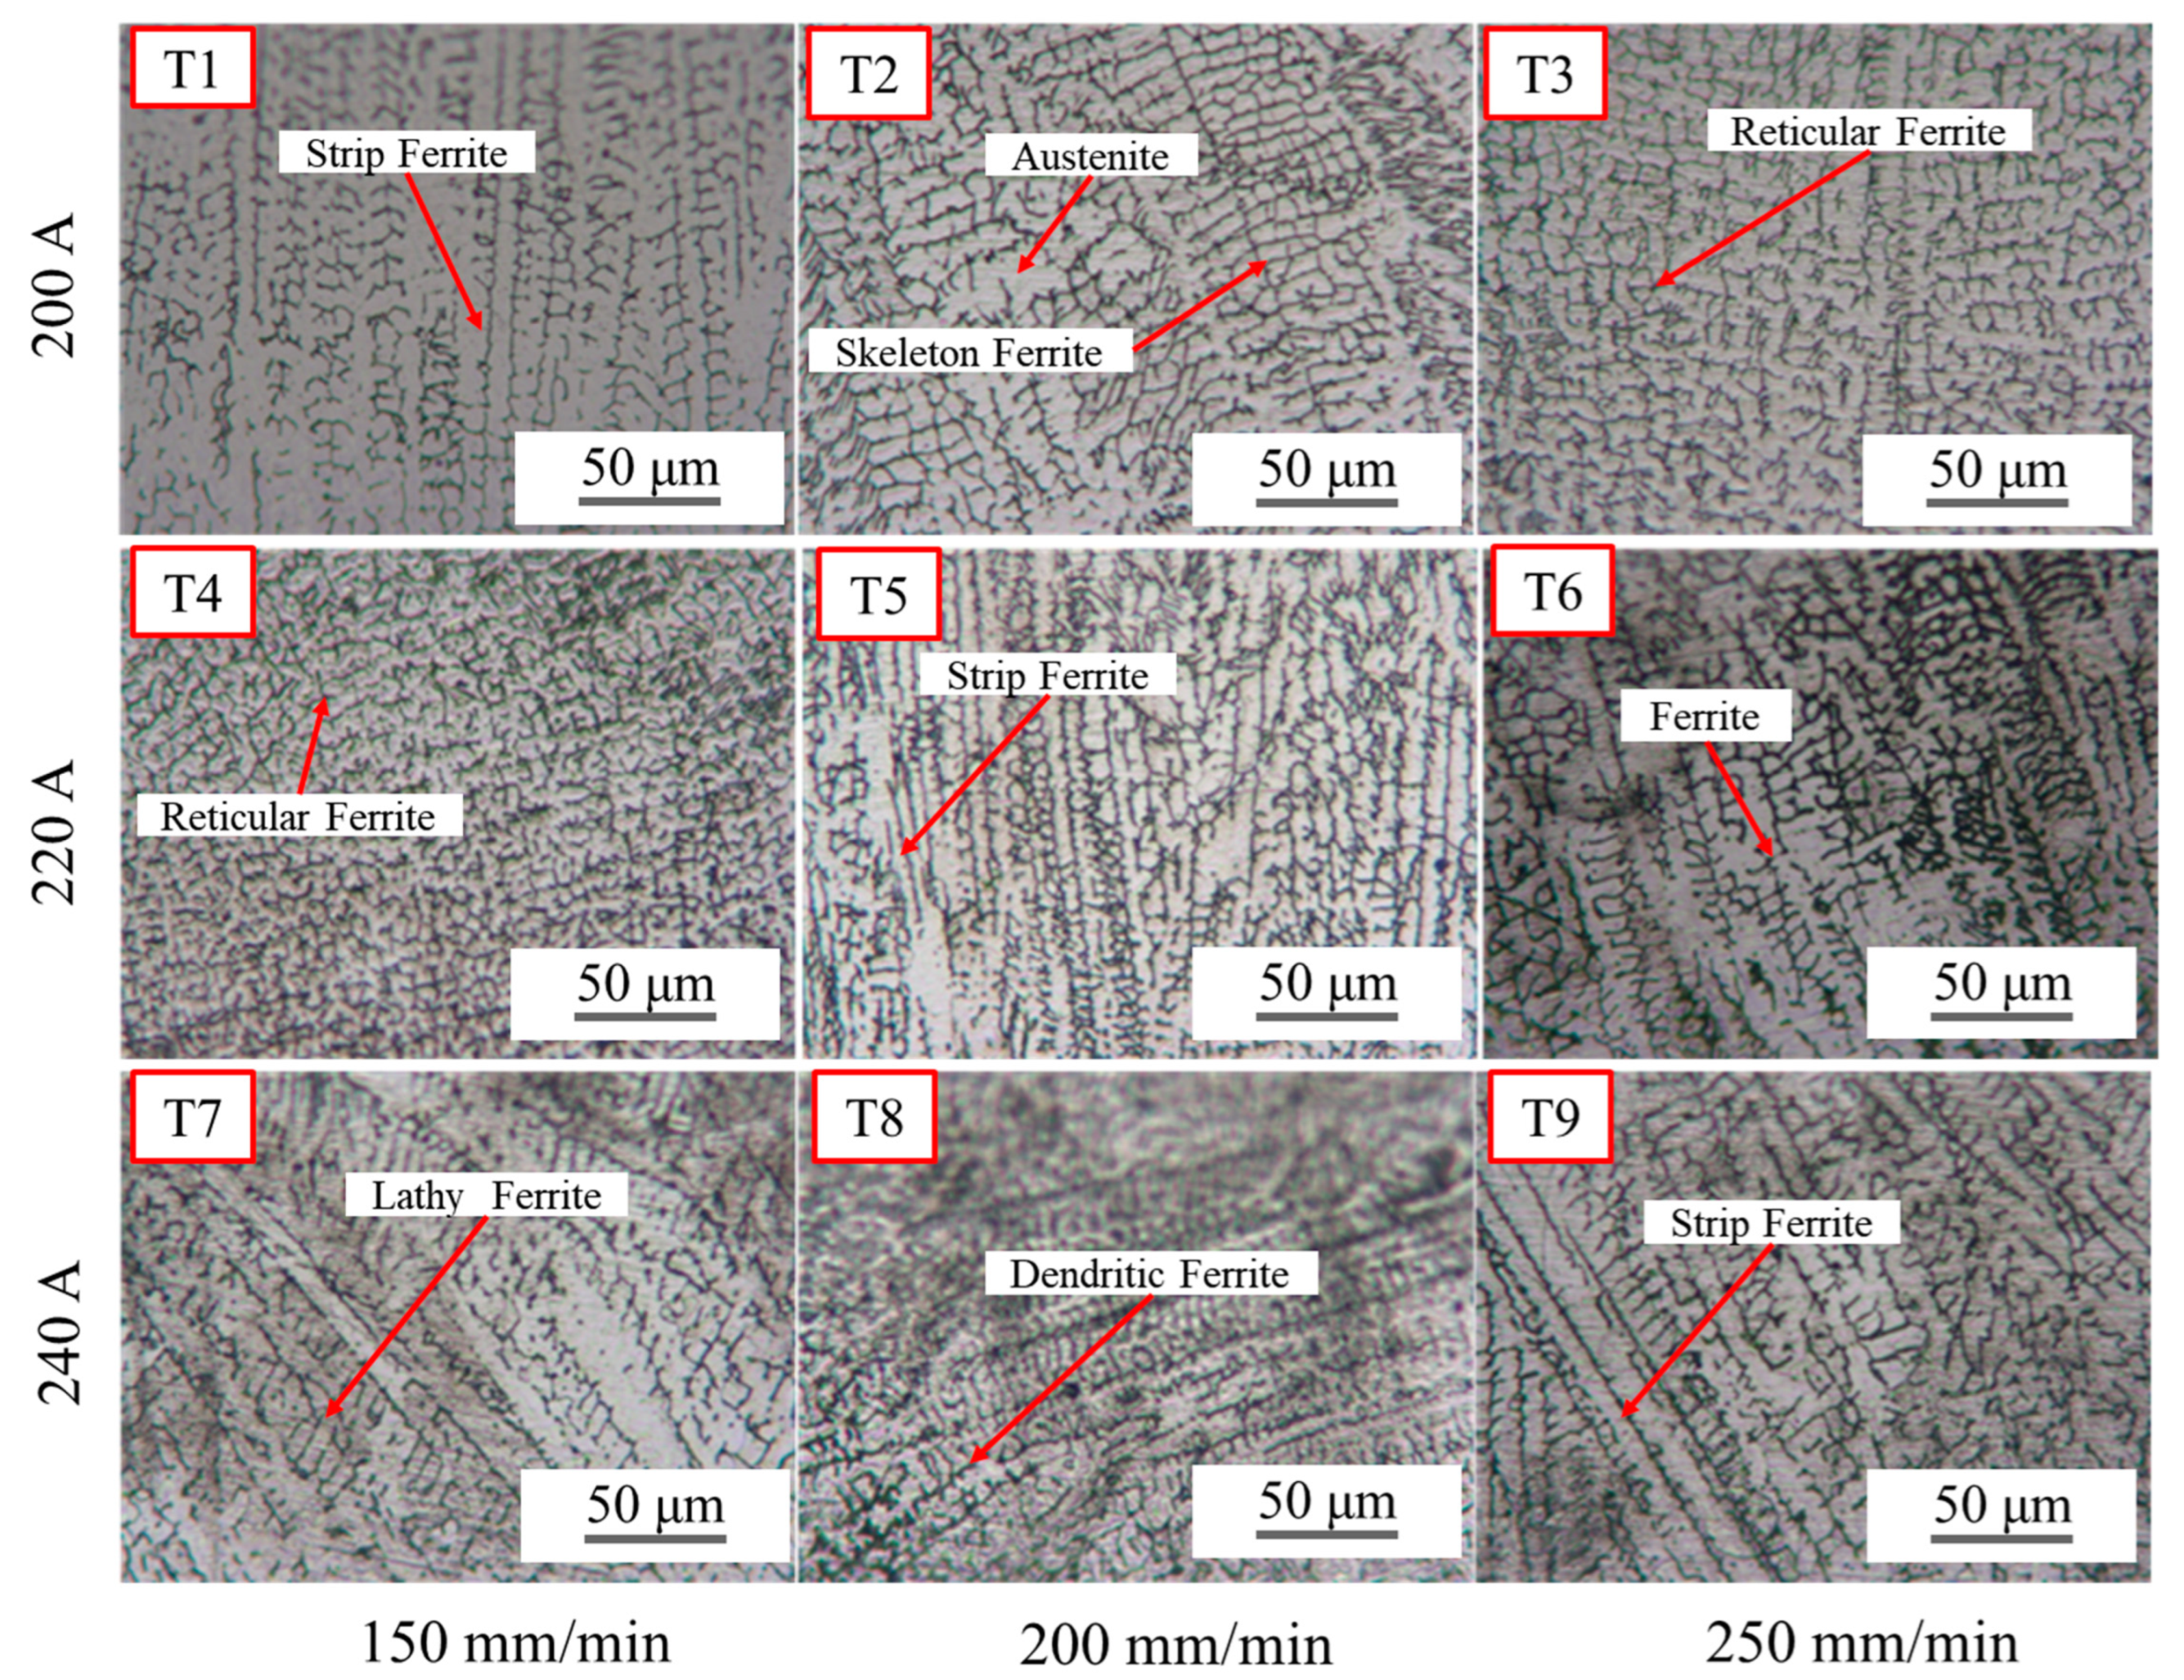
After TIG welding, weld grain size significantly increased compared to the base metal. In addition, TIG weld tissue characteristics are closely related to the welding heat input. With an increase in TIG welding heat input, the ferrite content in the weld shows a tendency to first increase and then decrease. In the perspective of morphology, it first changes from lathy ferrite and strip ferrite to dendritic ferrite, and finally becomes reticular ferrite and lathy ferrite.
(2)
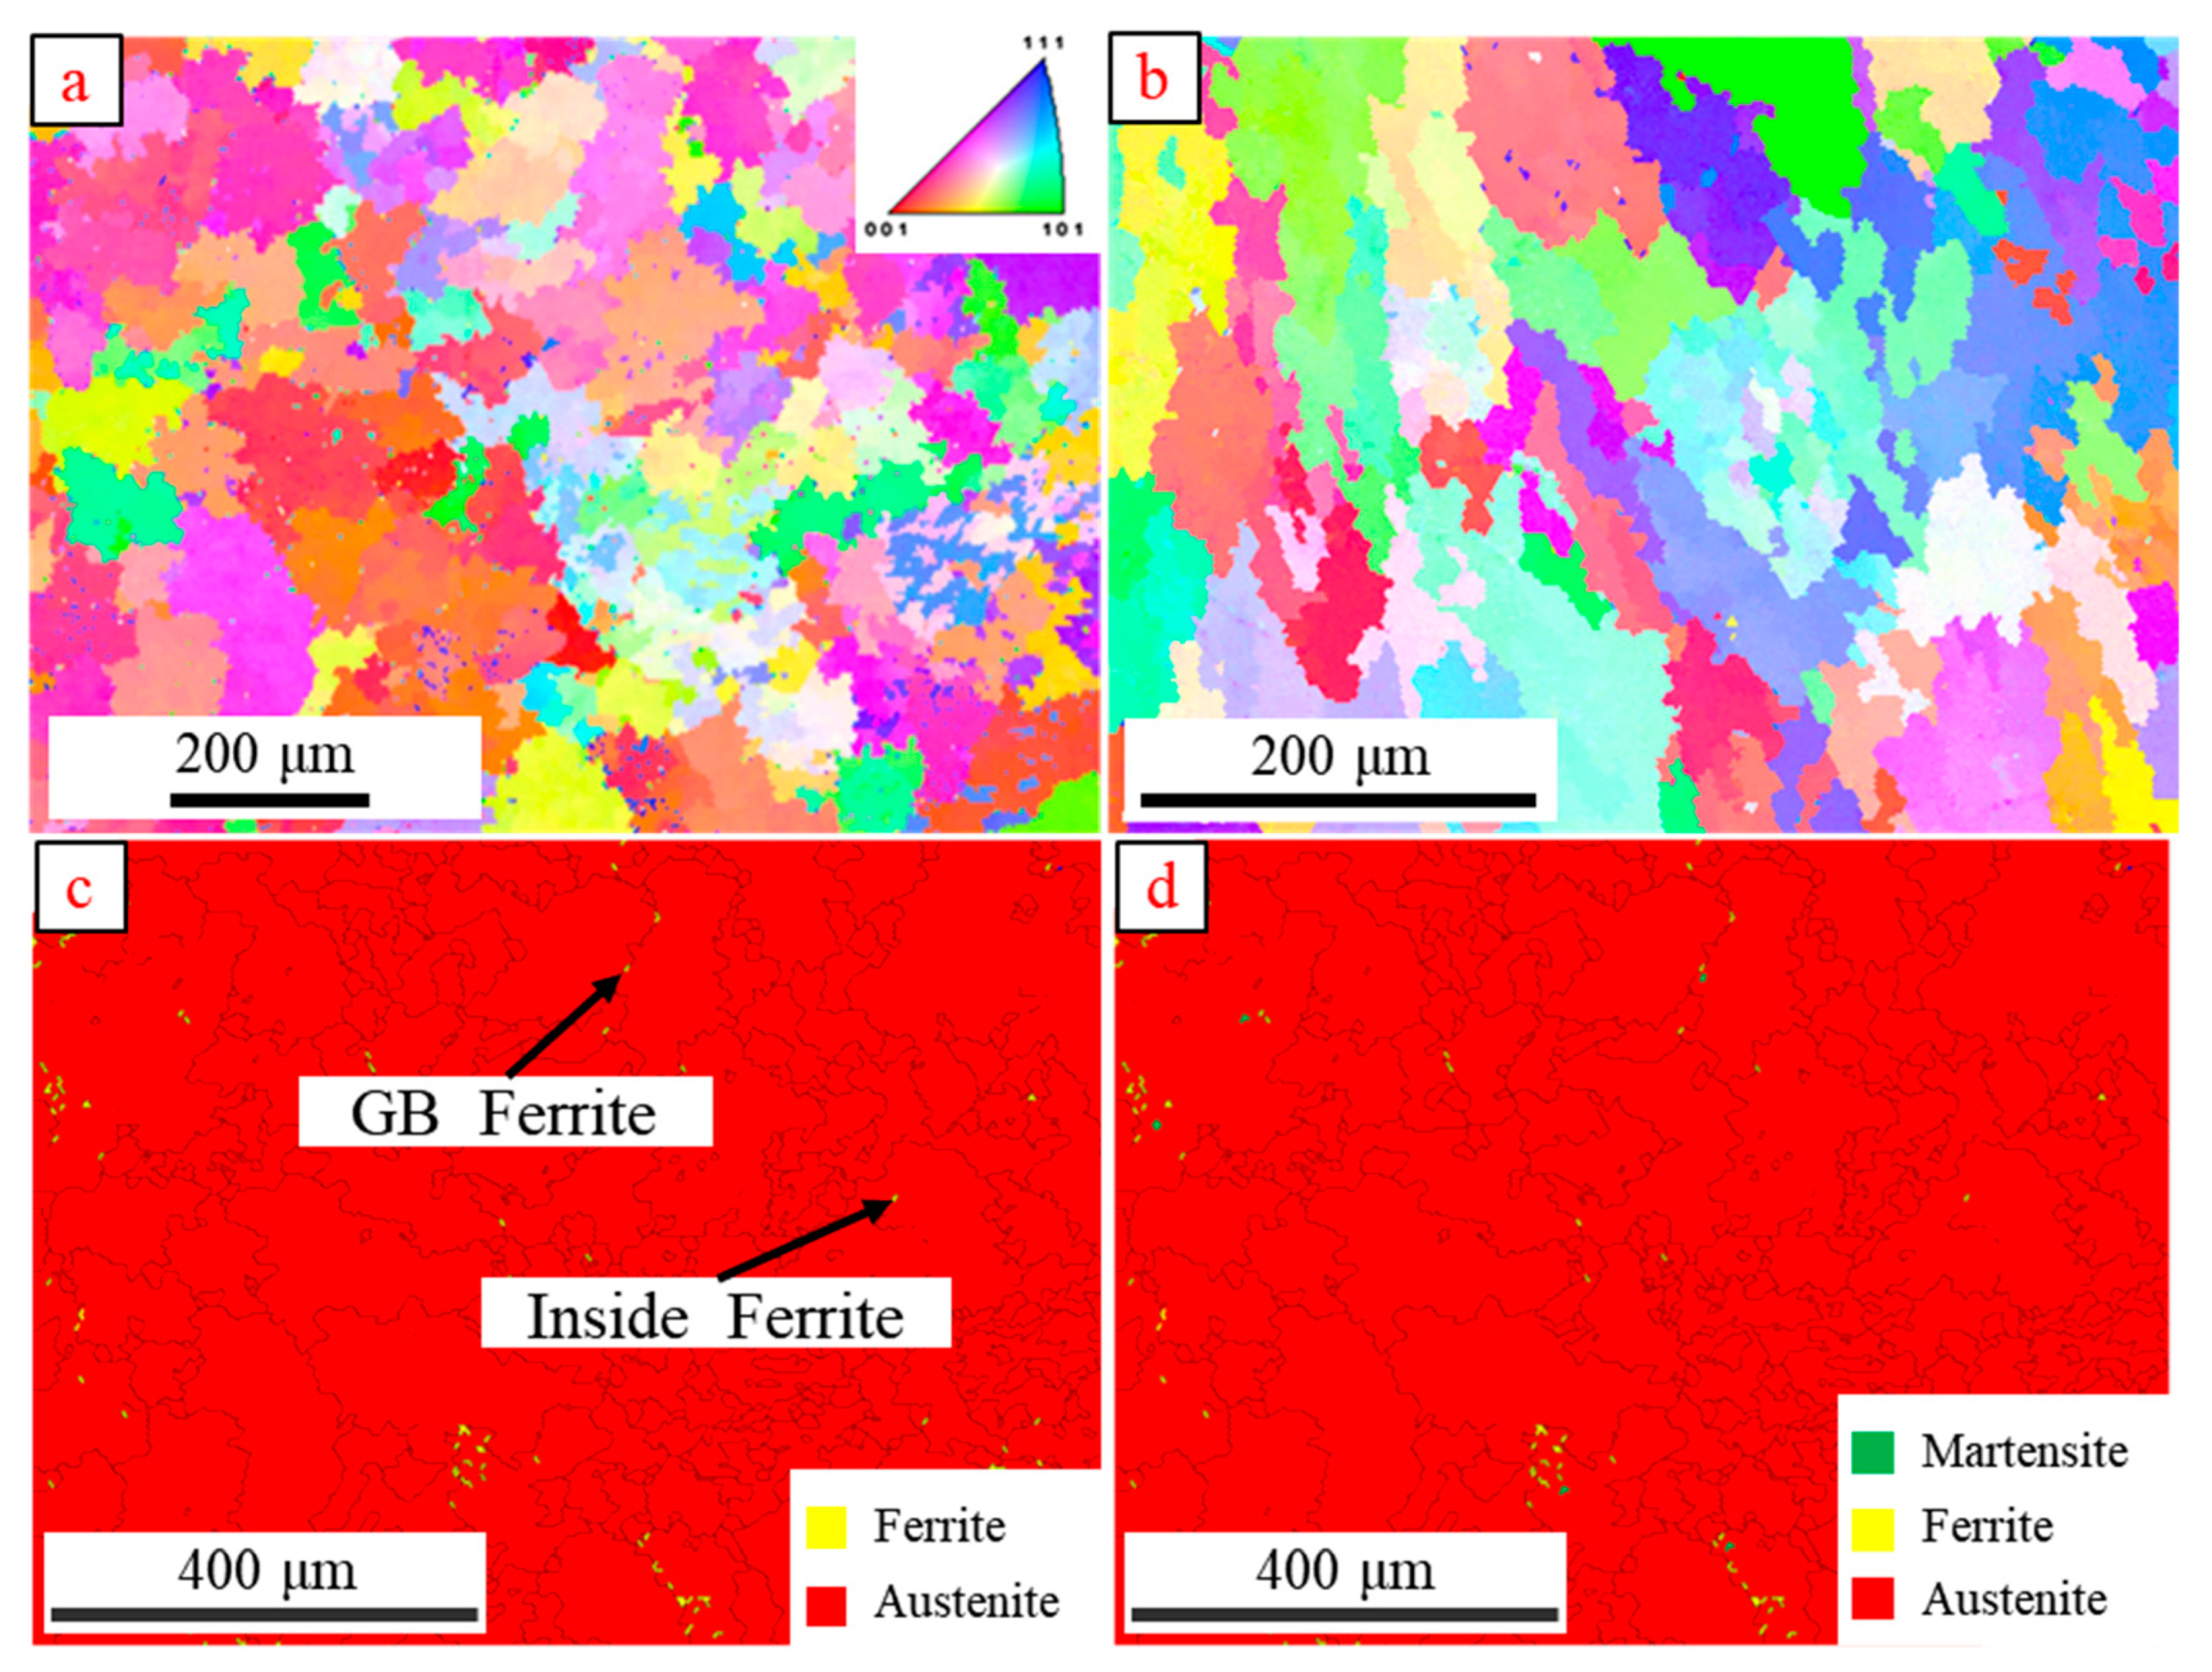
Through the study of the microstructure evolution pattern of 304 austenitic stainless steel TIG welds before and after hydrogen charging, it was found that a BCC martensitic phase with a content of 0.367% was generated in the weld after hydrogen charging. The leftward shift of the diffraction peak angle of the TIG weld after hydrogen charging indicates a slight increase in the lattice size of the weld.
(3)
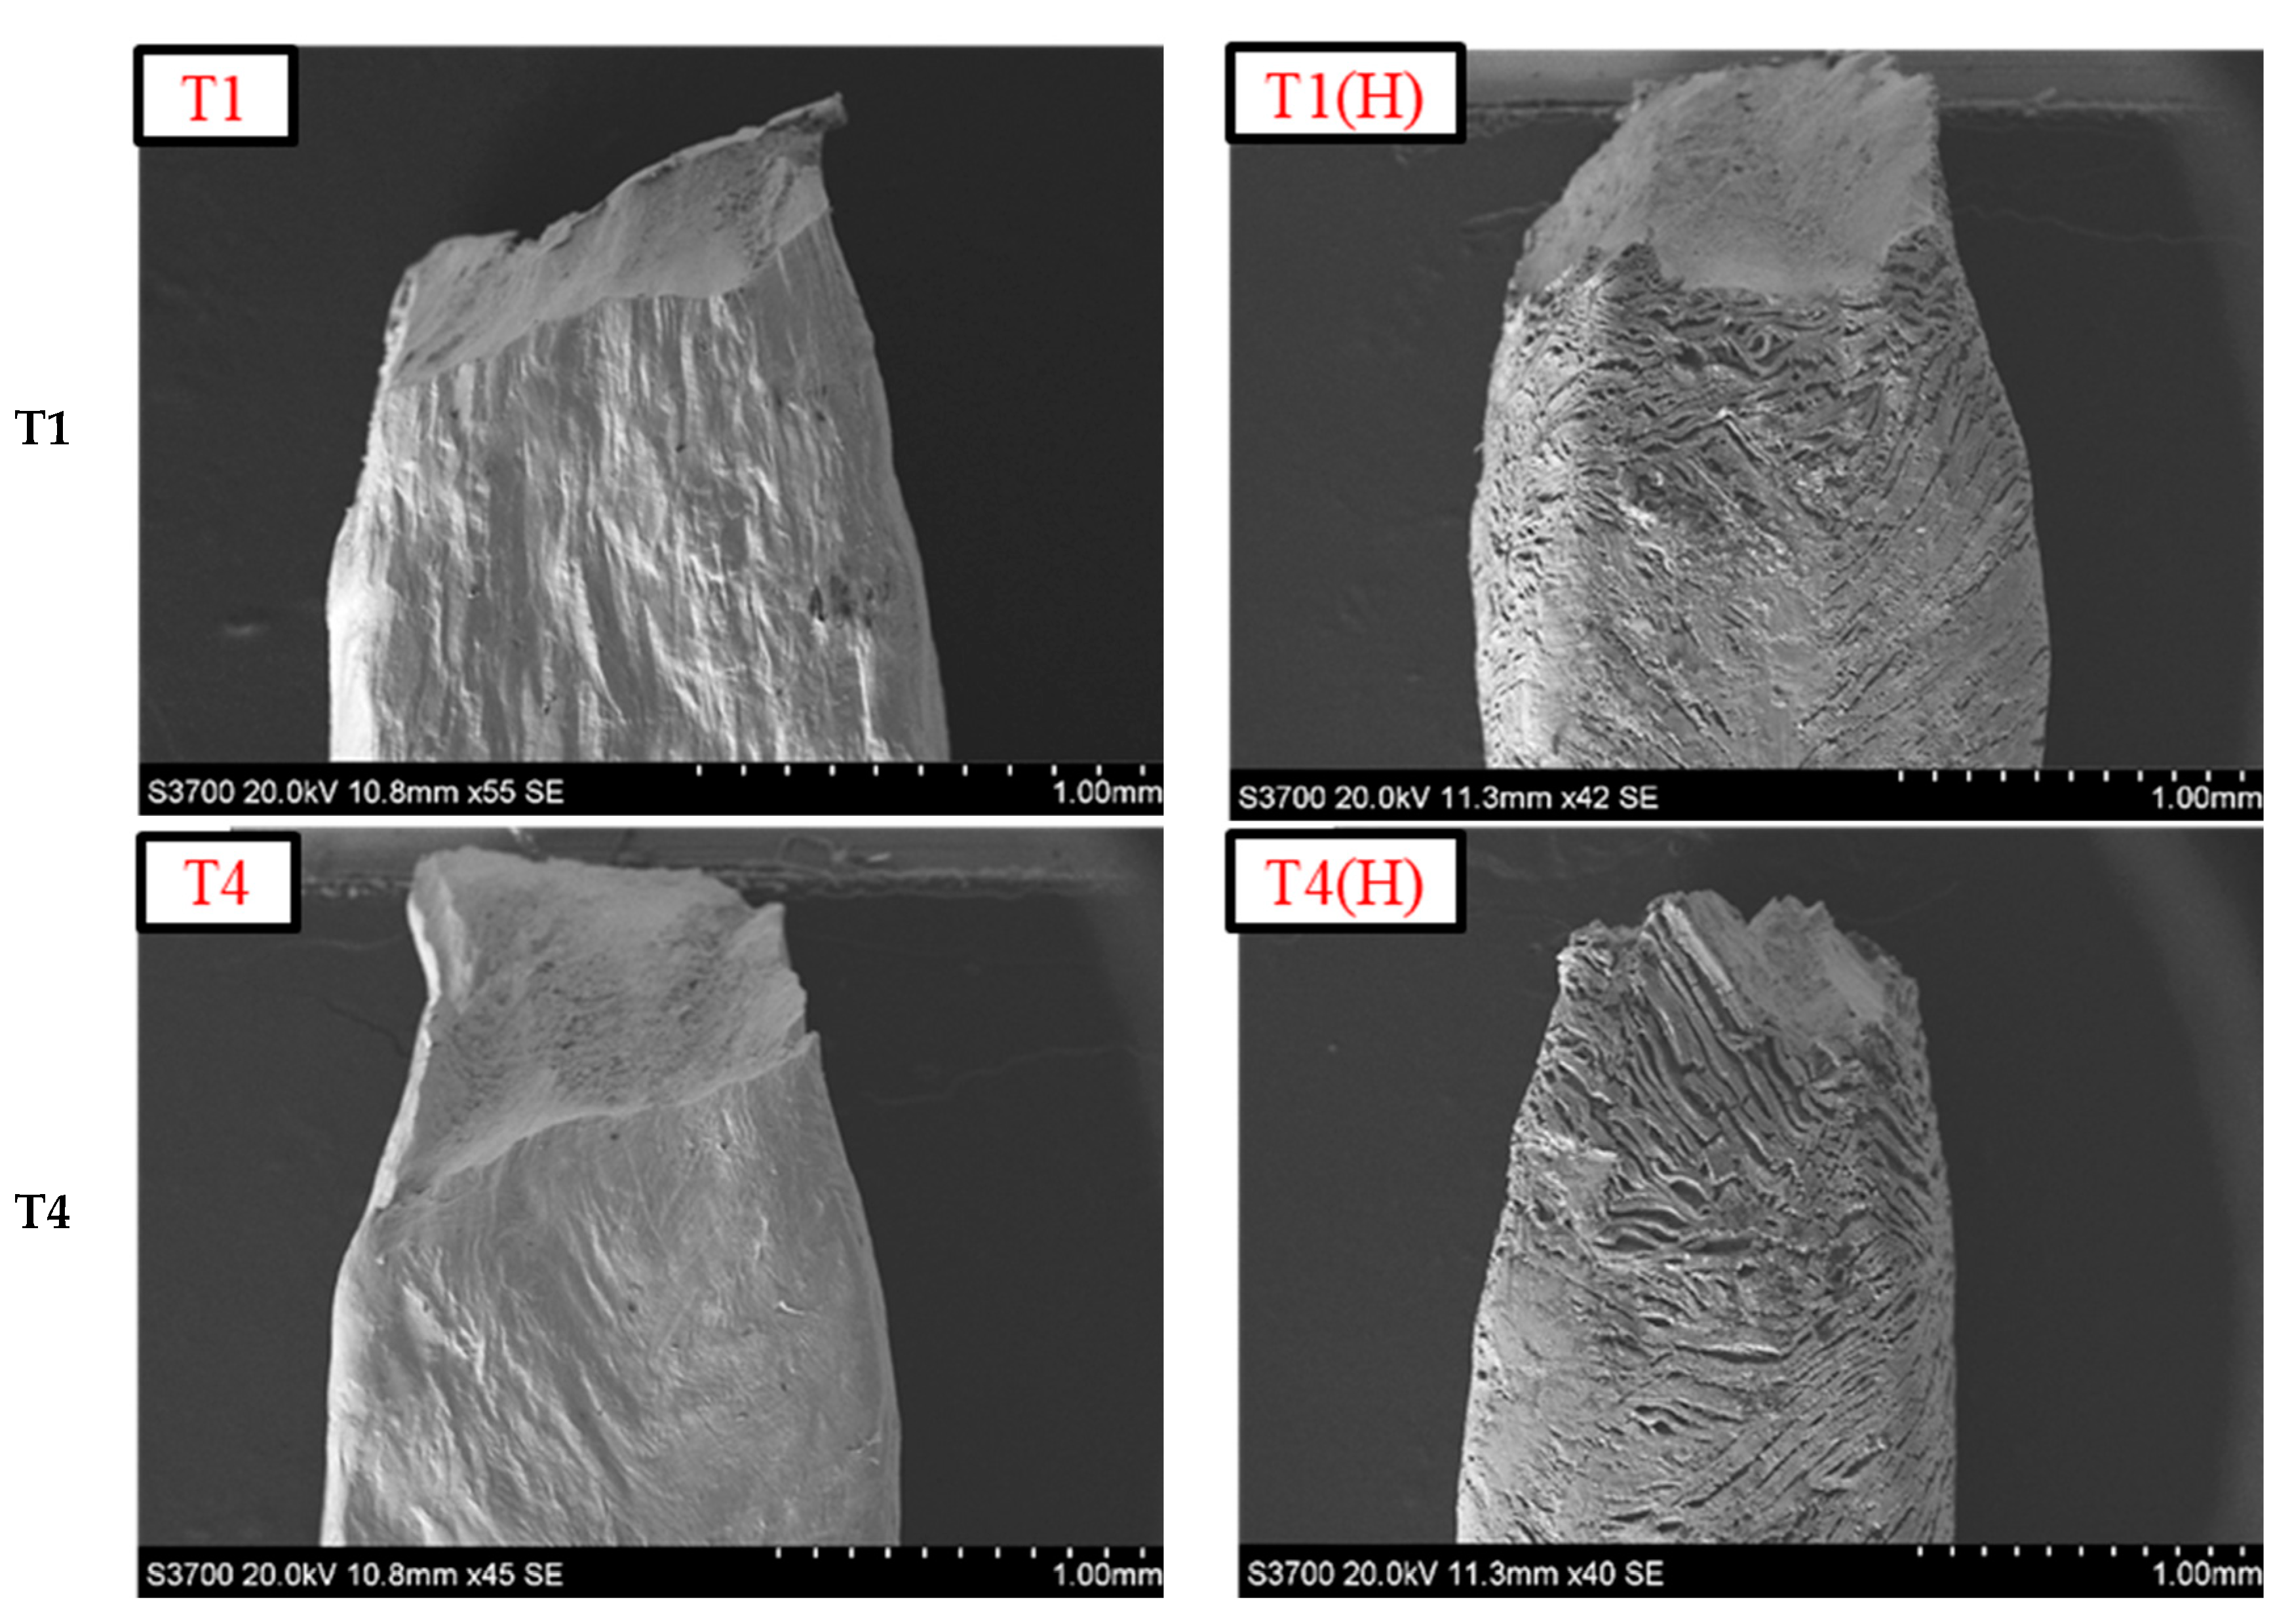
With the increase in welding heat input, the resistance of 304 austenitic stainless steel TIG welds to HE first increases and then decreases. The resistance of TIG welds to HE at a heat input of 0.778 kJ/mm is better; the relative elongation (RE) is 0.884, and the relative reduction of area (RRA) is 0.721.
(4)
Continuous dendritic ferrite can improve the resistance of 304 stainless steel welds to HE. Therefore, in order to improve the resistance of the weld to HE in practice, the welding heat input should be changed to increase the continuous ferrite content.

Author Contributions

Conceptualization, C.Z., J.X. and M.H.; methodology, J.X. and M.H.; validation, J.X.; writing—original draft preparation, J.X. and M.H.; writing—review and editing, J.X., H.W. and R.Y.; visualization, X.Y., H.X. and J.X.; supervision, C.Z. and Y.Y.; resources, C.Z., Y.Z. and H.W.; project administration, C.Z., Y.Y. and H.W.; funding acquisition, C.Z., Y.Y. and H.W.; All authors have read and agreed to the published version of the manuscript.

Funding

This research was funded by the Science and Technology Program of Guangzhou (No. 202002030275), the Guangdong Basic and Applied Basic Research Foundation (No. 2019A1515011157), the National Foreign Expert Program (No. G2022163005L), the National Natural Science Foundation of China (Nos. 51705157, 51905177, and 52071091), and the Key-Area Research and Development Program of Guangdong Province (No. 2020B0404020004).

Data Availability Statement

Not applicable.

Conflicts of Interest

The authors declare no conflict of interest.

References

  1. Li, W.; Guo, T.; Xu, L.; Chen, L.; Jiang, B.; Wang, X.; Wu, H.; Qiao, L. Promotion of pitting corrosion at hydrogen-enriched α/γ phase boundaries in austenitic stainless steel weld joints. Acta Mater. 2022, 227, 117728. [Google Scholar] [CrossRef]
  2. Zhou, C.; Liu, X.; Zhang, Y.; Wu, H.; Yang, Y. Numerical study on effect of inclusions on hydrogen segregation in steel under stress conditions. Int. J. Hydrogen Energy 2022, 47, 20310–20322. [Google Scholar] [CrossRef]
  3. Kim, K.S.; Kang, J.H.; Kim, S.J. Nitrogen effect on hydrogen diffusivity and hydrogen embrittlement behavior in austenitic stainless steels. Scr. Mater. 2020, 184, 70–73. [Google Scholar] [CrossRef]
  4. Landowski, M.; Swierczynska, A.; Rogalski, G.; Fydrych, D. Autogenous Fiber Laser Welding of 316L Austenitic and 2304 Lean Duplex Stainless Steels. Materials 2020, 13, 2930. [Google Scholar] [CrossRef] [PubMed]
  5. Hyza, B.; Jh, D.; Xmm, B.; Ying, S.B.; Tao, W.A.; Wjl, A.; Qxsa, C.; Jymc, E.; Dyz, F.; Wei, L. Effect of deformation microstructures on hydrogen embrittlement sensitivity and failure mechanism of 304 austenitic stainless steel: The significant role of rolling temperature. J. Mater. Res. Technol. 2022, 17, 2831–2846. [Google Scholar]
  6. Thakare, J.G.; Pandey, C.; Mahapatra, M.M.; Mulik, R.S. An assessment for mechanical and microstructure behavior of dissimilar material welded joint between nuclear grade martensitic P91 and austenitic SS304 L steel. J. Manuf. Process. 2019, 48, 249–259. [Google Scholar] [CrossRef]
  7. Ogawa, Y.; Takakuwa, O.; Okazaki, S.; Okita, K.; Matsuoka, S. Pronounced transition of crack initiation and propagation modes in the hydrogen-related failure of a Ni-based superalloy 718 under internal and external hydrogen conditions. Corros. Sci. 2019, 161, 108186. [Google Scholar] [CrossRef]
  8. Izawa, C.; Wagner, S.; Deutges, M.; Martin, M.; Weber, S.; Pargeter, R.; Michler, T.; Uchida, H.H.; Gemma, R.; Pundt, A. Relationship between hydrogen embrittlement and M-d30 temperature: Prediction of low-nickel austenitic stainless steel’s resistance. Int. J. Hydrogen Energy 2019, 44, 25064–25075. [Google Scholar] [CrossRef]
  9. Singh, S.; Altstetter, C. Effects of hydrogen concentration on slow crack growth in stainless steels. Metall. Mater. Trans. A 1982, 13, 1799–1808. [Google Scholar] [CrossRef]
  10. Perng, T.P.; Altstetter, C.J. Comparison of hydrogen gas embrittlement of austenitic and ferritic stainless steels. Metall. Mater. Trans. A 1987, 18, 123–134. [Google Scholar] [CrossRef]
  11. Gavriljuk, V.G.; Stein, G.; Berns, H. Structural Stability of Austenitic CrMn(Mo)N Steels for High-Strength, Corrosion-Resistant Retaining Rings. Steel Res. Int. 2003, 74, 444–452. [Google Scholar] [CrossRef]
  12. Shivanyuk, V. On a role of hydrogen-induced ɛ-martensite in embrittlement of stable austenitic steel. Scr. Mater. 2003, 49, 601–606. [Google Scholar] [CrossRef]
  13. Teus, S.M.; Shyvanyuk, V.N.; Gavriljuk, V.G. Hydrogen-induced γ→ɛ transformation and the role of ɛ-martensite in hydrogen embrittlement of austenitic steels. Mater. Sci. Eng. A 2008, 497, 290–294. [Google Scholar] [CrossRef]
  14. Martin, M.; Weber, S.; Izawa, C.; Wagner, S.; Pundt, A.; Theisen, W. Influence of machining-induced martensite on hydrogen-assisted fracture of AISI type 304 austenitic stainless steel. Int. J. Hydrogen Energy 2011, 36, 11195–11206. [Google Scholar] [CrossRef]
  15. Wang, Y.; Wu, X.; Li, X.; Wu, W.; Gong, J. Combined effects of prior plastic deformation and sensitization on hydrogen embrittlement of 304 austenitic stainless steel. Int. J. Hydrogen Energy 2019, 44, 7014–7031. [Google Scholar] [CrossRef]
  16. Gulenc, B.; Develi, K.; Kahraman, N.; Durgutlu, A. Experimental study of the effect of hydrogen in argon as a shielding gas in MIG welding of austenitic stainless steel. Int. J. Hydrogen Energy 2005, 30, 1475–1481. [Google Scholar] [CrossRef]
  17. Reccagni, P.; Rnek, C.; Engelberg, D.L.; Lu, Q.; Gittos, M. Assessment of the Influence of Hydrogen on the Microstructure of TIG Welded Grade 2205 Duplex Stainless Steel. In Proceedings of the 2016 European Corrosion Congress, Montpellier, France, 11–15 September 2016. [Google Scholar]
  18. Chen, X.Y.; Ma, L.L.; Zhou, C.S.; Hong, Y.J.; Tao, H.M.; Zheng, J.Y.; Zhang, L. Improved resistance to hydrogen environment embrittlement of warm-deformed 304 austenitic stainless steel in high-pressure hydrogen atmosphere. Corros. Sci. 2019, 148, 159–170. [Google Scholar] [CrossRef]
  19. Luppo, M.I.; Hazarabedian, A.; Ovejero-García, J. Effects of delta ferrite on hydrogen embrittlement of austenitic stainless steel welds. Corros. Sci. 1999, 41, 87–103. [Google Scholar] [CrossRef]
  20. Zhou, C.; Dai, P.; Wu, H.; He, M.; Liu, X.; Chu, P.K. Effect of the ferrite morphology on hydrogen embrittlement of MAG welded 304 austenitic stainless steel. Appl. Surf. Sci. 2022, 606, 154866. [Google Scholar] [CrossRef]
  21. Fu, Z.H.; Yang, B.J.; Shan, M.L.; Li, T.; Zhu, Z.Y.; Ma, C.P.; Zhang, X.; Gou, G.Q.; Wang, Z.R.; Gao, W. Hydrogen embrittlement behavior of SUS301L-MT stainless steel laser-arc hybrid welded joint localized zones. Corros. Sci. 2020, 164, 108337. [Google Scholar] [CrossRef]
  22. Fu, Z.H.; Li, T.; Shan, M.L.; Gou, G.Q.; Zhu, Z.Y.; Ma, C.P.; Gao, W.; Hu, Y.C. Hydrogen atoms on the SCC behavior of SUS301L-MT stainless steel laser-arc hybrid welded joints. Corros. Sci. 2019, 148, 272–280. [Google Scholar] [CrossRef]
  23. Cao, R.; Xu, L.; Jiang, B.; Gao, M.; Qiao, L. Coupling effect of microstructure and hydrogen absorbed during service on pitting corrosion of 321 austenitic stainless steel weld joints. Corros. Sci. 2019, 164, 108339. [Google Scholar] [CrossRef]
  24. Takeda, S.; Ohara, Y.; Uchimoto, T.; Enoki, H.; Iijima, T.; Tokuda, E.; Yamada, T.; Nagatomo, Y. Characterization of fatigue crack of hydrogen-charged austenitic stainless steel by electromagnetic and ultrasonic techniques. Int. J. Hydrogen Energy 2022, 47, 32223–32234. [Google Scholar] [CrossRef]
  25. Michler, T.; Naumann, J. Hydrogen environment embrittlement of austenitic stainless steels at low temperatures. Int. J. Hydrogen Energy 2008, 33, 2111–2122. [Google Scholar] [CrossRef]
  26. Fukuyama, S.; Sun, D.S.; Zhang, L.; Wen, M.; Yokogawa, K. Effect of temperature on hydrogen environment embrittlement of type 316 series austenitic stainless seels at low temperatures. J. Jpn. I Met. 2003, 67, 456–459. [Google Scholar] [CrossRef] [Green Version]
  27. Han, Y.D.; Jing, H.Y.; Xu, L.Y. Welding heat input effect on the hydrogen permeation in the X80 steel welded joints. Mater. Chem. Phys. 2012, 132, 216–222. [Google Scholar] [CrossRef]
  28. GB/T 24511-2017; Stainless Steel and Heat Resisting Steel Plate, Sheet and Strip for Pressure Equipments. Chinese Standard Press: Beijing, China, 2017.
  29. GB/T 983-2012; Covered Electrodes for Manual Metal Arc Welding of Stainless and Heat-Resisting Steels. Chinese Standard Press: Beijing, China, 2012.
  30. GB/T 13298-2015; Inspection Methods of Microstructure for Metals. Chinese Standard Press: Beijing, China, 2015.
  31. ISO/TR 17671-1:2002(E); Welding—Recommendations for Welding of Metallic Materials—Part 1: General Guidance for Arc Welding. ISO: Geneva, Switzerland, 2002.
  32. Lippold, J.C. Solidification of Austenitic Stainless Steel Weldments. Weld. J. 1979, 58, 362S–374S. [Google Scholar]
  33. Hu, H.; Zhao, M.; Chen, S.; Rong, L. Effect of grain boundary character distribution on hydrogen embrittlement in Fe–Ni based alloy. Mater. Sci. Eng. A 2020, 780, 139201. [Google Scholar] [CrossRef]
  34. Mundra, K.; Blackburn, J.M.; Debroy, T. Absorption and transport of hydrogen during gas metal arc welding of low alloy steel. Sci. Technol. Weld. Join. 1997, 2, 174–184. [Google Scholar] [CrossRef]
  35. Wessman, S. Evaluation of the WRC 1992 diagram using computational thermodynamics. Welding in the World 2013, 57, 305–313. [Google Scholar] [CrossRef]
  36. Saluja, R.; Moeed, K. Experimental Investigation of Solidification-Mode and Response Surface Modeling of Ferrite-Content in Grade 304L Pulse GMA Welded Plates. Mater. Today Proc. 2019, 18, 3876–3890. [Google Scholar] [CrossRef]
  37. Chuaiphan, W.; Srijaroenpramong, L. Optimization of TIG welding parameter in dissimilar joints of low nickel stainless steel AISI 205 and AISI 216. J. Manuf. Process. 2020, 58, 163–178. [Google Scholar] [CrossRef]
  38. Kotecki, D.J. WRC-1992 Constitution Diagram for Stainless Steel Weld Metals. Weld. J. 2017, 96, 22–24. [Google Scholar]
  39. Zhao, Q. Effect of Hydrogen on Internal Friction of NiTi—based alloys. Master’s Thesis, Nanjing Tech University, Nanjing, China, 2014. (In Chinese). [Google Scholar]
  40. Mine, Y.; Koga, K.; Kraft, O.; Takashima, K. Mechanical characterisation of hydrogen-induced quasi-cleavage in a metastable austenitic steel using micro-tensile testing. Scr. Mater. 2016, 113, 176–179. [Google Scholar] [CrossRef]
  41. Yang, Q.; Qiao, L.J.; Chiovelli, S.; Luo, J.L. Critical hydrogen charging conditions for martensite transformation and surface cracking in type 304 stainless steel. Scr. Mater. 1999, 40, 1209–1214. [Google Scholar] [CrossRef]
  42. Hoelzel, M.; Danilkin, S.A.; Ehrenberg, H.; Toebbens, D.M.; Udovic, T.J.; Fuess, H.; Wipf, H. Effects of high-pressure hydrogen charging on the structure of austenitic stainless steels. Mater. Sci. Eng. A 2004, 384, 255–261. [Google Scholar] [CrossRef]
  43. Li, X.G.; Gong, B.M.; Deng, C.Y.; Li, Y.Z. Effect of pre-strain on microstructure and hydrogen embrittlement of K-TIG welded austenitic stainless steel. Corros. Sci. 2019, 149, 1–17. [Google Scholar] [CrossRef]
  44. El-Tahawy, M.; Um, T.; Nam, H.S.; Choe, H.; Gubicza, J. The effect of hydrogen charging on the evolution of lattice defects and phase composition during tension in 316L stainless steel. Mater. Sci. Eng. A 2019, 739, 31–36. [Google Scholar] [CrossRef]
  45. Zheng, Y.; Tan, Y.; Zhou, C.; Chen, G.; Zhang, G. A review on effect of hydrogen on rubber seals used in the high-pressure hydrogen infrastructure. Int. J. Hydrogen Energy 2020, 45, 23721–23738. [Google Scholar] [CrossRef]
  46. Zhao, T.; Liu, Z.; Xu, X.; Li, Y.; Du, C.; Liu, X. Interaction between hydrogen and cyclic stress and its role in fatigue damage mechanism. Corros. Sci. 2019, 157, 146–156. [Google Scholar] [CrossRef]
  47. Zhang, L.; Li, Z.Y.; Zheng, J.Y.; Zhao, Y.Z.; Xu, P.; Zhou, C.L.; Li, X. Effect of strain-induced martensite on hydrogen embrittlement of austenitic stainless steels investigated by combined tension and hydrogen release methods. Int. J. Hydrogen Energy 2013, 38, 8208–8214. [Google Scholar] [CrossRef]
  48. Dong, L.; Han, E.H.; Peng, Q.; Ke, W.; Wang, L. Environmentally assisted crack growth in 308L stainless steel weld metal in simulated primary water. Corros. Sci. 2017, 117, 1–10. [Google Scholar] [CrossRef]
  49. Robinson, K. The influence of lattice hydrogen content on the hydrogen-assisted cracking of high strength steel. Corros. Sci. 1986, 26, 705–717. [Google Scholar]
  50. Rozenak, P.; Eliezer, D. Effects of metallurgical variables on hydrogen embrittlement in AISI type 316, 321 and 347 stainless steels. Mater. Sci. Eng. A 1983, 61, 31–41. [Google Scholar] [CrossRef]
  51. Boiler, A. ASME Boiler and Pressure Vessel Code: An International Code; American Society of Mechanical Engineers: New York, NY, USA, 2007. [Google Scholar]
  52. Se-Hwan , C.H.I.; Kim, G.C.; Hong, J.H.; Shin, Y.K.; Kim, Y.J. The influence of delta (δ) ferrite on the irradiation effects in type-304 stainless steel weldment. In Proceedings of the Korean Nuclear Society Spring Meeting, Cheju, Korea, 18 May 2001. [Google Scholar]
  53. Buckley, J.R.; Hardie, D. The effect of pre-straining and δ-ferrite on the embrittlement of 304L stainless steel by hydrogen. Corros. Sci. 1993, 34, 93–107. [Google Scholar] [CrossRef]
Figure 1. Illustration of macroscopic tensile test specimen: (a) Dimensions of tensile specimen (in mm); (b) View of test specimen.
Metals 12 01943 g001
Figure 2. Micrographs of T1–T9 welds.
Metals 12 01943 g002
Figure 3. Ferrite content in welds with different heat input.
Metals 12 01943 g003
Figure 4. IPF of 304 austenitic stainless steel base metal.
Metals 12 01943 g004
Figure 5. EBSD results of TIG weld before and after hydrogen charging (T8): (a) IPF of uncharged, (b) IPF of hydrogen-charged, (c) phase map of uncharged, (d) phase map of hydrogen-charged.
Metals 12 01943 g005
Figure 6. XRD patterns of base metal and TIG weld (T8).
Metals 12 01943 g006
Figure 7. Stress–strain curves of TIG welds before and after hydrogen charging.
Metals 12 01943 g007
Figure 8. The RE/RRA plotted against the heat input.
Metals 12 01943 g008
Figure 9. Macroscopic fracture surfaces of the TIG welds after hydrogen charging (T1-a is fracture surface of T1, T1-b is fracture center of T1, T1-c is fracture edge of T1; T4-a is fracture surface of T4, T4-b is fracture center of T4, T4-c is fracture edge of T4; T5-a is fracture surface of T5, T5-b is fracture center of T5, T5-c is fracture edge of T5; T7-a is fracture surface of T7, T7-b is fracture center of T7, T7-c is fracture edge of T7; T8-a is fracture surface of T8, T8-b is fracture center of T8, T8-c is fracture edge of T8).
Metals 12 01943 g009
Figure 10. Morphology of TIG weld fractures before and after hydrogen charging (T1, T4, T5, T7 and T8 are uncharged specimen, T1(H), T4(H), T5(H), T7(H) and T8(H) are hydrogen pre-charged specimen).
Metals 12 01943 g010aMetals 12 01943 g010b
Table 1. Chemical compositions of the base metal and welding wire (data from [29,30]).
MaterialCSiMnPSCrNiNFe
304
(wt. %)
0.0780.5841.100.020.01219.058.080.080Bal.
E308
(wt. %)
0.0740.8350.670.0310.01918.369.34-Bal.
Table 2. Tensile properties of the base metal.
MaterialData SourceTensile Strength (MPa)Yield Strength (MPa)Elongation (%)
304Measured73331568.2
standard [24]≥520≥220≥40
Table 3. Parameters of TIG welding.
WeldWelding Current
(A)
Welding Voltage (V)Welding Speed (mm/min)Heat Input
(kJ/mm)
T1200181500.864
T2200182000.648
T3200182500.518
T4220181500.950
T5220182000.713
T6220182500.570
T7240181501.04
T8240182000.778
T9240182500.622
Table 4. Solidification mode, reaction process, and microstructure of austenitic stainless steel welding.
Solidification ModeReaction ProcessMicrostructureFerrite Content Range (%)
AL → L + A → AFull austenite, regular solidification structure0
AFL → L + A → L + A + (A + F) → F + A Ferrites exist at cell and dendrite boundaries0~4
FAL → L + F → L + F + → F + A + A (F) Skeletonized and lathy ferrite formed after ferrite-to-austenite transformation4~20
FL → L + F → F → F + AAcicular ferrite or ferrite parent phase with grain boundaries in the form of austenite and Widmanstatten20 or more
Publisher’s Note: MDPI stays neutral with regard to jurisdictional claims in published maps and institutional affiliations.

