Abstract
The impact of cooling rate during high-pressure gas quenching on the fatigue performance of low-pressure carburized spur gears was studied for steel grades 20MnCr5 and 17NiCrMo6-4. The results show an increased fatigue limit by 10 to 11% when applying a slower cooling rate for both steel grades. Moreover, for 20MnCr5 the slower cooled gears show an increase in compressive residual stresses by 130 MPa compared to the faster cooling, although no significant difference was observed for 17NiCrMo6-4. It is also seen that the cooling rate affects the core hardness for both steel grades, while other properties like surface hardness, case-hardness depth and martensite variant pairing were unaffected. The results for the retained austenite content and average martensite unit size show no clear effect of the cooling rate. The possible influence of different carbon distributions after quenching for the two used cooling rates on the carbide precipitation and fatigue limit is discussed.
1. Introduction
The combination of a hard surface layer and a tough core makes case-carburized and hardened gears an excellent choice for power transmission in, e.g., cars, trucks and wind turbines. The high hardness and compressive residual stresses of the surface layer results in a high wear resistance and fatigue strength while the softer core gives a higher impact toughness [1,2].
In the last 20 years, low-pressure carburizing (LPC) and subsequent high-pressure gas quenching (HPGQ) of gears has become a standard for industrial production of case-hardened gears. LPC can realize the industries ambition to reduce gas emissions and usage of mineral oil quenchants, as well as the need for cleaning parts after heat treatment [3,4].
HPGQ allows control of the cooling rate by changing the gas pressure and fan speed, which has been exploited to lower distortion and improve fatigue performance [3,4,5,6,7]. Moreover, slower cooling rates below the martensitic start temperature (Ms) in HPGQ can significantly improve fatigue performance of case-hardened gears, when compared to faster quenching rates [5,6]. However, the impact of cooling rate has only been studied for a few alloys and it is not clear yet if the fatigue improvement is a general effect, due to the cooling treatment, or if it is a composition dependent effect. Additionally, the exact mechanism of this improvement is not yet understood. The fatigue performance of case-hardened gears has been reported to be influenced by the hardness [8,9], residual stress profile [10,11,12], case-hardness depth [9,12,13], retained austenite content [14,15,16], surface finish [11,17,18,19], defects like cracks and inclusions [11,20,21] as well as the prior austenite grain size (PAGS) and martensite unit size [10,16,22,23]. The fatigue performance dependence on these properties might be complex and interrelated, e.g., a change in type and amount of microcracks could depend on PAGS [22,23].
In this work, the effect of slow and fast cooling through the martensite formation regime during HPGQ is investigated. Hardness, residual stresses, retained austenite and microstructural features are quantified to gain more fundamental understanding of the relation between processing route, microstructure and improved fatigue performance.
2. Materials and Methods
The alloying content of the investigated steel grades, 20MnCr5 and 17NiCrMo6-4, provided by the steel supplier and confirmed by X-ray fluorescence analysis are given in Table 1. The 20MnC5 steel grade is a high cleanliness ingot cast material and the 17NiCrMo6-4 is a continuous cast material. 20MnCr5 will be called A and 17NiCrMo6-4 B in the figure legends. Spur gears were machined from both steel grades and hard machining was done after LPC heat treatment to comply with tolerances for fatigue testing. The machining before characterization was focused on the gear flanks to minimize the influence of distortions from the cooling treatment, but no machining was performed in the root area, which is the area with the highest stresses during fatigue testing [12]. The spur gears had 20 teeth, an outer diameter of 83 mm and a gear module of 3.65.

Table 1.
Composition of main alloying elements (wt% > 0.1) as well as S and P before LPC.
2.1. Heat Treatment and Quenching
The gears were carburized in an industrial multi-chamber LPC system with modular HPGQ using helium gas. The quenching gas pressure as well as fan speed could be varied to achieve different cooling treatments. However, during cooling only the fan speed could be changed. Fast cooling (18 bar Direct) was implemented as direct quenching using 18 bar gas pressure and 100% max fan speed for 10 min (600 s). The slow cooling (6 bar Stop) was designed as a two-step quench, using 6 bar gas pressure. The first part used 100% max fan speed for 65 s followed by 5 min (300 s) of 20% max fan speed. Quenching speed is not solely governed by fan speed since it also depends on quenching chamber layout, load configuration and turbine blade geometry. The relative fan speeds used here can thus be motivated by the need to actually measure temperature paths experienced by the components if the results would be reproduced in another furnace system.
The temperature evolution during the two studied HPGQ treatments was measured for a test setup of gears with thermocouples, see Figure 1a, using a data logger. The data logger was placed in a thermally insulating box to resist heat and traveled with the load. The data logger was connected with 16 type N thermocouples (TC) that were mounted in holes drilled at different gear positions as well as additional Inconel probes, see Figure 1a,b. The positions were the same for 20MnCr5 and 17NiCrMo6-4 with 2 TCs each at the center of the gear tooth (CT) and center of the gear ring (CR) as well as 1 each in holes close to the surface at the gear root and teeth tip. The holes at CT and CR end at the center of the gear thickness to allow central placement of the TCs. The holes at the tip and root were drilled radially from the center of half gears to their outer diameter, see Figure 1a. Additionally, TCs in 3 Inconel probes were used as reference for the temperature curve due to the absence of phase transformations in the material at the used temperatures. The fixture was filled with dummy material for additional weight and for comparable loading conditions to the industrial process. The gears were fastened to the fixture to avoid position shifts during cooling, see Figure 1a.
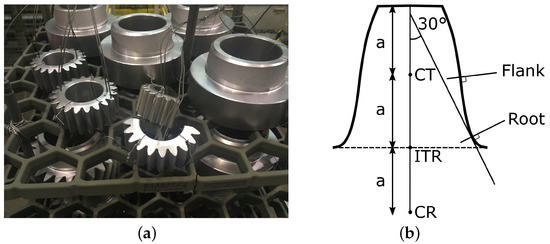
Figure 1.
(a) Setup for temperature measurement during cooling with a data logger with 16 type N TCs in full and half gears at different positions as well as Inconel probes. The data logger is positioned towards the back of the image (b) Schematic of a gear tooth with positions marked at center of tooth (CT), interface of gear tooth and ring (ITR) and center of gear ring (CR) as well as gear flank and root. TCs were positioned in holes drilled at CT and CR.
Based on the above described cooling treatments, the gears used for characterization were low pressure carburized in two batches with each having gears from both steel grades with subsequent HPGQ with 18 bar Direct or 6 bar Stop. After cooling, the gears were tempered at 180 C for 2 h. A total of 7 gears of each steel grade were heat treated per batch and the gears were characterized with the methods described in Section 2.2.
2.2. Characterization
The characterization of the gears was focused on the fatigue performance, hardness, residual stresses, retained austenite content as well as the microstructure. The 2 cooling treatments, 18 bar Direct and 6 bar Stop, were studied for each steel grade resulting in a total of 4 fatigue series. The hardness HV1 profile was measured at the gear flank and root with varying step sizes between 100 and 300 m steps down to a depth of 3 mm, see Figure 1b. A total of 2–4 gear teeth were investigated for each condition. Additionally, the core hardness HV30 was determined at the CT, ITR and CR positions. ITR is the interface of gear tooth and gear ring as shown in Figure 1b.
The residual stress and retained austenite content was measured to a depth of 160 m by X-ray diffraction and stepwise electrolytic etching on the machined gear flank since the root was not accessible. The residual stress was determined along the gear profile in the direction from gear tooth tip to root according to the standard EN 15305 [24] and the retained austenite content according to ASTM E975 [25]. The measurements were carried out for 2–4 gear teeth for each condition.
The microstructure characterization was focused on the surface close to the gear root shown in Figure 1b since the stresses are highest at this position during fatigue testing [12]. The cross-section of the area between two gear teeth was hot mounted and mechanically prepared with diamond suspensions, 9, 3 and 1 µm, followed by a final polishing with colloidal silica. For the characterization, a JEOL JSM-7800F field emission gun scanning electron microscope (JEOL Ltd., Tokyo, Japan) with a Bruker eFlash electron backscatter diffraction (EBSD) detector (Bruker Corporation, Billerica, MA, USA) was used. The EBSD results were analyzed focusing on the martensite unit size and PAGS. The MTEX toolbox v.5.2 [26] and the prior austenite orientation reconstruction algorithm from Nyyssönen et al. [27] were used for the EBSD analysis. The PAGs were determined from the reconstructed austenite orientation and the amount of PAGs as well as the PAGS distributions were determined in MTEX [26]. Additionally, the variant pairing, which describes the misorientation between neighbouring martensite units, was calculated by Nyyssönen’s algorithm [27] after the definition of Morito et al. [28]. The most relevant variant pairings are the packet boundaries, V1–V2/V3/V4/V5/V6 with V1–V2 being a twin boundary and V1–V4 a low angle block boundary, as well as the V1–V16 pairing typically observed in plate martensite [28,29]. The martensite unit size and variant pairing were summed up over 3 scans for each gear with each scan having a size of 81 µm × 61 m and a step size of 150 nm. The presence of microcracks close to the root surface was investigated by SEM imaging.
The high-cycle fatigue evaluation was performed using pulsator testing, which tests the gear tooth root load carrying capacity. The test was done in an MTS servo hydraulic test rig with a R value of 0.1. A total of 9–14 tests were carried out per series with a maximum of 3 tests per gear. From the fatigue data, the fatigue limit was determined using an interpolated Wöhler curve. The calculations were performed with a custom software based on the stress-life method (S-N) [30] using a fixed exponent due to small sample size and a limit of cycles as infinite life, i.e., runout.
3. Results
3.1. Quenching
The temperature curves from the central gear tooth (CT) position TCs during HPGQ with 18 bar Direct and 6 bar Stop are shown in Figure 2a. The plots for the TCs from the other positions, CR, Root, and Inconel, can be found in Appendix A for a better overview. The TCs positioned at the same gear positions show strong differences of up to 87 C at the same time for CT 18 bar Direct and slightly lower maximum differences at other positions. The TCs at the CR and Root position show a clear deviation from the overall temperature behavior around 350 C for both cooling treatments, see Figure A1a,b.
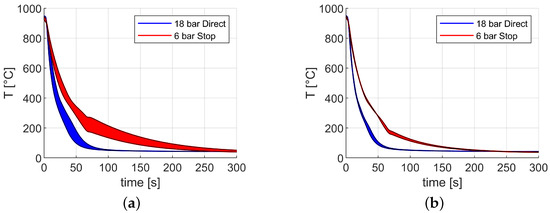
Figure 2.
Temperature sequence over time for the (a) CT and (b) gear tooth tip TCs position during HPGQ for 18 bar Direct and 6 bar Stop. The temperature curves include the minimum and maximum value at each temperature and the temperature range is colored in red (6 bar Stop) and blue (18 bar Direct).
The differences in temperature are most likely due to inhomogeneous gas flow due to the insulation box geometry as well as the different size of dummy gears resulting in an additional heating source, see Figure 1a. The gears used for characterization should not be impacted by any of these effects since there was no insulation box as well as no dummy gears in the top layer during their cooling treatment.
The comparison of the two cooling treatments is focused on the TCs at the tip of the gear teeth in Figure 2b since they are positioned closest to the surface. The temperature curves show a clear difference between the 18 bar Direct and interrupted 6 bar Stop quenching for the complete temperature range. The 18 bar Direct is significantly faster in the higher temperature region and the TCs at the tip of the gear teeth reach 200 C in approximately 30 s while it takes around 65 s for 6 bar Stop. Additionally, the 6 bar Stop shows a decrease in its cooling rate at 65 s due to the reduction in fan speed, and thereafter shows a slower cooling rate to room temperature, which is reached after about 200 s.
3.2. Characterization
3.2.1. Hardness
The average hardness HV1 at different depths of the gear root is shown in Figure 3. The hardness profiles show the typical behavior of case-hardened gears with a high hardness at the surface with values around 720–770 HV1 followed by a decrease until reaching a near constant level around a depth of 1.2 mm with values between 390 and 460 HV1 for 20MnCr5 and 450–500 HV1 for 17NiCrMo6-4. The case-hardness depth, CHD 550 HV1, is similar for all test series with values between 0.70 and 0.78 mm. The observed hardness profiles for the flank are nearly identical to the root and are not shown here. Additionally, the core hardness HV30 for all positions, CT, ITR and CR, have a trend to lower values for the 6 bar Stop gears compared to the 18 bar Direct, see Table 2. The core hardness for 17NiCrMo6-4 is also significantly higher than for 20MnCr5. The values for surface hardness HV1, core hardness HV30 and case-hardness depth are summarized in Table 2.
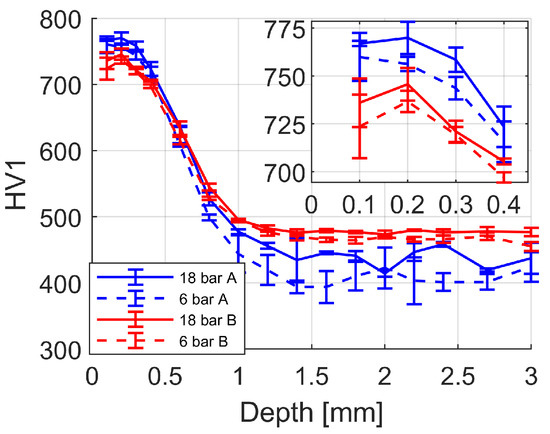
Figure 3.
Vickers hardness, HV1, depth profile for 20MnCr5 (A) and 17NiCrMo6-4 (B) at gear root.
Table 2.
Summation of characterization results for 20MnCr5 (A) and 17NiCrMo6-4 (B).
3.2.2. Residual Stress and Retained Austenite
The average residual stress and retained austenite content at different distances from the ground flank surface down to 150 m is shown in Figure 4. The residual stress in the direction from gear tooth tip to root in Figure 4a shows compressive stresses over the complete measured range. The 17NiCrMo6-4 results are similar for both cooling treatments, while the 6 bar Stop has a significantly higher compressive stress than 18 bar Direct for 20MnCr5. The scatter between measurements for 6 bar Stop for 20MnCr5 is larger than for all other conditions, but every 6 bar Stop measurement has higher compressive stresses compared to the 18 bar Direct. For comparison the average of the residual stresses between 75–150 m is calculated with resulting values between −58 to −193 MPa, see Table 2.
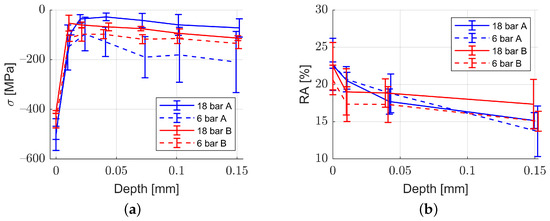
Figure 4.
(a) Residual stresses in the direction from the gear tooth tip to root and (b) retained austenite content at different depth for both steel grades and cooling treatments with 20MnCr5 (A) and 17NiCrMo6-4 (B).
The average retained austenite content has the highest values, 20.6 to 22.6%, at the surface and decreases continuously moving away from the surface. Small differences in the trends of average retained austenite content are observed between cooling treatments, but these are within the error margins, which are up to 3.5%, due to the strong variation between measurements.
3.2.3. Microstructure
The EBSD orientation maps of martensite in 20MnCr5 for 18 bar Direct and 6 bar Stop are shown in Figure 5 and the 17NiCrMo6-4 martensite orientation maps are shown in Figure A2. The microstructure of both steel grades consists of a complex mixture of large martensite units with a length of around 10 µm and smaller martensite units. There are no clear qualitative differences between the microstructure due to the two cooling treatments based on EBSD results. The corresponding PAGs show small differences in their size distribution as well as in the amount of PAGs larger than 50 m, see Table 2 and Figure A3. The analysis is focused on larger PAGs due to uncertainties in determination of smaller PAGs. The SEM microstructure analysis shows no presence of microcracks in the root area before fatigue testing.
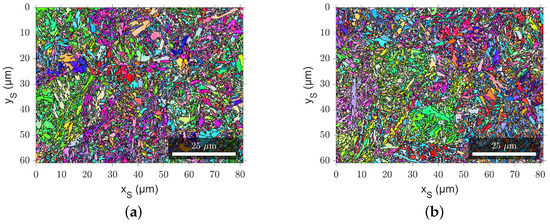
Figure 5.
Martensite orientation map of 20MnCr5 (A) (a) 18 bar Direct and (b) 6 bar Stop close to the surface area of the root.
Statistical Analysis
The martensite unit size distribution is summed up over 3 different scans per gear and the average unit area of all units is slightly larger for 18 bar Direct compared to 6 bar Stop for both steel grades. For marteniste units larger than 5 m, the same trend is observed for 20MnCr5, while 17NiCrMo-64 shows the opposite trend with 6 bar Stop having a larger average unit area, see Table 2.
The relative martensite unit area for a binning size of 2 m is shown in Figure 6 with the exclusion of units below 2 m in the inset. The value for the smallest units between 0 and 2 m is higher for 6 bar Stop in both steel grades. The number of large units is similar for both cooling treatments, but some variations in the exact distribution are observed. 18 bar Direct shows a trend towards more units with an area between 4 and 12 m compared to 6 bar Stop for both steel grades.
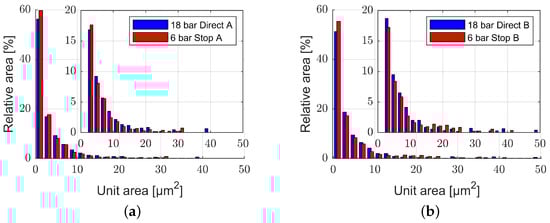
Figure 6.
Relative martensite unit area distribution for a binning size of 2 m with inset for units larger than 2 m for 18 bar Direct and 6 bar Stop (a) 20MnCr5 (A) and (b) 17NiCrMo6-4 (B).
The variant pairing of martensite was summed up over 3 scans per gear and is shown in Figure 7. The variant pairing is nearly identical for both cooling treatments with only small maximal differences around 1%. The strongest variant pairing is the V1–V2 with a value of around 25%. The other packet variant pairings [28], V1–V3/V5/V6, have a significant value of around 10% while the block variant pairing V1–V4 is around 5%. V1–V16 has a value around 6–8%.
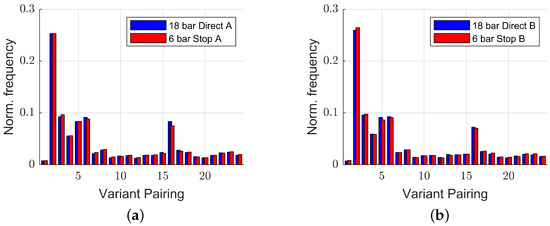
Figure 7.
Variant pairing after Morito [28] for 18 bar Direct and 6 bar Stop for (a) 20MnCr5 (A) and (b) 17NiCrMo6-4 (B).
3.2.4. High-Cycle Fatigue
The measured stress vs. fatigue life (S-N) data for a total of 9–14 measurements for each of the 4 combinations of steel grade and cooling treatments with the corresponding calculated fatigue limit is shown in Figure 8. Both steel grades show a clear improvement of fatigue performance for the 6 bar Stop compared to 18 bar Direct. The fatigue limit estimated from the Wöhler curve is increased by 10% from 503 MPa to 553 MPa for 20MnCr5 and by 11% from 428 MPa to 476 MPa for 17NiCrMo6-4, see Table 2.
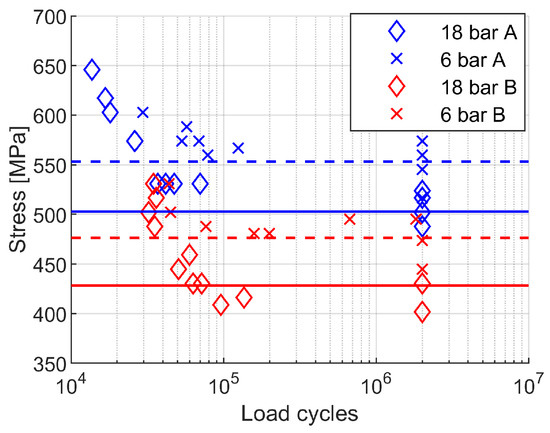
Figure 8.
S-N curve for 20MnCr5 (A) and 17NiCrMo6-4 (B) with calculated fatigue limit for HPGQ with 18 bar Direct (–) and 6 bar Stop (--).
4. Discussion
The influence of two different cooling rates during HPGQ on the fatigue performance of low pressure carburized gears shows an improvement in fatigue limit by 10–11% for the slower cooling, 6 bar Stop, compared to the faster cooling, 18 bar Direct, as shown in Figure 8 and Table 2, for both materials. This improvement agrees well with previously reported positive effects of slower cooling rates, especially close to Ms at the surface, for case-hardened gears [5,6]. The observation in two additional steel grades indicates a general positive effect of the slower cooling rate and should thus be independent of composition.
The compressive stresses at the gear flank in 20MnCr5 are increased by about 130 MPa for slower cooling, 6 bar Stop, compared to faster cooling, 18 bar Direct, while there is no significant difference for 17NiCrMo6-4, see Figure 4a and Table 2. The exact estimation of the influence is made difficult by the large scatter between the 6 bar Stop 20MnCr5 measurements. This difference could be an explanation for the increased fatigue limit for 20MnCr5 due to the positive contribution of compressive stresses in the case-hardened layer to the fatigue performance of gears [10,11,12], but it cannot explain the increase for 17NiCrMo6-4. However, the correlation between increased compressive residual stresses and improved fatigue performance has also been observed by Fahlkrans et al. [6]. The lower impact of the cooling rates on the compressive residual stresses in 17NiCrMo6-4 could be related to the higher Ni content, see Table 1, resulting in a higher hardenability of the core [31], which is in good agreement with the observed higher core hardness compared to 20MnCr5, see Figure 3. Additionally, the correlation of preferential stress states measured at the gear flank to the root area, where the highest load is applied, is unclear since simulation results have shown a significant difference between residual stresses in both areas [12].
The core hardness for both steel grades show a trend towards higher hardness values for 18 bar Direct compared to 6 bar Stop, see Table 2. This increase is between 6 and 10% for 20MnCr5 and 2–4% for 17NiCrMo6-4. The impact of the core hardness on the fatigue properties of gears is not well understood due to correlation with other parameters like residual stresses and surface hardness [32]. An effect on the fatigue performance has been reported from theoretical calculations, but the core hardness is expected to have a significantly weaker impact compared to the surface hardness [33,34]. Overall, it is not expected to be the main contributing factor to the improved fatigue performance due to the small differences between cooling treatments as well as the used experimental setup that applies the highest stress near the surface of the root [12].
The surface hardness, case-hardness depth and retained austenite content are known to influence the fatigue performance [8,9,10,11,12,13,14,15,16], but no significant differences between the two cooling treatments are observed, see Table 2. Therefore, the surface hardness and case-hardness depth can be excluded as possible explanations for the improved fatigue performance in this case. The scatter between the retained austenite measurements for the same conditions could mask an underlying difference due to the cooling rate, especially since an impact of the cooling rate on the retained austenite content has been reported [35,36,37].
The root surface microstructure of both steel grades for the two cooling rates, Figure 5 and Figure A2, is qualitatively very similar and the statistical analysis of the variant pairing shows nearly identical results, see Figure 7. Based on these results, a possible explanation of the improved fatigue performance due to different martensite boundaries can be quantitatively excluded. The average martensite unit size for all units has a smaller value for the slower cooling rate in both steel grades. This trend can be partially explained by the higher amount of martensite units smaller than 2 m that have the highest uncertainty due to possible preparation influences. For the units larger than 5 m, no consistent trend depending on the cooling rate is observed, see Table 2. The relative martensite unit size distribution shows small differences between the two cooling treatments in both steel grades, see Figure 6. These differences are relatively small with maximum deviations around 1.5% for units larger than 2 m and are most likely due to the limited statistics since the size distribution and amount of PAGs in Table 2 and Figure A3e,f show small differences as well. The overall PAG distribution is expected to be similar since the gears of each steel grade were heat treated in the same way except for the HPGQ and should be a result of limited statistics due to the size of the PAGs.
The effect of microcrack formation during cooling, which is detrimental for fatigue performance [11,17,18,19], can also be excluded for both steel grades since no microcracks are observed in the microstructure close to the root surface. Another explanation for the improved fatigue performance could be difference in the surface finish [11,17,18,19], but it is unlikely due to the identical machining of the gears.
The presented results show differences between the cooling rates, but a consistent mechanism for the fatigue performance improvement in both steel grades has not been found. Therefore, the possible influence of a stronger autotempering/partitioning in the high carbon region of the surface layer for the slower cooling rate is discussed based on literature. It was shown that the cooling rate around Ms impacts the martensite tetragonality in high carbon steels with a stronger heterogeneous distribution for slower cooling rates [35]. Local differences in tetragonality in the same microstructure have been connected to a changed carbon distribution with a stronger local heterogeneous distribution for low tetragonality compared to a more homogeneous distribution for high tetragonality regions [38]. This could cause a difference in carbide formation during tempering of martensite, which is split into multiple stages of carbon segregation and carbide precipitation for Fe-C martensite [39,40,41]. The tempering kinetics can be influenced by different cooling rates and heat treatment [39,42], but in-depth studies focused on the influence of different initial carbon distribution on the final carbide distribution for a high carbon steel have not been carried out yet to the authors knowledge. It has been shown by calculations that the final carbide size and fraction depends on the initial martensite structure and especially the nucleation site distribution for high temperature tempering [43]. Additionally, a heterogeneous carbon distribution with a resulting influence on the carbide precipitation kinetics and final distribution upon tempering has been reported for low carbon steels depending on the transformation order due to different diffusion length [44], which is similar to the expected effect from different cooling rates. The degree of autotempering/partitioning is expected to be similar in both steel grades for the same cooling rate since there are no large differences in the composition of strong carbide forming elements like Cr and Mo and it mainly depends on Ms [35]. Thermo-Calc calculations [45,46,47,48] show similar Ms values for both steel grades, 206 C for 20MnCr5 and 197 C for 17NiCrMo6-4, for a carbon content of 0.7 wt% and the Cr, Mn, Ni and Si composition from Table 1. Overall, the reported difference in carbon distribution after the initial cooling [35,38] could lead to changes in carbide precipitation during tempering and possibly explain the improved fatigue performance.
5. Conclusions
The effect of two different cooling rates during high pressure gas quenching on the fatigue performance of case-hardened gears is studied in two steel grades, 20MnCr5 and 17NiCrMo6-4. The results show a clear improvement of 10–11% for the fatigue limit for both steel grades for slower cooling. The slower cooling results in higher compressive residual stress by around 130 MPa compared to the faster cooling for 20MnCr5, while 17NiCrMo6-4 shows no significant difference. The core hardness shows small differences around 2–10% between the two cooling treatments in both steel grades. The average martensite unit size and retained austenite content do not show a clear change depending on the cooling rate.
The surface hardness, case-hardness depth as well microstructure features like variant pairing and crack formation during cooling are very similar for the two cooling rates and can be excluded as mechanism for the fatigue performance improvement. Based on literature results, an in-depth characterization of the effect of autotempering/partitioning on the sub-micron level on the fatigue performance would be a natural extension to the current work to further explore plausible explanations.
Author Contributions
Conceptualization, T.K., J.F., S.H., A.S., E.T., P.H. and A.B.; methodology, T.K., J.F., S.H., A.S., E.T., P.H. and A.B.; formal analysis, T.K. and J.F.; investigation, T.K., J.F., A.S. and E.T.; writing—original draft preparation, T.K.; writing—review and editing, J.F., S.H, A.S., E.T., P.H. and A.B.; supervision, P.H. and A.B. All authors have read and agreed to the published version of the manuscript.
Funding
This work was supported by the Vinnova project “Controlled quenching at case hardening for optimal performance—QuenchCool” within the programme “Strategic Vehicle Research and Innovation” (FFI) of which this research was part of.
Data Availability Statement
The raw data cannot be shared at this time.
Acknowledgments
We acknowledge the members of the Vinnova project “Controlled quenching at case hardening for optimal performance—QuenchCool” within the program Strategic Vehicle Research and Innovation (FFI) for their help with the work and discussion. We also thank ŠKODA Auto and Petr Šástný and Josef Podkovičák.
Conflicts of Interest
The authors declare no conflict of interest.
Appendix A. Quenching

Figure A1.
Temperature curves for TCs during HPGQ for 20MnCr5 (A) and 17NiCrMo6-4 (B) at TC positions (a) CR, (b) root and (c) Inconel for 18 bar Direct (blue) and 6 bar Stop (red).
Figure A1.
Temperature curves for TCs during HPGQ for 20MnCr5 (A) and 17NiCrMo6-4 (B) at TC positions (a) CR, (b) root and (c) Inconel for 18 bar Direct (blue) and 6 bar Stop (red).

Appendix B. Microstructure

Figure A2.
Martensite orientation map of 17NiCrMo6-4 (B) (a) 18 bar Direct and (b) 6 bar Stop.
Figure A2.
Martensite orientation map of 17NiCrMo6-4 (B) (a) 18 bar Direct and (b) 6 bar Stop.


Figure A3.
Reconstructed austenite orientation map together with martensite unit boundaries for 20MnCr5 (A) and 17NiCrMo6-4 (B) (a,c) 18 bar Direct and (b,d) 6 bar Stop, distribution of relative PAG area for 18 bar Direct (blue) and 6 bar Stop (red) for (e) 20MnCr5 (A) and (f) 17NiCrMo6-4 (B).
Figure A3.
Reconstructed austenite orientation map together with martensite unit boundaries for 20MnCr5 (A) and 17NiCrMo6-4 (B) (a,c) 18 bar Direct and (b,d) 6 bar Stop, distribution of relative PAG area for 18 bar Direct (blue) and 6 bar Stop (red) for (e) 20MnCr5 (A) and (f) 17NiCrMo6-4 (B).

References
- Albertini, G.; Bruno, G.; Fiori, F.; Marcantoni, M.; Quadrini, E.; Turquier, F. Residual stresses in case hardened automotive steel gears. In Materials Science Forum; Trans Tech Publications Ltd.: Wollerau, Switzerland, 2002; Volume 404, pp. 191–196. [Google Scholar]
- Lingamanaik, S.; Chen, B. The effects of carburising and quenching process on the formation of residual stresses in automotive gears. Comput. Mater. Sci. 2012, 62, 99–104. [Google Scholar] [CrossRef]
- Heuer, V.; Loeser, K.; Schmitt, G. Improved Materials and Enhanced Fatigue Resistance for Gear Components. In Proceedings of the Fall Technical Meeting, Detroit, MI, USA, 18–20 October 2015; American Gear Manufacturers Association: Alexandria, VA, USA, 2015. [Google Scholar]
- Stratton, P.; Bruce, S.; Cheetham, V. Low-pressure carburizing systems: A review of current technology. BHM Berg-Und Hüttenmänn. Monatshefte 2006, 151, 451–456. [Google Scholar] [CrossRef]
- Since, J.; Irretier, O. Vacuum heat treatment and high pressure gas quenching—Aspects in distortion control. Heat Process. 2010, 8, 1–10. [Google Scholar]
- Fahlkrans, J.; Melander, A.; Haglund, S. Gas quench rate ater low pressure carburizing and its inluence on fatigue properties of gears. HTM—J. Heat Treat. Mater. 2013, 68, 239–245. [Google Scholar] [CrossRef]
- Heuer, V.; Löser, K.; Faron, D.; Bolton, D. Low distortion heat treatment of transmission components. AGMA Tech. Pap. 2010, 3–16. [Google Scholar]
- Burkart, K.; Bomas, H.; Zoch, H.W. Fatigue of notched case-hardened specimens of steel SAE 5120 in the VHCF regime and application of the weakest-link concept. Int. J. Fatigue 2011, 33, 59–68. [Google Scholar] [CrossRef]
- Wei, P.; Zhou, H.; Liu, H.; Zhu, C.; Wang, W.; Deng, G. Modeling of contact fatigue damage behavior of a wind turbine carburized gear considering its mechanical properties and microstructure gradients. Int. J. Mech. Sci. 2019, 156, 283–296. [Google Scholar] [CrossRef]
- Wise, J.; Matlock, D. Bending fatigue of carburized steels: A statistical analysis of process and microstructural parameters. SAE Trans. 2000, 109, 182–191. [Google Scholar]
- Shaw, B.; Aylott, C.; O’hara, P.; Brimble, K. The role of residual stress on the fatigue strength of high performance gearing. Int. J. Fatigue 2003, 25, 1279–1283. [Google Scholar] [CrossRef]
- Li, Z.; Freborg, A.; Hansen, B.; Srivatsan, T. Modeling the effect of carburization and quenching on the development of residual stresses and bending fatigue resistance of steel gears. J. Mater. Eng. Perform. 2013, 22, 664–672. [Google Scholar] [CrossRef]
- Genel, K.; Demirkol, M. Effect of case depth on fatigue performance of AISI 8620 carburized steel. Int. J. Fatigue 1999, 21, 207–212. [Google Scholar] [CrossRef]
- Ramasamy, R.; Sivathanu, S.; Neelakandan, V.; Ganesan, T.; Rao, P. Influence of Retained Austenite on Fatigue Performance of Carburized Gears; Technical Report; SAE International: Warrendale, PA, USA, 2019. [Google Scholar] [CrossRef]
- Da Silva, V.; Canale, L.; Spinelli, D.; Bose-Filho, W.; Crnkovic, O. Influence of retained austenite on short fatigue crack growth and wear resistance of case carburized steel. J. Mater. Eng. Perform. 1999, 8, 543–548. [Google Scholar] [CrossRef]
- Pacheco, J.; Krauss, G. Microstructure and high bending fatigue strength in carburized steel. J. Heat Treat. 1989, 7, 77–86. [Google Scholar] [CrossRef]
- Benedetti, M.; Fontanari, V.; Höhn, B.R.; Oster, P.; Tobie, T. Influence of shot peening on bending tooth fatigue limit of case hardened gears. Int. J. Fatigue 2002, 24, 1127–1136. [Google Scholar] [CrossRef]
- Krantz, T.; Alanou, M.; Evans, H.; Snidle, R. Surface fatigue lives of case-carburized gears with an improved surface finish. J. Trib. 2001, 123, 709–716. [Google Scholar] [CrossRef]
- Lin, H.; Fett, G.; Binoniemi, R.; Sanders, J.; Matlock, D.; Krauss, G. Investigation of SN test data scatter of carburized 4320 steel. SAE Trans. 2007, 116, 379–391. [Google Scholar]
- Kato, M.; Deng, G.; Inoue, K.; Takatsu, N. Evaluation of the strength of carburized spur gear teeth based on fracture mechanics. JSME Int. J. Ser. C Dyn. Control Robot. Des. Manuf. 1993, 36, 233–240. [Google Scholar] [CrossRef]
- Hyde, R.; Krauss, G.; Matlock, D. Phosphorus and carbon segregation: Effects on fatigue and fracture of gas-carburized modified 4320 steel. Metall. Mater. Trans. A 1994, 25, 1229–1240. [Google Scholar] [CrossRef]
- Brobst, R.; Krauss, G. The effect of austenite grain size on microcracking in martensite of an Fe-1.22 C alloy. Metall. Trans. 1974, 5, 457–462. [Google Scholar] [CrossRef]
- Apple, C.; Krauss, G. Microcracking and fatigue in a carburized steel. Metall. Trans. 1973, 4, 1195–1200. [Google Scholar] [CrossRef]
- EN 15305; Non-Destructive Testing—Test Method for Residual Stress Analysis by X-ray Diffraction. European Committee for Standardization: Brussels, Belgium, 2008.
- ASTM E975-13; Standard Practice for X-ray Determination of Retained Austenite in Steel with Near Random Crystallographic Orientation. ASTM International: West Conshohocken, PA, USA, 2013.
- Bachmann, F.; Hielscher, R.; Schaeben, H. Grain detection from 2d and 3d EBSD data—Specification of the MTEX algorithm. Ultramicroscopy 2011, 111, 1720–1733. [Google Scholar] [CrossRef] [PubMed]
- Nyyssönen, T.; Isakov, M.; Peura, P.; Kuokkala, V. Iterative determination of the orientation relationship between austenite and martensite from a large amount of grain pair misorientations. Metall. Mater. Trans. A 2016, 47, 2587–2590. [Google Scholar] [CrossRef]
- Morito, S.; Tanaka, H.; Konishi, R.; Furuhara, T.; Maki, T. The morphology and crystallography of lath martensite in Fe-C alloys. Acta Mater. 2003, 51, 1789–1799. [Google Scholar] [CrossRef]
- Stormvinter, A.; Miyamoto, G.; Furuhara, T.; Hedström, P.; Borgenstam, A. Effect of carbon content on variant pairing of martensite in Fe–C alloys. Acta Mater. 2012, 60, 7265–7274. [Google Scholar] [CrossRef]
- Spindel, J.; Haibach, E. The method of maximum likelihood applied to the statistical analysis of fatigue data. Int. J. Fatigue 1979, 1, 81–88. [Google Scholar] [CrossRef]
- Grange, R. Estimating the hardenability of carbon steels. Metall. Trans. 1973, 4, 2231–2244. [Google Scholar] [CrossRef]
- Funatani, K. Residual Stress and Fatigue Strength of Carburized Steels and Gears; SAE Technical Paper; SAE International: Warrendale, PA, USA, 2001. [Google Scholar] [CrossRef]
- Liu, H.; Liu, H.; Bocher, P.; Zhu, C.; Sun, Z. Effects of case hardening properties on the contact fatigue of a wind turbine gear pair. Int. J. Mech. Sci. 2018, 141, 520–527. [Google Scholar] [CrossRef]
- Bai, H.; Zhu, C.; Zhou, Y.; Chen, X.; Feng, H.; Ye, W. Study on tooth interior fatigue fracture failure of wind turbine gears. Metals 2020, 10, 1497. [Google Scholar] [CrossRef]
- Kohne, T.; Fahlkrans, J.; Stormvinter, A.; Maawad, E.; Winkelmann, A.; Hedström, P.; Borgenstam, A. Evolution of martensite tetragonality in high carbon steels revealed by in situ high energy X-ray diffraction. 2022; unpublished work. [Google Scholar]
- Sherman, D.; Cross, S.; Kim, S.; Grandjean, F.; Long, G.; Miller, M. Characterization of the carbon and retained austenite distributions in martensitic medium carbon, high silicon steel. Metall. Mater. Trans. A Phys. Metall. Mater. Sci. 2007, 38, 1698–1711. [Google Scholar] [CrossRef]
- Clarke, A.; Klemm-Toole, J.; Clarke, K.; Coughlin, D.; Pierce, D.; Euser, V.; Poplawsky, J.; Clausen, B.; Brown, D.; Almer, J.; et al. Perspectives on quenching and tempering 4340 steel. Metall. Mater. Trans. A Phys. Metall. Mater. Sci. 2020, 51, 4984–5005. [Google Scholar] [CrossRef]
- Kohne, T.; Dahlström, A.; Winkelmann, A.; Hedström, P.; Borgenstam, A. Correlation of Heterogeneous Local Martensite Tetragonality and Carbon Distribution in a High Carbon Steel. Materials 2022, 15, 6653. [Google Scholar] [CrossRef]
- Ohmori, Y.; Sugisawa, S. The precipitation of carbides during tempering of high carbon martensite. Trans. Jpn. Inst. Met. 1971, 12, 170–178. [Google Scholar] [CrossRef]
- Speich, G.; Leslie, W. Tempering of steel. Metall. Trans. 1972, 3, 1043–1054. [Google Scholar] [CrossRef]
- Waterschoot, T.; Verbeken, K.; De Cooman, D. Tempering kinetics of the martensitic phase in DP steel. ISIJ Int. 2006, 46, 138–146. [Google Scholar] [CrossRef]
- Van Bohemen, S.; Sietsma, J. Kinetics of martensite formation in plain carbon steels: Critical assessment of possible influence of austenite grain boundaries and autocatalysis. Mater. Sci. Technol. 2014, 30, 1024–1033. [Google Scholar] [CrossRef]
- Hou, Z.; Hedström, P.; Xu, Y.; Di, W.; Odqvist, J. Microstructure of martensite in Fe–C–Cr and its implications for modelling of carbide precipitation during tempering. ISIJ Int. 2014, 54, 2649–2656. [Google Scholar] [CrossRef]
- Morsdorf, L.; Tasan, C.; Ponge, D.; Raabe, D. 3D structural and atomic-scale analysis of lath martensite: Effect of the transformation sequence. Acta Mater. 2015, 95, 366–377. [Google Scholar] [CrossRef]
- Borgenstam, A.; Hillert, M. Driving force for fcc → bcc martensites in Fe-X alloys. Acta Mater. 1997, 45, 2079–2091. [Google Scholar] [CrossRef]
- Andersson, J.O.; Helander, T.; Höglund, L.; Shi, P.; Sundman, B. Thermo-Calc & DICTRA, computational tools for materials science. Calphad 2002, 26, 273–312. [Google Scholar]
- Stormvinter, A.; Borgenstam, A.; Ågren, J. Thermodynamically based prediction of the martensite start temperature for commercial steels. Metall. Mater. Trans. A 2012, 43, 3870–3879. [Google Scholar] [CrossRef]
- Huyan, F.; Hedström, P.; Höglund, L.; Borgenstam, A. A thermodynamic-based model to predict the fraction of martensite in steels. Metall. Mater. Trans. A 2016, 47, 4404–4410. [Google Scholar] [CrossRef]


Publisher’s Note: MDPI stays neutral with regard to jurisdictional claims in published maps and institutional affiliations. |
© 2022 by the authors. Licensee MDPI, Basel, Switzerland. This article is an open access article distributed under the terms and conditions of the Creative Commons Attribution (CC BY) license (https://creativecommons.org/licenses/by/4.0/).