Abstract
In this study, the effects of Si on the microstructure and tensile properties of weathering bridge steel were elucidated. The thermal mechanical control process (TMCP), containing two stages of controlled rolling and accelerated cooling process, was simulated using a thermo-mechanical simulator for four experimental steels with varying Si contents (0.15–0.77 wt.%). Micro-tensile tests were performed, and the microstructures were observed via optical microscope (OM), scanning electron microscope (SEM), transmission electron microscope (TEM), and electron back-scattered diffraction (EBSD). Furthermore, the tensile properties and microstructures of these steels were analyzed. The results show that a mixed microstructure comprising granular bainitic ferrite (GBF), quasi-polygonal ferrite (QF), and martensite/austenite (M/A) constituent was formed in each sample. With an increase in Si content, the GBF content decreased, QF content increased, mean equivalent diameter (MED) of the QF+GBF matrix increased, and the fraction and average size of the M/A constituent increased. With a rise in Si content from 0.15 to 0.77 wt.%, the contributions of dislocation strengthening, grain boundary strengthening, and precipitation strengthening decreased from 149, 220, and 21 MPa to 126, 179, and 19 MPa, respectively. However, the combined contribution of solution strengthening, lattice strengthening, and M/A strengthening increased from 41 to 175 MPa, which augmented the final yield strength from 431 to 499 MPa. The decreasing yield ratio shows that strain hardening capacity is enhanced due to an increase in the fraction of the M/A constituent as well as in the MED of the QF+GBF matrix. Furthermore, the mechanisms by which Si content controls the microstructure and mechanical properties of weathering bridge steel were also discussed.
1. Introduction
High-performance bridge steels have been widely used for their excellent properties, such as high strength, ductility, toughness [1], weldability [2], and corrosion resistance [3]. Generally, 420 MPa grade weathering bridge steels produced via the thermal mechanical control process (TMCP) exhibit multiple compositions and phases, which has given rise to different strengthening methods based on solid solutions, fine grains, precipitation, multiple phases, dislocation strengthening, etc. These strengthening methods are closely dependent on the types and characteristics of steel microstructures [4]. The microstructure of the 420 MPa grade weathering bridge steel is improved mainly by optimizing TMCP parameters and alloying elements.
Numerous studies have elucidated the effects of TMCP parameters [5,6] and cooling paths [7] on the microstructure and characteristics of bridge steels. Si can not only enhance the atmospheric corrosion resistance of weathering steel [3] but also improve its tensile properties. A study [8] conducted in 1976 has shown that the yield strength of aluminum-killed low-carbon steel increases with the addition of Si. Bhadeshia et al. [9] revealed that Si improved the tensile strength of the low-carbon bainite steel through solid solution strengthening. Meanwhile, Cao [10] showed that the tensile strength of steel increased with a rise in Si content due to a change in the microstructure from ferrite to granular bainite. Chen et al. [11] indicated that the tensile strength and elongation were improved with an increase in the Si content, owing to the strain-induced transformation of retained austenite. In addition, it has been reported that Si reduced the super-cooling degree of bainite ferrite transformation, inhibited the transformation of lath bainite, and led to grain coarsening [2]. However, Ming et al. [12] compared low carbon steels with two different Si contents and found that increasing Si content can enhance the transformation temperature of bainitic ferrite, facilitate the segregation of Mn at the austenite grain boundary, and thus promote the transformation of bainite and grain refinement. Lin et al. [13] studied the influence of Si on bainite transformation kinetics and found that Si can inhibit the formation of bainite ferrite by hindering the formation of carbides and producing more dislocations. Furthermore, Si has been reported to enhance the formation of martensite/austenite (M/A) constituents in structural steels [14], which in turn increases the strength of steels via dual-phase strengthening [15].
Therefore, it is of great significance to study the effect of Si content on the microstructure transformation of weathering bridge steel. In addition, solid solution strengthening, grain boundary strengthening, dislocation strengthening, and precipitation strengthening have been considered the primary mechanisms responsible for changing the tensile properties of Si-containing steel. However, these strengthening mechanisms, along with the change of Si content, are not clear, which is worthy of further study in detail.
In this study, four samples of 420 MPa grade weathering bridge steels with low Si content (0.15 wt.%), intermediate Si content (0.36–0.48 wt.%), and high Si content (0.77 wt.%) were prepared. The relationships between the Si content and tensile properties of these steels produced by TMCP were investigated using simulation, mechanical testing, and microstructure characterization. Furthermore, the correlation between Si content, microstructure, and tensile properties was investigated. The results of this study will prove helpful in optimizing the Si content in weathering steel, while facilitating the in-depth analysis of the relationship between microstructure and properties.
2. Experimental Procedure
The chemical compositions of the four Si-Containing experimental steel plates were determined by direct reading spectroscopy on ARL4460 direct reading spectrometer. Named 0.15Si, 0.36Si, 0.48Si, and 0.77Si and listed in Table 1. The experimental steels were in the form of vacuum-melted ingots and hot-rolled to 18 mm thick plates. The samples were cut from steel plates and machined to round bar samples with dimensions of Φ15 × 75 mm. The Gleeble 3500 thermo-mechanical simulator was used to simulate TMCP (Table A1), and the process route followed by TMCP is shown in Figure 1. The samples were heated to 1180 °C at a rate of 10 °C/s, and this temperature was maintained for 10 min to simulate the heating and austenitizing process. All deformation parameters included a simulated “roughing” step performed at a temperature of 1080 °C using a compression of 35% in the γ recrystallization region an additional “finishing” step performed at a temperature of 830 °C, which was situated in the non-recrystallization region, using a compression of 30%. Accelerated cooling commenced at 780 °C with an average cooling rate of 10 °C/s, and interrupted at 550 °C. Then the temperature was increased to 580 °C to simulate the temperature rise caused by the internal heat transfer from the steel plate to the surface, which is termed the reddening process. Finally, the temperature was reduced to 200 °C at a rate of 1 °C/s to simulate the air-cooling process.

Table 1.
Chemical compositions of four test steels (wt.%).
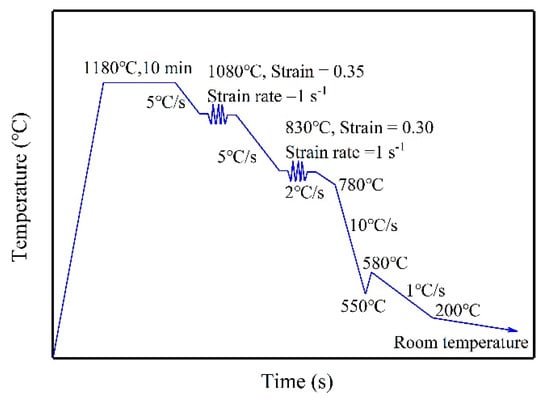
Figure 1.
Schematic depicting the simulation of TMCP.
Micro-tensile tests were performed at room temperature on a universal tensile testing machine with a load of 3 KN and an extension rate of 0.3 mm/min. The sampling points and dimensions of micro-tensile samples are shown in Figure 2.
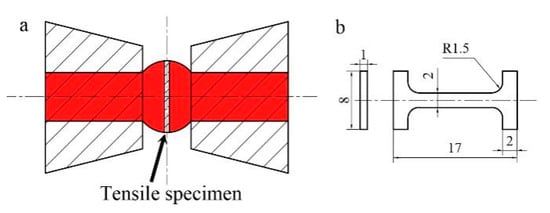
Figure 2.
(a) Sampling points of a micro-tensile sample, (b) cross-section of the sample.
The surface underneath the thermocouple was polished and etched in a 4 vol.% Nital solution and observed using an axiover-200mat optical microscope (OM). M/A constituents were observed using the OM after etching with the Lepera reagent. The quantitative results related to the M/A constituent were obtained using the Image-Pro Plus software. Moreover, the grain boundary misorientation and mean equivalent grain size of the samples were studied using scanning electron microscopy (Hitachi S-3400) and electron back-scatter diffraction (EBSD). According to EBSD, the effective grain area was the region surrounded by low-angle and high-angle grain boundaries, which was calculated by determining the equivalent diameter of a circle with respect to the area of a single grain. The fine structures of ferrite laths and M/A constituents were characterized using a transmission electron microscope (TEM; JEM-2010). Furthermore, the dislocation density of each sample was determined via quantitative analysis of X-ray diffraction spectra (D/Max 2500 X-ray diffractometer). The diffraction profiles were obtained using a scanning angle (2θ) range of 40–110° and a step size of 0.02°.
3. Results
3.1. Tensile Properties
The tensile properties of each Si-containing steel sample were measured. Figure 3 shows the typical tensile curves of all the samples, and the results are summarized in Table 2. With a rise in the Si content from 0.15% to 0.77%, the yield strength increased slightly from 431 to 499 MPa, while the tensile strength (TS) increased significantly from 607 to 738 MPa. Furthermore, the strain hardening magnitude (∆σ) increased from 176 to 239 MPa, while the yield ratio (YR) decreased slightly from 0.710 to 0.676. The YR and ∆σ values are used to express the strain-hardening ability of a material, while a low YR or high ∆σ indicates an excellent strain-hardening capacity.
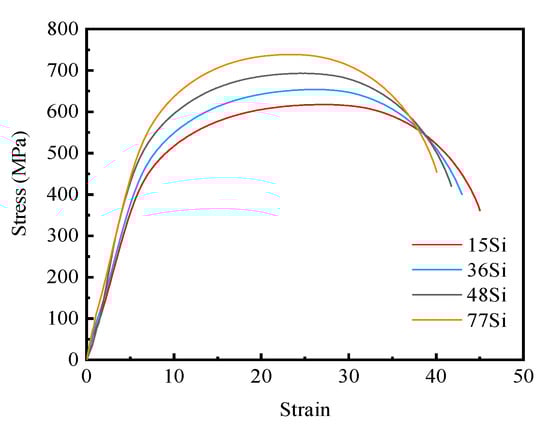
Figure 3.
Typical engineering stress-strain curves of each Si-containing sample.
Table 2.
Summary of the tensile results.
3.2. Microstructure
Typical optical micrographs of the samples with different Si contents are shown in Figure 4 and Figure 5, and the quantitative results are summarized in Table 3. A mixed microstructure comprising QF, GBF, and M/A constituents was formed in each Si-containing steel sample. Increasing the Si content also augmented the QF and GBF contents. In addition, the area fraction of M/A constituents increased from 4.2 to 6.3%, while their average size also increased from 0.8 to 1.5 μm.
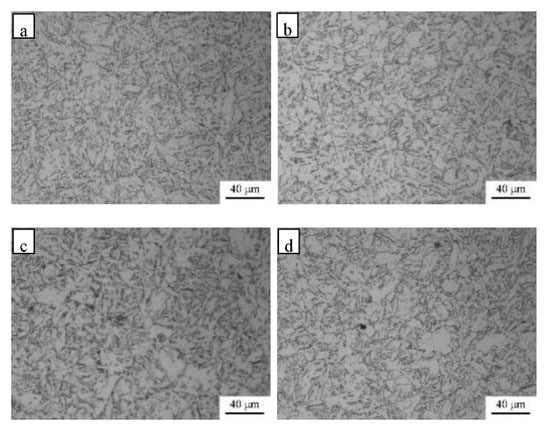
Figure 4.
Typical optical micrographs associated with the matrix microstructures of samples containing (a) 0.15 wt.% Si, (b) 0.36 wt.% Si, (c) 0.48 wt.% Si, and (d) 0.77 wt.% Si.
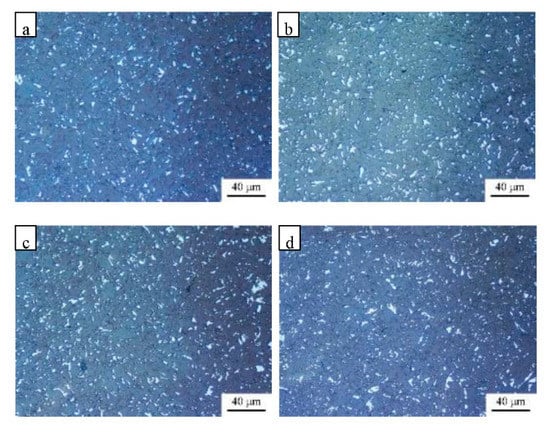
Figure 5.
Typical optical micrographs of M/A constituents comprising (a) 0.15 wt.% Si, (b) 0.36 wt.% Si, (c) 0.48 wt.% Si, and (d) 0.77 wt.% Si.
Table 3.
Microstructure observations.
Figure 6 shows the inverse pole figures (IPFs) determined using EBSD. The white and black lines represent the low-angle boundary (2° ≤ θ ≤ 15°) and high-angle boundary (θ > 15°), respectively [14,16]. The mean equivalent diameter (MED) of the matrix structure with a misorientation tolerance angle (MTA) from 2° to 30° was measured. Figure 7 shows that the MED of GBF and QF (Table A1) increased with a rise in Si content. The quantification results also indicated that the MED of the matrix structure whose MTA ranges from 2° to 15° increased from 3.4 to 4.8 μm when the Si content increased from 0.15 to 0.77 wt.%.
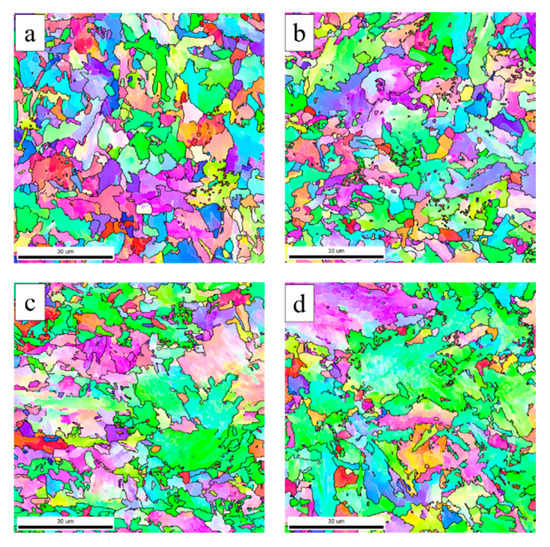
Figure 6.
Typical IPF maps for samples comprising (a) 0.15 wt.% Si, (b) 0.36 wt.% Si, (c) 0.48 wt.% Si, and (d) 0.77 wt.% Si.
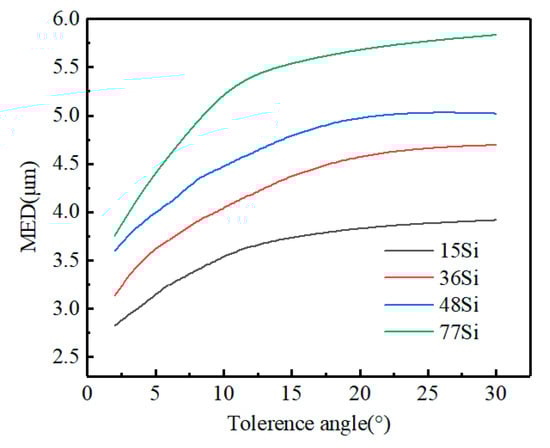
Figure 7.
MED depicted as a function of the tolerance angle.
The fine morphologies of the ferrite matrix and M/A constituents were observed using the above-mentioned TEM (Figure 8). The elongated and blocky M/A constituents were distributed along the ferrite boundary. Figure 8a–c shows that increasing the Si content augmented the QF content with low dislocation density, and the average size of QF, GBF, and M/A constituents increased. These results are consistent with the OM and EBSD observations. Figure 8d–f shows that the island phase is composed of martensite and austenite.
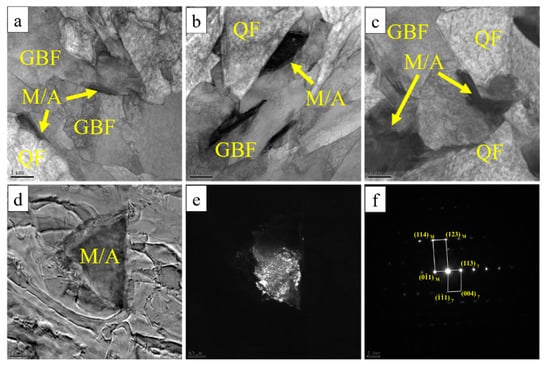
Figure 8.
TEM observations for samples comprising (a) 0.15 wt.% Si, (b) 0.36 wt.% Si, and (c) 0.77 wt.% Si. Figure (d,e) represent the bright and dark fields of the M/A constituent, and the corresponding selected area diffraction pattern is shown (f).
TEM micrographs of the precipitates and the corresponding energy dispersive X-ray (EDX) results for all samples are shown in Figure 9. Based on the TEM spectrum, these complex precipitates ((Ti, Nb) (C, N) particles) with sizes of 30–80 nm were formed in each Si-containing steel. As the Si content increases, the fraction and average size of precipitated phases decrease slightly. Table 3 lists the average size (Dp) and volume fraction (fp) of precipitates in each sample.
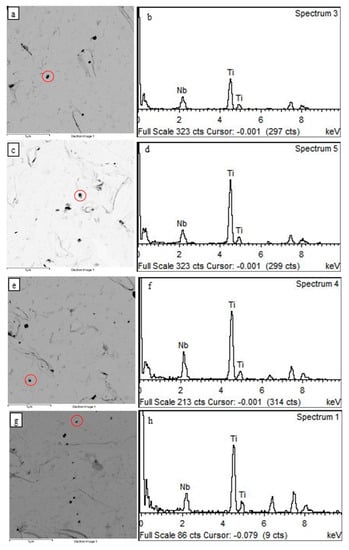
Figure 9.
TEM observations of precipitates in samples comprising (a) 0.15 wt.% Si, (c) 0.36 wt.% Si, (e) 0.48 wt.% Si, and (g) 0.77 wt.% Si. The EDX results of precipitates marked by the red circle in the corresponding figure are shown in (b,d,f,h) respectively.
Figure 10 shows the XRD profiles of each Si-containing sample, and their dislocation densities are shown in Table 3. The γ phase and α phase were calibrated with PDF card number PDF#33-0397 and PDF#44-1292, respectively. The average dislocation density, ρ, is calculated as follows:
where ε is the inhomogeneous strain determined from the XRD line profile and b is the Burgers vector of dislocations in α-Fe [17]. Table 3 shows that the average dislocation density in the QF+GBF matrix of steels decreases with an increase in Si content. Marion Calcagnotto et al. [18] calculated the dislocation density of ultrafine ferrite of the dual-phase steels using XRD to be approximately (2–3) × 1014 m−2, which is similar to that observed in this work.
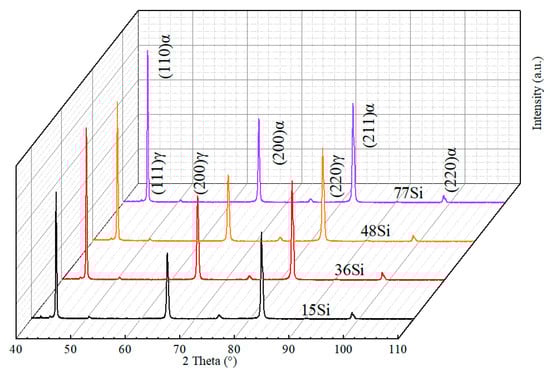
Figure 10.
XRD spectra of samples with varying silicon content.
4. Discussion
4.1. Effect of Si Content on the Mixed Microstructures
As shown in Figure 4 and Figure 8, a QF+GBF+M/A microstructure was formed in each Si-containing steel sample. After increasing the Si content, the GBF content decreased, and the QF content increased. However, the MED of QF+GBF matrix increased. Meanwhile, the fraction and average size of M/A constituent increased. The evolution of the final microstructure due to an increase in the Si content can be explained as follows:
The expansion curves of samples with different silicon contents during the cooling process are shown in Figure 11 [16,19]. The temperature at which the transformation of GBF and QF starts (Ar3) increased from 674 °C to 718 °C, indicating that super-cooling degree decreases with an increase in the Si content from 0.15% to 0.77%.
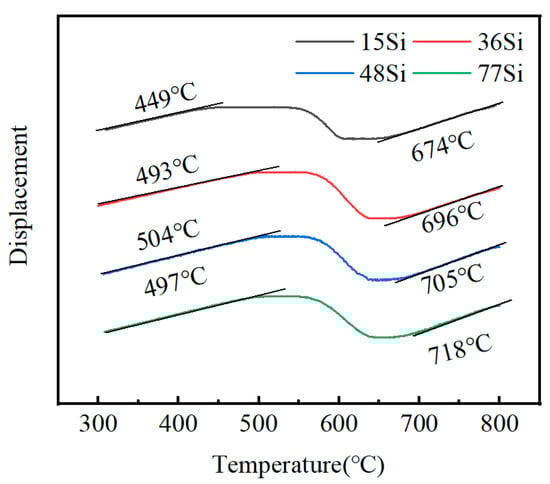
Figure 11.
Expansion curves and Ar3 temperature for each Si-containing sample.
Evolution of the final microstructure occurs due to competition for the nucleation and growth of QF and GBF (Table A1). With an increase in Si content, the initial temperature required for the γ→QF+GBF transformation was increased. According to [20], the QF transformation normally precedes the GBF transformation. However, since QF has a higher thermodynamic driving force compared to that of GBF at a lower super-cooling degree, the QF content increases. On the contrary, a low Si content with its high super-cooling degree can facilitate the transformation of GBF and increase the GBF content at the expense of the QF content.
The MED of QF+GBF matrix increased with a rise in Si content mainly due to its lower super-cooling degree and higher QF content. On the one hand, a lower super-cooling degree leads to a higher growth rate than the nucleation rate of GBF and QF, resulting in the coarsening of the QF+GBF matrix [21]. On the other hand, intragranular or intergranular QF can preferentially occupy large regions in the prior austenite grains, thus inhibiting the GBF transformation in the remaining regions. The proportion of sub-grains in QF is lower than that in GBF (Figure 6). Meanwhile, the sub-grain boundaries can not only refine the final microstructure but also impede the dislocation movement and improve strength [22]. With an increase in Si content, the amount of sub-grain boundaries decreased, and the MED of QF+GBF matrix increased.
The cooling transformation of experimental steels can be mainly divided into two steps: γ→α (QF and GBF) + γ′ (metastable austenite) and γ′→M/A constituent. The γ→α + γ′ transformation was accompanied by the diffusion of C from α into γ′, which occurred via bulk diffusion or dislocation channel diffusion [22,23,24,25] due to the difference in their solubilities. Consequently, this resulted in the enrichment of C in γ′. The second stage involves the transformation of γ′ into partial martensite and residual stable austenite during the subsequent cooling process (i.e., M/A constituent).
Thus, the γ′ fraction, which is related to Ar3 and C diffusion, has an important influence on the formation of M/A constituent. Since Ar3 increased with a rise in Si content, the transformation temperature of QF and GBF increased under the same control cooling process, indicating the diffusion of C at an enhanced temperature. The C diffusion coefficient increased with a rise in the transformation temperature according to the Arrhenius relation [26], indicating that a higher Ar3 plays a positive role in the diffusion of C. The degree of C-enrichment in γ′ increases, thereby leading to the further stabilization of γ’. Moreover, Si can promote carbons as a solid solution by inhibiting the formation of carbides from super-cooled austenite during the transformation of γ→α+ γ′ and further enhance the residual austenite content at room temperature [27]. The increasing Si content can promote the enrichment of C in γ’ and accordingly enhance the stability of γ’. During subsequent cooling to room temperature, the C-riched γ′ would further transform into the M/A constituent. Therefore, the area fraction of M/A constituent increases with a rise in Si content, as shown in Figure 5 and Table 3. Moreover, the average size of M/A constituents also increased with a rise in the Si content based on the following mechanism: The intersection regions between QF and GBF plates, where the γ′ is located during the transformation of γ→QF + GBF + γ′, tend to expand with the coarse QF and GBF plates due to the increased Si content [2].
4.2. Effect of Si Content on the Tensile Properties
The effect of Si content on the yield strength of weathering bridge steel has been mainly determined using different strengthening mechanisms. The contribution of various factors to yield strength can be expressed by the following formula:
where σ0 is lattice strengthening, σss is solid solution strengthening, σgb is grain boundary strengthening that is dependent on the grain size, is dislocation strengthening, σp is precipitation strengthening, and σM/A is the strengthening that occurs due to M/A constituents. The contributions of different strengthening methods to yield strength are discussed in detail.
The Hall–Petch equation was used to calculate the contributions of grain boundary strengthening. As shown in Figure 6, the effective grain area determined using EBSD can be divided into low-angle (2° ≤ θ < 15°) and high-angle grain boundaries (θ ≥ 15°). According to the literature [28,29], low-angle grain boundaries can effectively hinder dislocation movement and thus improve the yield strength of steel. Therefore, a misorientation angle of 2° is considered an effective threshold unit to control the yield strength. Besides the low-angle grain boundary, the high-angle grain boundary also affects the correlation coefficient of Hall–Petch equation [30,31] as follows:
Therefore, the contribution of grain boundary strengthening can be further expressed using the following equation [30,31]:
where α, M, µ, and b represent a constant, Taylor factor, shear modulus, and Burgers vector, respectively. For experimental steels with different Si contents and ferrite matrix microstructures, the values of α, M, µ, and b are 0.3, 2.75, 81.6 GPa and 2.48 × 10⁻⁷ mm, respectively [30,32]. Furthermore, fi is the relative frequency in interval i, and θi is the misorientation angle in interval i. The Hall–Petch coefficient can be directly calculated from the EBSD results, which circumvents the need to fit the relationship between grain size and strength [17]. The grain boundary strengthening contribution is obtained using the above calculation method, as shown in Table 4. The grain boundary strengthening contribution decreased with an increase in the Si content due to the rise in the MED of QF+GBF matrix.
Table 4.
Contributions of grain boundary strengthening, dislocation strengthening, and precipitation strengthening.
Table 3 shows that the average dislocation density in the QF+GBF matrix of steels decreases with an increase in Si content, owing to the increased transformation temperature of QF+GBF. The contribution of dislocation enhancement (σρ) to the YS can be estimated from the following equation [31,33,34]:
where α, M, G, b, and ρ represent a constant, Taylor factor, shear modulus, Burgers vector, and dislocation density, respectively. For experimental steels with different Si contents and ferrite matrix microstructures, the values of α, M, µ and b are 0.15, 2.75, 81.6 GPa and 2.48 × 10⁻⁷ mm, respectively. The dislocation strengthening contribution is obtained using the above calculation method, as shown in Table 4.
Table 3 lists the average size, Dp, and volume fraction, fp, of precipitates in each sample. As the Si content increases, the fraction and average size of precipitated phases decrease slightly, which is consistent with the inhibiting effect of Si on carbide formation [27]. The contribution of precipitation strengthening (σp) to the YS can be estimated using Equation (6) [34,35,36,37], which is based on the fraction and average size of precipitates:
Table 4 shows that although the contributions of grain boundary strengthening, dislocation strengthening, and precipitation strengthening decreased with an increase in Si content, the sum of the contributions of solution strengthening, lattice strengthening, and M/A strengthening increased significantly, thereby leading to an increase in the final yield strength. On the one hand, Si increased the contribution of solution strengthening. On the other hand, although the size of M/A constituent slightly increased, its fraction significantly increased and effectively improved its strength. Grain boundary strengthening was the primary mechanism at an Si content of 0.15–0.36 wt.%, whereas the roles of solid solution strengthening and M/A constituent strengthening gradually became prominent at an Si content of 0.48–0.77 wt.%.
Figure 3 and Table 2 show that YS and TS increased with a rise in Si content from 0.15 to 0.77 wt.%. However, the increment in YS was lower than that in TS, resulting in the YR decreasing. This phenomenon is mainly caused by two reasons: Increased fraction of the M/A constituent and increased MED of the QF+GBF matrix. The M/A constituent with high hardness can induce a high plastic deformation to the surrounding soft ferrite matrix and decrease the YR [38,39]. For multiphase steel, the higher the difference in the hardness of the soft phase and hard phase, the lower the YR [40]. A rise in the MED decreases the hardness of the QF+GBF matrix and increases the difference in hardness between the QF+GBF matrix and M/A constituent, thereby decreasing the YR.
5. Conclusions
In summary, the influence of Si content on the microstructure and tensile properties of 420 MPa grade weathering bridge steels produced by TMCP was studied, and the following conclusions were drawn:
- A QF+GBF+M/A microstructure was formed in each Si-containing steel. With an increase in Si content from 0.15–0.77 wt.%, the MED of QF+GBF matrix increased from 3.4–4.8 μm due to a decrease in the super-cooling degree and an increase in the QF content.
- The fraction and average size of the M/A constituent increased from 4.2–6.3 μm and 0.8–1.5 μm, respectively, with an increase in the Si content because of the sufficient diffusion of carbon at a high transformation temperature.
- Although the contributions of grain boundary strengthening, dislocation strengthening, and precipitation strengthening decreased from 220–179, 149–126, and 21–19 MPa, respectively, with an increase in Si content from 0.15–0.77 wt.%, the sum of the contributions of solid solution strengthening, lattice strengthening, and M/A strengthening increased significantly from 41–175 MPa, leading to an increase in the final yield strength from 431–499 MPa.
- The increased Si content changed the strengthening contribution. Grain boundary strengthening was the main strengthening mechanism at the Si content of 0.15–0.36 wt.%, whereas the roles of solid solution strengthening and M/A constituent strengthening gradually became prominent at the Si content of 0.48–0.77 wt.%.
Author Contributions
Q.W. and Z.C. conceived and designed the experiments; G.S. performed the experiments; L.Z. analyzed the data; J.Q. and Y.L. contributed the experimental material and analysis tools; G.W. supervised this paper; and Q.W. and Z.C. wrote the paper. All authors have read and agreed to the published version of the manuscript.
Funding
This research was funded by Key Research and Development Program of Hebei Province of China (Grant No. 20311003D), Introduce Foreign Intellectual Projects of Hebei Province of China (Grant No. 2019YX016A) and Key Research and Development Program between HBIS Group Co., Ltd. and Yanshan University (Grant No. HG2019308).
Institutional Review Board Statement
Not applicable.
Informed Consent Statement
Not applicable.
Data Availability Statement
Date are contained within the article.
Conflicts of Interest
The authors declare no conflict of interest.
Appendix A
Table A1.
Acronyms and their full names.
Table A1.
Acronyms and their full names.
| Acronyms | Full Names |
|---|---|
| TMCP | thermal mechanical control process |
| QF | quasi-polygonal ferrite |
| GBF | granular bainitic ferrite |
| M/A | martensite/austenite |
| MED | mean equivalent diameter |
| OM | optical microscope |
| EBSD | electron back-scattered diffraction |
| TEM | transmission electron microscope |
| MED | mean equivalent diameter |
| MTA | misorientation tolerance angle |
| EDX | energy dispersive X-ray |
| YS | yield strength |
| TS | tensile strength |
| YR | yield strength/tensile strength |
| LAGB | low-angle grain boundary |
| HAGB | high-angle grain boundary |
| ∆σ | train hardening magnitude |
References
- Chen, J.; Shuai, T.; Liu, Z.; Wang, G. Influence of Molybdenum Content on Transformation Behavior of High Performance Bridge Steel during Continuous Cooling. Mater. Des. 2013, 49, 465–470. [Google Scholar] [CrossRef]
- Zhang, Y.; Shi, G.; Sun, R.; Guo, K.; Wang, Q. Effect of Si Content on the Microstructures and the Impact Properties in the Coarse-Grained Heat-Affected Zone (CGHAZ) of Typical Weathering Steel. Mater. Sci. Eng. A 2019, 762, 138082. [Google Scholar] [CrossRef]
- Gomez, J.A.M.; Antonissen, J.; Palacio, C.A.; Grave, E.D. Effects of Si as Alloying Element on Corrosion Resistance of Weathering Steel. Corros. Sci. 2012, 59, 198–203. [Google Scholar] [CrossRef]
- Liu, S.K.; Zhang, J. The Influence of the Si and Mn Concentrations on the Kinetics of the Bainite Transformation in Fe-C-Si-Mn Alloys. Metall. Trans. A 1990, 21, 1517–1525. [Google Scholar] [CrossRef]
- El-Shenawy, E.; Reda, R. Optimization of TMCP Strategy for Microstructure Refinement and Flow-Productivity Characteristics Enhancement of Low Carbon Steel-ScienceDirect. J. Mater. Res. Technol. 2019, 8, 2819–2831. [Google Scholar] [CrossRef]
- Liu, Y.; Zhu, F.; Yanmei, L.I.; Wang, G. Effect of TMCP Parameters on the Microstructure and Properties of an Nb-Ti Microalloyed Steel. ISIJ Int. 2005, 45, 851–857. [Google Scholar] [CrossRef]
- Chen, J.; Tang, S.; Liu, Z.-Y.; Wang, G.-D. Microstructural Characteristics with Various Cooling Paths and the Mechanism of Embrittlement and Toughening in Low-Carbon High Performance Bridge Steel. Mater. Sci. Eng. A 2013, 559, 241–249. [Google Scholar] [CrossRef]
- Sibley, K.D.; Breyer, N.N. The Effect of Silicon on the Impact and Tensile Properties of Low-Carbon Steels. Metall. Trans. A 1976, 7, 1602–1604. [Google Scholar] [CrossRef]
- Bhadeshia, H.K.D.H.; Edmonds, D.V. Analysis of Mechanical Properties and Microstructure of High-Silicon Dual-Phase Steel. Met. Sci. 1980, 14, 41–49. [Google Scholar] [CrossRef]
- Cao, R.; Chan, Z.S.; Yuan, J.J.; Han, C. The Effects of Silicon and Copper on Microstructures, Tensile and Charpy Properties of Weld Metals by Refined X120 Wire. Mater. Sci. Eng. A. Struct. Mater. Prop. Misrostructure Process. 2018, 718, 350–362. [Google Scholar] [CrossRef]
- Chen, H.C.; Era, H.; Shimizu, M. Shimizu Effect of Phosphorus on the Formation of Retained Austenite and Mechanical Properties in Si-Containing Low-Carbon Steel Sheet. Metall. Trans. A 1989, 20, 437–445. [Google Scholar] [CrossRef]
- Cai, M.; Ding, H.; Zhang, J.; Li, L.; Li, X.; Du, L. Transformation Behavior of Low Carbon Steels Containing Two Different Si Contents. J. Iron Steel Res. Int. 2009, 16, 55–60. [Google Scholar] [CrossRef]
- Lin, S.; Borgenstam, A.; Stark, A.; Hedström, P. Effect of Si on Bainitic Transformation Kinetics in Steels Explained by Carbon Partitioning, Carbide Formation, Dislocation Densities, and Thermodynamic Conditions. Mater. Charact. 2022, 185, 111774. [Google Scholar] [CrossRef]
- Bonnevie, E.; Ferriere, G.; Ikhlef, A.; Kaplan, D.; Orain, J. Morphological Aspects of Martensite–Austenite Constituents in Intercritical and Coarse Grain Heat Affected Zones of Structural Steels. Mater. Sci. Eng. A 2004, 385, 352–358. [Google Scholar] [CrossRef]
- Min, C.J.; Lee, S.G.; Sohn, S.S.; Kim, K.S.; Kim, W.K.; Chang, S.L.; Lee, S. Effects of Coiling Temperature and Pipe-Forming Strain on Yield Strength Variation after ERW Pipe Forming of API X70 and X80 Linepipe Steels. Mater. Sci. Eng. A 2017, 682, 304–311. [Google Scholar] [CrossRef]
- Taboada, M.C.; Iza-Mendia, A.; Gutiérrez, I.; Jorge-Badiola, D. Substructure Development and Damage Initiation in a Carbide-Free Bainitic Steel upon Tensile Test. Metals 2019, 9, 1261. [Google Scholar] [CrossRef]
- Fan, L.; Zhou, D.; Wang, T.; Li, S.; Wang, Q. Tensile Properties of an Acicular Ferrite and Martensite/Austenite Constituent Steel with Varying Cooling Rates. Mater. Sci. Eng. A 2014, 590, 224–231. [Google Scholar] [CrossRef]
- Calcagnotto, M.; Ponge, D.; Demir, E.; Raabe, D. Orientation Gradients and Geometrically Necessary Dislocations in Ultrafine Grained Dual-Phase Steels Studied by 2D and 3D EBSD. Mater. Sci. Eng. A 2010, 527, 2738–2746. [Google Scholar] [CrossRef]
- Marcisz, J.; Garbarz, B.; Janik, A.; Zalecki, W. Controlling the Content and Morphology of Phase Constituents in Nanobainitic Steel Containing 0.6%C to Obtain the Required Ratio of Strength to Plasticity. Metals 2021, 11, 658. [Google Scholar] [CrossRef]
- Guo, B.; Fan, L.; Qian, W.; Fu, Z.; Zhang, F. The Role of the Bainitic Packet in Control of Impact Toughness in a Simulated CGHAZ of X90 Pipeline Steel. Met. -Open Access Metall. J. 2016, 6, 256. [Google Scholar] [CrossRef]
- Freudenberger, J.; Göllner, J.; Heilmaier, M.; Mook, G.; Saage, H.; Srivastava, V.; Wendt, U. Materials Science and Engineering. In Springer Handbook of Mechanical Engineering; Grote, K.-H., Antonsson, E.K., Eds.; Springer Handbooks; Springer: Berlin, Heidelberg, 2009; pp. 73–222. ISBN 978-3-540-30738-9. [Google Scholar]
- Kamran, S.; Farid, A. Subgrain-Controlled Grain Growth in the Laser-Melted 316 L Promoting Strength at High Temperatures. R. Soc. Open Sci. 2018, 5, 172394. [Google Scholar] [CrossRef]
- Dutta, B.; Palmiere, E.J.; Sellars, C.M. Modelling the Kinetics of Strain Induced Precipitation in Nb Microalloyed Steels. Acta Mater. 2001, 49, 785–794. [Google Scholar] [CrossRef]
- Bhadeshia, H.K.D.H.; Edmonds, D.V. The Bainite Transformation in a Silicon Steel. Metall. Trans. A 1979, 10, 895–907. [Google Scholar] [CrossRef]
- Wang, J.; Li, C.; Di, X.; Wang, D. Effect of Cu Content on Microstructure and Mechanical Properties for High-Strength Deposited Metals Strengthened by Nano-Precipitation. Metals 2022, 12, 1360. [Google Scholar] [CrossRef]
- Laidler, K.J. The Development of the Arrhenius Equation. J. Chem. Educ. 1984, 61, 494. [Google Scholar] [CrossRef]
- Taillard, R.; Verrier, P.; Maurickx, T.; Foct, J. Effect of Silicon on CGHAZ Toughness and Microstructure of Microalloyed Steels. Met. Mater Trans A 1995, 26, 447–457. [Google Scholar] [CrossRef]
- Shi, G.; Luo, B.; Zhang, S.; Wang, Q.; Zhao, H. Microstructural Evolution and Mechanical Properties of a Low-Carbon V–N–Ti Steel Processed with Varied Isothermal Temperatures. Mater. Sci. Eng. A 2021, 801, 140396. [Google Scholar] [CrossRef]
- Zhao, L.; Wang, Q.; Shi, G.; Yang, X.; Qiao, M.; Wu, J.; Zhang, F. In-Depth Understanding of the Relationship between Dislocation Substructure and Tensile Properties in a Low-Carbon Microalloyed Steel. Mater. Sci. Eng. A 2022, 854, 143681. [Google Scholar] [CrossRef]
- Iza-Mendia, A.; Gutierrez, I. Generalization of the Existing Relations between Microstructure and Yield Stress from Ferrite–Pearlite to High Strength Steels. Mater. Sci. Eng. A 2013, 561, 40–51. [Google Scholar] [CrossRef]
- Hansen, N.; Huang, X.; Winther, G. Grain Orientation, Deformation Microstructure and Flow Stress. Mater. Sci. Eng. A 2008, 494, 61–67. [Google Scholar] [CrossRef]
- Zhang, S.; Liu, K.; Chen, H.; Xiao, X.; Wang, Q.; Zhang, F. Qingfeng Effect of Increased N Content on Microstructure and Tensile Properties of Low-C V-Microalloyed Steels. Mater. Sci. Eng. A 2016, 651, 951–960. [Google Scholar] [CrossRef]
- Hughes, D.A. Microstructure Evolution, Slip Patterns and Flow Stress. Mater. Sci. Eng. A 2001, 319, 46–54. [Google Scholar] [CrossRef]
- Xiao, X.; Shi, G.; Zhang, S.; Wang, Q. Effect of Cooling Path on Microstructure Features and Tensile Properties in a Low Carbon Mo-V-Ti-N Steel. Metals 2018, 8, 677. [Google Scholar] [CrossRef]
- Lei, F.; Wang, T.; Fu, Z.; Zhang, S.; Wang, Q. Effect of Heat-Treatment on-Line Process Temperature on the Microstructure and Tensile Properties of a Low Carbon Nb-Microalloyed Steel. Mater. Sci. Eng. A 2014, 607, 559–568. [Google Scholar] [CrossRef]
- Rosenberg, J.M.; Piehler, H.R. Calculation of the Taylor Factor and Lattice Rotations for Bcc Metals Deforming by Pencil Glide. Metall. Mater. Trans. B 1971, 2, 257–259. [Google Scholar] [CrossRef]
- Fan, Y.; Wang, Q.; Liu, H.; Wang, T.; Wang, Q.; Zhang, F. Effect of Controlled Cooling on Microstructure and Tensile Properties of Low C Nb-Ti-Containing HSLA Steel for Construction. Metals 2017, 7, 23. [Google Scholar] [CrossRef]
- Hüper, T.; Endo, S.; Ishikawa, N.; Osawa, K. Effect of Volume Fraction of Constituent Phases on the Stress-Strain Relationship of Dual Phase Steels. Isij Int. 2007, 39, 288–294. [Google Scholar] [CrossRef]
- Zare, A.; Ekrami, A. Influence of Martensite Volume Fraction on Tensile Properties of Triple Phase Ferrite-Bainite-Martensite Steels. Mater. Sci. Eng. A 2011, 530, 440–445. [Google Scholar] [CrossRef]
- Li, X.; Liu, Y.; Gan, K.; Dong, J.; Liu, C. Acquiring a Low Yield Ratio Well Synchronized with Enhanced Strength of HSLA Pipeline Steels through Adjusting Multiple-Phase Microstructures. Mater. Sci. Eng. A 2020, 785, 139350. [Google Scholar] [CrossRef]
Publisher’s Note: MDPI stays neutral with regard to jurisdictional claims in published maps and institutional affiliations. |
© 2022 by the authors. Licensee MDPI, Basel, Switzerland. This article is an open access article distributed under the terms and conditions of the Creative Commons Attribution (CC BY) license (https://creativecommons.org/licenses/by/4.0/).