Article

Selenium and Tellurium Separation: Copper Cementation Evaluation Using Response Surface Methodology

by
Seyedreza Hosseinipour
,
Eskandar Keshavarz Alamdari
* and
Nima Sadeghi
Department of Materials and Metallurgical Engineering, Amirkabir University of Technology (Tehran Polytechnique), Tehran 15875-4413, Iran
*
Author to whom correspondence should be addressed.
Metals 2022, 12(11), 1851; https://doi.org/10.3390/met12111851
Submission received: 16 September 2022 / Revised: 21 October 2022 / Accepted: 25 October 2022 / Published: 29 October 2022
(This article belongs to the Special Issue Metal Recovery and Separation from Wastes)

Abstract

:
In recent years, high demands for Se and Te in the solar panels and semiconductors industry have encouraged its extraction from primary and secondary sources. However, the two elements’ similar chemical and physical properties make pure element production, Se or Te, arduous. This work is aimed to investigate the significant factors of Se and/or Te recovery in the copper cementation process using the response surface methodology. The test was carried out in two series, for Te and Se, so that H2SO4, CuSO4, Te(or Se) concentration, and temperature are the factors of experimentation. According to response surface methodology (RSM) results for both test series (i. e. Se and Te), 50 g/L H2SO4, 15 g/L Cu, and 35 °C, 3000 mg/L Se (or 750 mg/L Te) was specified for higher Se recovery (97%), and the lowest Te extraction (2%) as an optimum condition, so that could make a suitable separation process. Hence, the cementation test was conducted in the simultaneous presence of Se and Te, so the separation index became 5291. Moreover, the cementation test was carried out in the pregnant leach solution of copper anode slime, and the separation factor was measured to be 606. On the other hand, the thermodynamic evaluation and XRD patterns of the process’s sediments confirm that Se is precipitated as Cu2Se and Cu1.8Se, whereas no Te components are detected in the sediments.

Graphical Abstract

1. Introduction

Selenium is a metalloid element found in the sulfide minerals and copper anode slime alongside precious metals, tellurium, copper, silver, and nickel. Selenium as a metalloid has broad applications in solar cell fabrication [1], semiconductor manufacturing [2], pharmaceuticals and biomedical uses [3], pigments for ceramics, glasses, and plastics [4,5], metallurgical applications [4], and agriculture uses [6]. Se is usually observed as a red-colored powder in amorphous form and metallic gray in crystalline form, with intermediate properties between tellurium and sulfur [7].
On the other hand, tellurium is another semi-metallic element that has specific characteristics that make it helpful for energy conversion [7,8], chemical reaction catalysis [9], alloying, and semiconductors [8]. The electrolytic copper refinery slimes contain gold and precious metals alongside selenium and tellurium, periodically gathered for valuable metals recovery [10,11]. The main purpose of copper anode slime treatment is the extraction of precious metals and gold. However, Se and Te recovery are of secondary importance, so various methods are raised for metals recovery [4]. The chemical and physical specifications of selenium are akin to tellurium, which is an arduous purification process [7,10,11,12].
Conventionally, selenium fumes were recovered from the exhausted gas of roasting furnaces. However, a portion of selenium and tellurium remain in the residue, sent to an acidic or basic leaching process [13]. Moreover, selenium gas may not be entirely gathered in the filters and causes enormous ecological problems, such as air pollution by heavy metals, so it must be diminished in the coming years [4]. Additionally, there is a commercial process based on roasting copper slimes with soda ash to convert both selenium and tellurium compounds to a +6 oxidation state [14]. This way, a part of selenium is recovered by the natural leaching process (pH: 7), and tellurium has to be retrieved in chloric or sulfuric acid solutions. The pregnant tellurium solution also contains a significant quantity of selenium that should be separated [15,16,17].
Acid roasting technology is another practical method to recover Se from copper anode slime based on selective volatilization of selenium compound from slimes [18]. Although selenate, Se VI, compounds are recovered in the roasting process, tellurite and some selenite compounds remain in the sulfated slimes that should be separated [4]. Moreover, selenium and tellurium could also be recovered in oxidative sulfuric acid leaching [19,20,21]. Under the optimal condition, the concentration of Se and Te is 3.7 and 1.1 g/L, whereas the concentration of copper is approximately 15 g/L [19]. Thus, Se and Te were dissolved in leaching media simultaneously, so the two elements’ separation can become a vital process to produce pure metals.
Solvent extraction is one of the popular separation processes. Accordingly, ketone, phosphate, and ether extractants [22,23] were used for selenium extraction; whereas, phosphate [24] and phosphine oxides [25] were proposed for tellurium extraction from sulfuric acid solutions [26].
On the other hand, selenium and tellurium can be precipitated by chemical agents, such as cuprous ions [27], chromous ions [28], hydrazine hydrate [29], sulfur dioxide [30], sodium metabisulphite [31], and sodium sulfite [32] from sulfuric acid media. Copper is another cost-efficient reducer, reported for tellurium [33,34] and tellurium/selenium [35] cementation from the aqueous solution. Although some work has been conducted on Te and Se cementation, no solid report was found for Se/Te separation from copper anode slime liquor. Thus, an accurate study that investigates Se cementation should be done. The tests should be discretely carried out for Se and Te to eliminate interaction between Se and Te cementation, and the results will be compared with dual cementation of Se and Te.
The Cu cementation process is carried out based on the electrochemical reaction that different species of tellurium or selenium can precipitate through a redox reaction. Different parameters, such as pH, electrochemical potential, and the presence of other ionic species in solution, can thermodynamically affect Se/Te cementation. Thus, a thermodynamic evaluation should have been conducted for Se and Te cementation. Moreover, Se or Te cementation was discretely studied in a synthetic solution, similar to Se or Te concentration in pregnant leaching solution, to figure out each factor’s effect on metal cementation exclusively. After finding each factor’s influence on the discrete Se and Te cementation model, the test should be conducted to find the optimum position of Se/Te separation in synthetic and pregnant leach solutions. Finally, a cost-effective method will be designed to generate a high-purity product in this approach.

2. Materials and Methods

2.1. Precipitation Procedure

Initially, a pregnant leach solution was provided by leaching in sulfuric acid and oxygen peroxide solution. The elemental analysis of the solution is brought in Table 1. According to this, synthetic solutions were provided at different levels of elements and H2SO4 concentration. After an optimal condition of cementation was achieved, Se, Te, or H2SO4 concentration could be made up by changing the S/L ratio or H2SO4 concentration in the copper anode slime leaching. Then, the cementation test was carried out in PLS to calculate Se/Te separation index.
The experimental procedure of cementation was divided into two branches, illustrated in Figure 1. In the first stage, the effect of parameters was investigated on the Te cementation, and the optimum condition was specified. In the next section, Se cementation, in which Se concentration is four times Te concentration, was investigated to find influential factors in the process. These two sections are entitled discrete cementation for Te and Se cementation. Afterward, the dual selenium and tellurium cementation was conducted based on the optimum condition for Se and Te separation in the synthetic solution. This test was replicated in the solution of copper anode slime leach too. Finally, the obtained solution from Se cementation in pregnant leaching solution has been sent to Te precipitation process.
The batch extraction experiments were carried out in the Erlenmeyer flask to recover Se or Te from synthetic solutions. Initially, a specific volume of Te and/or Se was poured into the volumetric flask (100 mL, class A) from stock solutions, and then copper sulfate and sulfuric acid solutions were added according to the experiment design. Finally, the volume of the solution was brought to the required volume by distilled water. After solution preparation, the samples were transferred into the Erlenmeyer flask and placed in a bain-marie bath to reach the target temperature. Two grams of copper chops were cast to the 100 mL solution, 20 g/L copper chops density, in the flask at the desired temperature, and the mixture was agitated by a mechanical shaker at 500 rpm for 2 h. After filtration, samples were taken for analysis. The remaining metallic ion concentration in the solution was determined by AAS (AA240, Varian, Palo Alto, CA, USA) analytical instrument. The extraction efficiency was expressed as extraction percentage (%E) as defined in Equation (1).
% E = C i ,   M e C f ,   M e C i × 100
Moreover, the distribution coefficient was considered, as a criterion, to assess the process as follows:
D M e = C i ,   M e C   f ,   M e C f
Ci,Me, Cf,Me, and DMe are the initial, final elements concentration and distribution coefficient, respectively. Regarding this approach, another scale can be applied, which can be a helpful tool to survey the separation capability of the proposed process. This criterion is called separation index and is defined as Equation (3):
β = D S e D T e

2.2. Materials and Apparatus

All chemicals were of analytical reagent grade, and all solutions were prepared with deionized water. Stock solutions for Te (10 g/L) and Cu (70 g/L) were separately prepared by dissolving a certain amount of K2TeO3 (Sigma-Aldrich, A.R., St. Louis, Mo, USA), and CuSO4·5H2O (Neutron, Tehran, Iran) in 0.1 M H2SO4 (Ghatranshimi, Tehran Iran) solutions, respectively. Moreover, 35 g/L Se (IV) solution was prepared in 0.25 M HNO3+0.1M H2SO4 solution by adding pure Se (Umicore, Brussels, Belgium, technical grade). Then, the samples were made by adding a specific volume of the stock solution and sulfuric acid solution to the volumetric flask. Afterward, the obtained solutions were allowed to stand for more than 24 h at ambient temperature. Pure copper chop (99.99, National Iranian Copper Industries Co. (NICICO, Tehran, Iran), with a size < 200 µm, was used as a reducing agent that was directly added to the sulfate solution. Sodium hydroxide (Merck KGaA, Darmstadt, Germany) solution was used for acid analysis and pH adjustment of the sulfate solutions. In order to detect selenium and tellurium concentration, atomic absorption spectroscopy (AAS and AA240, Varian, Palo Alto, CA, USA) was used, and pH and ORP (oxidation-reduction potential) of solutions were measured by a pH meter (InoLab 7110, WTW, Weilheim, Germany).

2.3. Optimization Procedure

The parametric approximation models are widely exploited through the design of experiments to figure out optimum conditions on the pilot and industrial scale [9]. In this way, the independent parameters’ influence on the experiments’ outcomes as dependent variables can be achieved using the least number of tests. According to computer technology progress, even complicated problems can be solved with a minimum cost and time through optimization methods [36].
Response surface methodology (RSM) is a well-arranged technique to conduct systematic investigations of complicated systems via statistical and mathematical techniques such as central composite design (CCD). The main purpose of this procedure is to discover more effective factors and the exact optimum condition with a reasonable number of runs by extension of an empirical correlation between the controlled variables (X) and response (Y) [37]. Thus, the experimental design was carried out by Design Expert software (Version 12) developed by Stat-Ease company (Minneapolis, Min, USA). The CCD model presents the second-order polynomial equation in Equation (4). This relation can be exploited to recognize curvature in a response function.
Y = β 0 + i = 1 k β i X i + i = 1 k β i i X i 2 + i < j β i j X i X j + ε
where Xi and Xj are the independent factors, β0 and βi are constant value and linear coefficient, βii and βij are squared, and interaction coefficients, respectively, and ε is the random experimental error [38]. The second-order response equation discovers the effect of one factor with their quadratic and interactions over the responses.
Some rough tests were carried out to figure out effective parameters. Temperature, pH, Te and/or Se concentration, and copper sulfate concentration were selected as more effective parameters. RSM is comprehensive and can specify the order of factors on the response(s) and calculate interactions between factors. This method can establish the relation between response(s), independent variables, and the probable interactions between variables can be established. In a continuous operation, the numeric factors can be put on any desired amount, presented at five levels in Table 2.
As an appropriate model for industrial functions, the quadratic polynomial model can precisely estimate the interconnection between the independent variables and the response [37]. After attaining the quadratic polynomial model based on five studied levels, analysis of variance (ANOVA) was applied to validate the provided model.

3. Results and Discussion

3.1. Thermodynamic Evaluation for Se and Te Cementation

Thermodynamic simulation can always provide reliable insight into experimental design and implementation. Thus, some thermodynamic analyses were carried out for the precipitation process via FactSageTM thermochemical software (version 6.0, Aachen, Germany) [39] and other thermodynamic databases, so the evaluation results are calculated for both Te and Se in 1 L of solution. As can be seen in Figure 2a, the solid phases of Se are presented, Cu2Se is stable in a lower concentration of H2SO4, but the amount of Cu2Se falls higher than 0.51 mol (50 g). In contrast, CuSe and CuSe2 species rise in the range. Even though pure Se can become stable in the higher 0.7 mol (68.6 g) range, the previous work [40] reports Cu2-xSe as a middle phase that can form in the deposits.
Furthermore, Figure 2b depicts Se ions values on various Se ionic species. Cu2Se is persistent in lower 0.065 mol (5.13 g), whereas CuSe and CuSe2 can stabilize in a higher concentration range. Figure 2c exposes the solid copper amount at the mean number of other parameters. As can be detected, the copper contributes to the precipitation reaction at higher than 0.15 mol (9.53 g) and adding more copper to the system escalates the copper contribution in the deposited phase. In conclusion, Se concentration and Cu chops can escalate the Se cementation process; in contradiction, H2SO4 declines CuSe cementation efficiency. Finally, Figure 2d exhibits that rising temperature does not change Cu2Se and CuSe2 species until 363 K (90 °C). However, the CuSe2 phase has diminished higher than 90 °C, while Cu2Se species extends in the system.
On the other hand, Te solid phases have been illustrated in Figure 3. As observed, Figure 3a presents that temperature could not influence the Cu2Te values, whereas Figure 3b indicates that the initial amount of Te increases Te sediments in the system. Although Cu2Te sediments accumulated at 0–0.065 mol (8.29 g) Te, TeO2 has formed more than 0.065 mol Te, and an amount of Cu2Te is decayed in the system. Moreover, Figure 3c exposes that solid copper value does not affect Cu2Te formation, even in a system with no copper metal additive. Moreover, thermodynamic results show that despite H2SO4 variation in the system, Cu2Te is the dominant species in 0–0.8 mol H2SO4.

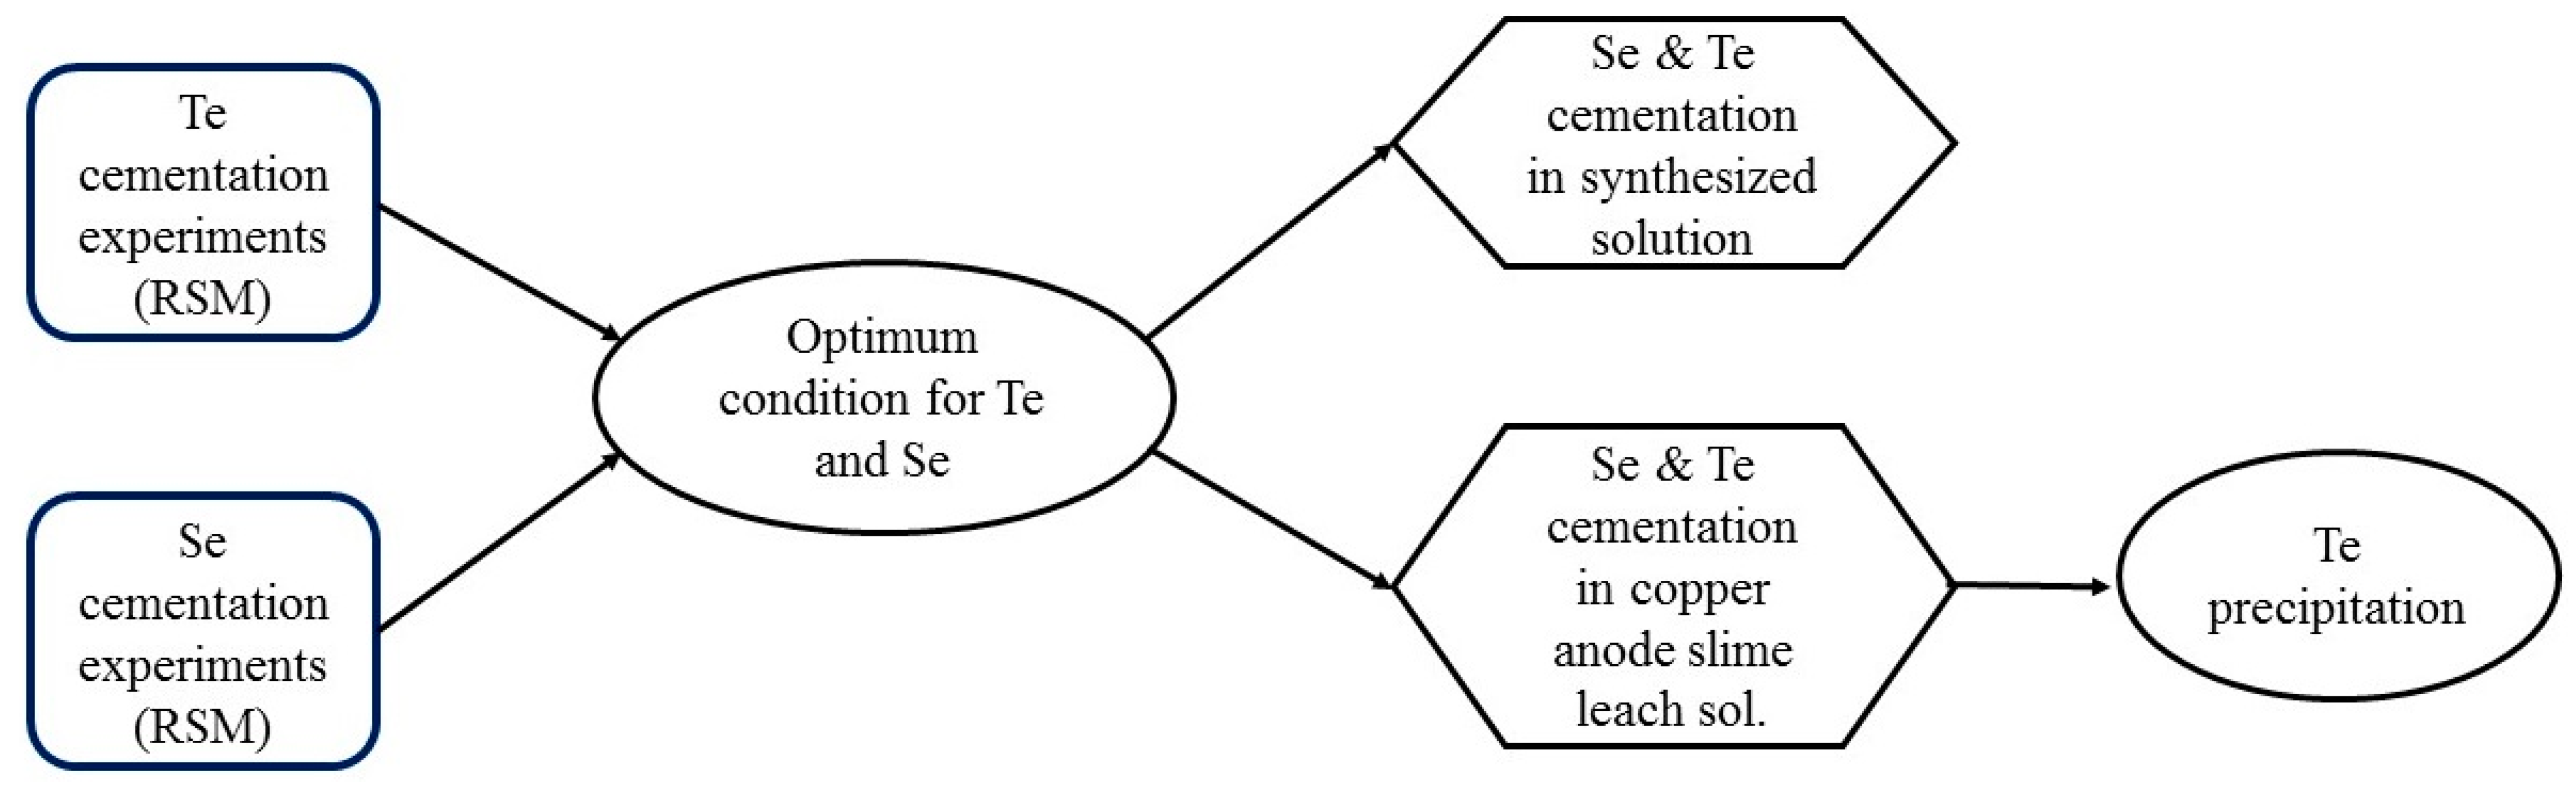
3.2. Optimization through CCD model

As mentioned in Table 2, a five-level design for four different variables was provided through the central composite design (CCD) illustrated in Table 3. These tests were separately conducted for Se and Te, but Table 3 is presented for both elements to summarize the contents. Accordingly, the experiments were randomly conducted to diminish the influence of uncontrolled variables [41]. Different conditions for each experiment set (e.g., Se or Te) cementation were provided with sixteen cube points and eight axial points with six center points in one cube. The quadratic polynomial model was utilized based on the responses in Table 3, through which the regression coefficients were achieved.
Based on the responses in Table 3, a statistical model via the CCD model was achieved for both selenium and tellurium extraction. The coefficient of determination (R2), adjusted R-square (adj. R2), and the analysis of variance (ANOVA) tests were used to estimate the goodness-of-fit of the suggested model. As observed in Table 4 and Table 5, the determination coefficient for Se(IV) cementation is 0.910, and the determination coefficient for Te(IV) cementation is 0.917, demonstrating the appropriate efficiency of the suggested models. Moreover, the predicted R2 for Te and Se is 0.7034 and 0.6418, respectively, and the differences between adjusted and predicted R2 are less than 0.2 for Te and Se. In general, the higher level of F-Values in the model increases the unity of the model, and a proposed model becomes significant because of the higher F-values. In contradiction, a considerable amount of p-values, or lack of fit, can make a model insignificant [33]. As can be observed, the p-values of models are negligible, whereas the criteria are insignificant for both Se and Te. Moreover, the lower pure error can make a convenient model to fit experimental outcomes. Therefore, the proposed Se and Te extraction model can be accepted as a feasible and practical tool.
Regarding inputs and the models provided via response surface methodology and CCD, a semi-empirical relation for Se extraction containing interactions between the existing parameters, is defined as Equation (5):
% E S e = 85.26090 0.4018101 T 0.38856 C H 2 S O 4 + 0.019998 C S e         + 0.51612 C C u 0.005159 T C H 2 S O 4 0.002671 T C C u         + 0.000011 C S e C H 2 S O 4 0.00238 C C u C H 2 S O 4         + 0.000037 C S e ( C C u ) 0.00157 ( T ) 2 2.6 × 10 6 ( C S e ) 2         + 0.003137   ( C C u ) 2
The semi-empirical equation for Te precipitation percentage is found as Equation (6):
% E T e = 5.019280 0.187851 T 0.132960 C H 2 S O 4 + 0.000887 C T e         + 1.96010 C C u 0.003962 T C H 2 S O 4 0.005531 T C C u         + 0.000287 C T e C H 2 S O 4 0.005475 C C u C H 2 S O 4         + 0.000728 C T e C C u 0.001516   ( C H 2 S O 4 ) 2         0.011171 ( C C u ) 2
Positive terms express a synergistic effect, whereas negative terms designate antagonism. Moreover, the interactions between some factors were not significant, so these interactions were eliminated in the suggested models.
Figure 4a,b illustrate the validity of the suggested models for precipitation percentages of Se and Te alongside the experimental extraction percentages presented in Table 3. As can be seen, the validity of the predicted models for both elements versus the actual outputs is acceptable. Moreover, the determination coefficients for Se and Te cementation are 0.912 and 0.92, respectively, which confirm the significant efficiency of the achieved models. These models (Equations (5) and (6)) can be used for the prediction of Se and Te precipitation in sulfuric acid media. Although the models may not always present the accurate rate of the process, but these models can undoubtedly be a helpful index to estimate Se or Te concentration in the Cu cementation process.

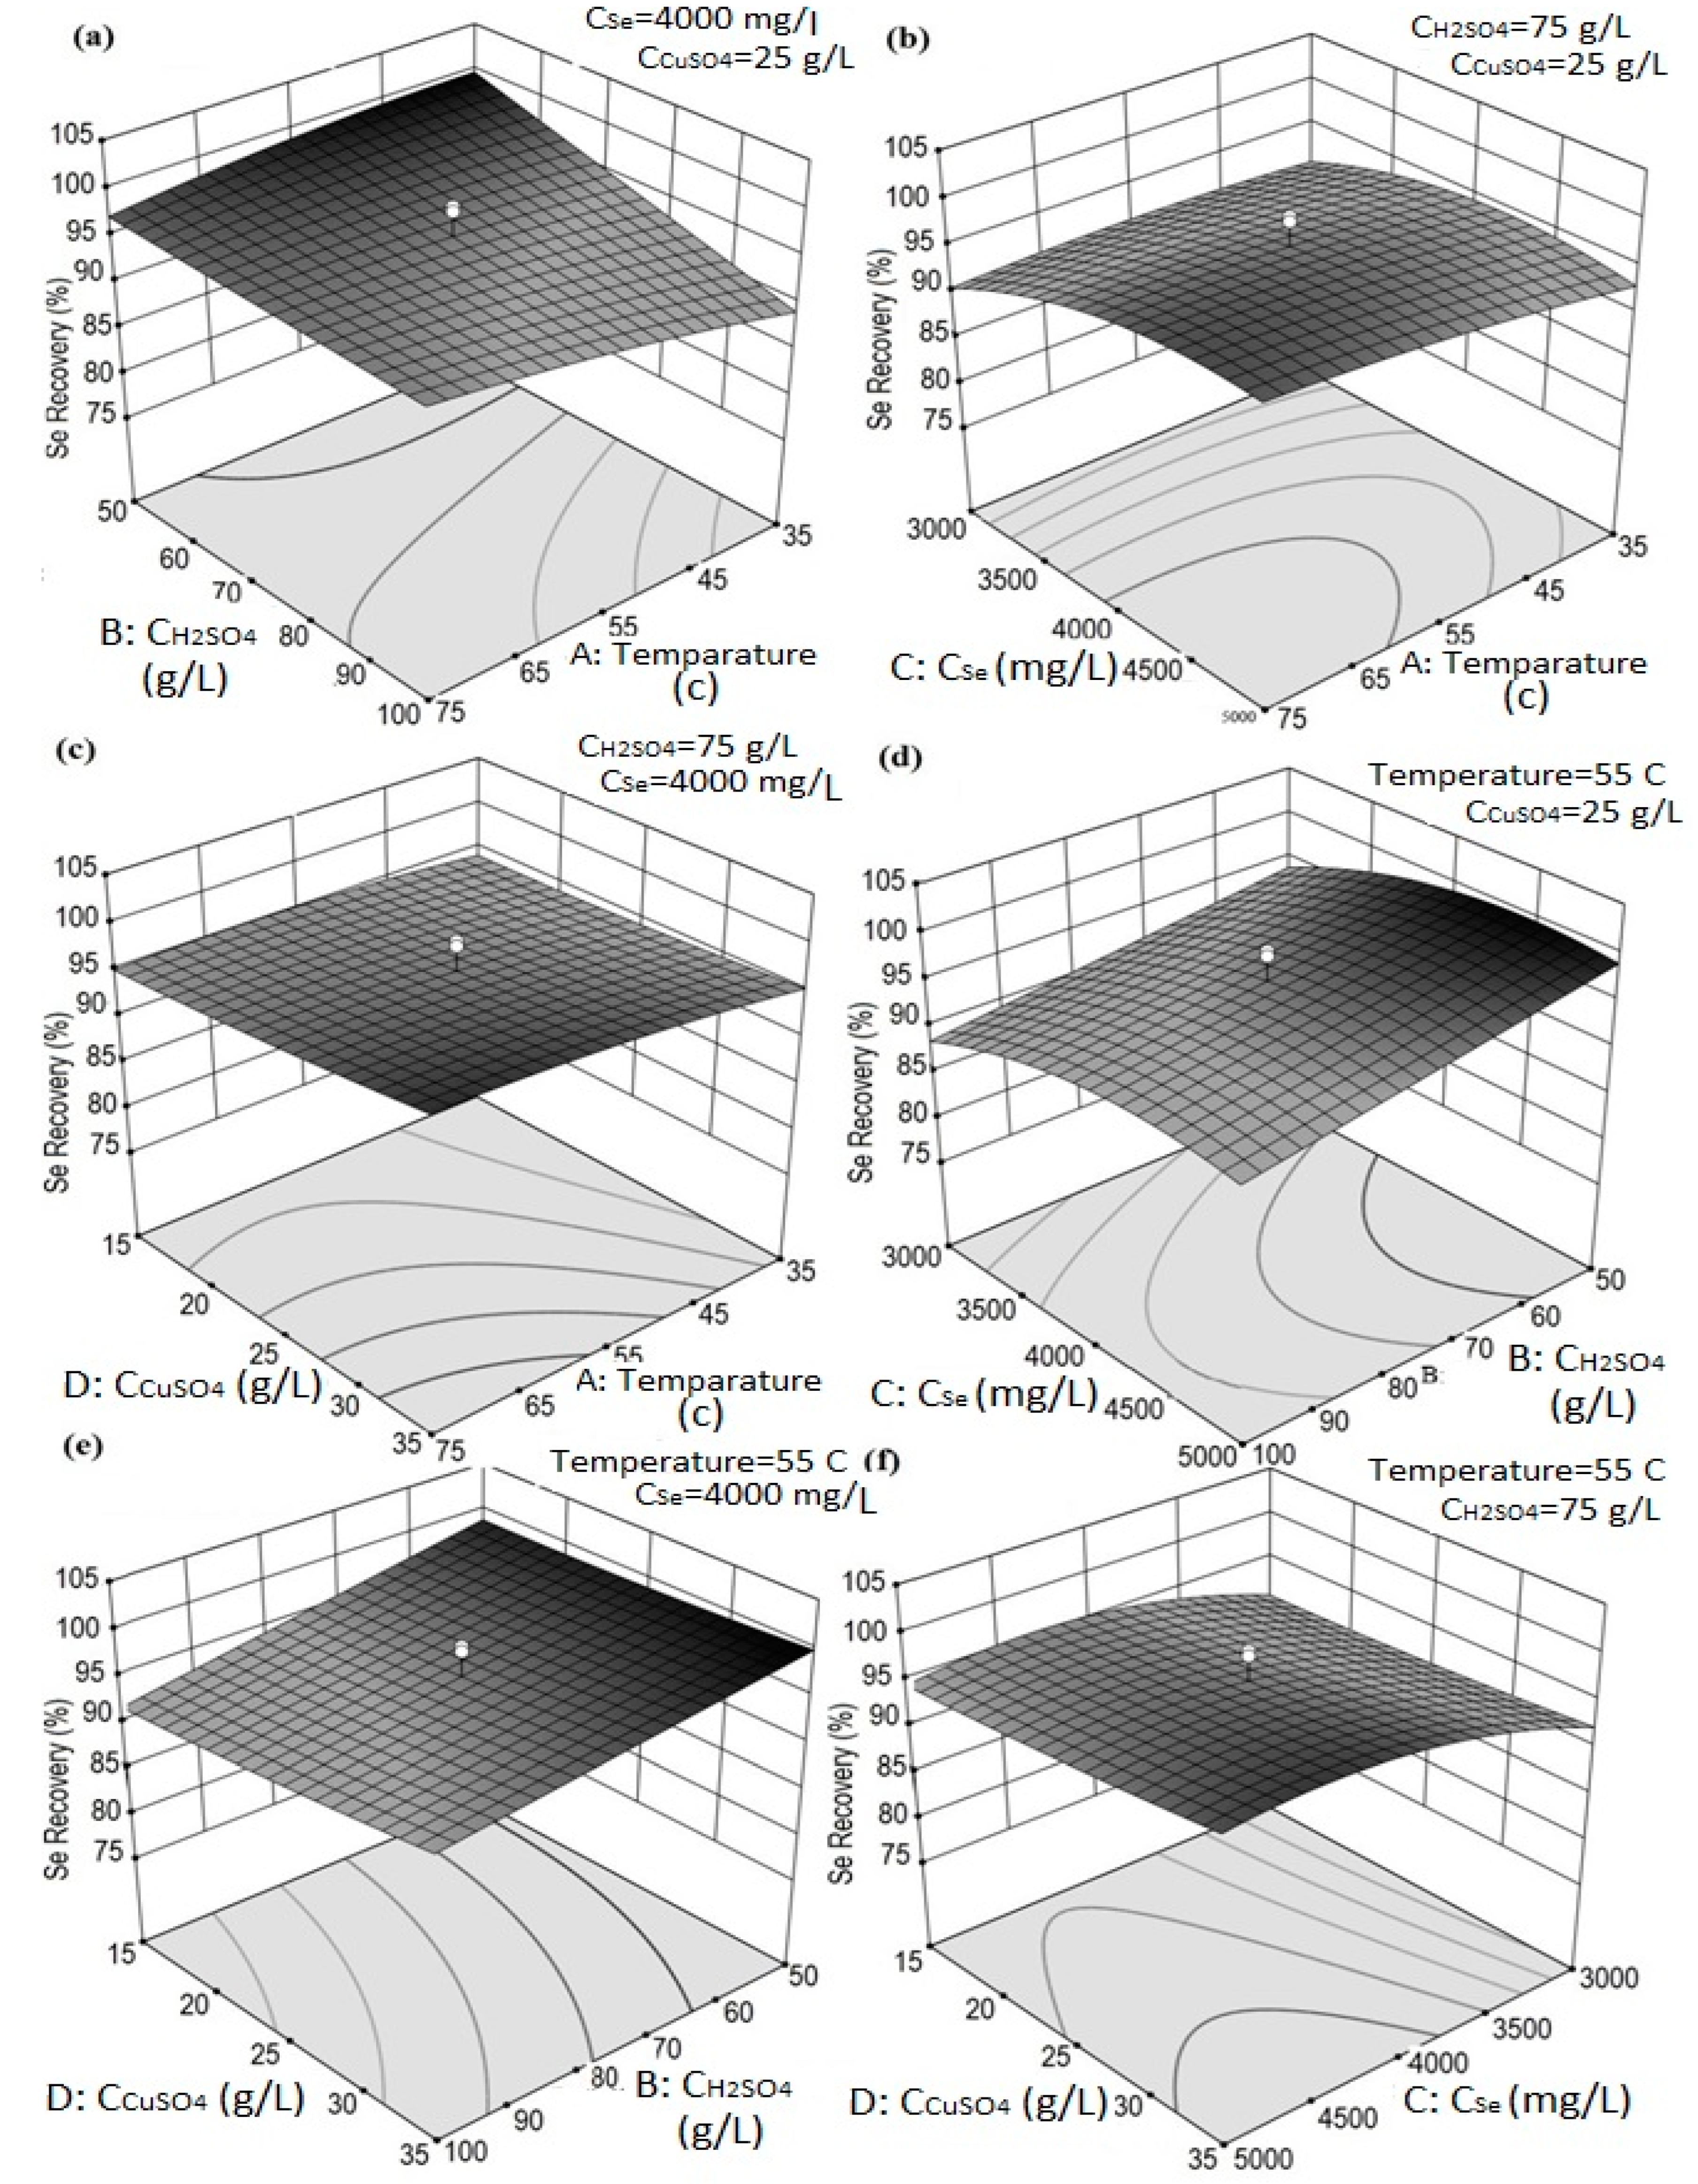
3.3. Three-Dimensional (3D) Response Surface Graphs

Three-dimensional surface plots of the parameters influencing the cementation of Se (IV) are illustrated in Figure 5. The three-dimensional surface graph in Figure 5a demonstrates the Se recovery as a function of temperature and initial H2SO4 concentration, which are both practical parameters in the separation process at a constant Se concentration (4000 mg/L) and initial Cu concentration of 25 g/L. As observed, the minor level of temperature and H2SO4 concentration led to the highest Se recovery value (99.4%). Nevertheless, rising temperature slightly reduces Se recovery at a minimum concentration of H2SO4, whereas the temperature escalates the criterion at a higher level of H2SO4 and reduces the negative influence of H2SO4. Additionally, the detrimental effect of H2SO4 at 75 °C is more conspicuous than at lower temperatures. According to thermodynamic analysis, Figure 5, despite the temperature effect not changing the Se cementation, H2SO4 reduces Se solid phase stability.
Figure 5b illustrates the simultaneous effect of temperature and Se concentration on Se recovery at a constant level of Cu, 25 g/L, and H2SO4, 75 g/L. As the thermodynamic evaluation also confirms in Figure 5b, Se recovery has enhanced with Se concentration at a constant temperature. In this way, the selenious acid (H2SeO3) can be reduced based on an electrochemical reaction expressed in Equation (7) [40]:
H2SeO3 (aq) + 2Cu2+4H+8e = Cu2Se(s) + 3H2O
According to the above reaction, Mokemeli [40] expressed that Stewart et al. [42] suggested a desirable effect of initial Se concentration for Se cementation by copper. Moreover, this behavior was confirmed in other studies [40], as the Se concentration order in the kinetic equation was specified between 1 and 1.8. In addition, Figure 5c shows the effects of temperature and Cu concentration on Se recovery. Temperature is a reluctant parameter in a lower Cu concentration, as shown in the thermodynamic survey, but enhancing Cu concentration promotes Cu2Se phase formation.
Figure 5d exhibits the Se recovery as the function of sulfuric acid concentration and Se concentration at a certain temperature, 55 °C, and Cu concentration, 25 g/L. Based on Figure 5a,b, the higher concentration of H2SO4 diminishes Cu2Se, while the higher Se concentration extends Se cementation. H2SO4 increases the copper dissolution affinity, decreasing Cu2Se stability and recovery. Nevertheless, Se concentration can escalate the Se cementation reaction, Equation (8), and extend the Cu2Se precipitation rate. Figure 5e shows the interaction between H2SO4 and Cu concentration that confirms a futile effect of Cu concentration on Se recovery because of Cu2Se amount promotion, while H2SO4 diminishes Se recovery.
Moreover, Figure 5f illustrates the effect of Se and Cu concentration on Se recovery. As can be seen, the concentration of Se definitely increases the Se recovery percentage. In contrast, Cu concentration has a limited effect on the Se cementation efficiency.
The prime purpose of the work is to determine the functional condition of the cementation process. As observed, adjusting the different parameters could lead to the desired Se cementation by copper. Nevertheless, as mentioned in previous reports [12,34], tellurium is able to be precipitated by the copper cementation method. However, our results exhibit that tellurium slightly precipitates in this temperature range, and the extraction percentage is low. The main reason for restricted tellurium cementation is the instability of Cu+ at a temperature lower than 75 °C [27], illustrated in the thermodynamic analysis. Nevertheless, Figure 5 was brought to explore the interaction between some parameters, e.g., initial Cu concentration, H2SO4 concentration, and temperature, on the Te precipitation process.
As seen in Figure 6a, both temperature and sulfuric acid concentration slightly increase Te precipitation, indicating the synergism effect of both factors. Regarding thermodynamic analysis, rising temperature is favorable for the endothermic cementation reaction leading to higher recovery. Moreover, Jennings et al. [12] expressed that the tellurium precipitation reaction happens at least 75 °C, and the process rate at a lower temperature is too slow. In another way, H2SO4 promotes Te cementation reaction to form Cu2Te as follows:
H2TeO3 + 3Cu + H2SO4 = CuSO4 + Cu2Te + 3H2O
As can be observed, sulfuric acid leads to higher Se recovery, as Cooper [43] reported that at least 50 g/L of sulfuric acid is needed to accelerate the precipitation of tellurium. Figure 6b presents the effect of Cu concentration and temperature on Te extraction percent at 1000 mg/L Te and 75 g/L H2SO4. These data indicate that the influence of temperature on Te recovery is not desirable, whereas raising the level of Cu concentration hurts Te recovery. In the Te cementation process, the cupric species can reach an equilibrium between cuprous and Cu2Te, which is expressed as follows [40]:
Cu 2 Te   +   Cu 2 + =   2 Cu + +   CuTe
However, CuTe is an unstable component that can be disassociated from Cu2Te to Te and Cu, decreasing Te extraction efficiency. However, by adding more Te to the solution, the detrimental effect of cupric ions is declined in the model, which may confirm the occurrence of the Cu2Te dissociation. It should be noted that the interaction of other parameters is quite limited, so they were not discussed in the section to summarize the content.

3.4. Validation of the Proposed Models

Additional experiments should confirm the Se (Equation (5)) and Te (Equation (6)) precipitation equation. Hence, three points, which have more Se extraction and less Te extraction, were chosen to validate the cementation equations in Table 6. The first row corresponds to the discrete precipitation of Se and Te, and the third row belongs to the dual extraction of both elements.
As shown in Table 6, the extraction efficiency difference between the predicted model and experiment results is less than the standard deviations validating the achieved models in this work. Thus, the predicted value is plausible with the experimental outputs, which have less than 2% standard error. Moreover, the results of the first test, e.g., 35 °C, 50 g/L H2SO4, and 15 g/L Cu have values of separation factor greater than the two other ones, being more desirable for the separations process.
On the other hand, the selenium and tellurium extraction were carried out in co-presence, and the result was brought at the third line of the test. The separation indexes in the dual cementation process have been better improved than the discrete process. The thermodynamic evaluation [44] demonstrates that tellurium can reduce selenite anions according to Equation (10), leading to a more Se and Te separation index which is more desirable in separation processes.
SeO 3 2 aq + Te s =   TeO 3 2   aq +   Se S Δ G 298 0 = 66.86

3.5. Se and Te Separation in Copper Anode Slime Leaching Solution

Liquor, obtained from copper anode slime, contains different impurities, Fe, Pd, Ag, As, Sb, and Pb, disturbing the separation process. It should be mentioned that the synthetic solution was prepared based on industrial conditions, and the optimum level of factors in Section 2 can be exploited for Se cementation in the copper anode slime liquor. Hence, the precipitation process for selenium or tellurium is carried out in the liquor, which has a chemical composition presented in Table 7.
The results are in Table 8 after 0.5, 1, 2, and 4 h, and the separation indexes are reported. The extraction efficiency at 30 min, 1, 2 and 4 h is 34.78, 76.304%, 95.480% and 97.304%, respectively. The co-extraction of impurities, such as As, may slightly diminish the selenium cementation by copper metal [45]. The outputs indicate that although the extraction percentage and separation index is diminished in copper anode slime liquor compared to the synthetic solution, the proposed process can still be efficient for Se and Te separation in industrial operations. Moreover, extending the process time can slightly enhance Se extraction at four hours, but the co-extraction of tellurium restricts the separation index.
Moreover, if results obtained from copper anode slime leaching are compared with results from the statistical model, e.g., Equations (5) and (6), we will conclude that the presented models can predict the range of Se or Te recovery percent in the cementation process. Thus, these models can be useful for a practical process design on a pilot or industrial scale.

3.6. Characterization of the Process Sediments

X-ray diffraction (XRD) is one of the technics that could provide useful data about the sediments of the process. The XRD pattern for sediments was obtained according to optimum conditions, expressed in Table 6, which are presented in Figure 7. As observed, Cu1.8Se and Cu2Se are the dominant phases in the sediment that approves Se has been cemented in the system, whereas tellurium phases are not detectible in the condition. Additionally, thermodynamic assessments, Figure 2, present CuSe and CuSe2 as the equilibrium phases in the Se-Cu-H2O system, and the blend of these phases are represented as Cu1.8Se.
Furthermore, the XRD patterns for the discrete experiment of Se and Te cementation were brought in Figure 8a,b, respectively. Although selenium phases are Cu1.8Se and Cu2Se, as recognized in Figure 8a, tellurium is not found in the XRD histogram. In addition, pure copper and Cu2O are recognized as prime components in the Te cementation sediments. As shown in Table 6, Te recovery percent is less than 2.5%, which is too weak alongside staple Cu phase peaks.

4. Conclusions

The cementation of Se and Te by copper metal was surveyed using response surface methodology (RSM) as a tool for experiment design and thermodynamic analysis. The results presented that copper sulfate concentration and temperature diminished Se extraction percent in the 5–45 g/L Cu and 15–95 °C range, while temperature and sulfuric acid can slightly increase Te extraction efficiency. The optimum condition is 35 °C, 50 g/L H2SO4, 3000 mg/L Se, 750 mg/L Te, and 15 g/L CuSO4 in which the separation index (β) is 5291 in synthetic solution and 606 in liquor of copper anode slime leaching. Although there is a significant difference between separation index (β) in synthetic and pregnant solutions, the presented models can specify the Se or Te recovery range in the sulfuric media. Moreover, the separation indexes demonstrate that the proposed method can efficiently separate these elements, e.g., Se and Te. Moreover, the XRD patterns approve copper selenide formation in the sediments. In contrast, a negligible amount of Te is extracted in the sulfate solution. Finally, a practical process from copper anode slime has been proposed via the copper cementation process.

Author Contributions

S.H., investigation, methodology, chemical, formal analysis and data curation, funding acquisition, writing the original draft; E.K.A., supervision, conceptualization, methodology, data curation, review and editing; N.S., supervision, conceptualization, methodology, data curation, review and editing. All authors have read and agreed to the published version of the manuscript.

Funding

This research received no external funding.

Data Availability Statement

Restrictions apply to the availability of these data. Data were obtained from Amirkabir University of technology and are available from Eskandar Keshavarz Alamdari with the permission of Amirkabir University of Technology.

Acknowledgments

Administrative and technical support from Rafsanjan non-ferrous metals recycling company is gratefully acknowledged.

Conflicts of Interest

The authors declare no conflict of interest.

References

  1. Panahi-Kalamuei, M.; Salavati-Niasari, M.; Hosseinpour-Mashkani, S.M. Facile microwave synthesis, characterization, and solar cell application of selenium nanoparticles. J. Alloys Compd. 2014, 617, 627–632. [Google Scholar] [CrossRef]
  2. Champness, C.H.; Chan, A. Relation between barrier height and work function in contacts to selenium. J. Appl. Phys. 1985, 57, 4823–4825. [Google Scholar] [CrossRef]
  3. Khurana, A.; Tekula, S.; Saifi, M.A.; Venkatesh, P.; Godugu, C. Therapeutic applications of selenium nanoparticles. Biomed. Pharmacother. 2019, 111, 802–812. [Google Scholar] [CrossRef] [PubMed]
  4. Hoffmann, J.E.; King, M.G. Selenium and selenium compounds. In Kirk-Othmer Encyclopedia of Chemical Technology; J. Wiley: Hoboken, NJ, USA, 2000; pp. 1–36. [Google Scholar] [CrossRef]
  5. Naumov, A.V. Selenium and tellurium: State of the markets, the crisis, and its consequences. Metallurgist 2010, 54, 197. [Google Scholar] [CrossRef]
  6. Adnan, M. Application of Selenium a Useful Way to Mitigate Drought Stress: A Review. Open Access J. Biog. Sci. Res. 2020, 3, 39. [Google Scholar] [CrossRef]
  7. Knockaert, G. Tellurium and Tellurium Compounds. In Ullmann’s Encyclopedia of Industrial Chemistry; J. Wiley: Hoboken, NJ, USA, 2000. [Google Scholar] [CrossRef]
  8. Capper, P.; Garland, J.; Kasap, S.; Willoughby, A. Mercury Cadmium Telluride: Growth, Properties and Applications; J. Wiley: Hoboken, NJ, USA, 2011. [Google Scholar]
  9. Surai, P.F.; Taylor-Pickard, J.A. Current Advances in Selenium Research and Applications; Wageningen Academic Publishers: Wageningen, The Netherlands, 2008; Volume 1. [Google Scholar]
  10. Lu, D.-K.; Chang, Y.-F.; Yang, H.-Y.; Xie, F. Sequential removal of selenium and tellurium from copper anode slime with high nickel content. Trans. Nonferrous Met. Soc. China 2015, 25, 1307–1314. [Google Scholar] [CrossRef]
  11. Nassar, N.T.; Graedel, T.E.; Harper, E.M. By-product metals are technologically essential but have problematic supply. Sci. Adv. 2015, 1, e1400180. [Google Scholar] [CrossRef] [Green Version]
  12. Jennings, P.H.; Themelis, N.J.; Stratigakos, E.S. A continuous-flow reactor for the precipitation of tellurium. Can. Metall. Q. 1969, 8, 281–286. [Google Scholar] [CrossRef]
  13. Li, Z.; Deng, J.; Liu, D.; Jiang, W.; Zha, G.; Huang, D.; Deng, P.; Li, B. Waste-free separation and recovery of copper telluride slag by directional sulfidation-vacuum distillation. J. Clean. Prod. 2022, 335, 130356. [Google Scholar] [CrossRef]
  14. Hoffmann, J.E. Recovering selenium and tellurium from copper refinery slimes. Jom 1989, 41, 33–38. [Google Scholar] [CrossRef]
  15. Sadeghi, N.; Alamdari, E.K. Selective extraction of gold (III) from hydrochloric acid-chlorine gas leach solutions of copper anode slime by tri-butyl phosphate (TBP). Trans. Nonferrous Met. Soc. China 2016, 26, 3258–3265. [Google Scholar] [CrossRef]
  16. Xu, Z.; Guo, X.; Li, D.; Tian, Q. Leaching kinetics of tellurium-bearing materials in alkaline sulfide solutions. Miner. Process. Extr. Metall. Rev. 2020, 41, 1–10. [Google Scholar] [CrossRef]
  17. Saeedi, M.; Sadeghi, N.; Alamdari, E.K. Modeling of Au Chlorination Leaching Kinetics from Copper Anode Slime. Min. Metall. Explor. 2021, 38, 2559–2568. [Google Scholar] [CrossRef]
  18. Fan, J.; Wang, G.; Li, Q.; Yang, H.; Xu, S.; Zhang, J.; Chen, J.; Wang, R. Extraction of tellurium and high purity bismuth from processing residue of zinc anode slime by sulfation roasting-leaching-electrodeposition process. Hydrometallurgy 2020, 194, 105348. [Google Scholar] [CrossRef]
  19. Rao, S.; Liu, Y.; Wang, D.; Cao, H.; Zhu, W.; Yang, R.; Duan, L.; Liu, Z. Pressure leaching of selenium and tellurium from scrap copper anode slimes in sulfuric acid-oxygen media. J. Clean. Prod. 2021, 278, 123989. [Google Scholar] [CrossRef]
  20. Shi, G.; Liao, Y.; Su, B.; Zhang, Y.; Wang, W.; Xi, J. Kinetics of copper extraction from copper smelting slag by pressure oxidative leaching with sulfuric acid. Sep. Purif. Technol. 2020, 241, 116699. [Google Scholar] [CrossRef]
  21. Kurniawan, K.; Lee, J.-C.; Kim, J.; Kim, R.; Kim, S. Leaching Kinetics of Selenium, Tellurium and Silver from Copper Anode Slime by Sulfuric Acid Leaching in the Presence of Manganese (IV) Oxide and Graphite. Mater. Proc. 2021, 3, 16. [Google Scholar]
  22. Matsuo, N.; Oshima, T.; Ohe, K.; Otsuki, N. Extraction behavior of arsenic, selenium, and antimony using cyclopentyl methyl ether from acidic chloride media. Solvent Extr. Res. Dev. Jpn. 2019, 26, 81–89. [Google Scholar] [CrossRef] [Green Version]
  23. Sattari, A.; Kavousi, M.; Alamdari, E.K. Solvent Extraction of Selenium in Hydrochloric Acid Media by Using Triisobutyl Phosphate and Triisobutyl Phosphate/Dodecanol Mixture. Trans. Indian Inst. Met. 2017, 70, 1103–1109. [Google Scholar] [CrossRef]
  24. Chowdhury, M.R.; Sanyal, S.K. Separation by solvent extraction of tellurium (IV) and selenium (IV) with tri-n butyl phosphate: Some mechanistic aspects. Hydrometallurgy 1993, 32, 189–200. [Google Scholar] [CrossRef]
  25. Mhaske, A.A.; Dhadke, P.M. Separation of Te (IV) and Se (IV) by extraction with Cyanex 925. Sep. Sci. Technol. 2003, 38, 3575–3589. [Google Scholar] [CrossRef]
  26. Havezov, I.; Jordanov, N. Separation of tellurium (IV) by solvent extraction methods. Talanta 1974, 21, 1013–1024. [Google Scholar] [CrossRef]
  27. Mokmeli, M.; Dreisinger, D.; Wassink, B. Modeling of selenium and tellurium removal from copper electrowinning solution. Hydrometallurgy 2015, 153, 12–20. [Google Scholar] [CrossRef]
  28. Mohammadi, M. Selenium Removal from Waste Waters by Chemical Reduction with Chromous Ions. Ph.D. Thesis, University of British Columbia, Vancouver, BC, Canada, 2019. [Google Scholar]
  29. Zhang, F.-Y.; Zheng, Y.-J.; Peng, G.-M. Selection of reductants for extracting selenium and tellurium from degoldized solution of copper anode slimes. Trans. Nonferrous Met. Soc. China 2017, 27, 917–924. [Google Scholar] [CrossRef]
  30. Bello, Y.O. Tellurium and Selenium Precipitation from Copper Sulphate Solutions. Master’s Thesis, Stellenbosch University, Stellenbosch, South Africa, 2014. [Google Scholar]
  31. Anderson, M.D.; Thomas, T.R. Separation of Tellurium and Iodine from Other Fission Products: Application to Loft Samples; Atomic Energy Div., Phillips Petroleum Co.: Idaho Falls, ID, USA, 1965. [Google Scholar]
  32. Guo, X.; Xu, Z.; Li, D.; Tian, Q.; Xu, R.; Zhang, Z. Recovery of tellurium from high tellurium-bearing materials by alkaline sulfide leaching followed by sodium sulfite precipitation. Hydrometallurgy 2017, 171, 355–361. [Google Scholar] [CrossRef]
  33. Hashemi, M.; Mousavi, S.M.; Razavi, S.H.; Shojaosadati, S.A. Comparison of submerged and solid state fermentation systems effects on the catalytic activity of Bacillus sp. KR-8104 α-amylase at different pH and temperatures. Ind. Crops Prod. 2013, 43, 661–667. [Google Scholar] [CrossRef]
  34. Shibasaki, T.; Abe, K.; Takeuchi, H. Recovery of tellurium from decopperizing leach solution of copper refinery slimes by a fixed bed reactor. Hydrometallurgy 1992, 29, 399–412. [Google Scholar] [CrossRef]
  35. Wang, S.; Wesstrom, B.; Fernandez, J. A novel process for recovery of Te and Se from copper slimes autoclave leach solution. J. Miner. Mater. Charact. Eng. 2003, 2, 53–64. [Google Scholar] [CrossRef]
  36. Fjodorova, N.; Novič, M. Searching for optimal setting conditions in technological processes using parametric estimation models and neural network mapping approach: A tutorial. Anal. Chim. Acta 2015, 891, 90–100. [Google Scholar] [CrossRef]
  37. Farzam, S.; Feyzi, F. Response surface methodology applied to extraction optimization of gold (III) by combination of imidazolium-based ionic liquid and 1-octanol from hydrochloric acid. Sep. Sci. Technol. 2020, 55, 1133–1145. [Google Scholar] [CrossRef]
  38. Khuri, A.I.; Mukhopadhyay, S. Response surface methodology. WIREs Comput. Stat. 2010, 2, 128–149. [Google Scholar] [CrossRef]
  39. GTT-Technologies; Bale, C.; Chartrand, P.; Harvey, J.P.; Pelton, A.; Decterov, S.; Robelin, C.; Gheribi, A.; Jin, L.; Bélisle, E.; et al. FactSage; CRTC & GTT: Montreal, QC, Canada, 2007. [Google Scholar]
  40. Mokmeli, M. Kinetics of Selenium and Tellurium Removal with Cuprous Ion from Copper Sulfate-Sulfuric Acid Solution. Ph.D. Thesis, University of British Columbia, Vancouver, BC, Canada, 2014. [Google Scholar]
  41. Sereshti, H.; Khojeh, V.; Samadi, S. Optimization of dispersive liquid-liquid microextraction coupled with inductively coupled plasma-optical emission spectrometry with the aid of experimental design for simultaneous determination of heavy metals in natural waters. Talanta 2011, 83, 885–890. [Google Scholar] [CrossRef] [PubMed]
  42. Stewart, D.A.; Tyroler, P.; Stupavsky, S. The Removal of selenium and tellurium from copper electrolyte at INCO’s copper refinery electrowinning department. In Proceedings of the 15th Annual Hydrometallurgical Meeting, Vancouver, BC, Canada, 11–14 August 1985; pp. 18–22. [Google Scholar]
  43. Cooper, W.C. Tellurium; Van Nostrand Reinhold Company: New York, NY, USA, 1971. [Google Scholar]
  44. McPhail, D.C. Thermodynamic properties of aqueous tellurium species between 25 and 350. Geochim. Cosmochim. Acta 1995, 59, 851–866. [Google Scholar] [CrossRef]
  45. Wu, L.-K.; Xia, J.; Zhang, Y.-F.; Li, Y.-Y.; Cao, H.-Z.; Zheng, G.-Q. Effective cementation and removal of arsenic with copper powder in a hydrochloric acid system. RSC Adv. 2016, 6, 70832–70841. [Google Scholar] [CrossRef]
Figure 1. Flowchart for Se and Te cementation process by solid copper.
Metals 12 01851 g001
Figure 2. Se species in different (a) H2SO4; (b) Se concentration; (c) solid copper values; (d) temperature at mean quantity of other factors.
Metals 12 01851 g002
Figure 3. Te species in different amount of (a) H2SO4; (b) tellurium; (c) copper sulfate at mean quantity of other factors.
Metals 12 01851 g003aMetals 12 01851 g003b
Figure 4. Predicted extracted percent versus actual extraction percent for (a) Se and (b) Te.
Metals 12 01851 g004
Figure 5. Response surface graphs for interactions of parameters of Se (IV) cementation by solid copper. (a) Effect of H2SO4 concentration and temperature; (b) Effect of Temperature and Se concentration; (c) Effect of Cu concentration and temperature; (d) Effect of of H2SO4 concentration and Se concentration; (e) Effect of H2SO4 concentration and Cu concentration; (f) Effect of Se concentration and Cu concentration.
Metals 12 01851 g005
Figure 6. Response surface graphs for interactions of parameters of Te (IV) cementation by solid copper. (a) Effect of H2SO4 concentration and temperature; (b) Effect of Temperature and Cu concentration.
Metals 12 01851 g006
Figure 7. XRD pattern of sediments for dual cementation of Se and Te at 4000 mg/L Se, 1000 g/L Te, 75 g/L H2SO4 and 15 g/L CuSO4 and 35 °C.
Metals 12 01851 g007
Figure 8. XRD pattern for discrete cementation of (a) Se at 4000 mg/L Se, 75 g/L H2SO4 and 15 g/L CuSO4 and 35 °C and (b) Te at 1000 g/L Te, 75 g/L H2SO4 and 15 g/L Cu SO4 and 35 °C.
Metals 12 01851 g008
Table 1. Analysis of primitive pregnant solution from copper anode slime leaching.
ElementsCu (g/L)Se (mg/L)Te (mg/L)As (mg/L)Pb (mg/L)Ag (mg/L)Pd (mg/L)
concentration13.8529107231853.2132<1
Table 2. The main factors and the corresponding levels.
ParametersUnitFactor CodeLevel of Factors
−2−1012
Temperature°CX11535557595
H2SO4 concentrationg/LX2255075100125
Te concentrationmg/LX3500750100012501500
Se concentration20003000400050006000
CuSO4 concentrationg/LX4515253545
Table 3. Design matrix for CCD experiments and responses.
RunX1X2X3X4R1
TCH2SO4CTeCSeCCuSO4Te RecoverySe Recovery
°Cg/Lmg/Lg/L%
1557510004000254.6198.203
2355075030003511.9998.00
3355012505000353.9899.91
455755002000256.7879.36
5557510004000451.0798.46
675507503000151.5190.00
7157510004000258.9688.48
8751007503000351.8491.89
9351007503000354.0086.96
10557510004000257.3393.93
11552510004000254.7298.55
12957510004000257.0096.31
133510012505000353.9789.93
14351007503000150.6785.00
15557510004000257.1094.14
167510012505000353.6199.22
17557510004000256.0199.24
185512510004000253.4691.11
19557510004000257.8898.71
2075507503000354.8393.00
21751007503000157.5489.97
225575150060002510.6190.00
23355012505000157.2898.98
2435507503000156.9898.52
25755012505000352.0199.89
263510012505000158.8087.47
2755751000400055.3394.22
2875100125050001515.9191.57
29755012505000153.2599.02
30557510004000257.3398.07
Table 4. Analysis of variance (ANOVA) and coefficient of determination for the suggested quadratic polynomial model for Se.
SourceSum of SquaresDegree of FreedomMean SquareF-Valuep-ValueDescription
Model706.341354.3311.11<0.0001Significant
Residual78.25164.89
Lack of Fit52.41114.761.92190.5795not significant
Pure Error25.8455.17
0.910
Adjusted R² 0.8192
Predicted R² 0.6418
A-Temperature25.73 54.3311.11<0.0001
B-Sulfuric Acid206.75 25.735.260.0357
C-Se Concentration121.70 206.7542.27<0.0001
D-Cu Concentration30.30 121.7024.880.0001
AB85.03 85.0317.390.0007
AC18.28 18.283.740.0711
AD4.55 4.550.92980.0034
BC1.10 8.103.22580.0064
BD5.68 5.6812.160.0029
CD2.13 2.130.43600.5185
11.03 11.032.260.1637
0.1485 0.14850.02850.8682
187.46 189.4638.74< 0.0001
2.76 2.760.56330.4638
Table 5. Analysis of variance (ANOVA) and coefficient of determination for the suggested quadratic polynomial model for Te.
SourceSum of SquaresDegree of FreedomMean SquareF-Valuep-ValueDescription
Residual29.561829.3617.88<0.0001Significant
Lack of Fit25.19131.64
Pure Error4.3751.942.220.1945not significant
0.8734
Adjusted R² 0.917
Predicted R² 0.8649
A-Temperature8.05 8.054.900.0400
B-Sulfuric Acid0.8791 0.87910.53540.04738
C-Te concentration9.00 9.005.480.0309
D-Cu cobcentration30.00 30.0018.270.0005
AB62.81 62.8138.25<0.0001
AD19.58 19.5811.920.0028
BC51.48 51.4831.35<0.0001
BD29.98 29.9818.260.0005
CD52.93 52.9332.23<0.0001
25.54 25.5415.560.0010
39.00 39.0023.750.0001
Table 6. Experiments for models’ validations of Se and Te extraction.
T °CH2SO4 g/LSe mg/LTe mg/LCu g/LPredicted %EExpe. %EDβ
SeStd D.TeStd D.SeTeSeTe
35503000-1597.882.21- 97.21-34.8-1659
3550-75015--2.331.29-2.12-0.02
3550300075015----98.461.3763.50.015291
Table 7. Analysis of pregnant solution according to optimal condition of Se/Te separation.
ElementsCu (g/L)Se (mg/L)Te (mg/L)As (mg/L)Pb (mg/L)Ag (mg/L)Pd (mg/L)
concentration15.0529807833003.2163<1
Table 8. Selenium and tellurium cementation by 20 g/L Cu chop.
Time (h)SeTeAs βSe,Te
%ED%ED%ED
0.534.7820.53461.2120.01251.880.01942.768
176.3043.22182.2240.02582.80.028124.876
295.48021.123.3660.03483.250.034606.896
497.30425.47911.4220.12905.10.054197.511
Publisher’s Note: MDPI stays neutral with regard to jurisdictional claims in published maps and institutional affiliations.

