
Post-Rolling Cooling Phase Transformation and Microstructure of High-Strength Anti-Seismic Rebars with Different Solute Nb and Austenite Microstructure

Abstract
1. Introduction
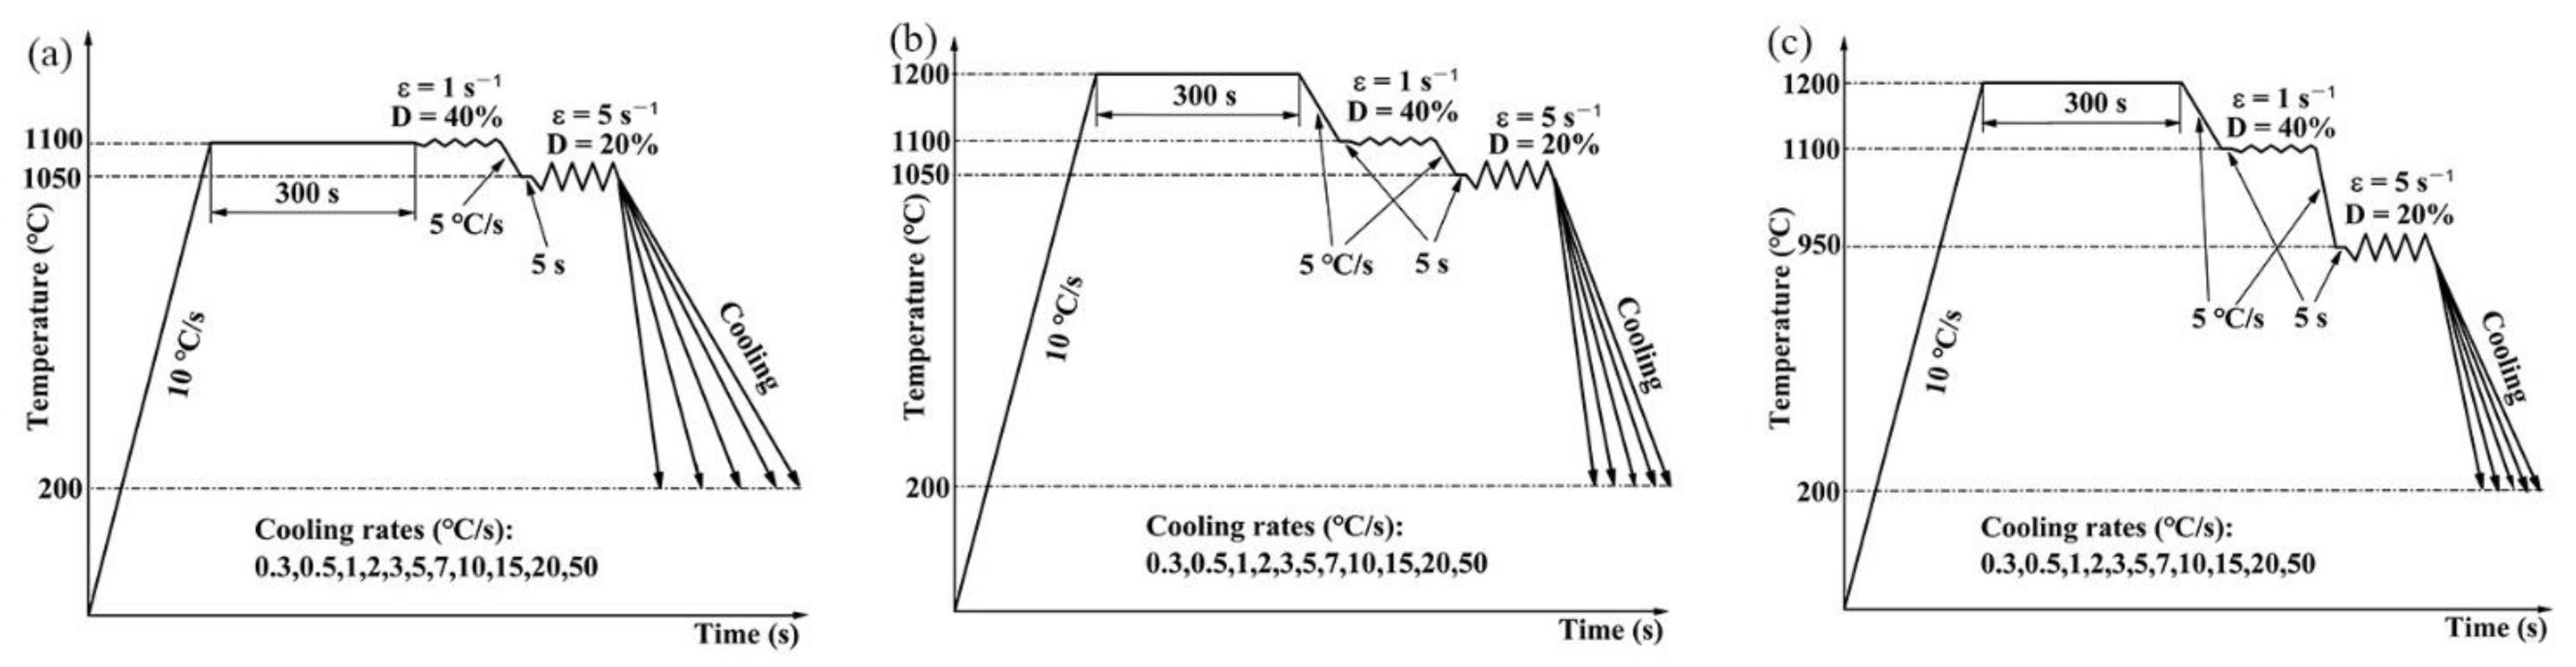
2. Materials and Methods
3. Results
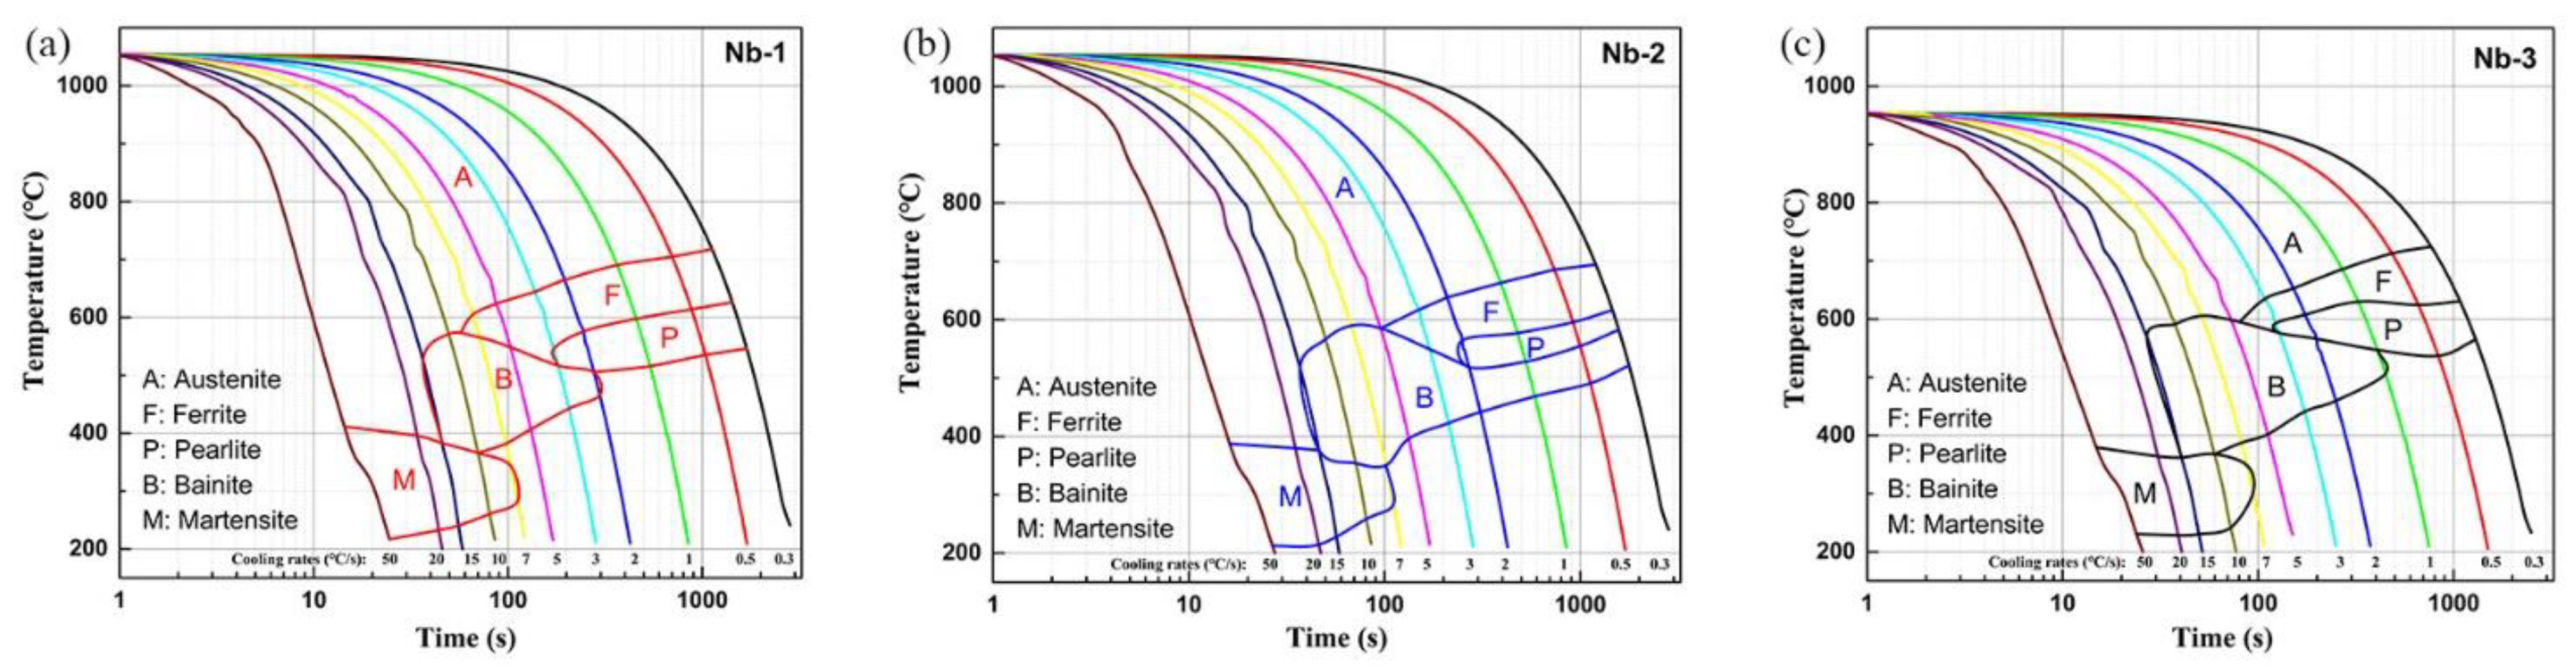
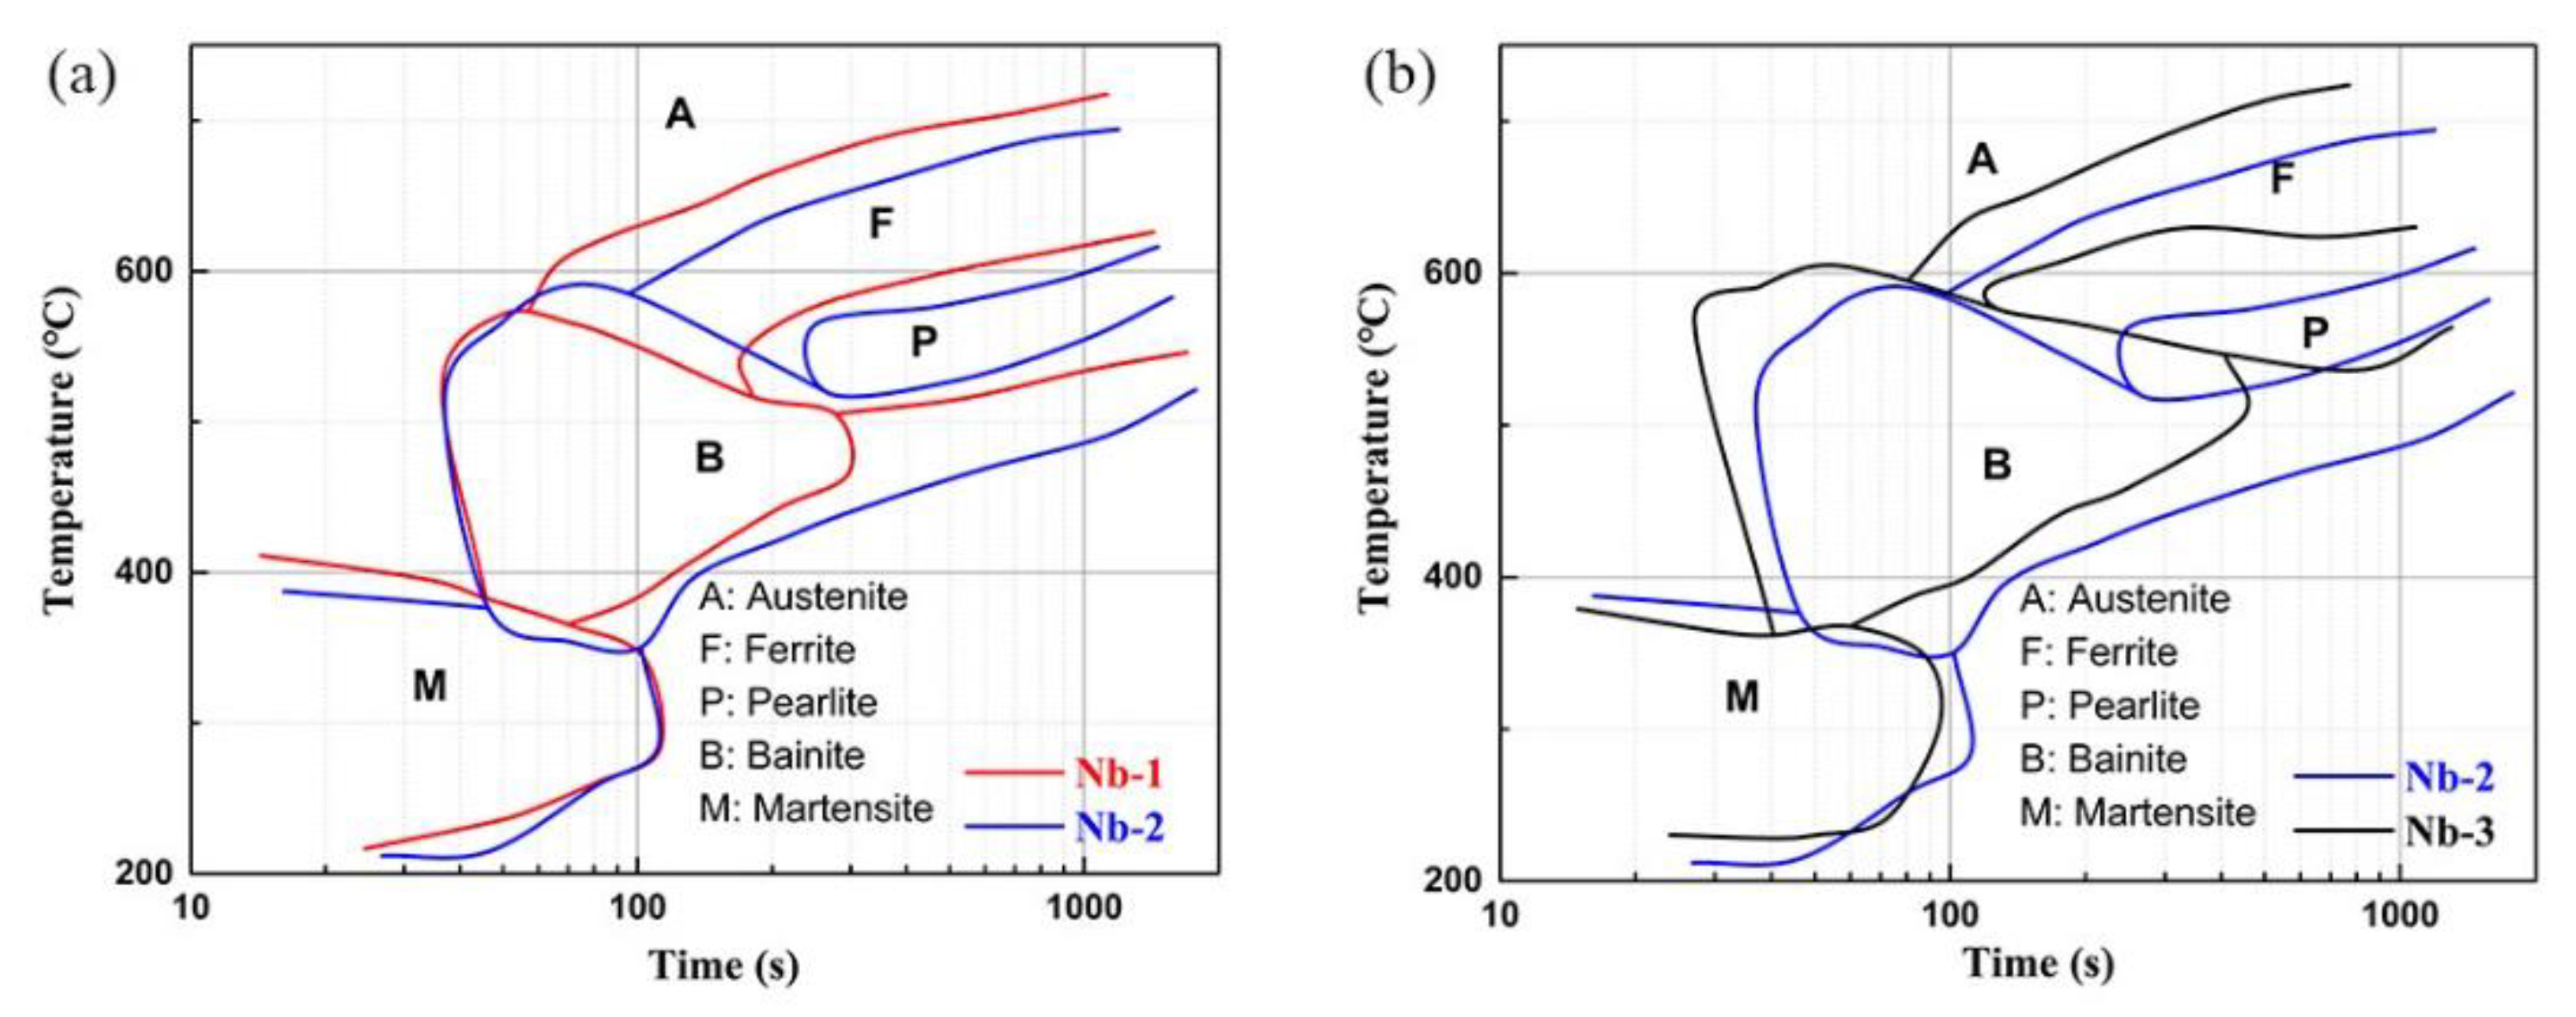
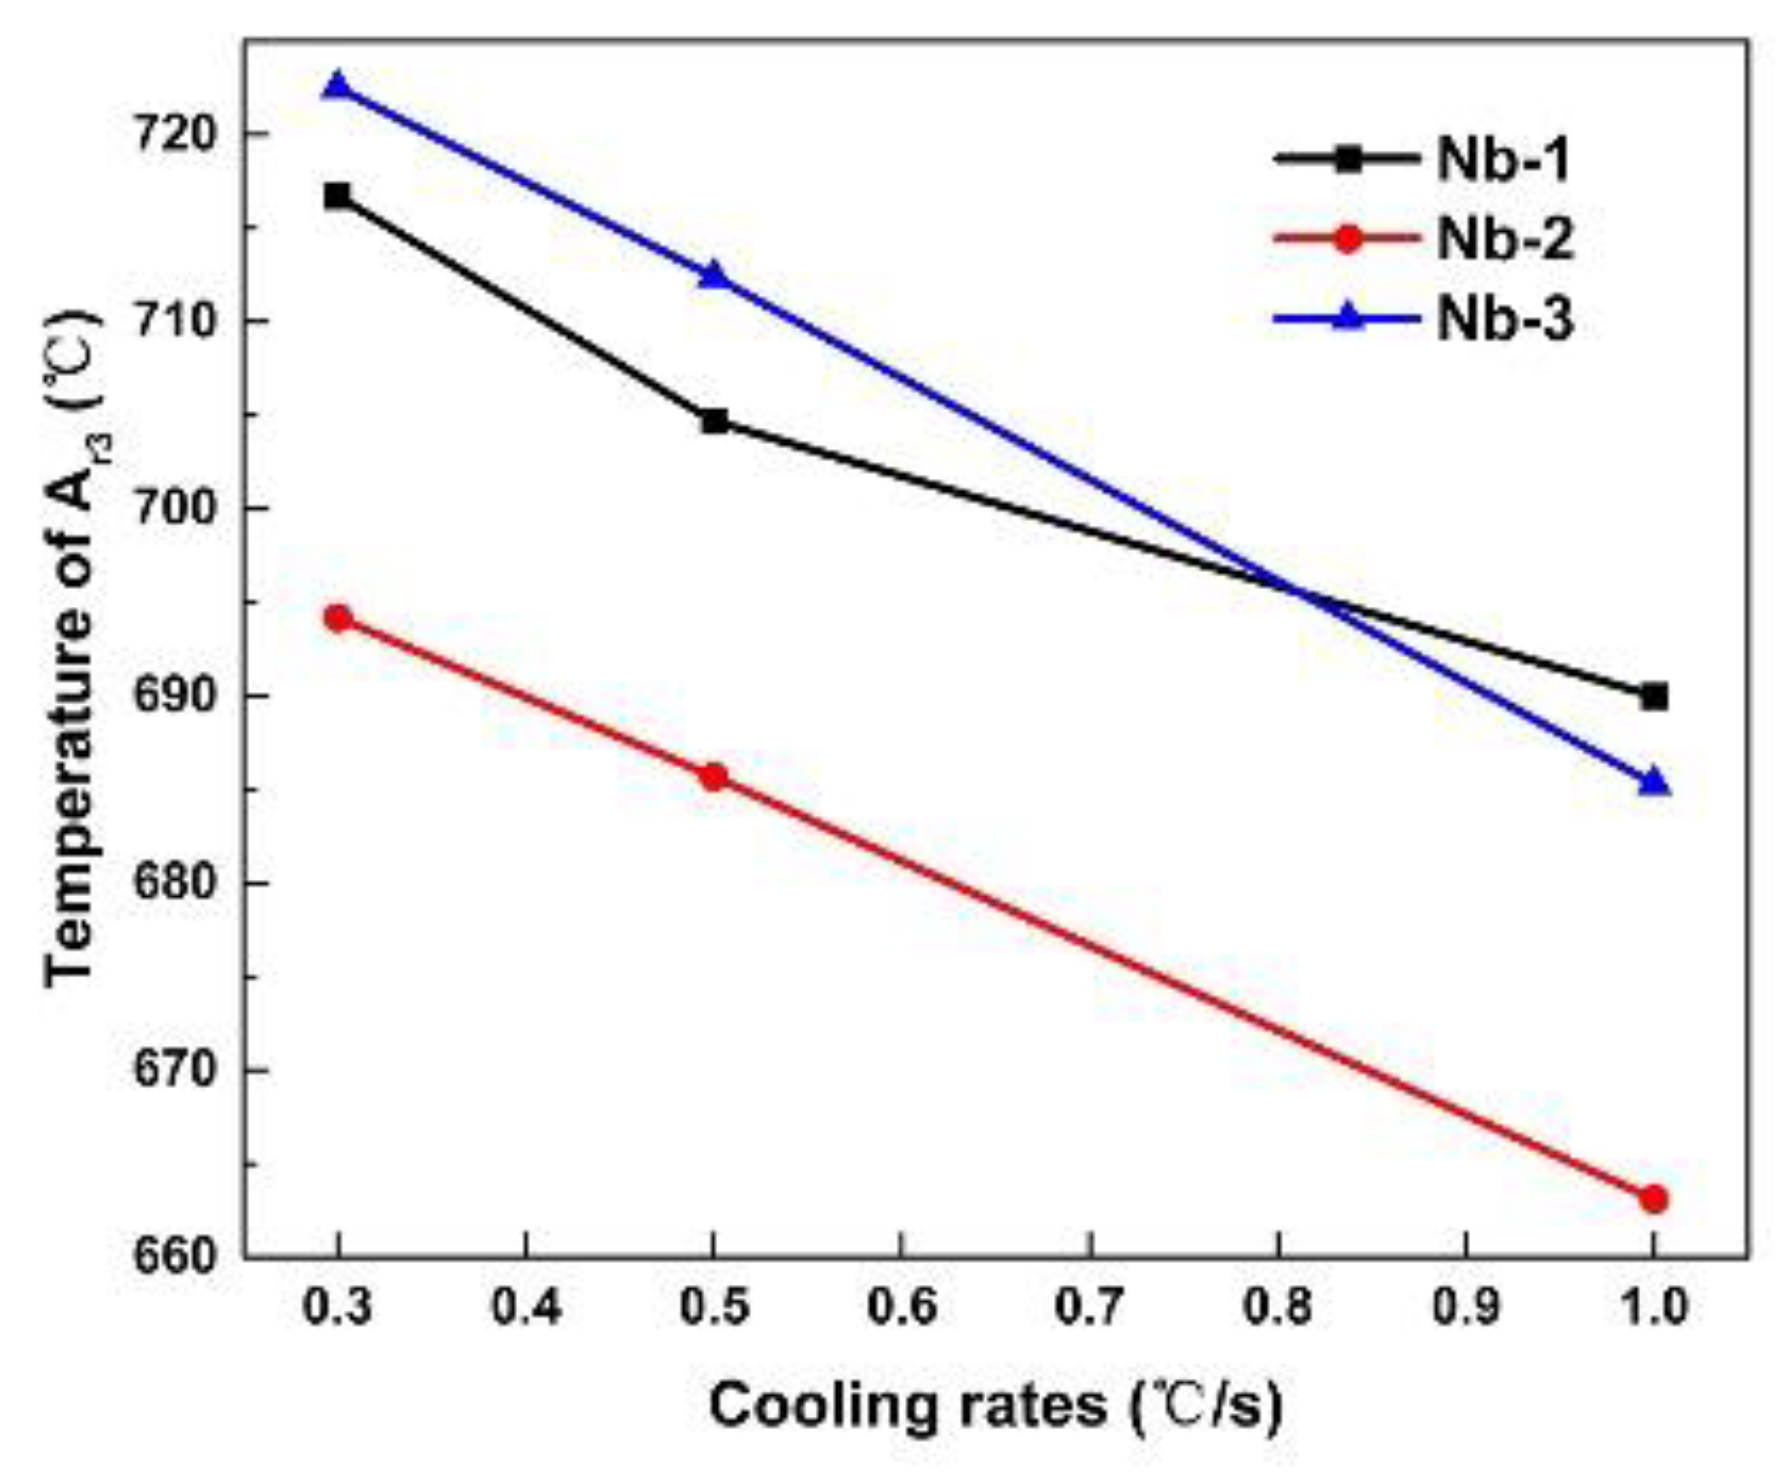
3.1. Dynamic CCT Diagrams
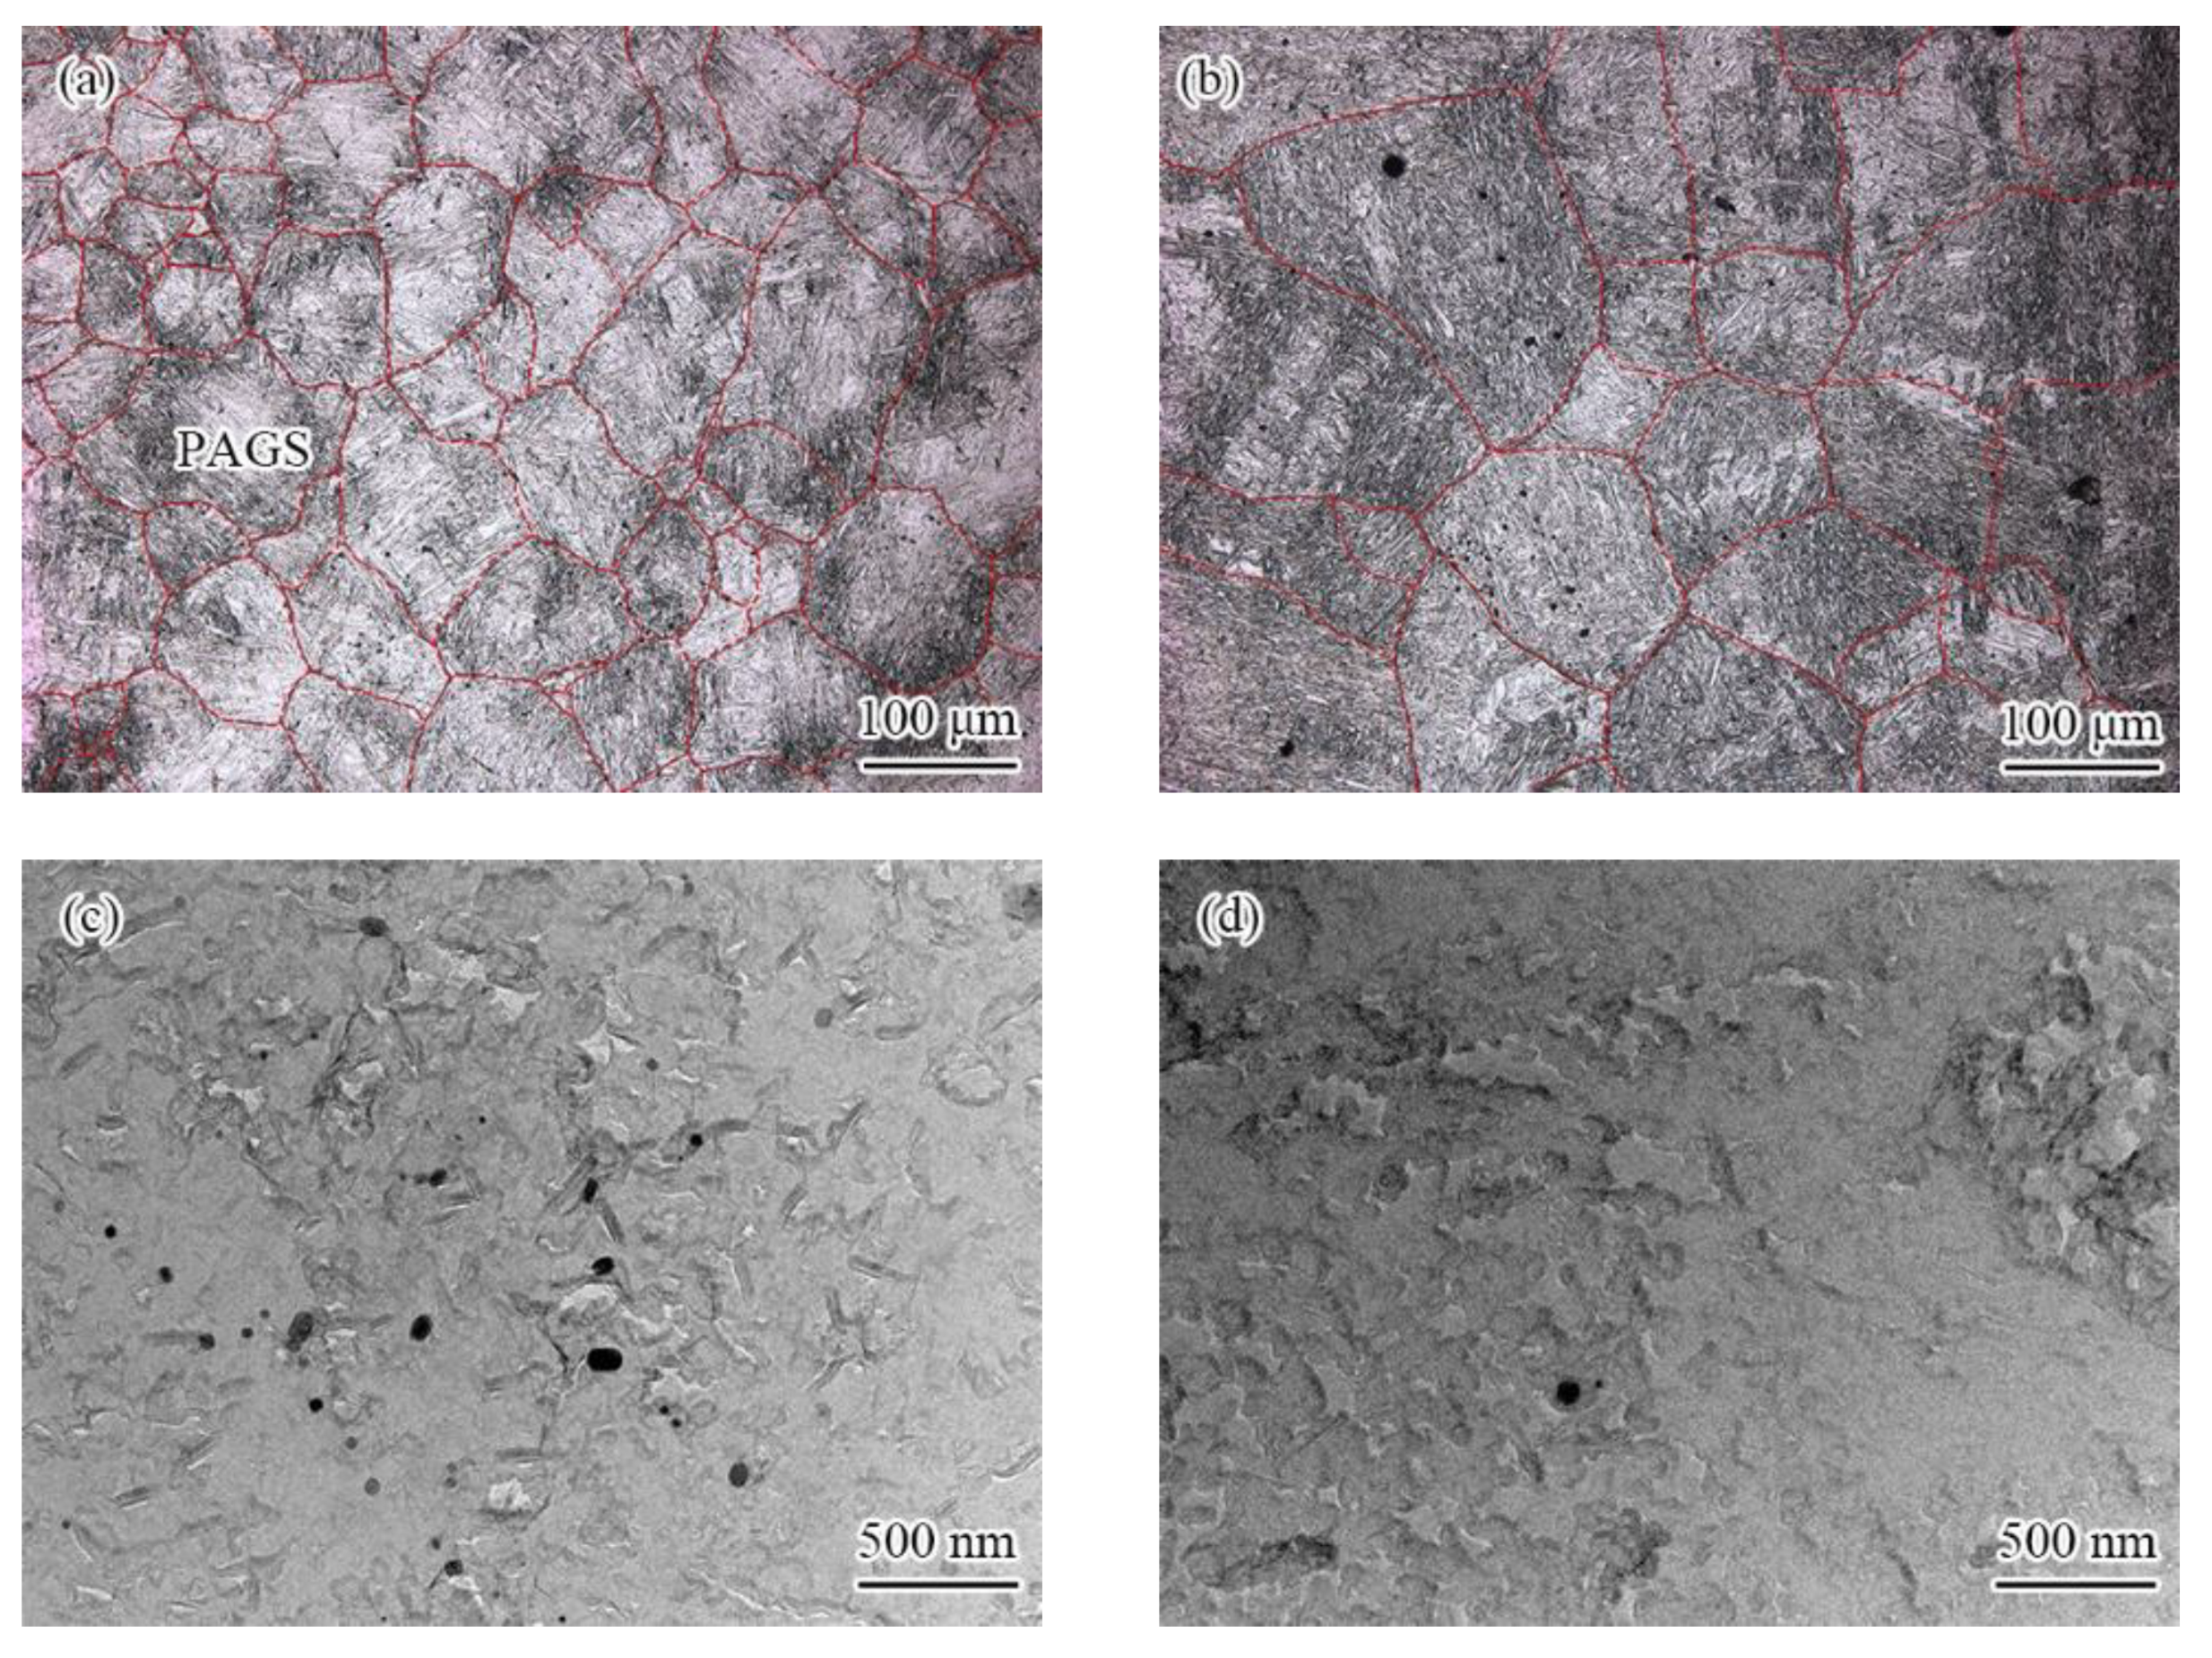
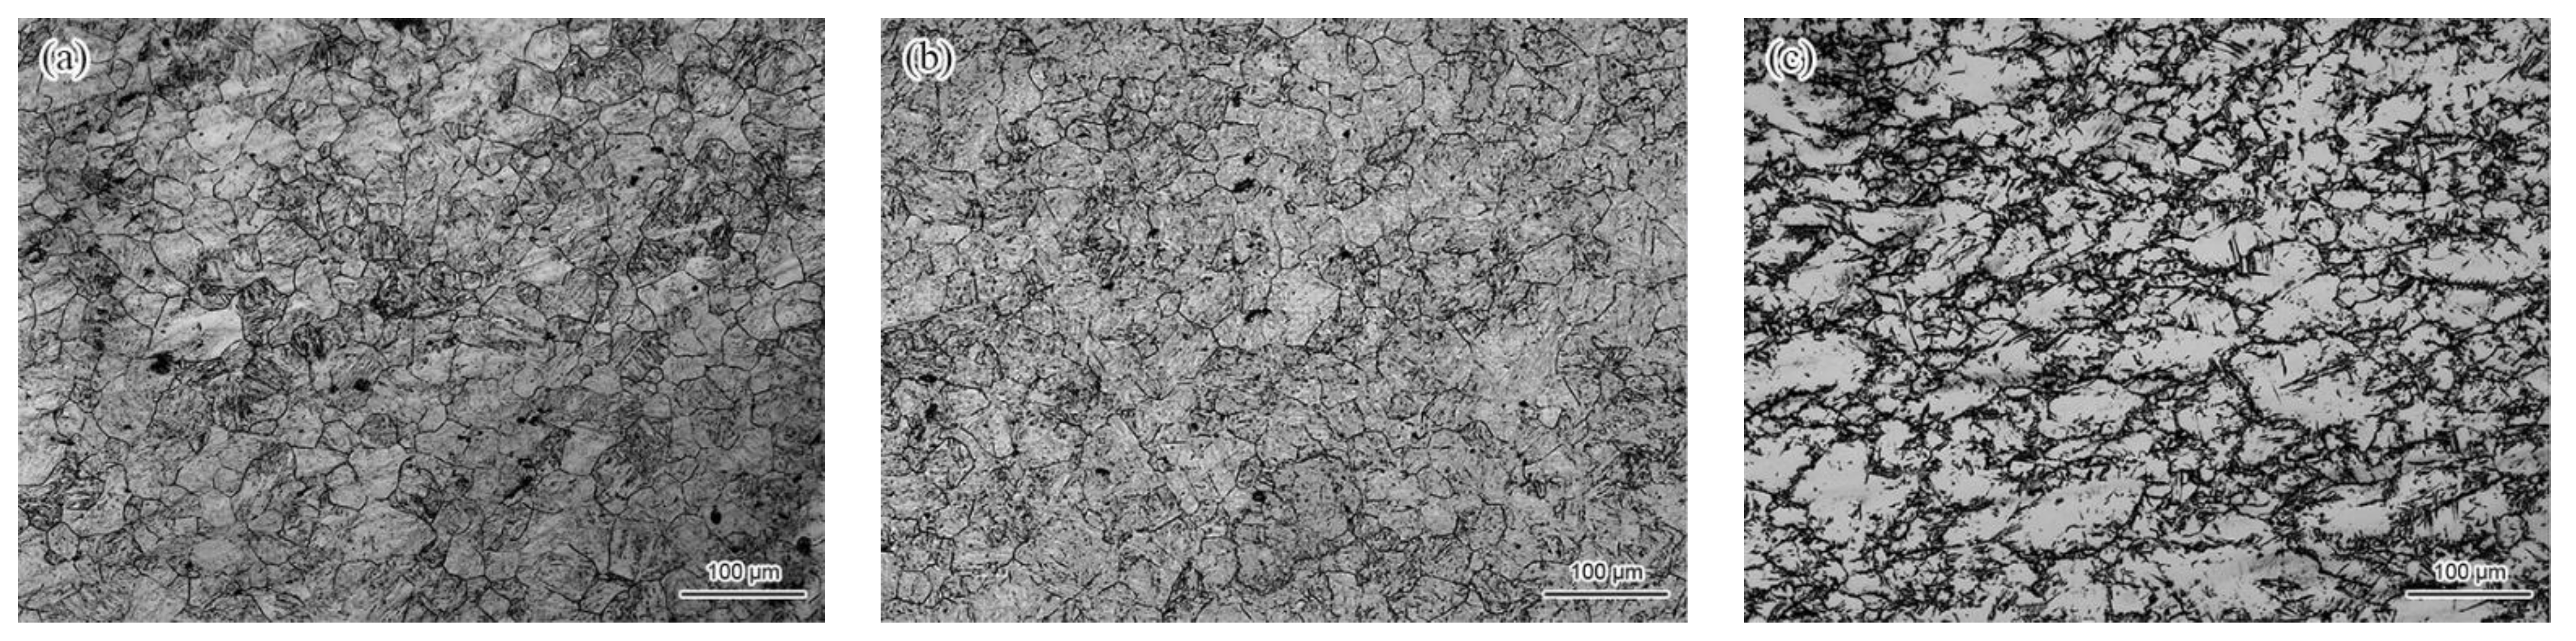
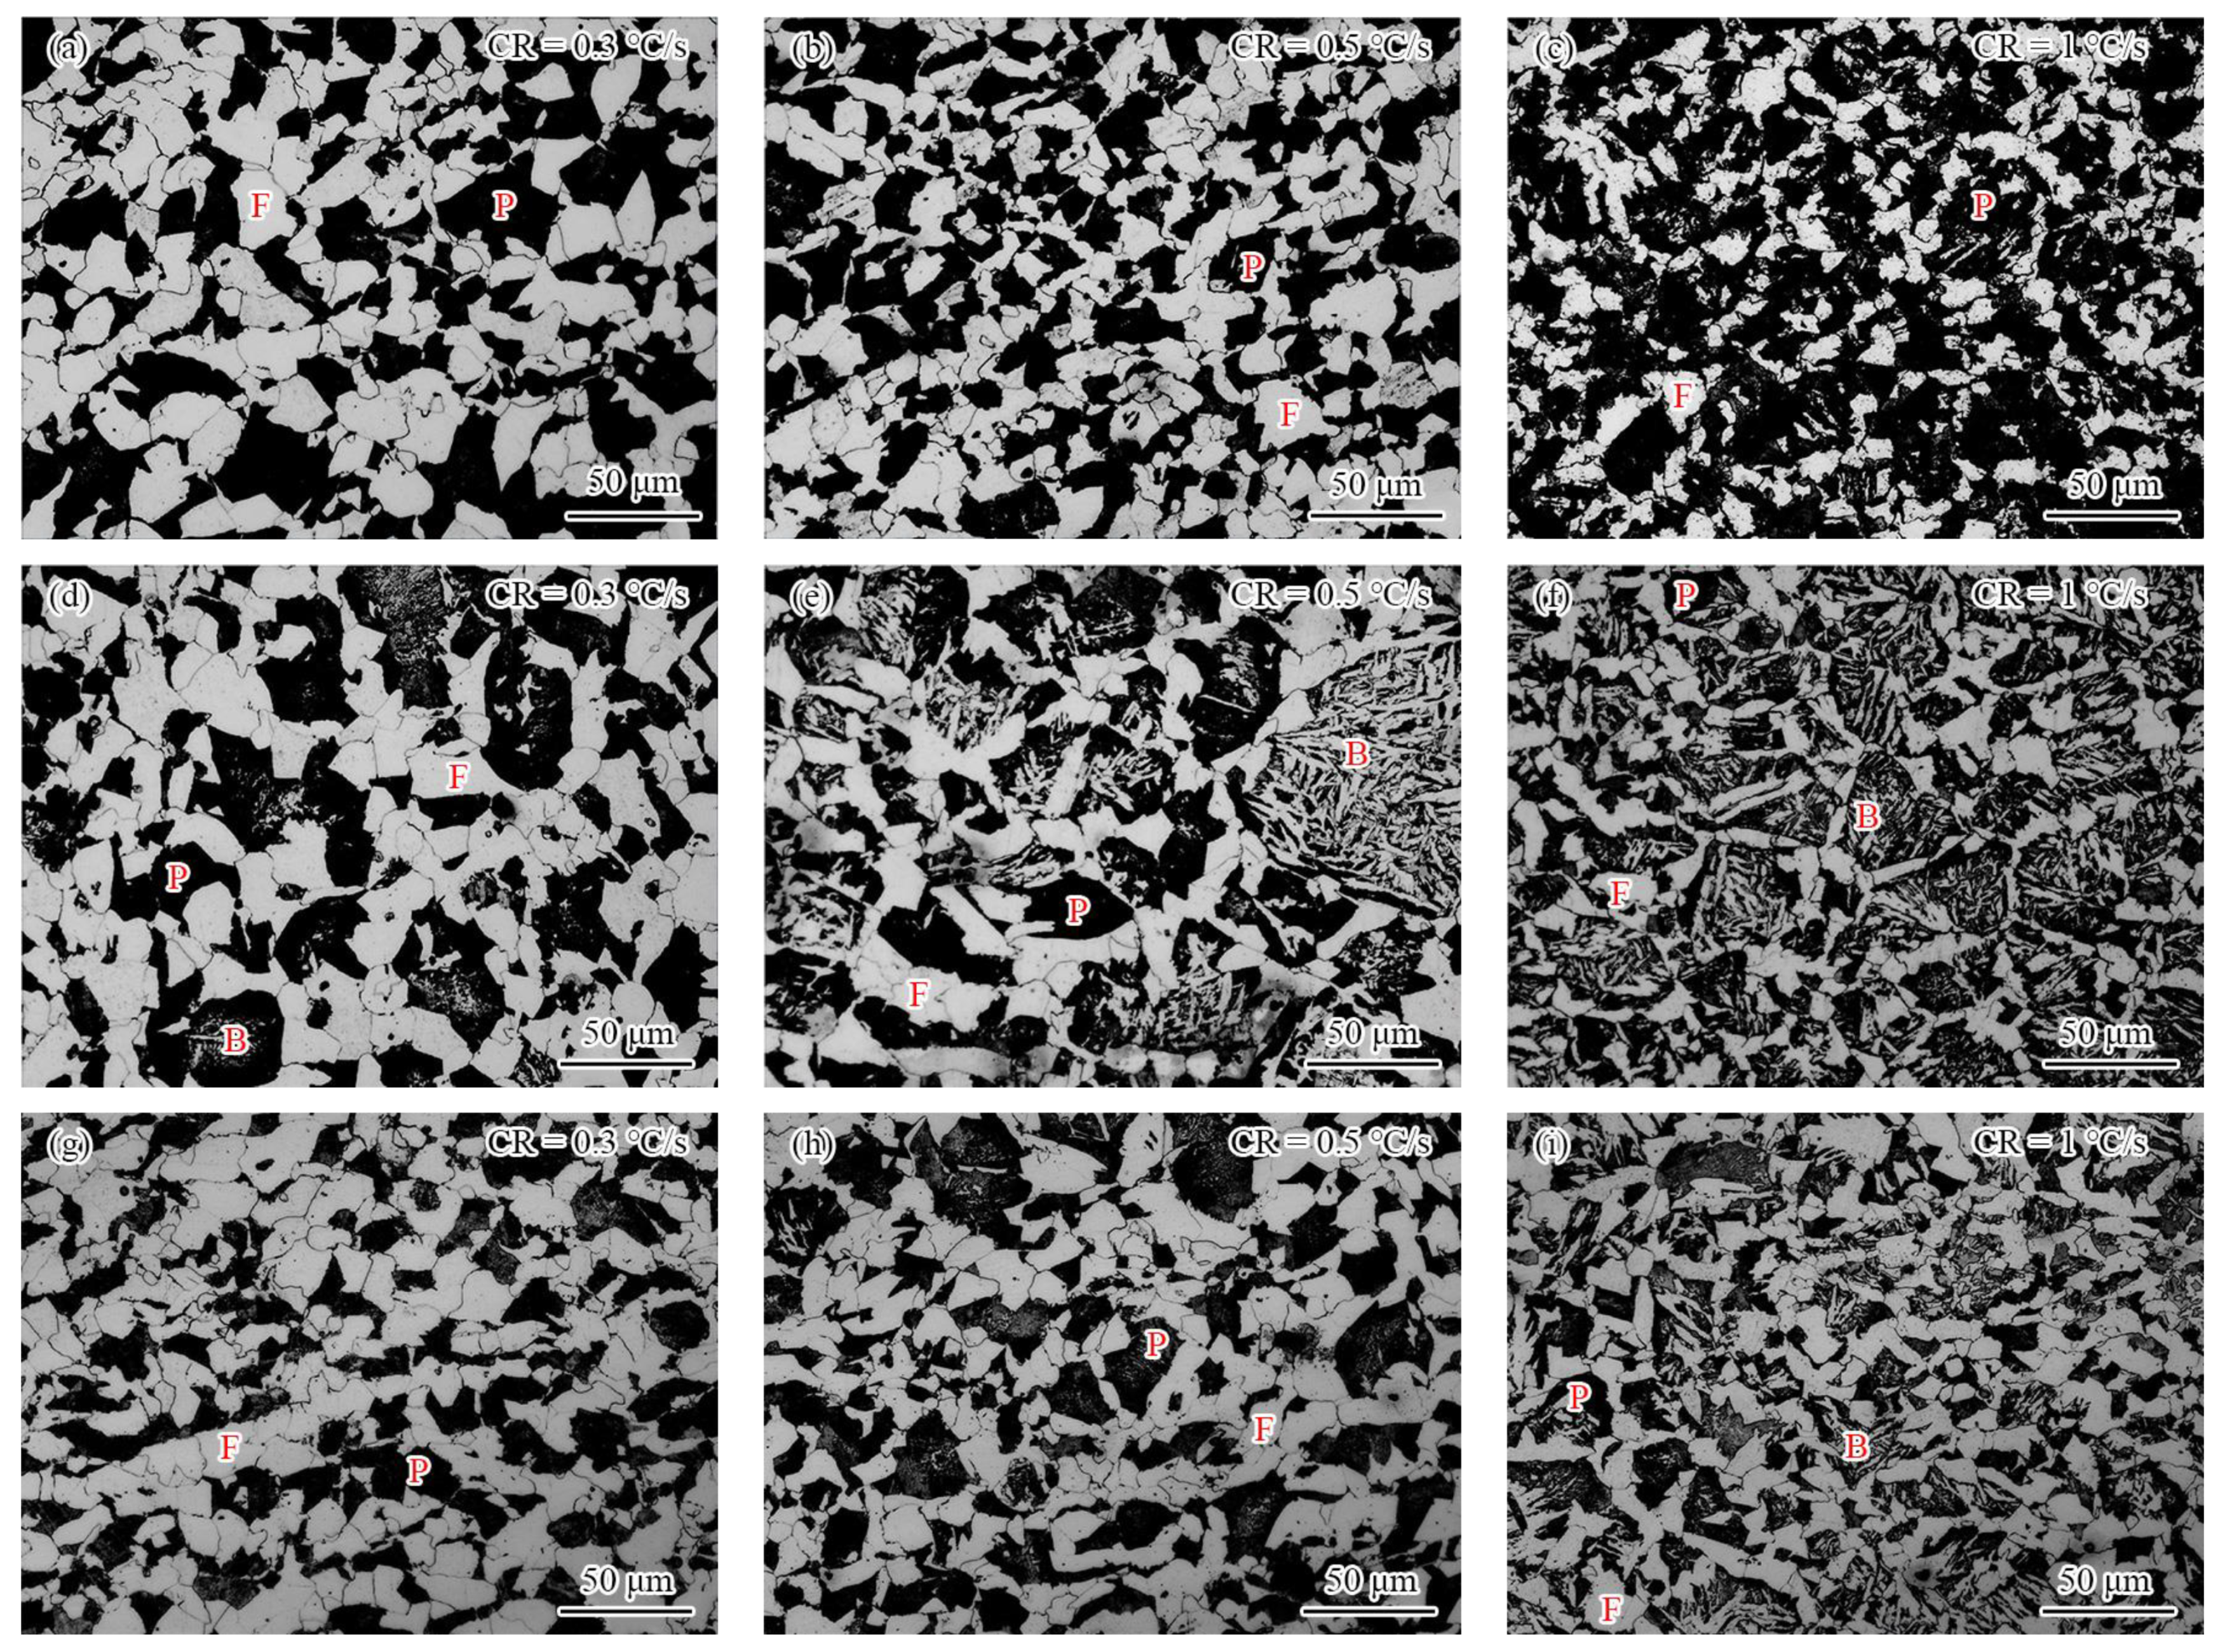
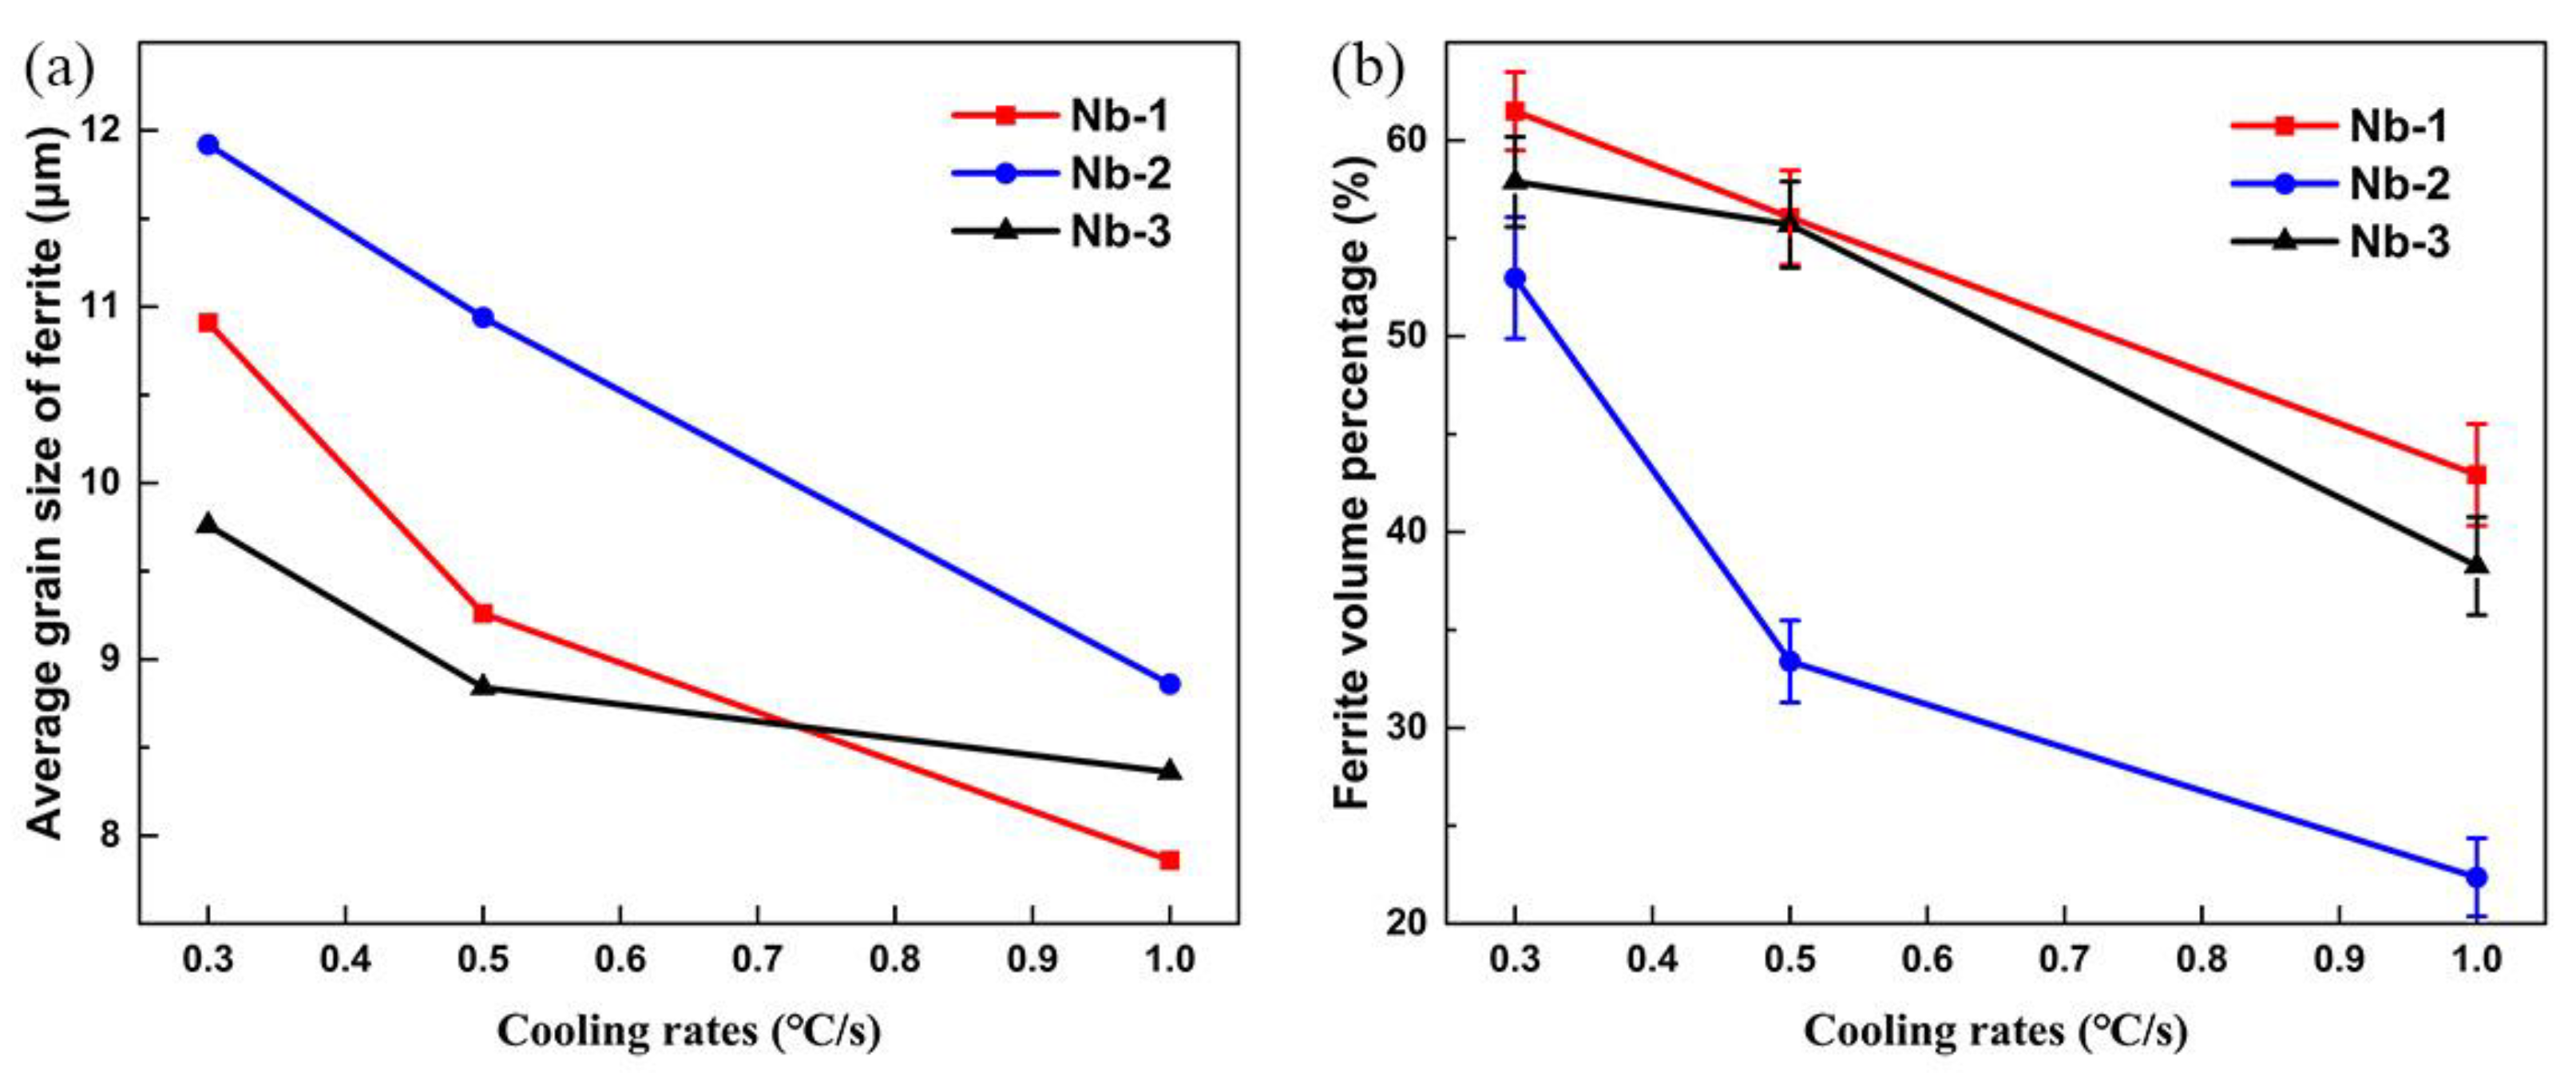
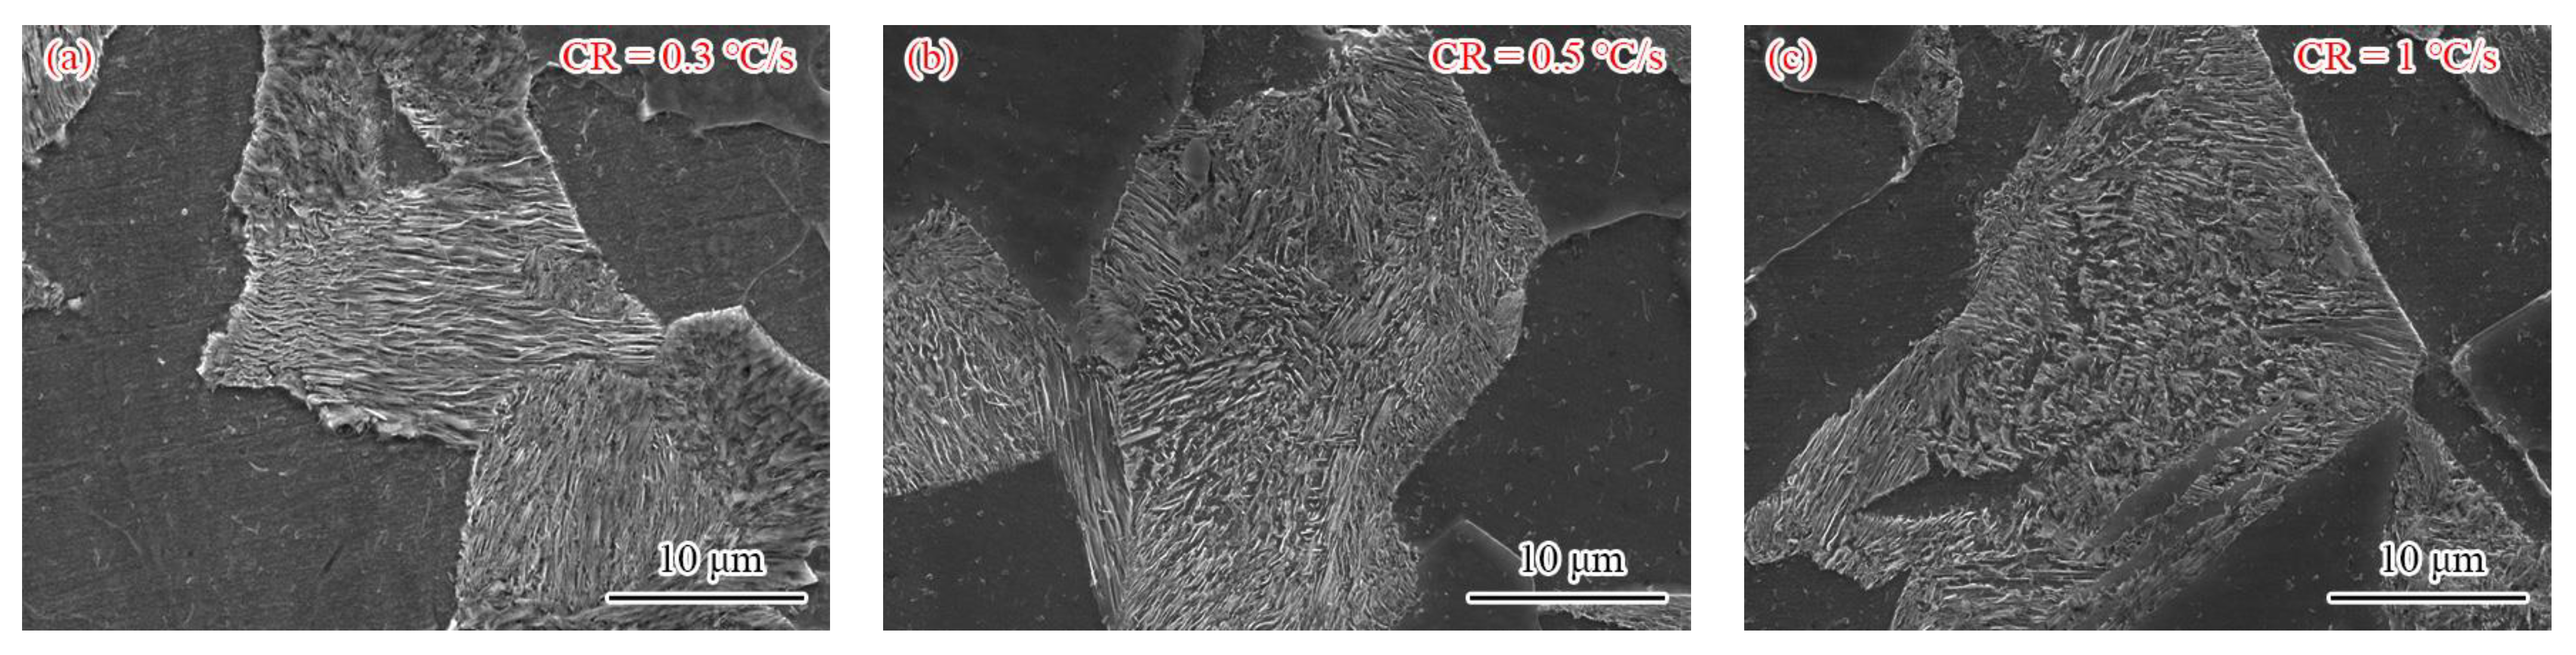
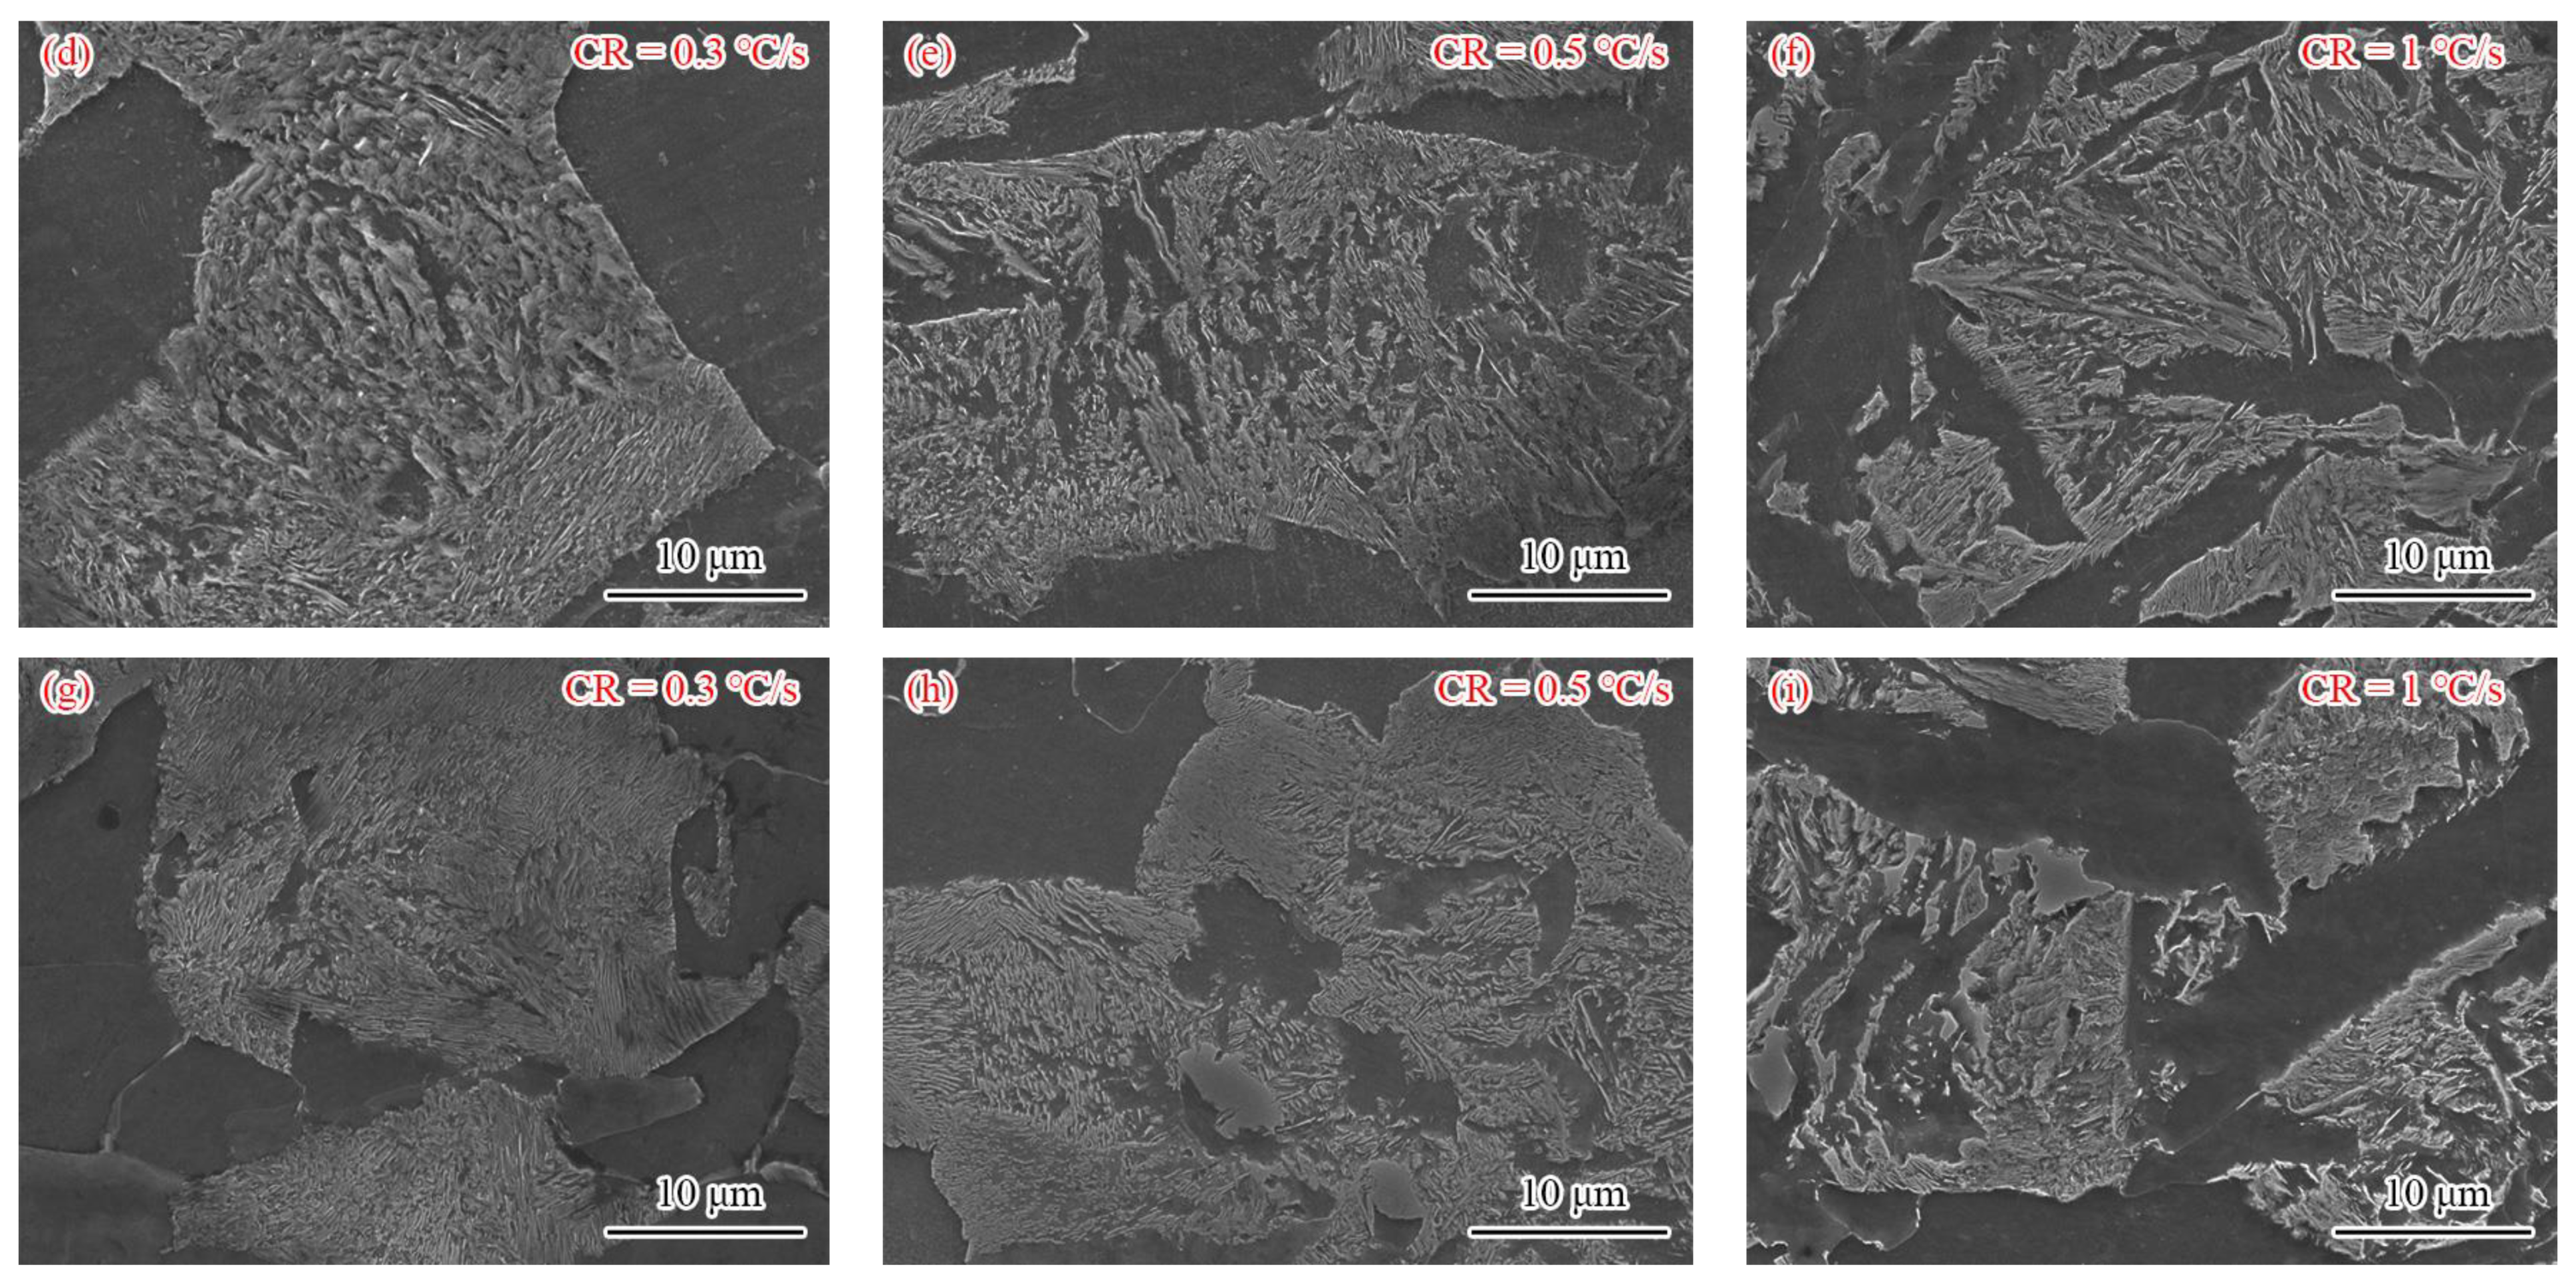
3.2. Microstructure
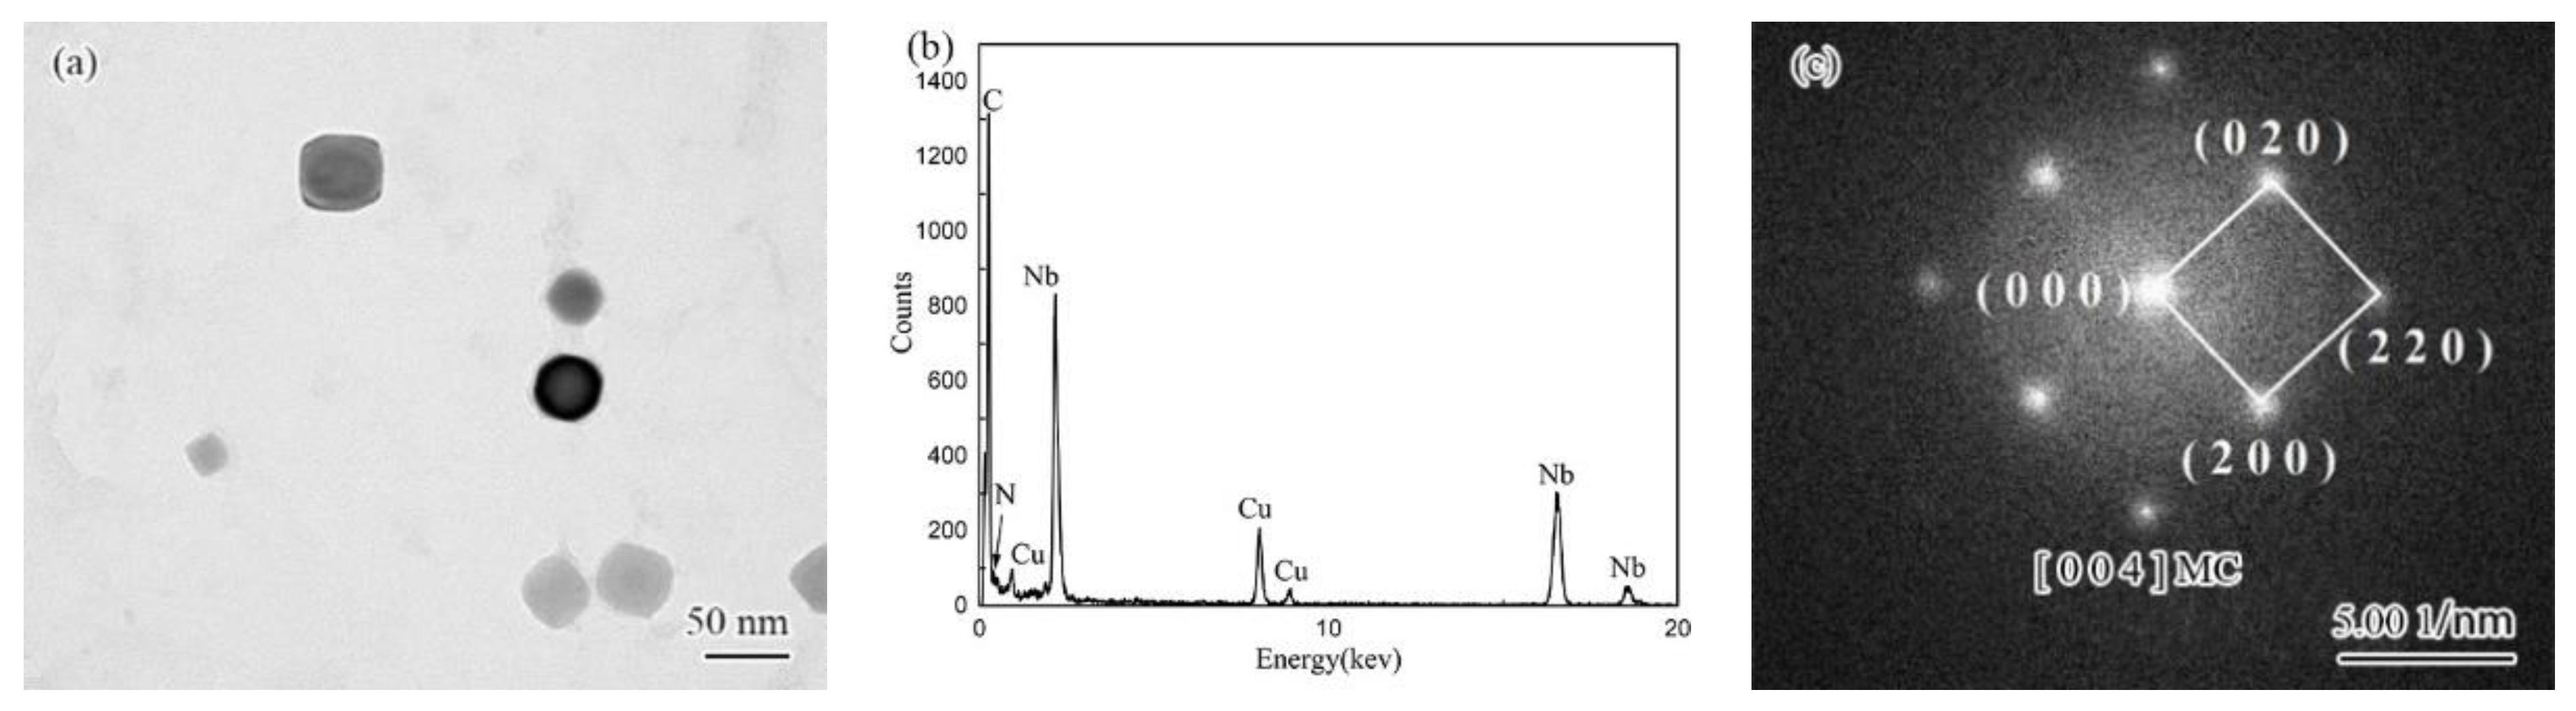
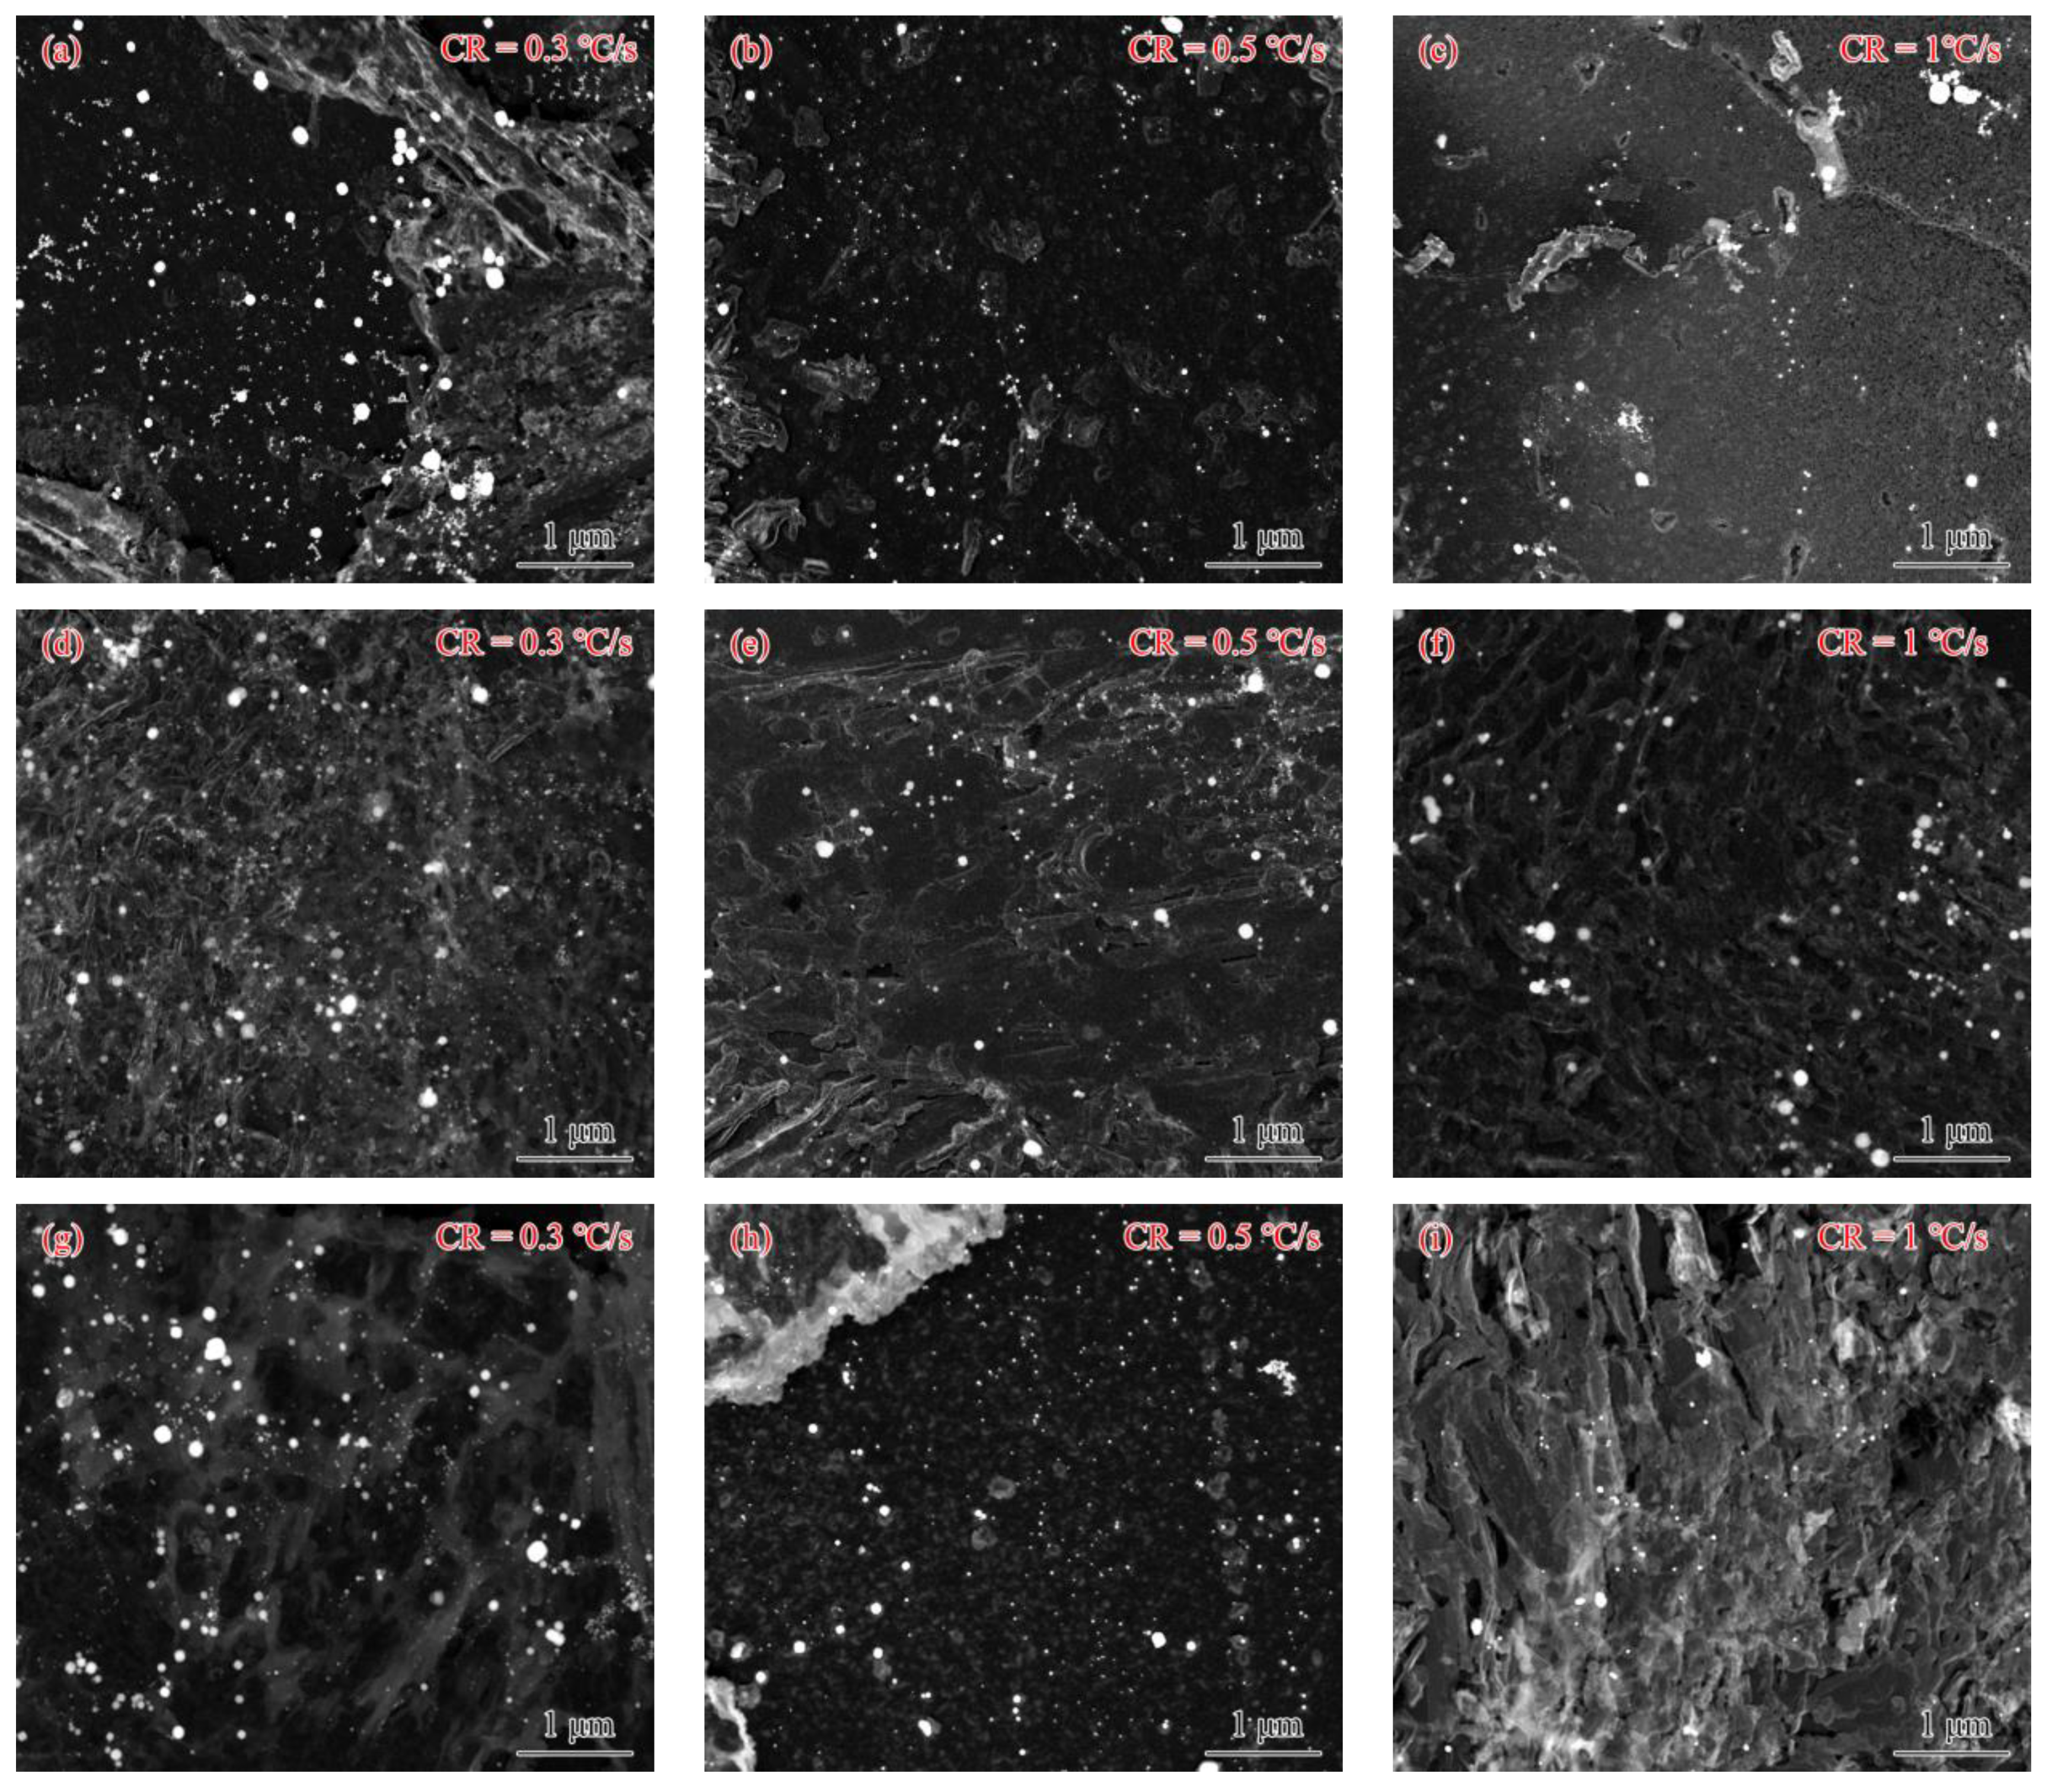
3.3. Precipitates
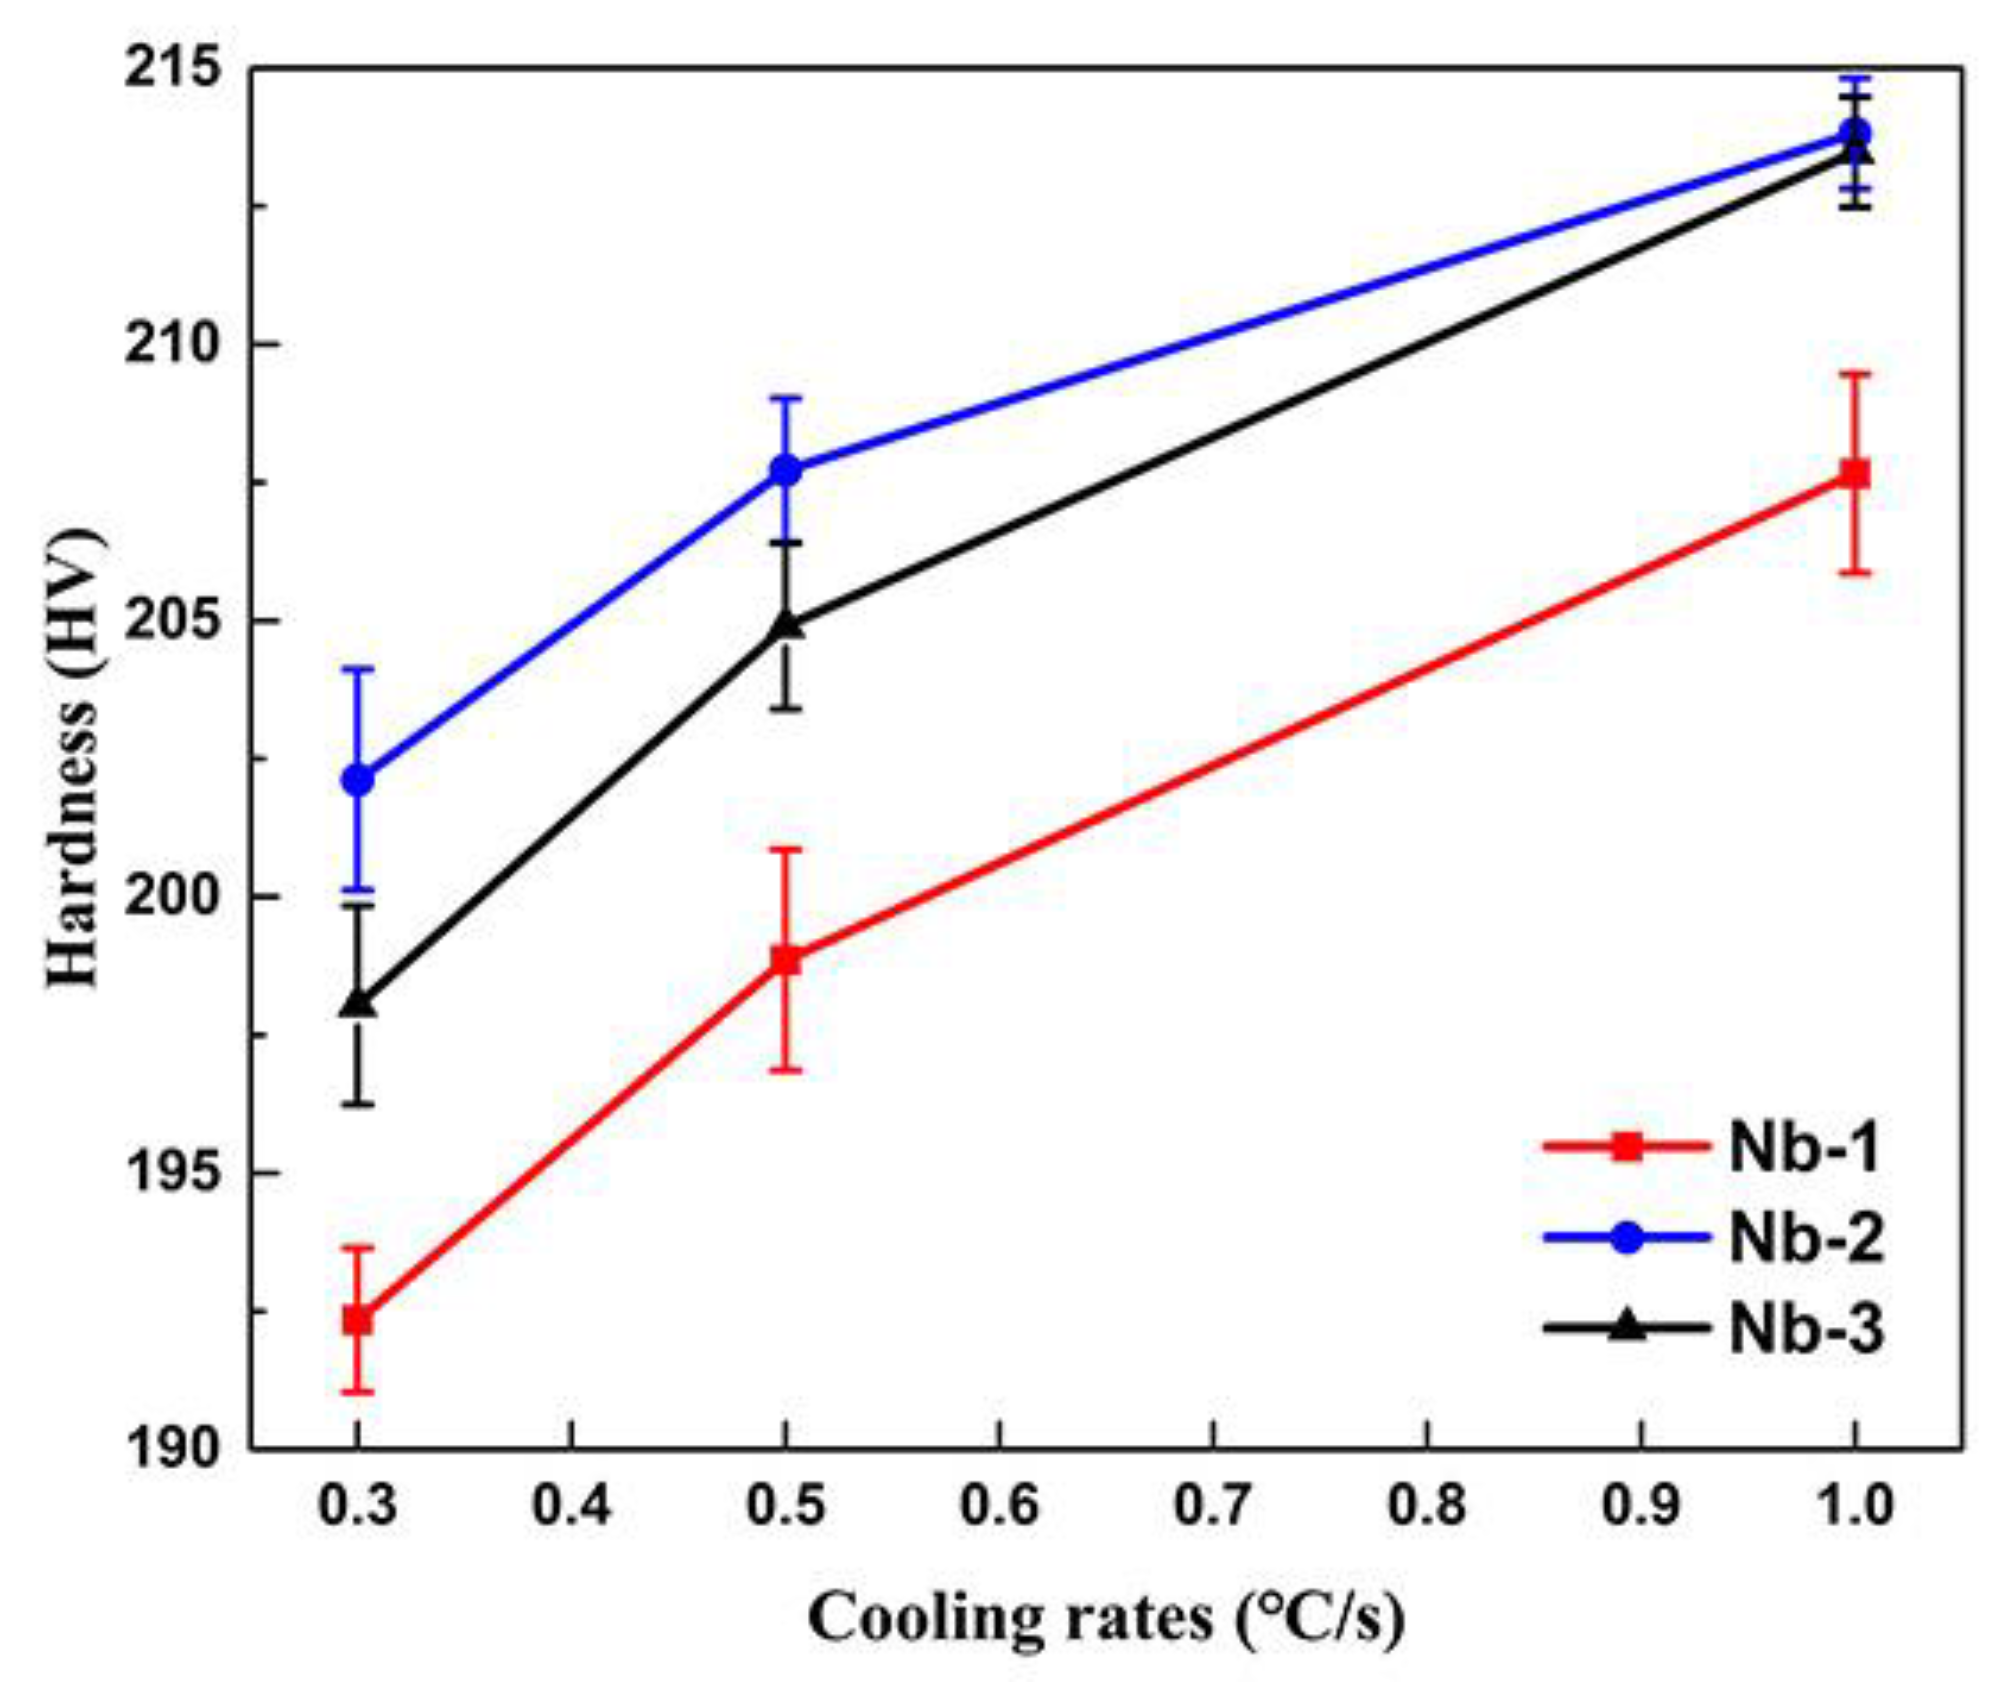
3.4. Hardness
4. Discussion
4.1. Effect of Nb Solid Solution and Precipitation on Austenite Microstructures
4.2. Effect of Nb Solid Solution, Precipitation and Austenite Grain on Phase Transformation
5. Conclusions
Author Contributions
Funding
Institutional Review Board Statement
Informed Consent Statement
Data Availability Statement
Acknowledgments
Conflicts of Interest
References
- Lu, P.Y.; Liu, Y.; Wu, H.J. Fatigue Performance of Microalloyed high-strength rebar and analysis of fracture mechanism. J. Iron Steel Res. Int. 2015, 22, 1149–1155. [Google Scholar] [CrossRef]
- Hui, Y.J.; Pan, H.; Liu, K.; Li, W.Y.; Yu, Y.; Chen, B.; Cui, Y. Strengthening mechanism of 600 MPa grade Nb-Ti microalloyed high formability crossbeam steel. Acta Metall. Sin. 2017, 53, 937–946. [Google Scholar]
- Yang, C.F.; Wang, Q. Research, Development, and Production of V-N Microalloyed High Strength Rebars for Building in China. J. Iron Steel Res. Int. 2008, 15, 81–86. [Google Scholar] [CrossRef]
- Lv, Y.K.; Zhao, X.R.; Shi, T.; Bai, L.; Liu, X.L.; Chen, J. Microstructure evolution of 400 MPa class rebar produced by QST and VNM technology under the high strain and low cycle fatigue. Constr. Build. Mater. 2019, 229, 116889. [Google Scholar] [CrossRef]
- Sheng, X.W.; Zheng, W.Q.; Y, Y. Tensile and high-cycle fatigue performance of HRB500 high-strength steel rebars joined by flash butt welding. Constr. Build. Mater. 2020, 241, 118037. [Google Scholar] [CrossRef]
- Cadoni, E.; Dotta, M.; Forni, D.; Tesio, N.; Albertini, C. Mechanical behaviour of quenched and self-tempered reinforcing steel in tension under high strain rate. Mater. Des. 2013, 49, 657–666. [Google Scholar]
- Zhao, J.W.; Jiang, Z.Y.; Lee, C.S. Enhancing impact fracture toughness and tensile properties of a microalloyed cast steel by hot forging and post-forging heat treatment processes. Mater. Des. 2013, 47, 227–233. [Google Scholar] [CrossRef]
- Musonda, V.; Akinlabi, E.T. Standard requirements of hot rolled thermo-mechanically treated reinforcement bars. Mater. Today. 2018, 5, 18593–18602. [Google Scholar] [CrossRef]
- Dhua, S.K.; Sarkar, P.P. Development of ultrafine grains in C–Mn steel plates through hot-rolling and air-cooling. Mater. Sci. Eng. A 2013, 575, 177–188. [Google Scholar] [CrossRef]
- Yang, W.Y.; Chen, Y.F.; Tao, Q.N.; Wang, D.X.; Zhang, H.B.; Wang, C.M. Analysis and control of abnormal band-like structure of 600 MPa seismic reinforcement steel rebar. J. Iron Steel Res. 2020, 32, 1014–1020. [Google Scholar]
- Nikolaou, J.; Papadimitriou, G.D. Impact toughness of reinforcing steels produced by (i) the tempcore process and (ii) microalloying with vanadium. Int. J. Impact Eng. 2005, 31, 1065–1080. [Google Scholar] [CrossRef]
- Cetinel, H.; Toparlh, M.; Özsoyeller, L. A finite element based prediction of the microstructural evolution of steels subjected to the Tempcore process. Mech. Mater. 2000, 32, 339–347. [Google Scholar] [CrossRef]
- Shanmugam, S.; Misra, R.D.K.; Mannering, T.; Panda, D.; Jansto, S.G. Impact toughness and microstructure relationship in niobium- and vanadium-microalloyed steels processed with varied cooling rates to similar yield strength. Mater. Sci. Eng. A. 2006, 437, 436–445. [Google Scholar] [CrossRef]
- Taca, M.; Constantinescu, D.M.; Baciu, F.; Geanta, V.; Daisa, D.; Stefanoiu, R. Influence of technological parameters on the toughness improvement of microalloyed steels. Mater. Today. 2016, 3, 1177–1182. [Google Scholar] [CrossRef]
- Lv, Y.K.; Sheng, G.M.; Huang, Z.H. High strain and low cycle fatigue behaviors of rebars produced by QST and V-N microalloying technology. Constr. Build. Mater. 2013, 48, 67–73. [Google Scholar] [CrossRef]
- Lv, Y.K.; Sheng, G.M.; Jiao, Y.J. Effect of V/N ratio on the high strain and low cycle fatigue behaviors of V–N microalloyed rebars. Constr. Build. Mater. 2014, 69, 18–25. [Google Scholar] [CrossRef]
- Fang, F.; Yong, Q.L.; Yang, C.F.; Su, H. A model for precipitation kinetics in Vanadium microalloyed Steel. J. Iron Steel Res. Int. 2010, 17, 36–42. [Google Scholar] [CrossRef]
- Huang, B.M.; Yen, H.W.; Ho, D.; Ho, H.; Yang, J.R. The influence of Widmanstätten ferrite on yielding behavior of Nb-containing reinforcing steel bars. Scr. Mater. 2012, 67, 431–434. [Google Scholar] [CrossRef]
- Ye, Y.P.; Yin, S.B.; Gao, P.; Zhang, Y.Q.; Chen, W.; Cao, J.C. Effect of soaking temperature on austenitization and solid solution of niobium in anti-seismic rebar. J. Iron Steel Res. 2019, 31, 830–836. [Google Scholar]
- Cao, J.C.; Ye, Y.P.; Yin, S.B.; Zhang, W.Q.; Chen, W.; Zhang, Y.Q. Deformed austenite continuous cooling transformation in Nb microalloyed anti-seismic rebar. Iron Steel. 2019, 54, 81–88. [Google Scholar]
- Zeng, Z.Y.; Li, C.G.; Li, Z.Y.; Zhai, Y.L.; Wang, J.; Li, Z.S. Effect of Nb content and thermal deformation on the microstructure and mechanical properties of high-strength anti-seismic rebar. Mater. Sci. Eng. A. 2022, 840, 142929. [Google Scholar] [CrossRef]
- Chen, W.; Shi, Z.; Wang, T.; Liu, H.B.; Zhang, W.Q. The reason analysis and control of lower elongation for HRB500 high-strength and anti-seismic rebars. Mater. Rev. 2010, 24, 56–59. [Google Scholar]
- Yong, Q.L.; Pei, H.Z.; Tian, J.G.; Zhou, X.L.; Pan, L.; Yang, W.Y. Physico-metallurgical data of Niobium in steel. J. Iron Steel Res. 1998, 10, 66–69. [Google Scholar]
- Yong, Q.L. Second Phase in Steel Materials; Metallurgical Industry Press: Beijing, China, 2006; p. 357. [Google Scholar]
- Xu, Z.Y. Effect of stress on bainitic transformation in steel. Acta Metall. Sin. 2004, 40, 113–119. [Google Scholar]
- Pavlina, E.J.; Van Tyne, C.J. Correlation of yield strength and tensile strength with hardness for steels. J. Mater. Eng. Perform. 2008, 17, 888–893. [Google Scholar] [CrossRef]
- Maruyama, N.; Smith, G.D.W. Effect of nitrogen and carbon on the early stage of austenite recrystallisation in iron-niobium alloys. Mater. Sci. Eng. A. 2002, 327, 34–39. [Google Scholar] [CrossRef]
- Zhang, Z.Y.; Sun, X.J.; Yong, Q.L.; Li, Z.D.; Wang, Z.Q.; Wang, G.D. Precipitation behavior of nanometer-size carbides in Nb-Mo microalloyed high strength steel and its strengthening mechanism. Acta Metall. Sin. 2016, 52, 410–418. [Google Scholar]
- Huang, M.; Cao, J.C.; Chen, W.; Zhou, X.L.; Yang, Y.H.; Zhong, Z.H. Effects of deformation conditions on dynamic recrystallization of a Nb microalloyed anti-seismic rebar. J. Donghua Uni. (Eng. Ed.) 2015, 32, 879–886. [Google Scholar]
- Dong, H.K.; Zhang, Y.J.; Miyamoto, G.; Inomoto, M.; Chen, H.; Yang, Z.G.; Furuhara, T. Unraveling the effects of Nb interface segregation on ferrite transformation kinetics in low carbon steels. Acta Mater. 2021, 215, 117081. [Google Scholar] [CrossRef]
- He, X.L.; Yang, G.W.; Mao, X.P.; Yu, C.B.; Da, C.L.; Gan, X.L. Effect of Nb on the continuous cooling transformation rule and microstructure, mechanical properties of Ti-Mo bearing microalloyed steel. Acta Metall. Sin. 2017, 53, 648–656. [Google Scholar]
- Hull, F.C.; Colton, R.A.; Mehl, R.F. Rate of nucleation and rate of growth of pearlite. Trans. AIME. 1942, 50, 185. [Google Scholar]
- Li, L.; Ding, H.; Yang, C.Z.; Du, L.X.; Liu, X.H.; Wang, G.D.; Song, H.M. Effect of controlled rolling and controlled on microstructure and mechanical properties of low carbon steel microalloyed with Nb. J. Iron Steel Res. 2006, 18, 46–51. [Google Scholar]


Publisher’s Note: MDPI stays neutral with regard to jurisdictional claims in published maps and institutional affiliations. |
© 2022 by the authors. Licensee MDPI, Basel, Switzerland. This article is an open access article distributed under the terms and conditions of the Creative Commons Attribution (CC BY) license (https://creativecommons.org/licenses/by/4.0/).
Share and Cite
Liu, X.; Cao, J.; Chen, W.; Zhang, W.; Zhang, Y.; Yin, S.; Guo, A. Post-Rolling Cooling Phase Transformation and Microstructure of High-Strength Anti-Seismic Rebars with Different Solute Nb and Austenite Microstructure. Metals 2022, 12, 1734. https://doi.org/10.3390/met12101734
Liu X, Cao J, Chen W, Zhang W, Zhang Y, Yin S, Guo A. Post-Rolling Cooling Phase Transformation and Microstructure of High-Strength Anti-Seismic Rebars with Different Solute Nb and Austenite Microstructure. Metals. 2022; 12(10):1734. https://doi.org/10.3390/met12101734
Chicago/Turabian StyleLiu, Xing, Jianchun Cao, Wei Chen, Weiqiang Zhang, Yongqing Zhang, Shubiao Yin, and Aimin Guo. 2022. "Post-Rolling Cooling Phase Transformation and Microstructure of High-Strength Anti-Seismic Rebars with Different Solute Nb and Austenite Microstructure" Metals 12, no. 10: 1734. https://doi.org/10.3390/met12101734
APA StyleLiu, X., Cao, J., Chen, W., Zhang, W., Zhang, Y., Yin, S., & Guo, A. (2022). Post-Rolling Cooling Phase Transformation and Microstructure of High-Strength Anti-Seismic Rebars with Different Solute Nb and Austenite Microstructure. Metals, 12(10), 1734. https://doi.org/10.3390/met12101734