Article

Research on an Ultrasonic Longitudinal Critically Refracted Wave Detection Method for the Depth Distribution of Stress

Key Laboratory of Fundamental Science for Advanced Machining, Beijing Institute of Technology, Beijing 100081, China
*
Author to whom correspondence should be addressed.
Metals 2022, 12(10), 1602; https://doi.org/10.3390/met12101602
Submission received: 18 August 2022 / Revised: 19 September 2022 / Accepted: 23 September 2022 / Published: 26 September 2022

Abstract

:
Aluminum alloy components typically have structural characteristics such as large size and complex shape, making the in situ non-destructive detection of internal residual stress in these structures a challenge that the manufacturing sector has tried to solve. Ultrasonic longitudinal critically refracted (LCR) waves have shown good sensitivity to normal stress in the horizontal direction and could be used to detect the distribution of internal residual stress in components, offering an advantage not shared by other detection methods. In this study, we investigated the propagation mode of LCR waves in a 2A14 aluminum alloy component and established the characterization model of the average normal stress of LCR waves in different depth ranges. The blocking effect of LCR waves by a groove with a depth equal to twice the wavelength was analyzed and experimentally verified using a machined aluminum alloy test specimen. Then, the propagation depths of LCR waves in the aluminum alloy at different frequencies were determined. A load test on a cantilever beam based on the stress depth distribution model was designed, and the stress characterization model and LCR waves’ propagation depth were further verified by the self-developed LCR wave stress detection system. The test results showed that the LCR wave could accurately detect the depth distribution of stress and could serve as a useful tool for evaluating the depth distribution of normal stress inside aluminum alloy components.

1. Introduction

Aluminum alloy components have many desirable properties such as being lightweight and having high specific strength and good thermal conductivity; hence, they are widely used in the aerospace industry [1,2]. Aluminum alloy machining residual stress is an important factor affecting machining accuracy and fatigue life [3,4]. Therefore, in situ non-destructive testing of internal residual stress in parts is a challenging problem that the aerospace manufacturing industry tries to solve. Currently, mature destructive residual stress detection methods mainly include the blind-hole drilling and crack compliance methods [5,6], which cannot be applied to finished aluminum alloy components, while the non-destructive X-ray diffraction method does not meet the detection requirements of internal residual stresses of aluminum alloy components [7,8]. Ultrasound offers good penetrability in metallic aluminum alloy materials [9,10], and especially longitudinal waves have been shown to be very sensitive to the macroscopic residual stresses inside the component and are less sensitive to material microstructure [11]. By using a physical relationship between the speed of sound and stress in the acousto-elasticity, Pei [12] numerically simulated the acoustic emission effect in a prestressed material and assessed the possibility of using longitudinal critically refracted (LCR) waves to detect the residual stress state inside a component. Ramasamy [13] evaluated the feasibility of detecting the internal stresses of carbon steel using LCR waves through explicit finite element numerical simulations. Javadi [14,15] studied the ultrasonic detection of residual stresses in welded stainless steel components and found good agreement compared to the finite element simulation results. Therefore, when compared to other inspection methods, the ultrasonic method is shown to be more suitable for finished parts or processed components. Currently, the ultrasonic method has gradually replaced the X-ray method as the main method for detecting residual stresses in additive manufacturing [16,17,18].
Because ultrasonic waves were shown to be quite sensitive to detection factors and their measurement accuracy is affected to varying degrees by factors such as the surface roughness of the part under testing, temperature changes, and the grain size of the component under measurements, more in-depth research is needed. Zhu [19] experimentally obtained a relationship between the internal stress and ultrasonic propagation time in steel, provided the acousto-elastic coefficient of Q345, and investigated the influence of the coupling layer thickness and temperature on residual stress measurements. Mohammadi et al. [20] used LCR waves for ultrasonic stress detection and measured the acousto-elastic coefficients at different spacings. The results showed that the ultrasonic measurements of the macroscopic residual stresses had the highest detection accuracy at a spacing of 30 mm. Liu et al. [21] carried out a numerical analysis on the sensitivity of temperature changes and coupling conditions and reached an experimental measurement error value of ±20 MPa after improving the coupling conditions. This elevated the practicability of ultrasonic stress detection. Li et al. [22] measured the planar anisotropy constant of LCR waves in rolled aluminum plate, and the results showed that the LCR wave of the aluminum plate was laterally symmetrical in the surface layer and was orthogonally asymmetrical at the mid-plane, which provided supporting evidence of the effectiveness of in-depth ultrasonic propagation. Liu et al. [23] experimentally obtained the microstructure correction for LCR wave detection of welding residual stress and observed in the experiments that elastoplastic inhomogeneity due to the anisotropic microstructure and dimensional stress in the thickness direction caused the errors in the welding residual stress measurements.
However, the depth distribution detection of residual stress in the components by LCR waves still awaits further investigation. Guz’F et al. [10] made preliminary calculations for the relationship between the propagation depth of LCR waves and frequency and provided an initial estimate of the propagation depth of different frequencies. Javadi [24,25,26] investigated the in-principle feasibility of LCR wave detection for welding residual stress and found that the detection results were consistent with the simulation analysis. Based on the stress distribution detected at different frequencies, the researchers further predicted the existence of a preliminary relationship between the depth range of ultrasonic detection for residual stress and frequency. Song [27] developed a simplified model for the uniform distribution of residual stresses within the material and studied a mathematical model of internal stress changes and ultrasonic propagation time for a fixed transmit-receive distance of 30 mm and established an ultrasonic propagation depth model in steel. Sadeghi [28] used the longitudinal ultrasonic waves of different frequencies to perform depth measurements of residual stresses on a friction-stir-welded aluminum plate and the obtained results were also in agreement with the finite element simulation model. Liu [29] simulated the propagation mode of LCR waves of different frequencies in steel and obtained an approximate ultrasound propagation depth range in steel. Pei N [30] compared numerous parameters for generating critically refracted longitudinal waves, such as transducer frequency, transducer diameter, and incidence angle, to demonstrate the effect of frequency on the depth of LCR wave propagation and to optimize the system parameters required to generate LCR waves.
Even though a large number of experiments proved that LCR waves of different frequencies can detect stress at different depths, there is still a lack of accurate analysis of the dependence between detection depth and frequency. The purpose of this study is to study the corresponding relationship between the detection stress range of LCR waves at different frequencies and the stress distribution at different depths in aluminum alloys. The propagation behavior of a multi-frequency LCR wave in aluminum alloy is studied by simulation, and aluminum alloy test blocks with grooves of different depths were designed. Due to the influence of different-depth grooves on the ultrasonic propagation time [29], in order to avoid analysis errors, this study selects the attenuation degree of the displacement signal amplitude at the receiving end as a reference. According to the internal stress distribution state of components, an ultrasonic stress depth distribution detection model is proposed, a load model for a simply supported beam is designed, and a loading test was designed for verification, which provided a theoretical basis for LCR to detect the normal stress of aluminum alloy members at different depths.

2. Principle of Stress Measurement by LCR Waves

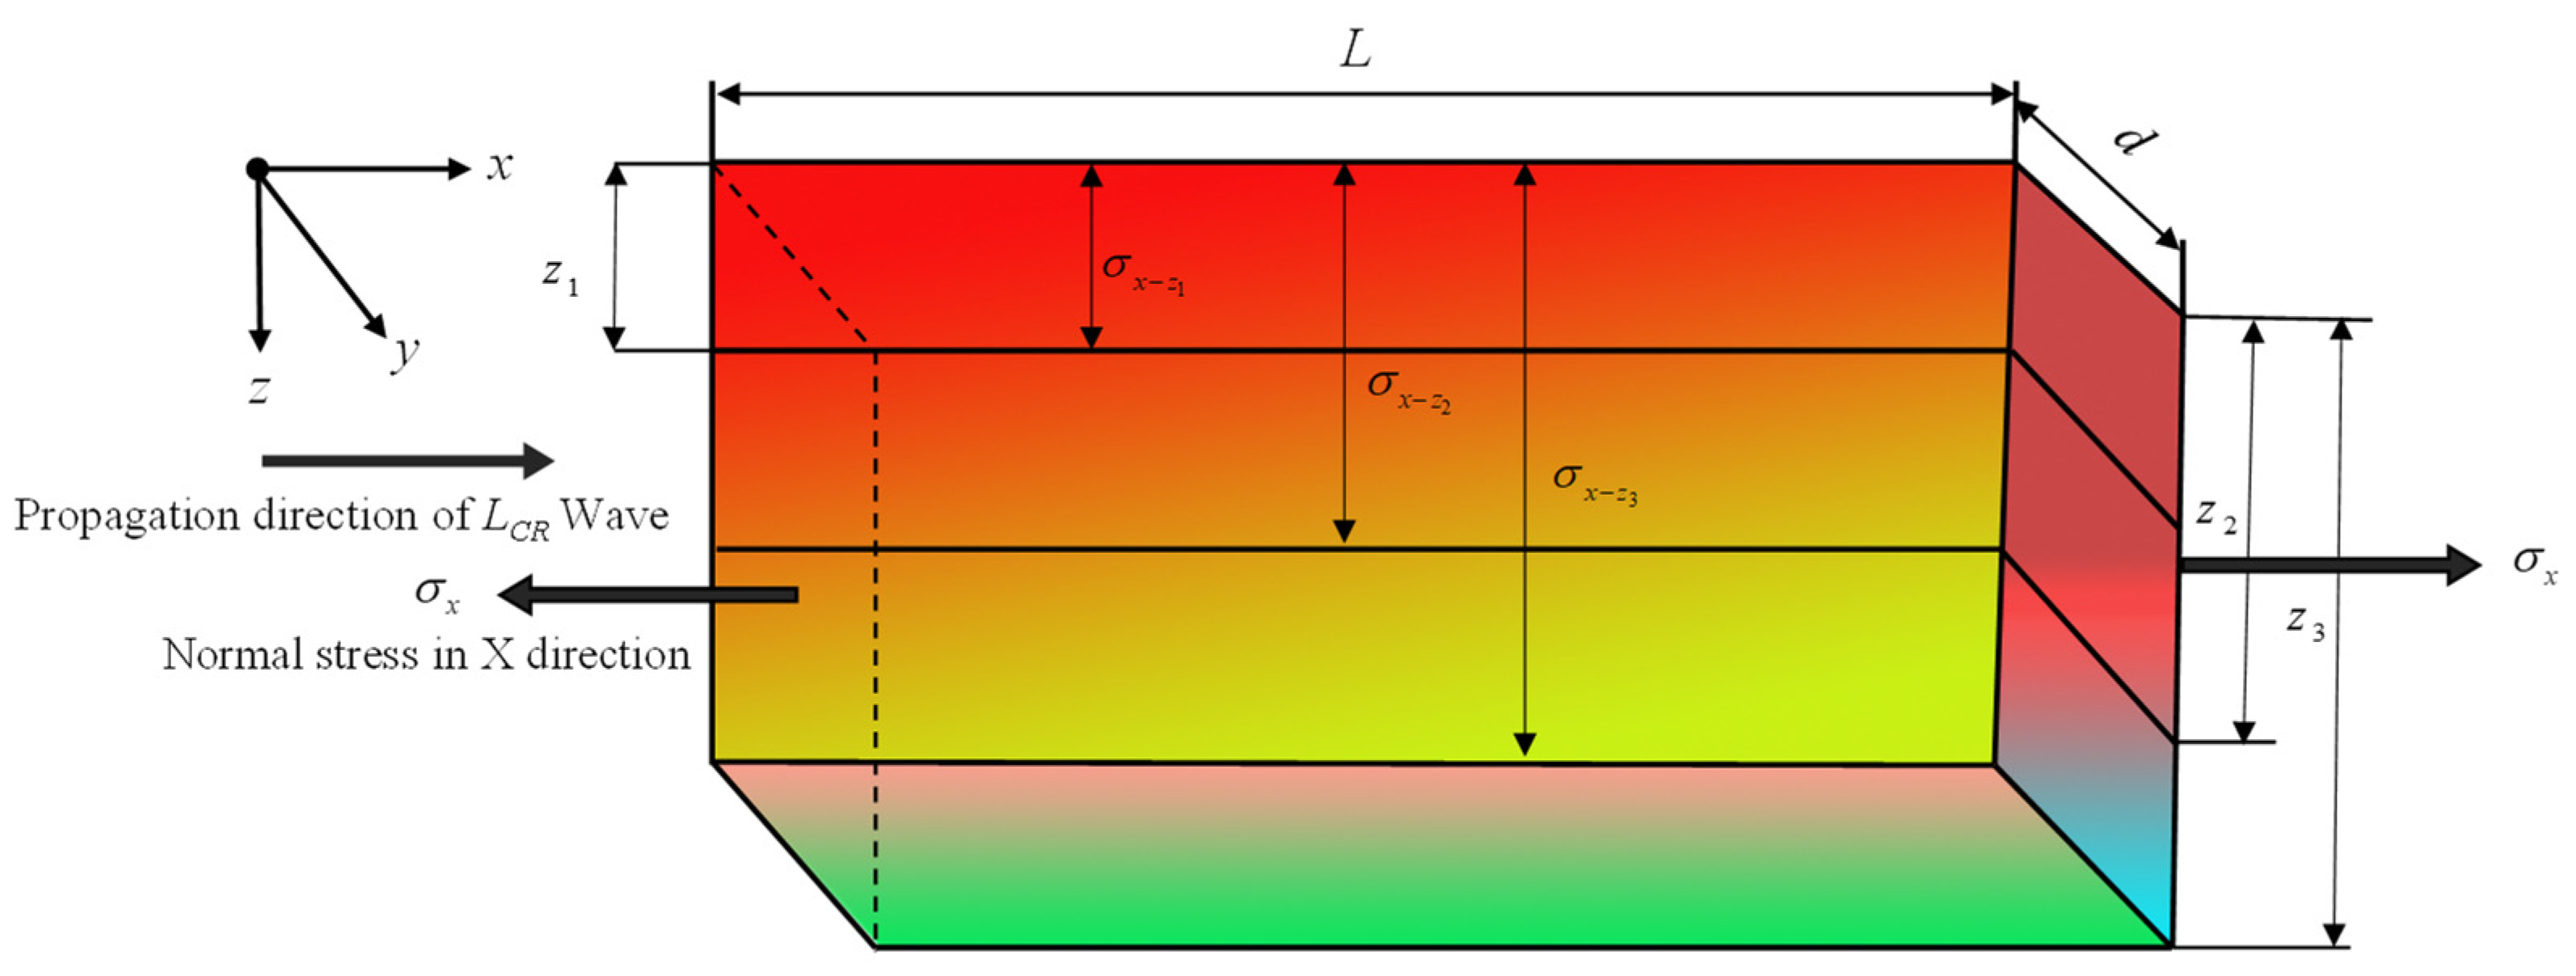
2.1. Testing Method for the Acousto-Elastic Theory

Ref. [31] showed that, when the material was isotropic, longitudinal waves were most sensitive to changes in stress. Because the LCR waves reached the sensor the earliest, LCR was the most commonly used detection method. The model and formula of the propagation mode for LCR waves and the direction of stress are shown in Figure 1 and Equation (1) [32]:
ρ 0 V x x x 2 = λ + 2 μ + σ x 3 λ + 2 μ [ λ + μ μ ( 4 λ + 10 μ + 4 m ) + λ + 2 l ]
where ρ 0 indicates the density of the material without deformation, λ and μ denote the second-order elastic constants, and l , m , and n are the third-order elastic constants of the material. σ x denotes the stress in the unitary body in the x-direction, V x x x indicates the speed of propagation of sound waves in a particular direction, and the first, second, and third subscripts of V x x x denoting the wave propagation direction, particle polarization direction, and stress direction, respectively. The aluminum alloy’s parameters are shown in Table 1 [27,33].
When the solid material is in an unstressed state, the speed of sound of the longitudinal wave in this state is:
V 0 = λ + 2 μ ρ 0
Substituting Equation (2) into Equation (1), we could obtain:
V 2 = V 0 2 ( 1 + k 1 σ )
where
k 1 = 4 λ + 10 μ + 4 m μ + 2 l 3 λ 10 μ 4 m λ + 2 μ 3 λ + 2 μ
where V represents the longitudinal wave velocity for a propagation direction in the same direction as the applied stress, V 0 represents the longitudinal wave velocity in a stress-free state, and k 1 is the acousto-elastic coefficient.
By simultaneously differentiating both sides of Equation (3) and simplifying the infinitesimal quantities, we could obtain:
d σ = 2 k 1 V 0 d V
where k 1 is the longitudinal wave acoustic elasticity coefficient, which can be obtained experimentally using a tensile compression tester that provides standard stress values [34]. The coefficient of aluminum alloy 2A14 is 4.5, which can be obtained by a tensile test. By measuring d V (relative change in the sound velocity) and V 0 (the sound velocity in the unstressed state), we could obtain the internal stress in the material. Using the method of time for the flight difference, we obtained the change in time of flight for a certain sound range by measuring the time of flight for a certain sound range. Thus, the stress could be obtained more accurately by using Equation (5).
When LCR is used for the detection of internal stress for aluminum alloy components, the sound has to be refracted from a medium with a slower sound speed into a medium with a faster sound speed, and the refraction angle is determined by Snell’s law [35]. To study the effect of LCR waves at a frequency on propagation depth, the diameter and incidence angle of the ultrasonic transducer was fixed in this paper, the optimal angle for generating LCR waves was chosen to be 30 degrees according to the literature, and the transducer piezoelectric ceramics were all 5mm in diameter [30]. By using the oblique incidence method, the LCR wave was excited into transmitting to a receiving transducer, as shown in Figure 2. Polymethyl methacrylate (PMMA) was used as a common material for making transducer wedges for stress detection with LCR waves.

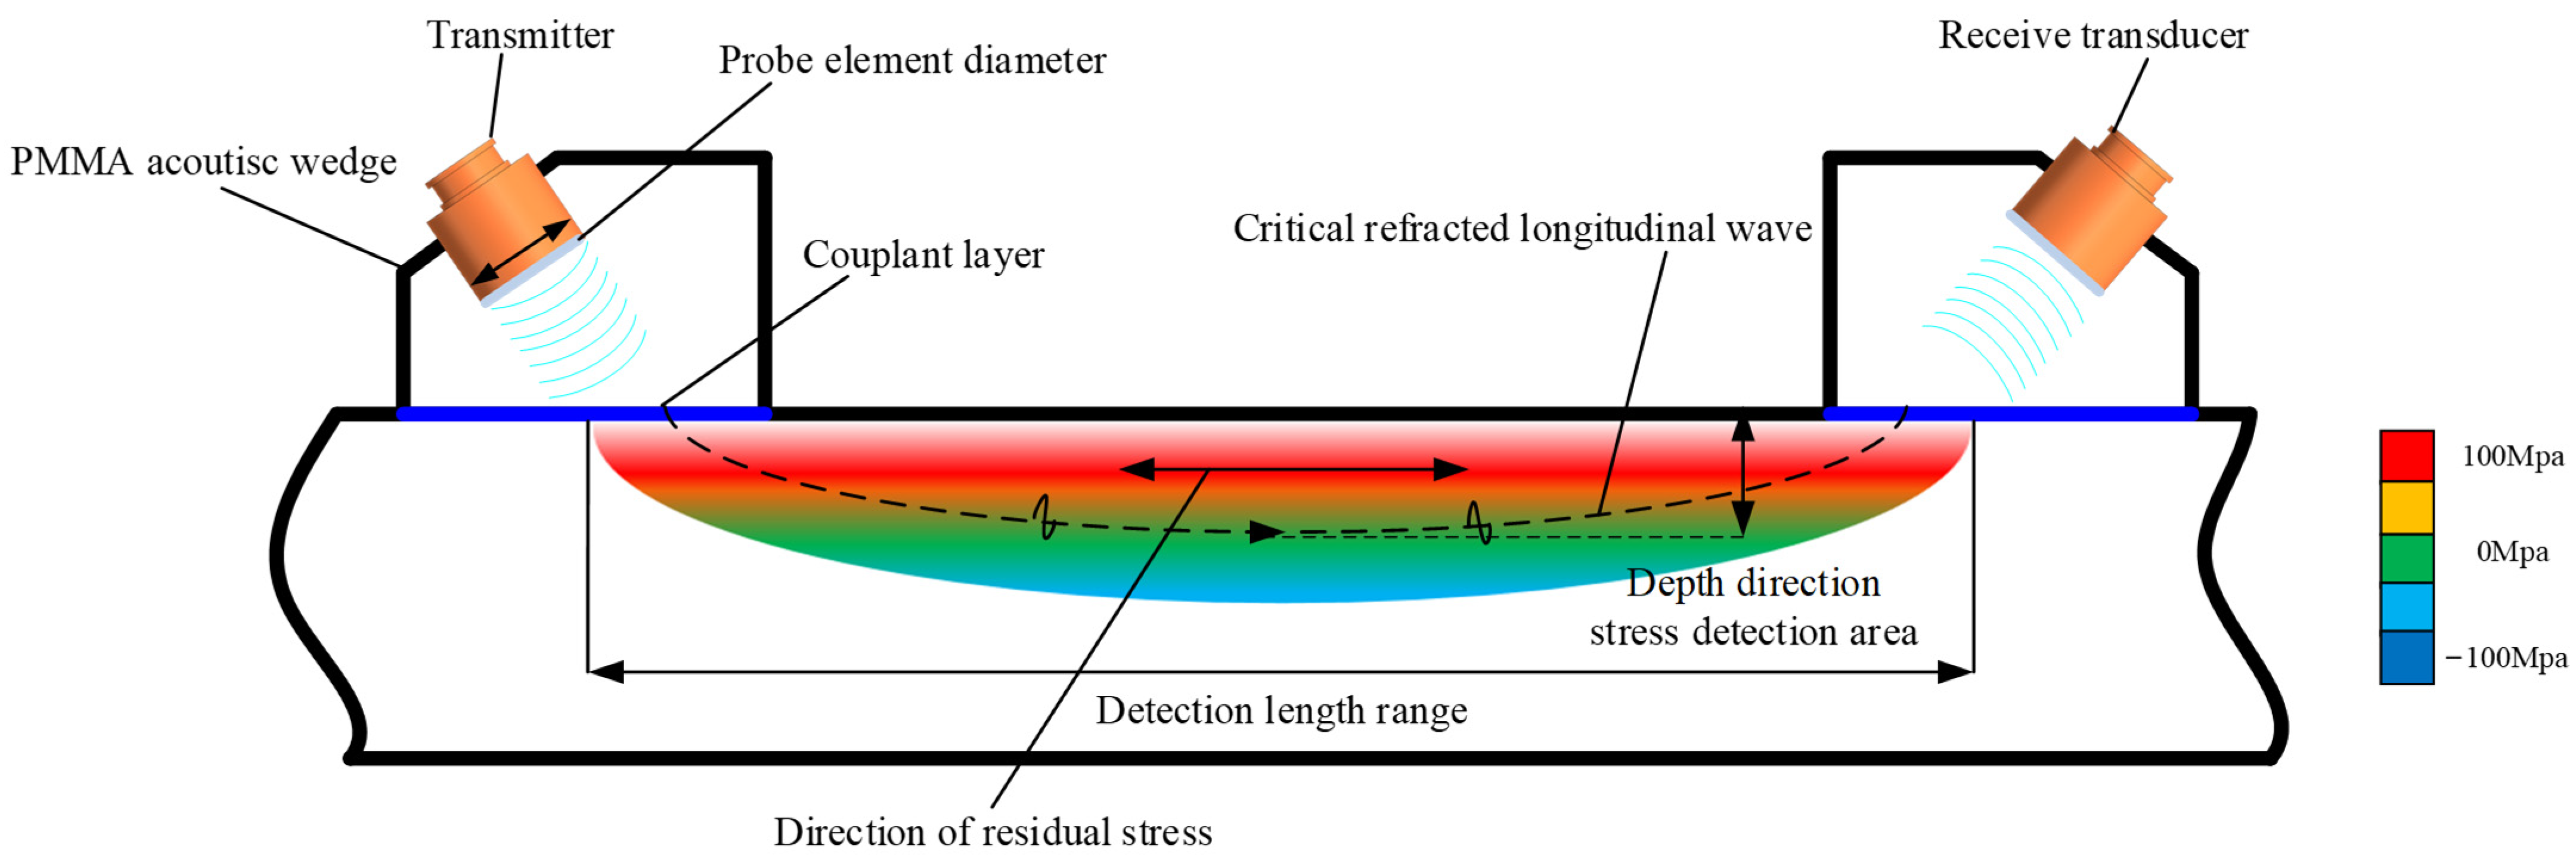
2.2. Detection Principle of Stress Depth Distribution

According to Equation (5), it can be seen that the LCR wave can detect the average positive stress in a certain area range. The model of horizontal normal stress distribution at different depths is shown in Figure 3. The study [27] concluded that different frequencies of LCR waves correspond to different detection depths and gave an empirical formula for ultrasonic detection of stress depths in Q235 steel by establishing a simplified stress gradient model. The study [29] modified the empirical equation of LCR wave propagation depth in Q235 steel by finite element simulation. The depth of LCR wave propagation corresponds to the frequency, so the depth of detection of stress is also frequency-dependent.
Since the stress distribution in the component is not uniform, to describe the principle of LCR wave detection of residual stress at different depths as exactly as possible, an ultrasonic detection model for normal stress at different depths was established in this paper. Assuming that the ultrasonic transducer frequency f 1 , f 2 , f 3 corresponds to a detection depth of D 1 , D 2 , D 3 , the horizontal stress distribution in the depth direction is σ 1 , σ 2 , σ 3 . To determine the mean normal stress in the x-direction σ z 1 at the depth z 1 , the following formula can be used:
σ x z 1 = y , z ( 0 x σ d x ) d y d z d V z 1 = y , z ( 0 x σ d x ) d y d z x ( y , z d y d z ) d x
σ x z 1 is expressed as the average normal stress in the x-direction in a cube of length x, width y, and depth z 1 .
As the length in the x-direction is the propagation distance of the LCR wave, set to L, and the length in the y-direction is the diameter of the transducer, both of which are fixed values, this paper assumes a uniform stress distribution in the y-direction to simplify the model, so Equation (6) can be simplified to
σ x z 1 = 0 z 1 ( 0 L σ d x ) d z z L
By analogy, the average normal stress value in the x-direction at any depth z i can be expressed as:
σ x z i = 0 z i ( 0 L σ d x ) d z z i L

3. The Dependency of LCR Wave Propagation Depth on Its Frequency

According to the research reported in Refs. [27,29], we concluded that the propagation depth of the ultrasonic waves in steel increased as the frequency decreased; however, the relationship was not linear. By changing the excitation frequency of the transducer, the LCR waves propagating at different depths below the surface could be obtained. Then, according to the influence of stress on the velocity of the LCR waves at different depths and the correlation model of stress and wave velocity, the normal stress distribution at different depths below the surface could finally be determined.

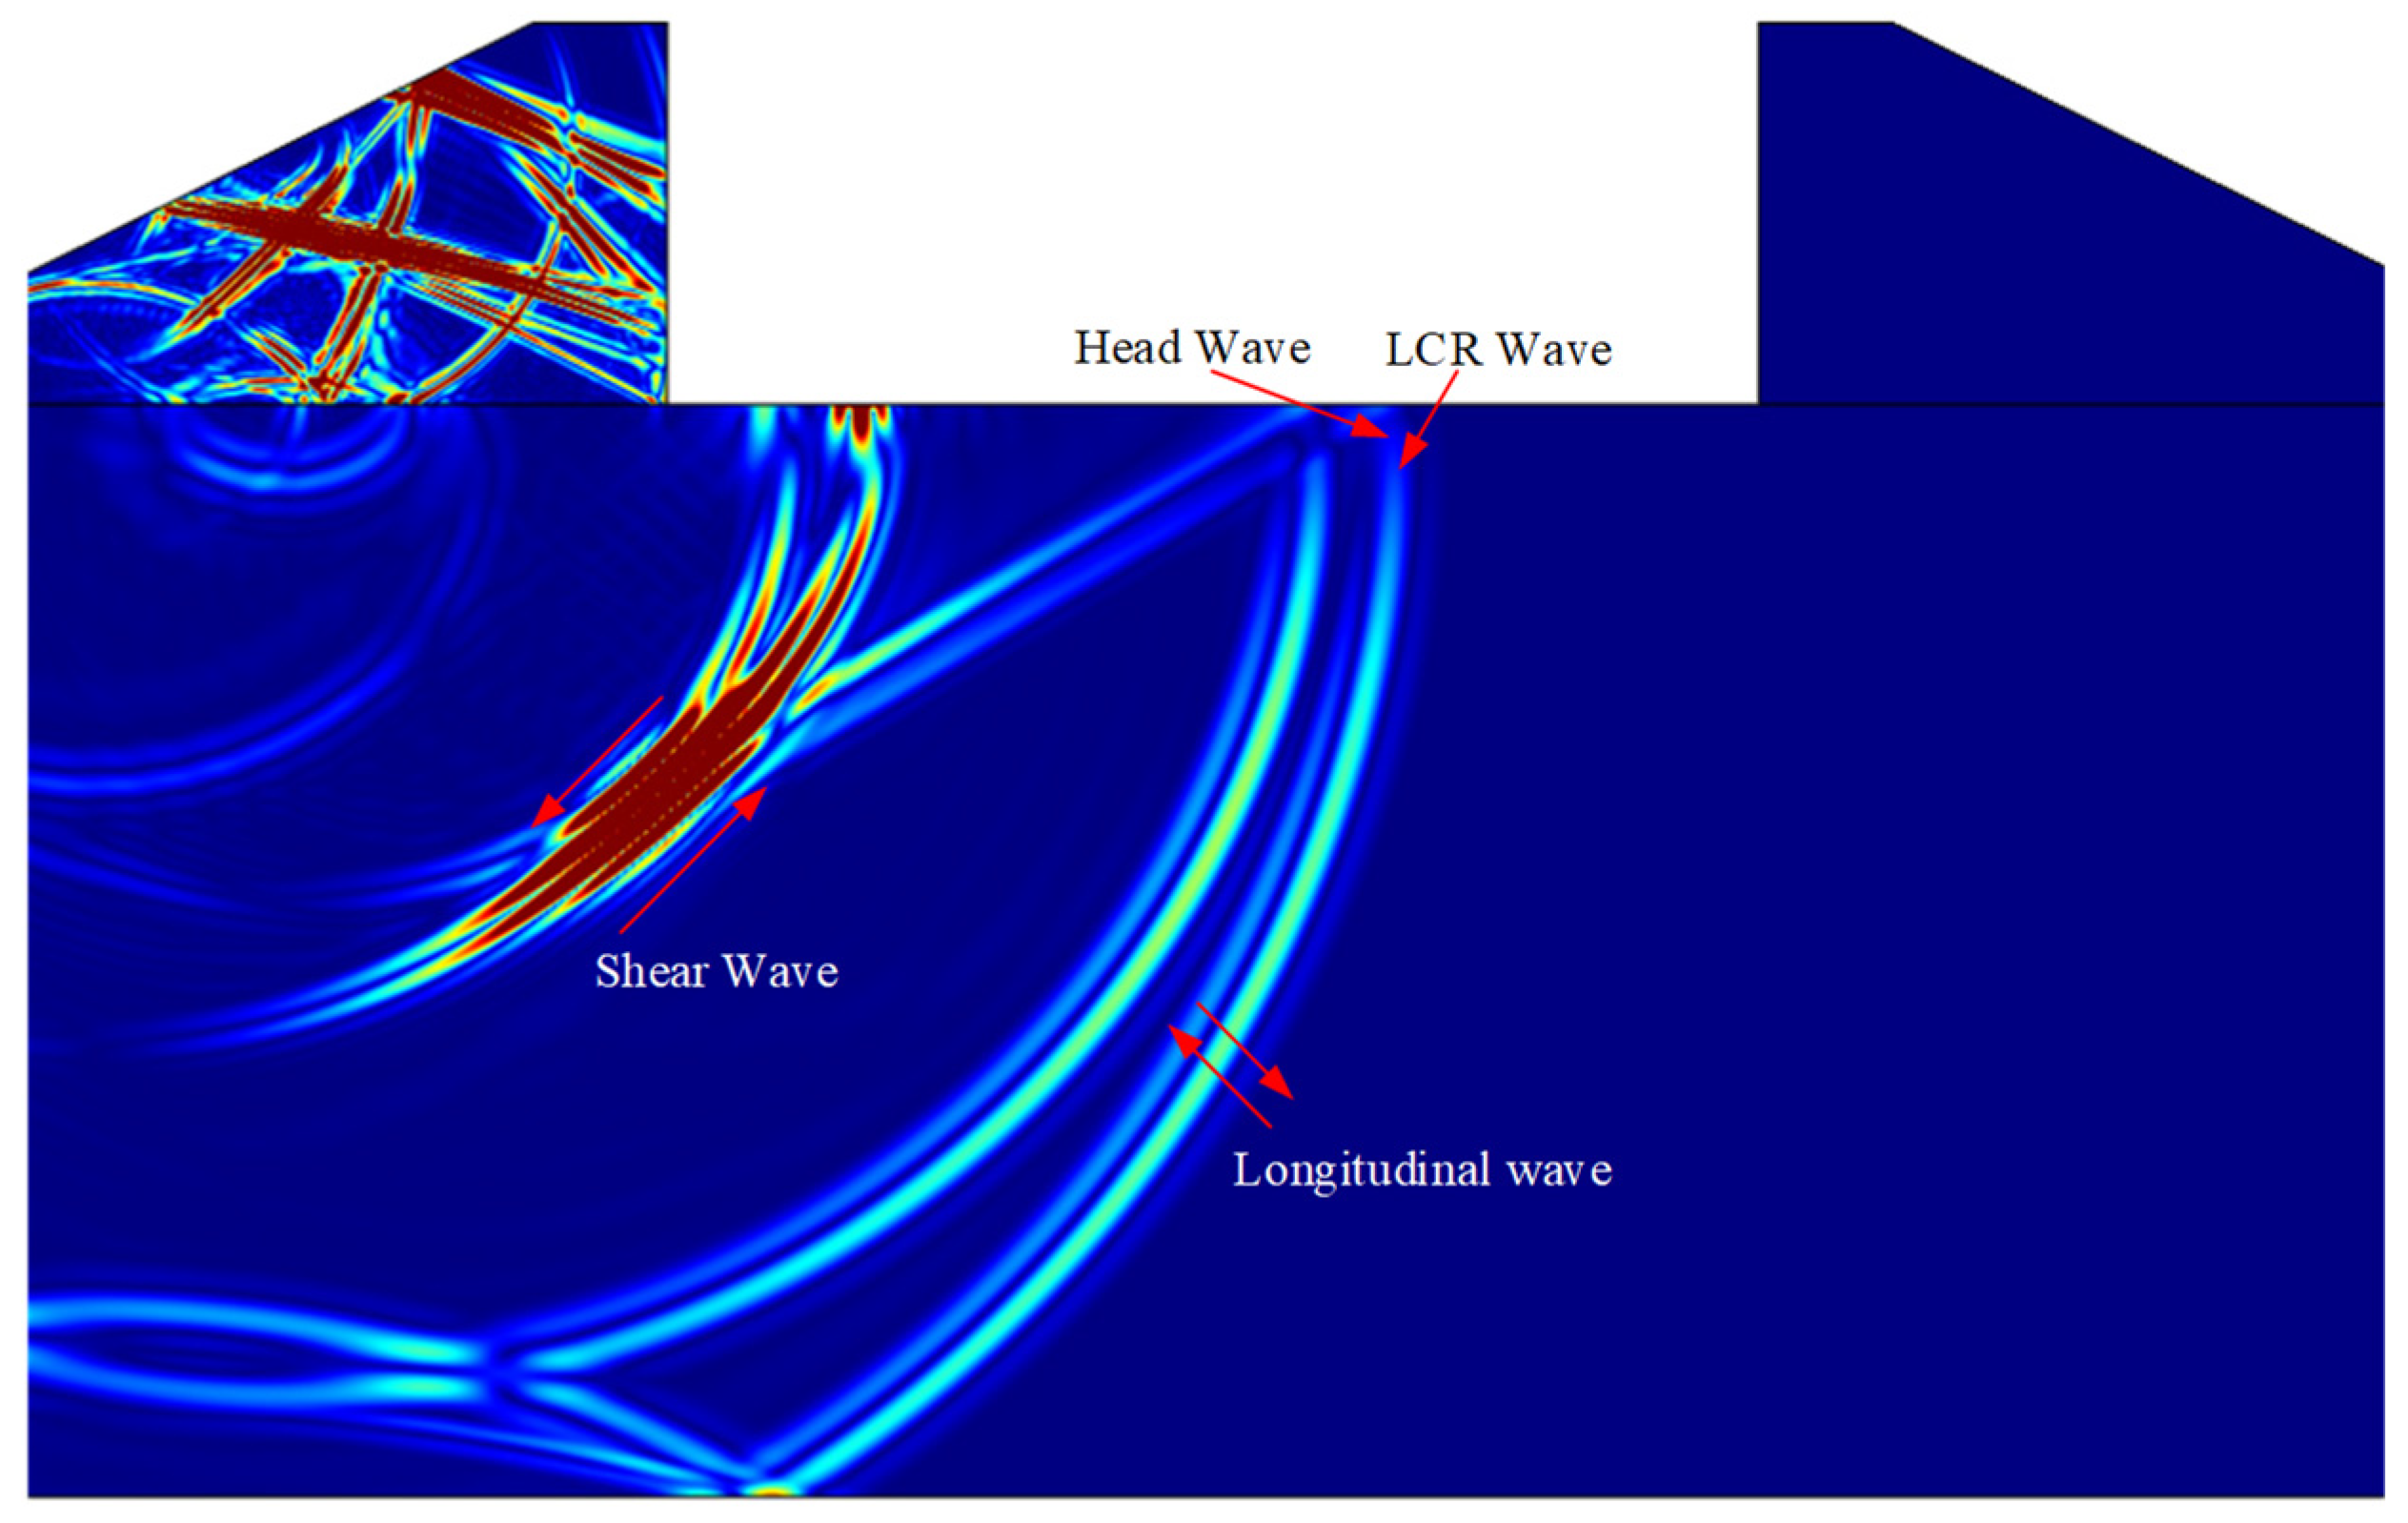
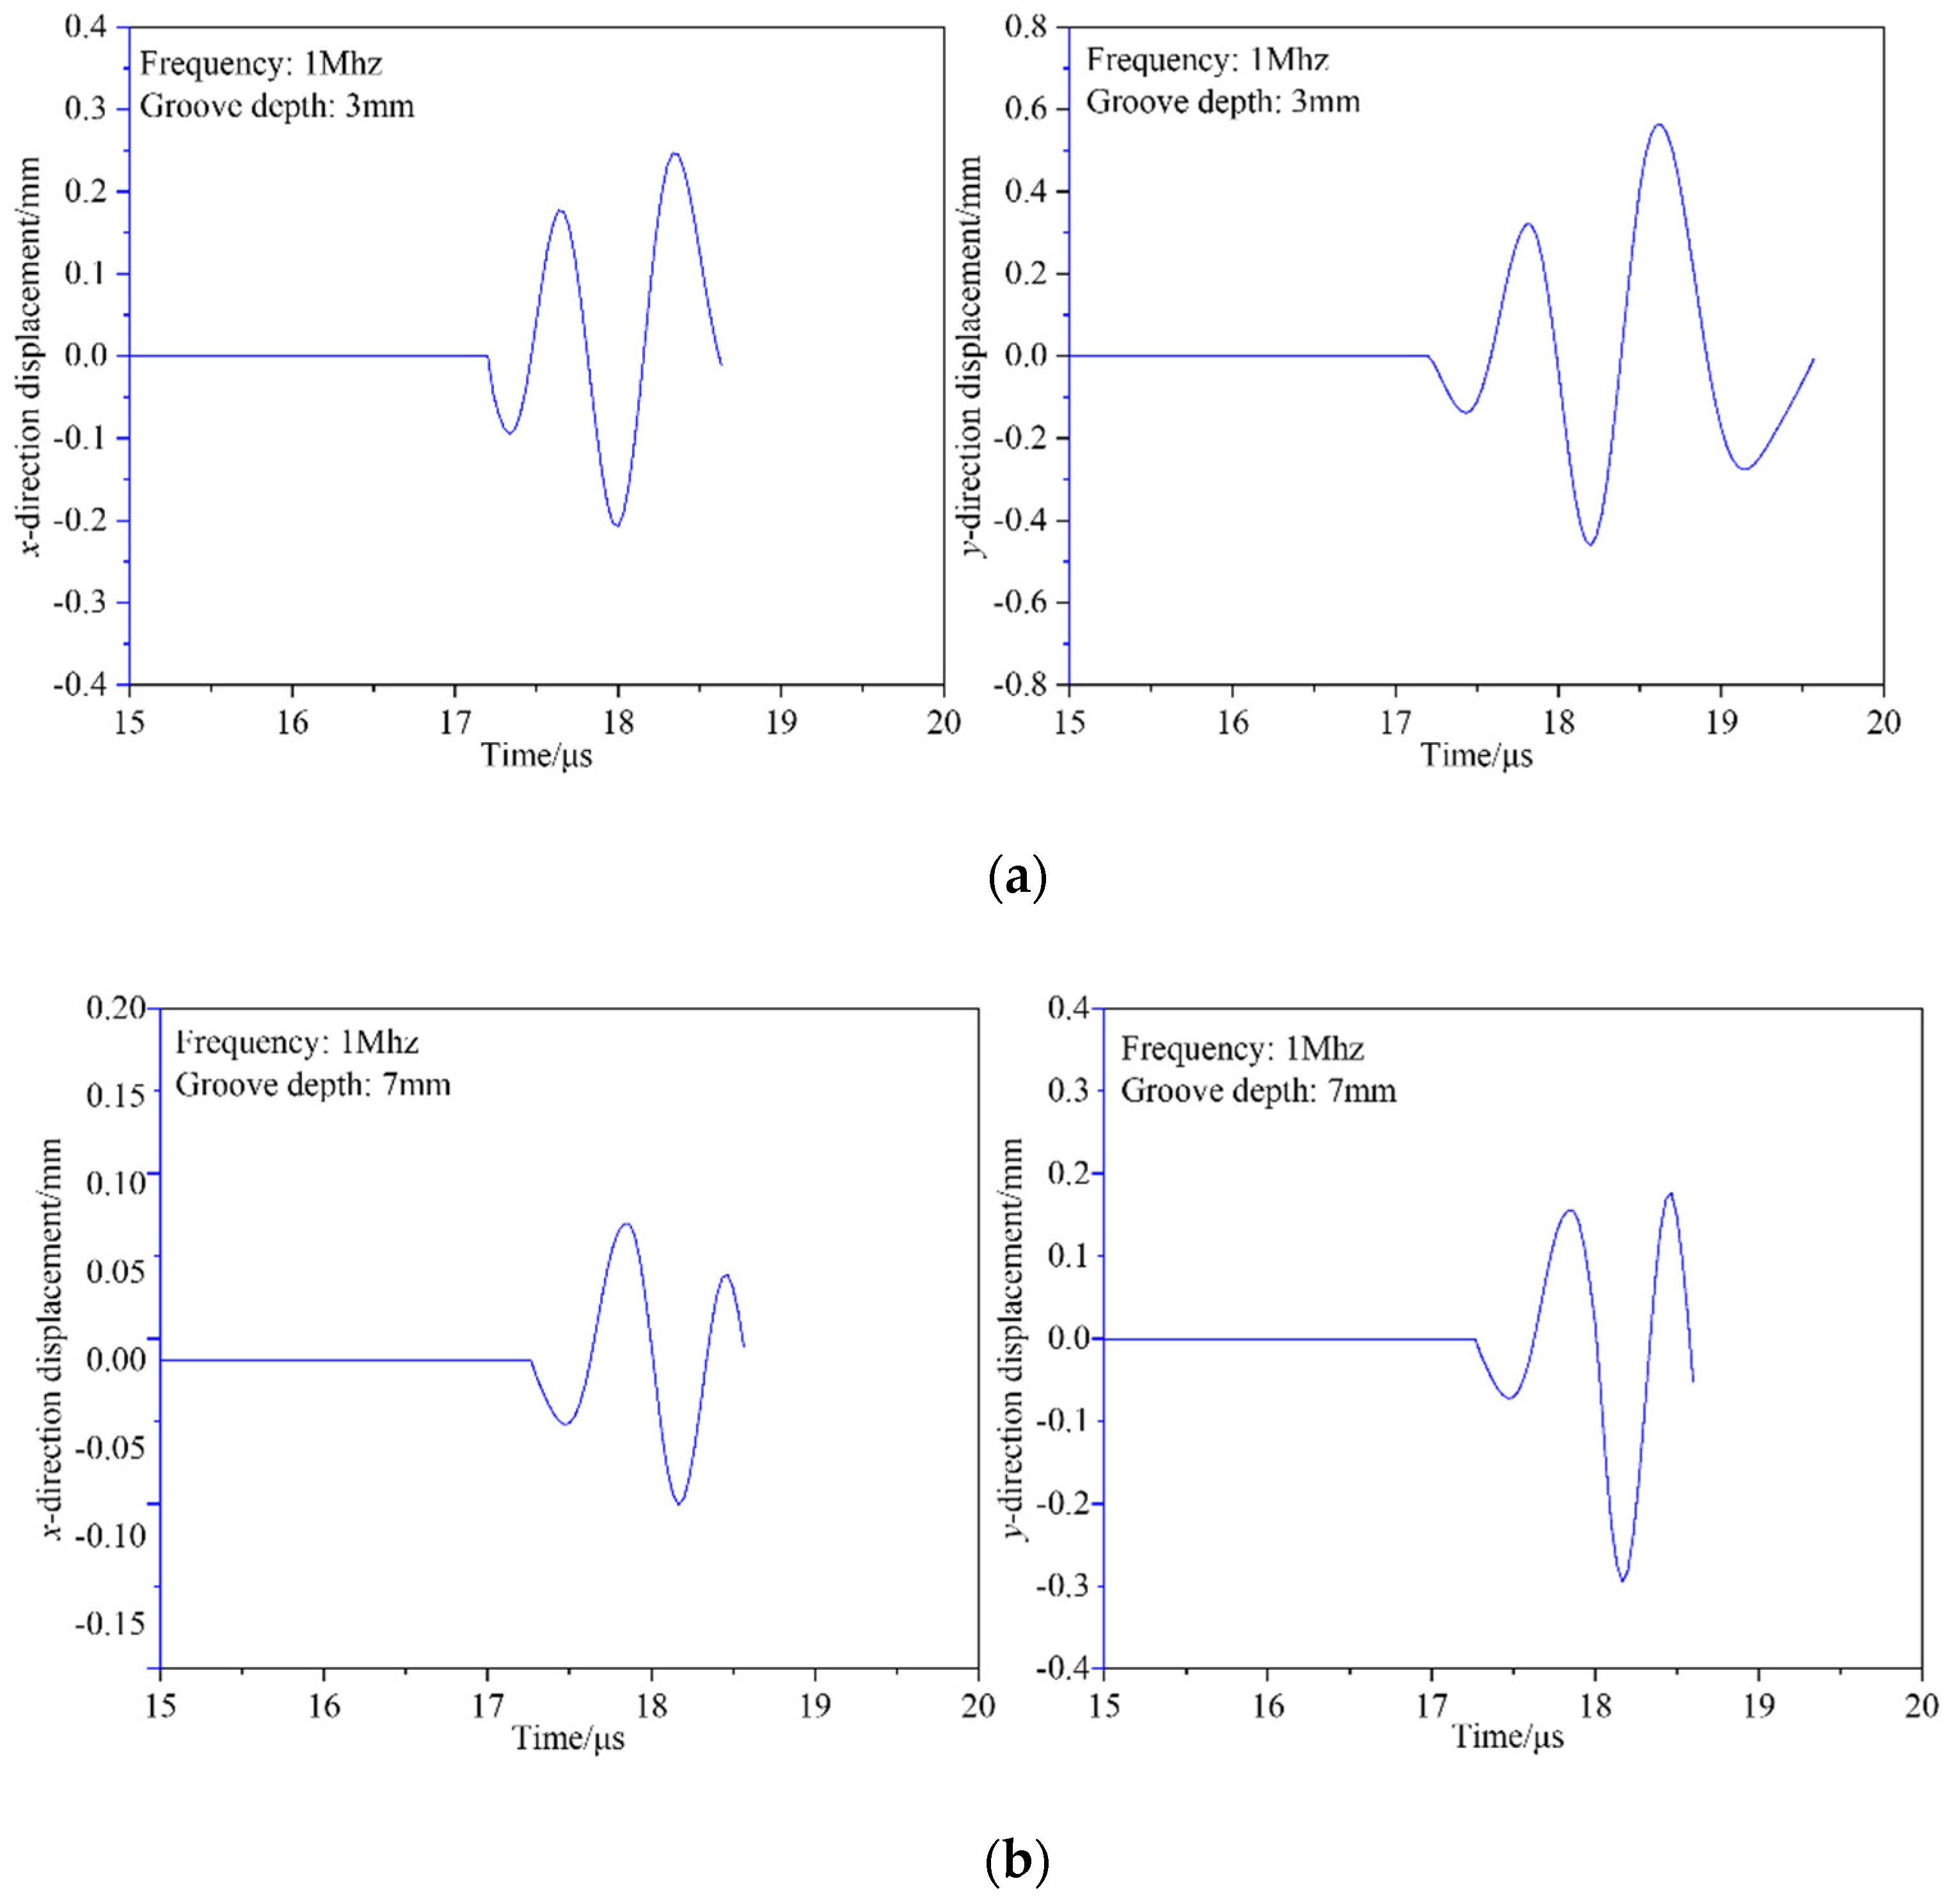
3.1. Finite Element Simulation of LCR Wave Propagation Depth

The propagation process of ultrasonic waves in elastic solids is very complicated. Although numerous studies have analyzed various propagation modes, there has been a lack of an intuitive representation of how LCR waves are propagated. In this study, the elastic wave module was selected for ultrasonic simulation research, and the velocity–strain formula was used to solve the calculation:
{ ρ 2 u t 2 2 u = F v ε i j t 1 2 ( v v ) = 0 S k l = C i j k l : ε i j
where u is the displacement, S k l is the second-order stress tensor, ε i j is the second-order strain tensor, C i j k l is the fourth-order elastic tensor, and F v represents the body force exerted on the element body.
Based on the actual situation of the experiment, the finite element simulation model consists of a flat plate with a fixed thickness and a set of launch-receive wedge blocks. Geometrically, this was represented by a rectangle and two right-angled trapezoids. The propagation distance between the wedges on the two sides was set to 30 mm to ensure that the same spacing was used between the wedges in the verification test, and the specific model is shown in Figure 4.
In this geometric finite element model, a section of the inclined end face of the left wedge was used as the excitation zone of the ultrasonic signal, and the corresponding section on the right wedge was used as the receiving zone of the ultrasonic signal. The length of the entire rectangle was 60 mm and the height was 40 mm. To simulate the excitation signal of the ultrasonic transducer, the length of the excitation zone of the signal on the left was set to 5 mm, which was the same as the diameter of the wafer used in the experiment, where the material of the plate consisted of 2A14 aluminum alloy. The material for the transmitting and receiving wedges on both sides consisted of PMMA, and the specific properties are shown in Table 2.
In the simulation software, a pulse signal was used as the excitation signal, and a modulated pulse signal was used to act on the left plexiglass to simulate the ultrasonic longitudinal wave transducer. The signal expression followed:
F ( t ) = { e ( t 2 T 0 ( T 0 / 2 ) ) 2 sin ( 2 π f 0 t ) t T 0 0 t > T 0
The total displacement amplitude of the signal received by the right-hand side wedge was used as the standard for assessing the energy intensity of the LCR wave signal using the observed relative changes in the displacement amplitude.

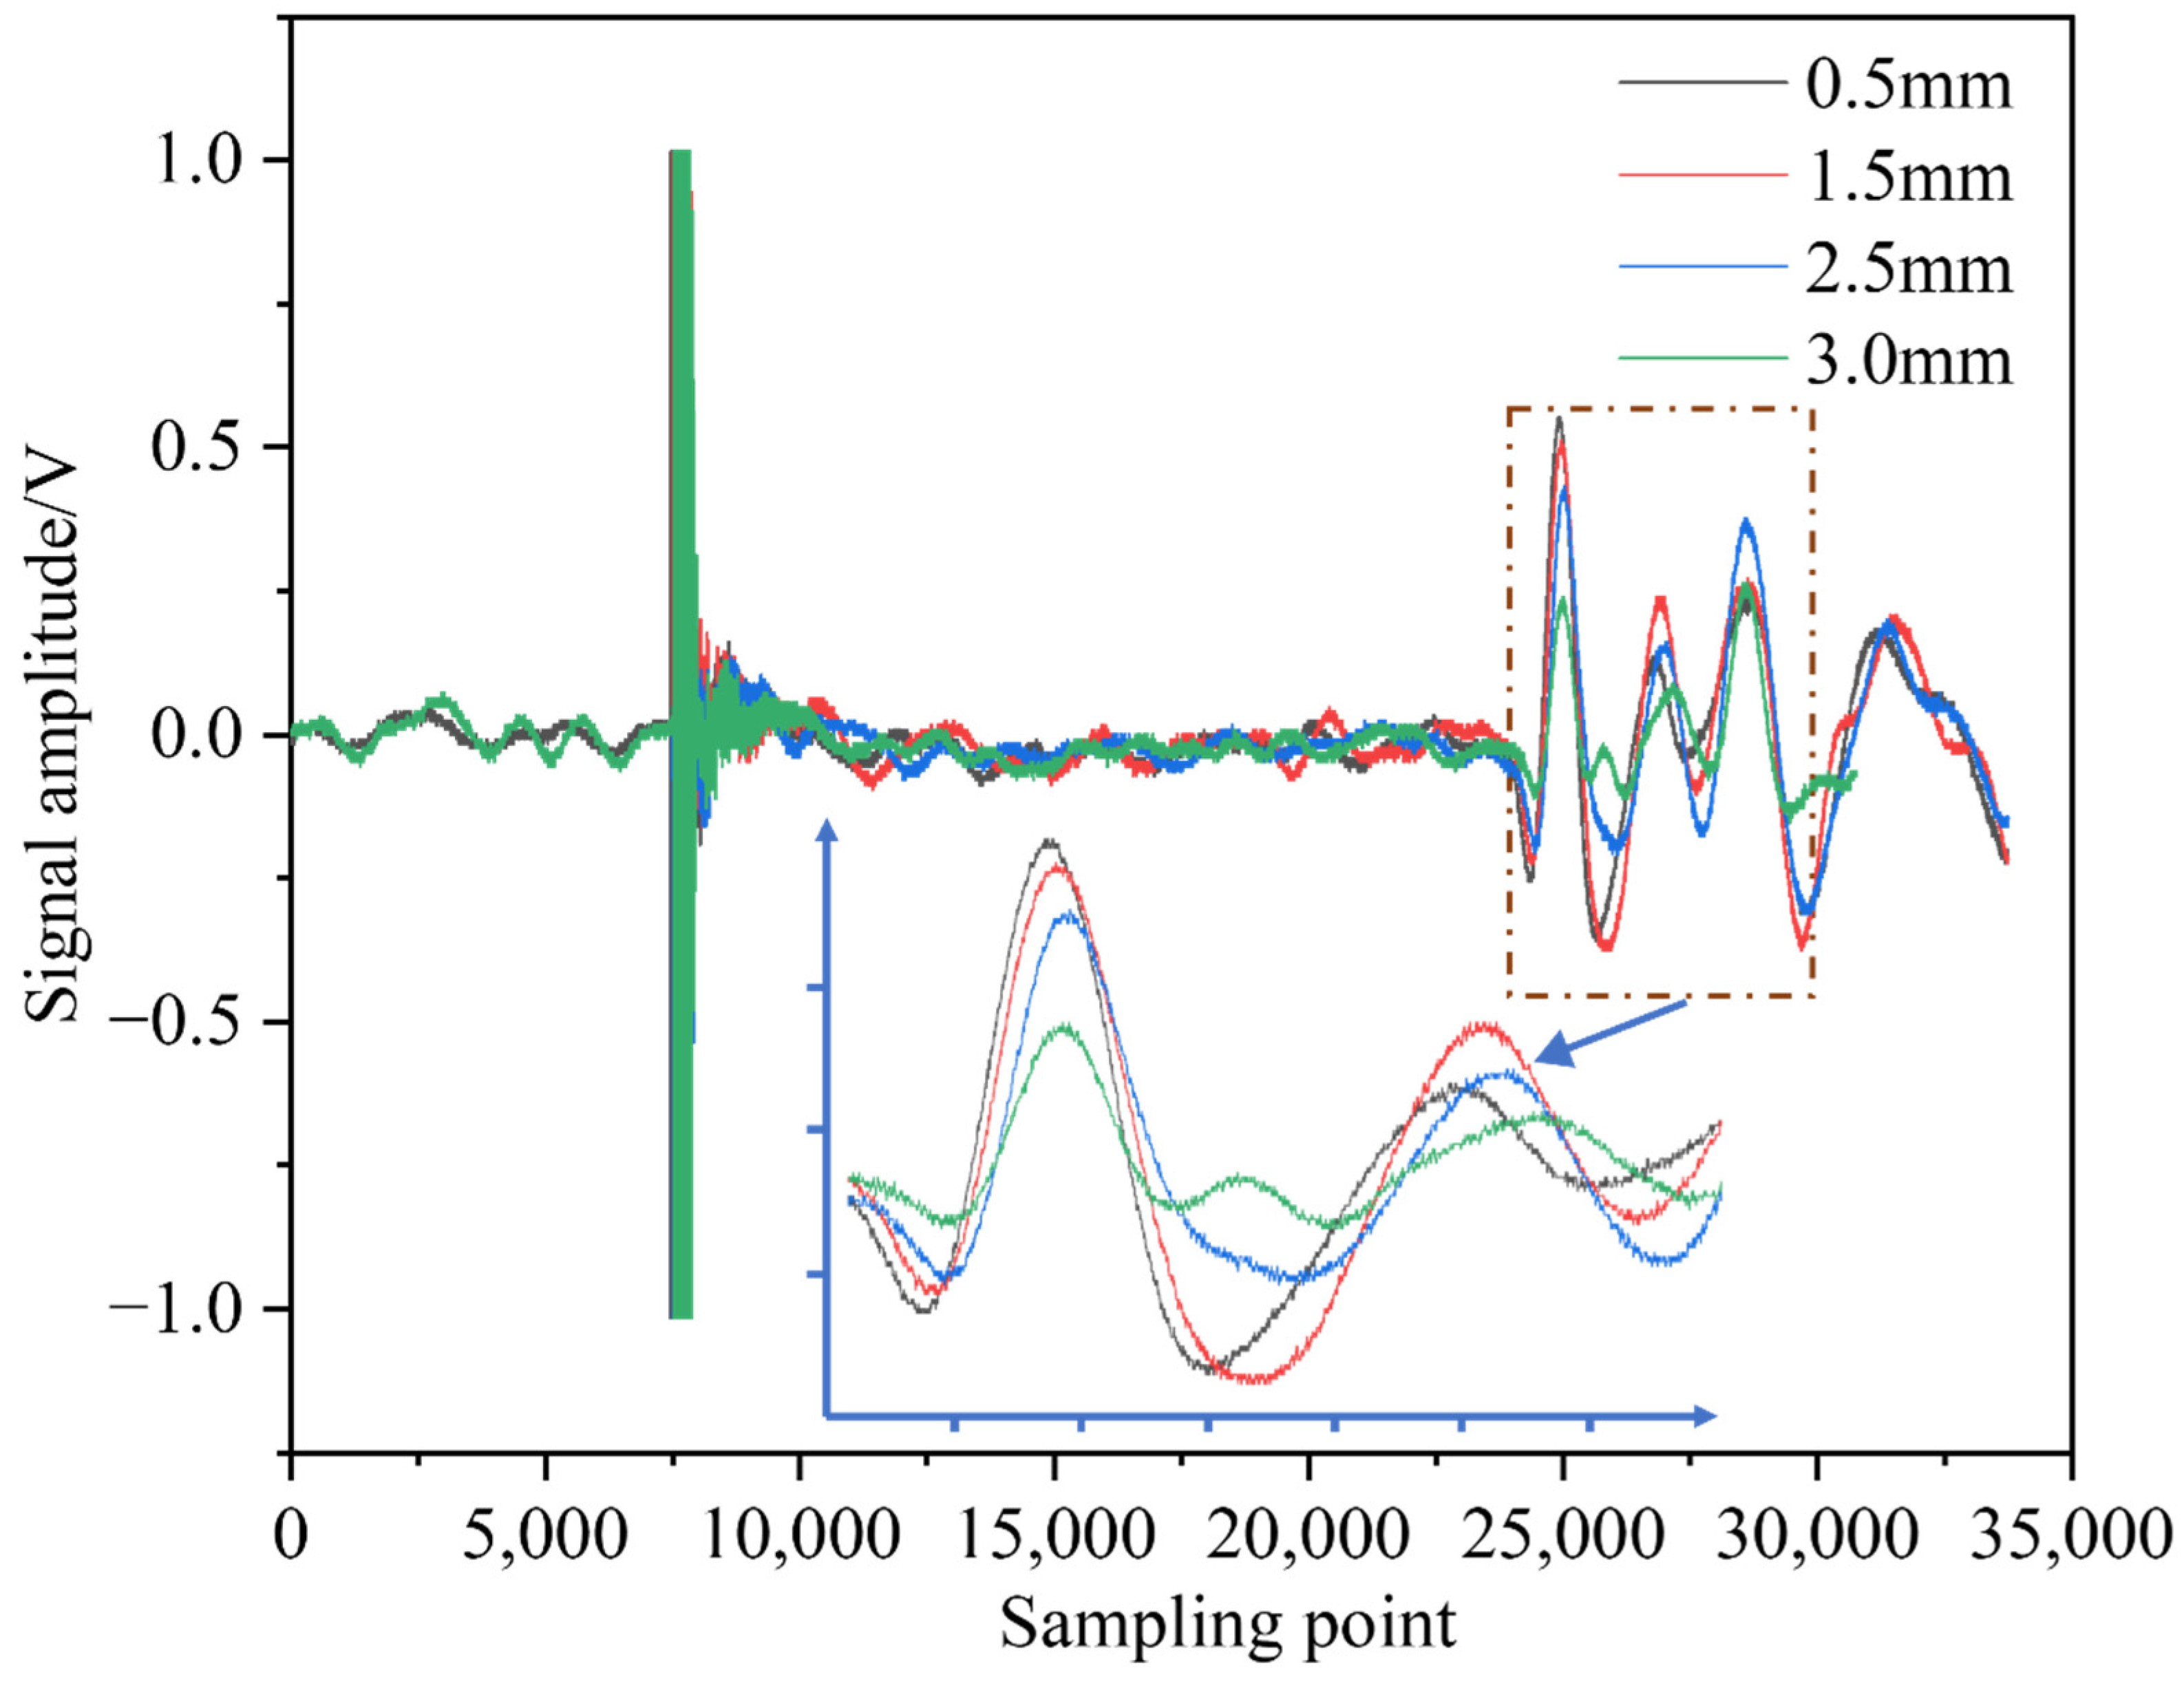
3.2. Propagation Depth Experiment of the LCR Waves

Through the numerical simulation method, the propagation behavior of LCR waves in grooves of different depths was simulated. To verify the correctness of the model and determine the propagation depth of LCR waves of different frequencies, in this paper, aluminum alloy groove test blocks with different depths were processed for verification. The study [29] evaluated the ultrasonic propagation depth by simulating the TOF (time-of-flight) difference of multi-frequency LCR waves with different groove depths but did not consider the influence of the width and depth of the groove on the propagation time of LCR.
In the experiment, the material of the tested block was 2A14 aluminum alloy, and two identical test blocks of the aluminum alloy were used as the test objects. Each rectangular test block had a measured length of 300 mm, a width of 40 mm, and a height of 50 mm. The test blocks were milled on the Taqun T-V850 machining center, and the surface of the test blocks was machined as smoothly as possible in order not to be affected by surface roughness. On one face of each test block, suitably spaced grooves of different depths were milled, where the depths of the milled grooves on one block were 0.5, 1, 1.5, 2.0, 2.5, and 3 mm, while the depths of the milled grooves on the other block were 3.5, 4, 4.5, 5, 6, and 10 mm. To eliminate the effect of milling residual stresses on LCR wave propagation, the test blocks were annealed at 260 °C and air-cooled for 4 h to room temperature after machining.
The experimental system was composed of an ultrasonic signal generator, a power amplifier, and an oscilloscope. A pulse signal was emitted by a RIGOL-DG1022U ultrasonic signal generator (RIGOL, Suzhou, China), and an ATA-4011 power-amplifier (Aigtek, Xi’an, China)provided an output with 20 times gain and could meet the operating requirements of the transducer. The transducers with different frequencies used in this paper were provided by the Shantou Institute of Ultrasound (Shantou, China), and the center frequencies were 1, 2.5, 4, 5, and 7.5 MHz. In the verification experiment, the relative echo amplitude received by the oscilloscope could be used as the standard for assessing the energy intensity of the LCR wave signal at different frequencies and in different depth ranges, for evaluating the feasibility of detecting the residual stress at different depth distributions. To avoid the influence of temperature on the LCR wave, the experiments in this paper were all carried out at room temperature of 26 °C.

3.3. Verification of Multi-Frequency Ultrasonic Testing of Stress Depth Distribution

To quickly obtain the normal stress distribution at different depths, in this paper, we adopted the method of applying a moment to the cantilever beam to obtain the pre-stress. The length of the cantilever beam was 300 mm, the width was 50 mm, and the thickness was 10 mm. For a cantilever beam, when the other end was loaded, both the shear force and bending moment were generated simultaneously. Thus, normal and tangential stresses were generated inside the cantilever beam. In this study, we mainly focused on normal stress in testing and verification.
By controlling the advance of the screw, different pressures were applied. At the same time, a pressure sensor was placed between the head of the screw bolt and the cantilever beam to monitor the applied pressure; thus, applying the force precisely. Compared to the pressure applied by tightening the screw bolt, the dead weight of the bolt, the pressure sensor, and the cantilever could be ignored. Figure 5 shows the experimental system for measuring the normal stress distribution at different depths of the cantilever beam.
The material of the cantilever beam consisted of 2A14 aluminum alloy, and the material of the bracket was Q235 steel. In the simulation process, to simplify the model, the bolt-loading force was equated to the uniform load on the aluminum alloy plate, and the modulus of elasticity of Q235 steel is much larger than that of aluminum alloy 2A14, so it could be set as a rigid body. The loading forces were set to 100, 200, 300, 400, 500, 600, 700, and 800 N. After the simulation calculations, the x-direction normal stress distribution of the cantilever beam along the thickness direction was read out, from which we obtained the stress curve and the stress distribution along the thickness direction. The stress distribution map of the cantilever beam for an applied load is shown in Figure 6.
As shown in Figure 6, the x-direction horizontal positive stress was not uniformly distributed in both the depth direction and length direction of the plate. The horizontal positive stress showed a linear distribution along the depth direction and was nonlinear in the length direction, but the average normal stress could still be calculated according to Equation (8). The stress was more concentrated near the fixed end, and the distance of 80 mm from the fixed end was chosen as the observation position to better measure the horizontal normal stress at different depths.

4. Results and Discussion

4.1. Simulation Results of the Effective Propagation Depth of the LCR Waves

The ultrasonic wave propagation diagram at t = 5   μ s is shown in Figure 7, where the color shades in the diagram represent the amplitude. In the aluminum alloys, the LCR wave had the fastest propagation speed, and the LCR wave reached the right wedge first. The bulk longitudinal wave also had the same speed as the LCR wave, but the vibration direction was perpendicular to the wavefront of the propagating wave and it propagated to the bottom surface of the aluminum alloy before it was reflected. For the head wave, its wavefront was approximately a straight line in two-dimensional space, and consisted of a plane wave, with its corrugation tangent to the transverse wave. This was the same as the propagation process of the LCR wave in steel described in Liu Y. [29], where the only difference was that the longitudinal wave entered the material from the wedge with a different incident angle.
Two PMMA wedges, one for sending and one for receiving, were set up on the two sides of a flat plate. A pulse excitation signal was given to the left wedge, and a signal acquisition point was set up on the right wedge. On the plate and mid-way between the two wedges, a groove with a width twice the ultrasonic wavelength was milled into the plate to block the conduction of the LCR wave signal. The displacement of the signal received by the right wedge was analyzed while changing the width and depth of the milled groove to observe the changes in signal displacement caused by the depth of the groove.
In the process of finite element simulations, ultrasonic waves of 1 MHz were selected, and the depth of the milled groove varied from 1 to 7 mm. The x-direction displacement and y-direction displacement of the simulated signal at the signal acquisition point were analyzed, from which the displacement of the acquired signal was obtained. Displacements in the x- and y-directions of the 1 MHz signal are shown in Figure 8.
Figure 8 shows the displacement–time curves of the x- and y-components of the signal acquired by the right wedge block for a transducer frequency of 1 MHz. Because the LCR wave had the fastest propagation speed, the first wave in the figure was the received signal of the LCR wave. When the depth of the milled groove increased from 1 to 5 mm, the displacement amplitudes in the two directions were reduced slightly but not by very much. When the depth increased to 7 mm, the displacement amplitudes in both directions showed a significant drop. This indicated that, when the depth reached 7 mm, the received LCR wave signal was very weak and showed that the effective measurement depth of the LCR wave at a frequency of 1 MHz was less than 7 mm.

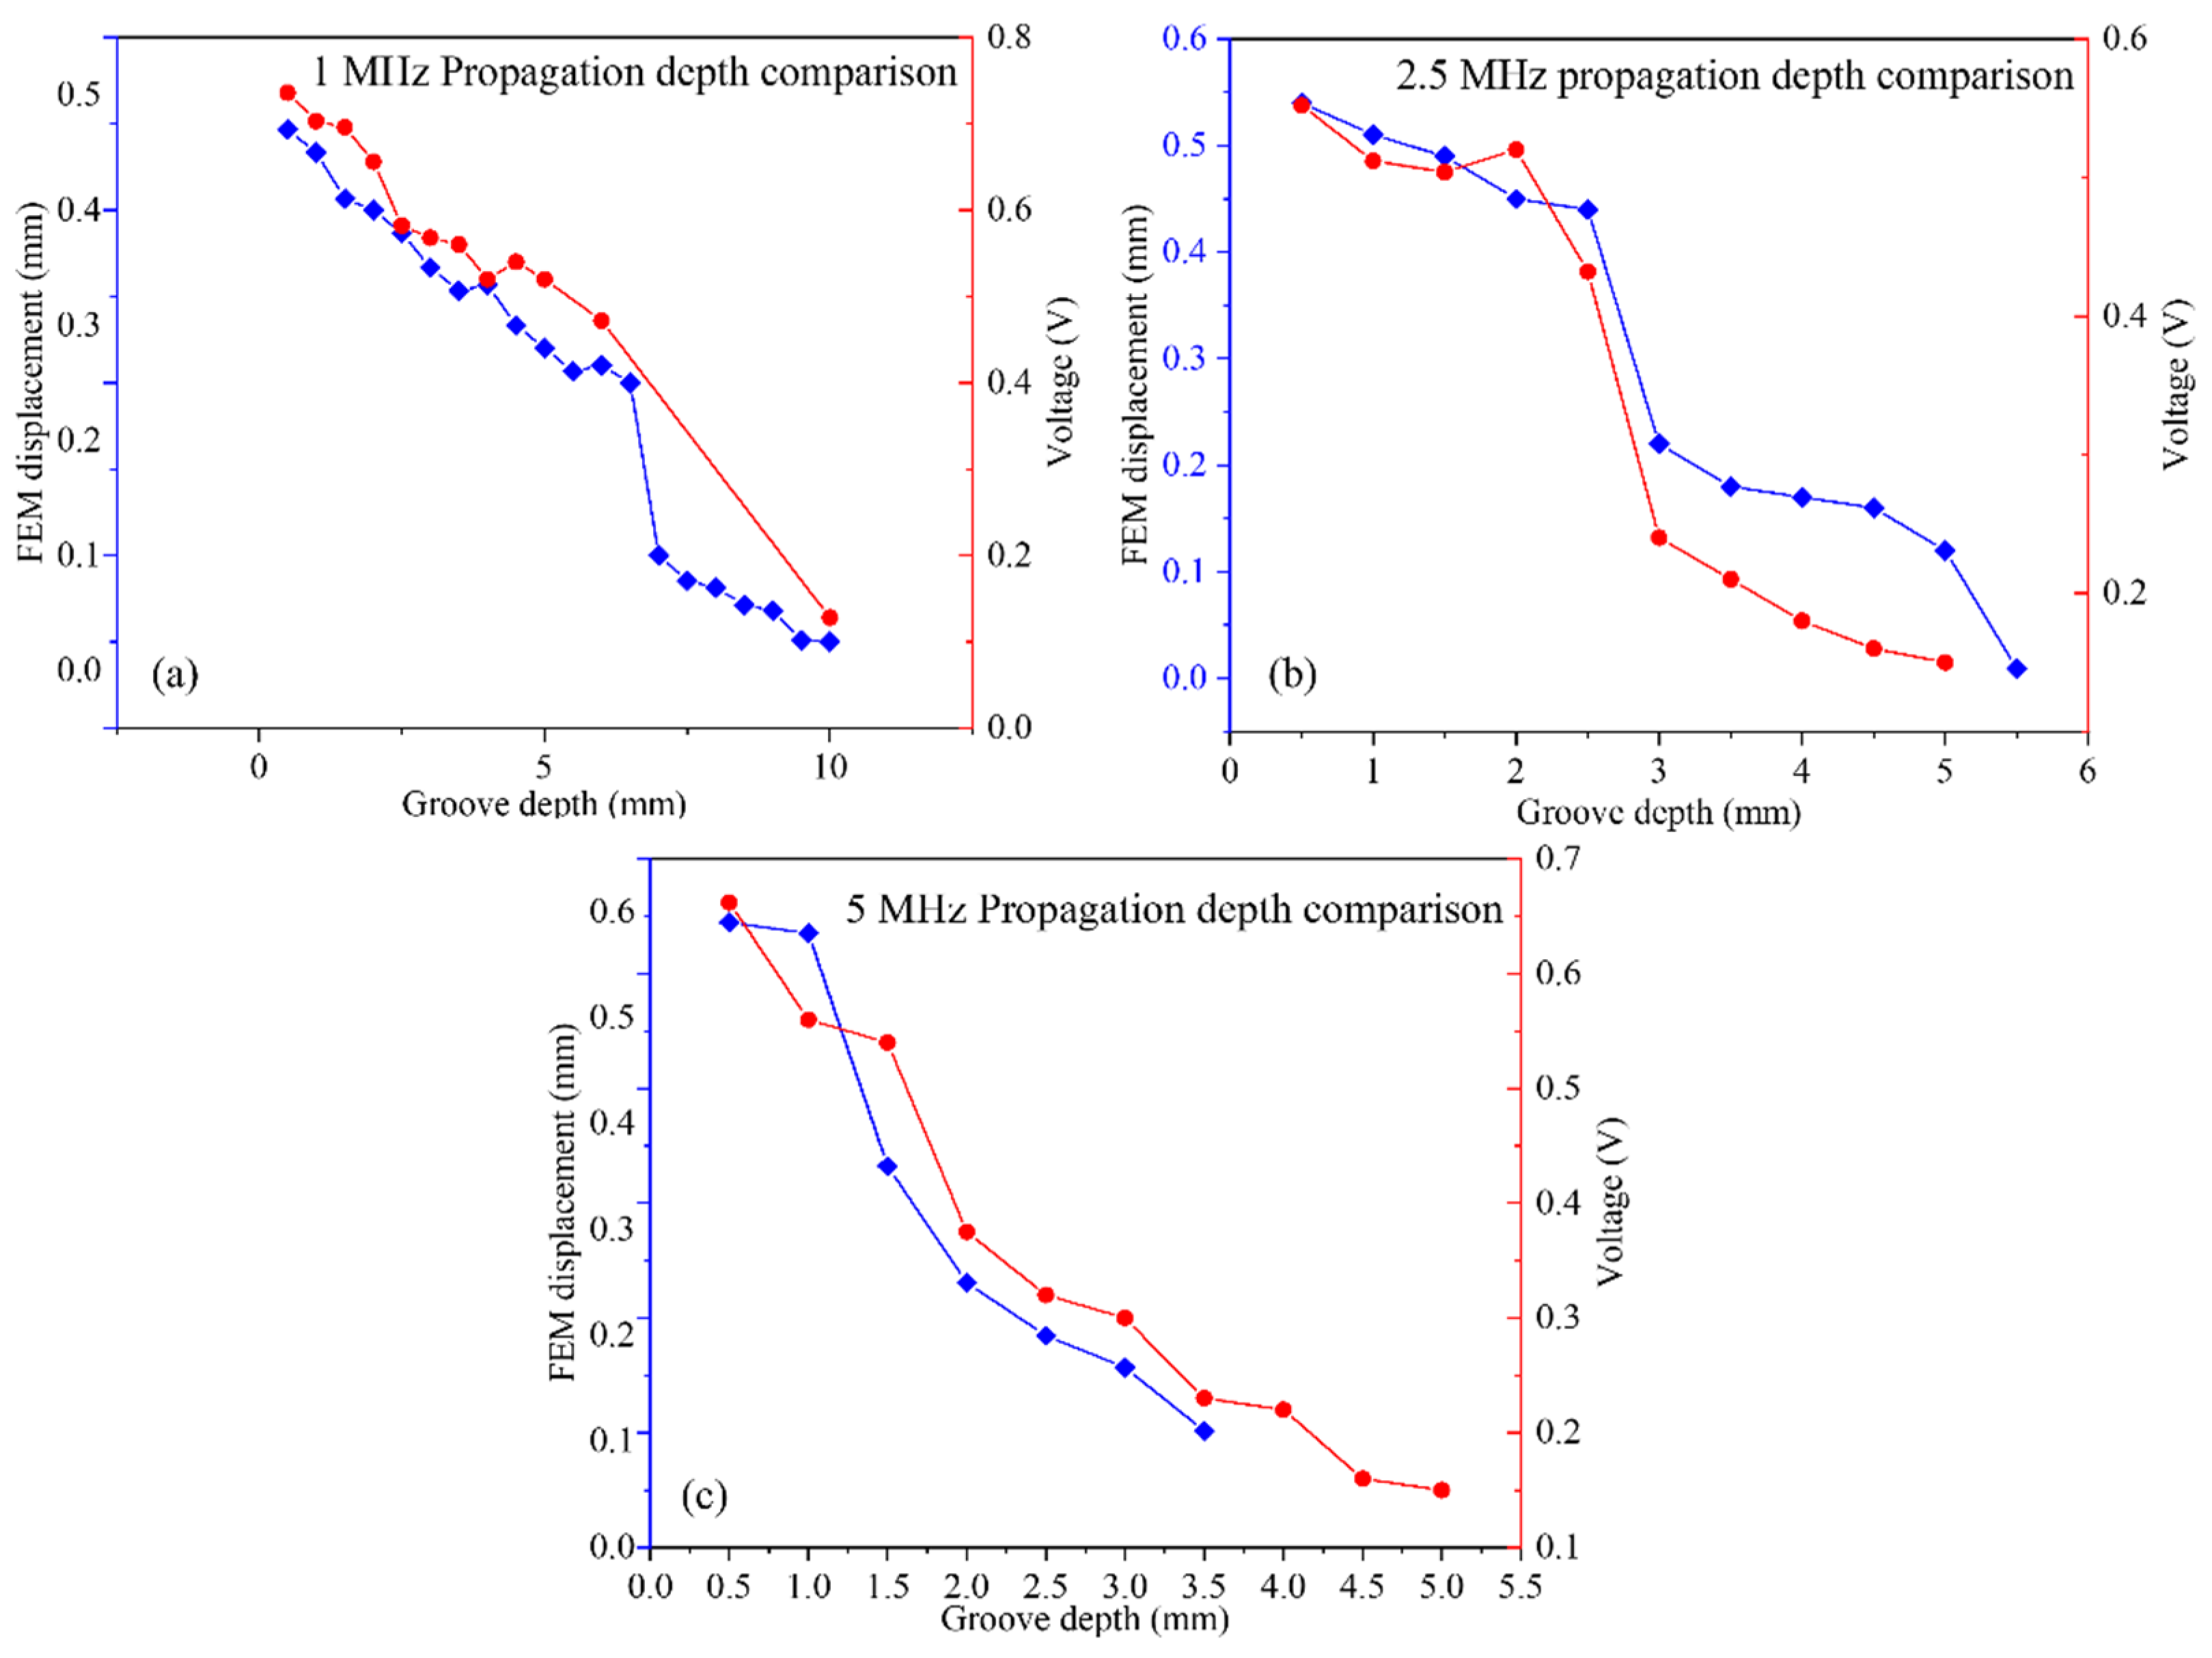
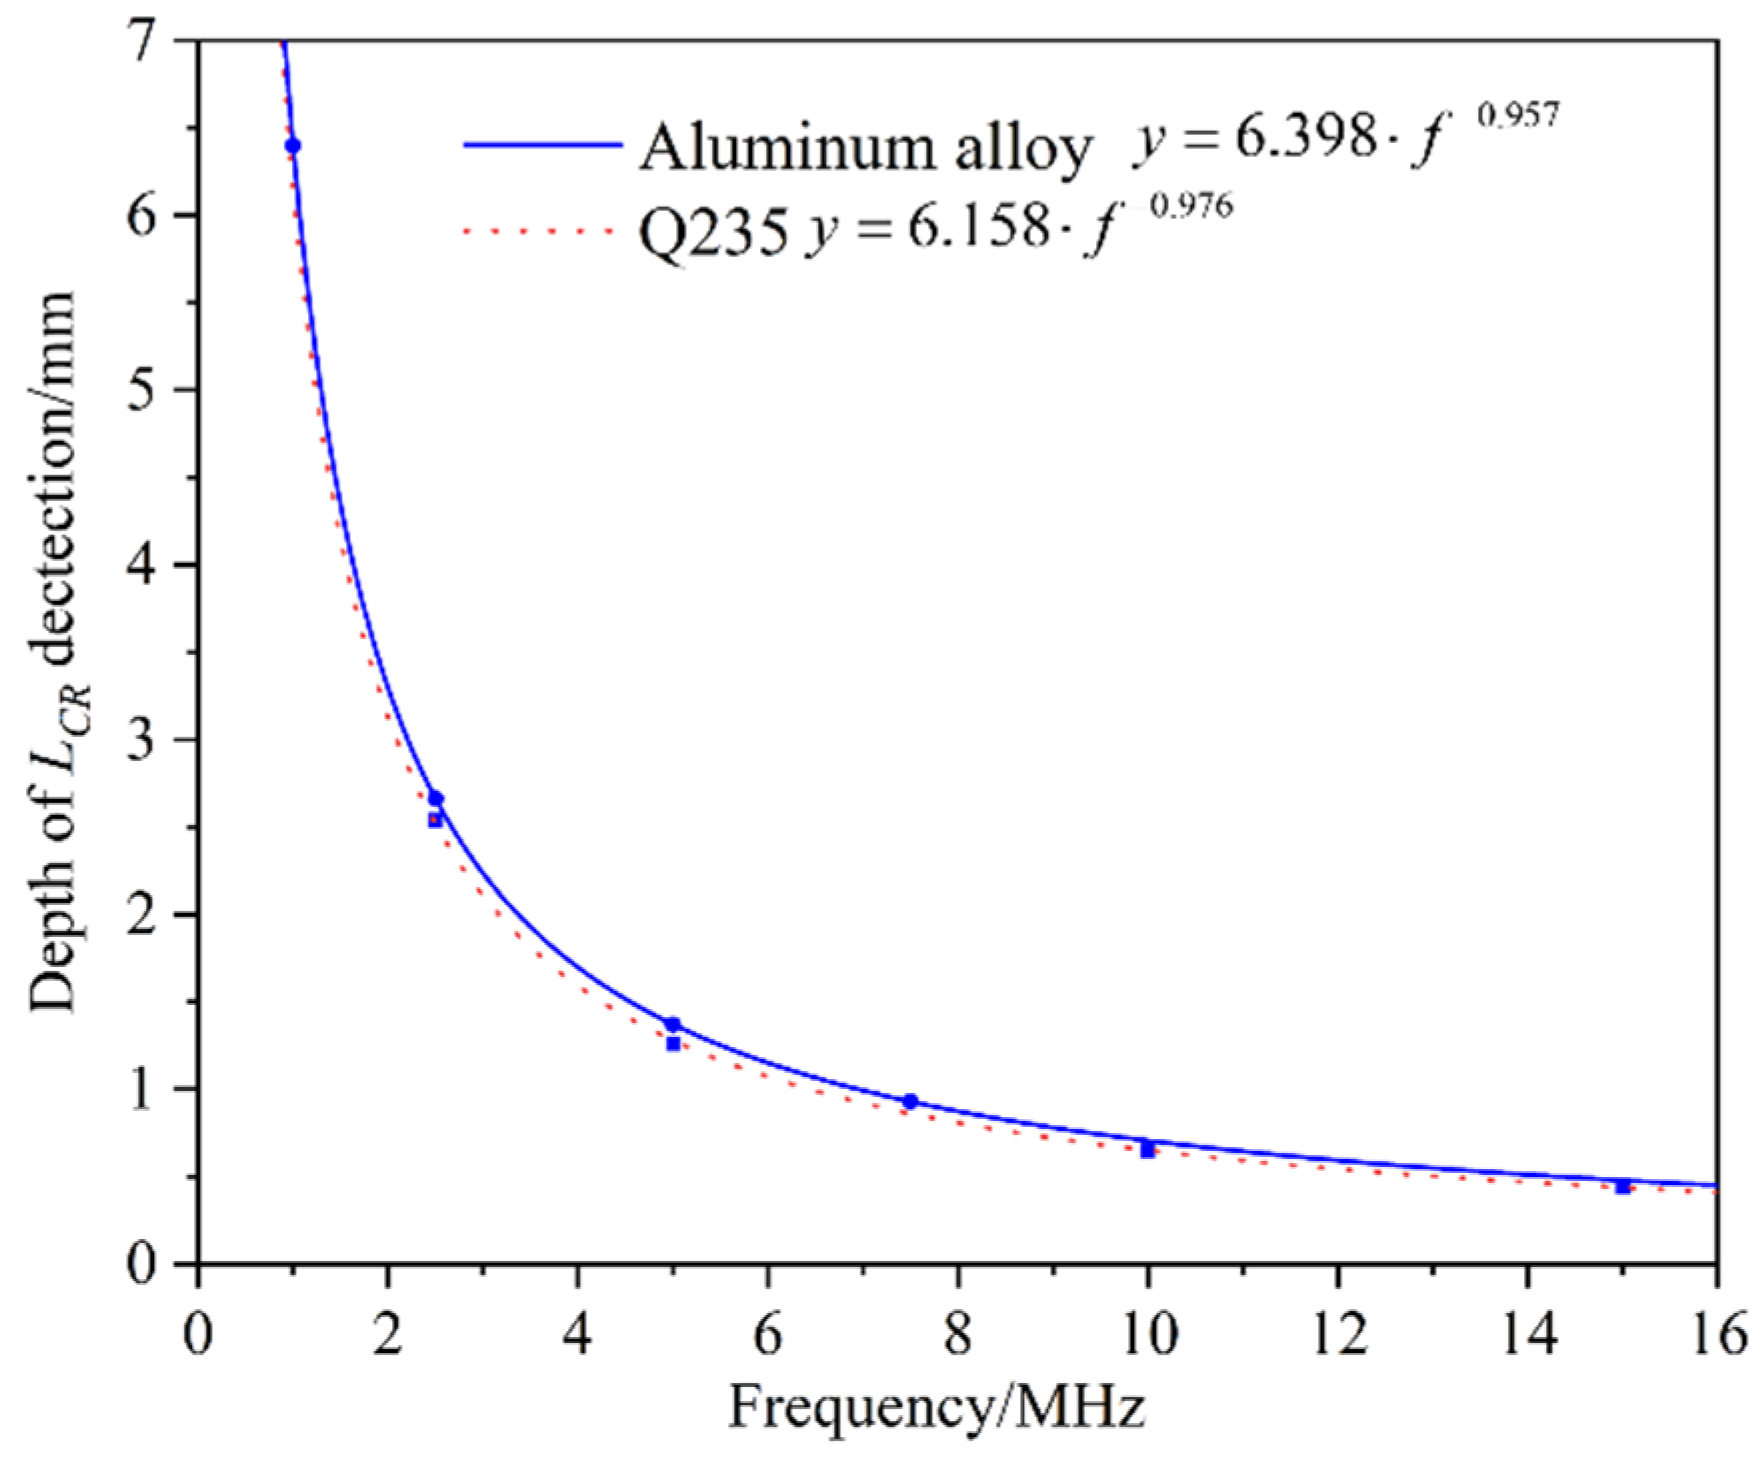
4.2. Propagation Depth Behaviors of the LCR Waves

In the experiment, ultrasonic transducers with three different frequencies (1, 2.5, and 5 MHz) were used to test the two aluminum alloy blocks in turn. During the experiment, detection probes consisting of transducers with center frequencies of 1, 2.5, and 5 MHz were securely coupled in sequence to the surface of the test block, and the two transducers of the detection probe were placed on the two sides of the milled groove on the test block. The excitation signal and received signal were obtained with the oscilloscope. Figure 9 shows the waveform of the 2.5 MHz transducers.
The experimental waveforms showed that, as the depth of the milled groove increased, the received echo signals had a downward trend to varying degrees. To evaluate the attenuation of the voltage signal intuitively and effectively, a drop of −6 dB in amplitude was used as the reference standard. When the voltage amplitude was −6 dB less than the signal amplitude corresponding to a groove depth of 0.5 mm, then the LCR waves were regarded as ineffective for detecting residual stress at this depth. At a milled groove depth of 3 mm, the intensity of the LCR wave signal received by the 2.5 MHz detection probe showed a very pronounced drop. Thus, we concluded that the effective propagation depth of the 2.5 MHz LCR wave did not exceed 3 mm.
As shown in Figure 10, the peak values of the LCR wave signals at different depths and for different frequencies were quantified and compared to the simulated amplitude. For each frequency, the amplitude of the LCR wave received by the detection probe showed a cliff-like downward drop at a certain depth of the milled groove. For the 1 MHz transducer, the peak value of the received signal decreased sharply when the groove depth was 10 mm. Similarly, for the 2.5 and 5 MHz transducers, the peak values of the echo signals dropped sharply at groove depths of 2.5~3 mm and 1.5~2 mm, respectively. The simulation results are consistent with the experimental results; for ultrasonic transducers with different frequencies, there was a certain depth beyond which the effectiveness of detection of the LCR wave became rather limited.

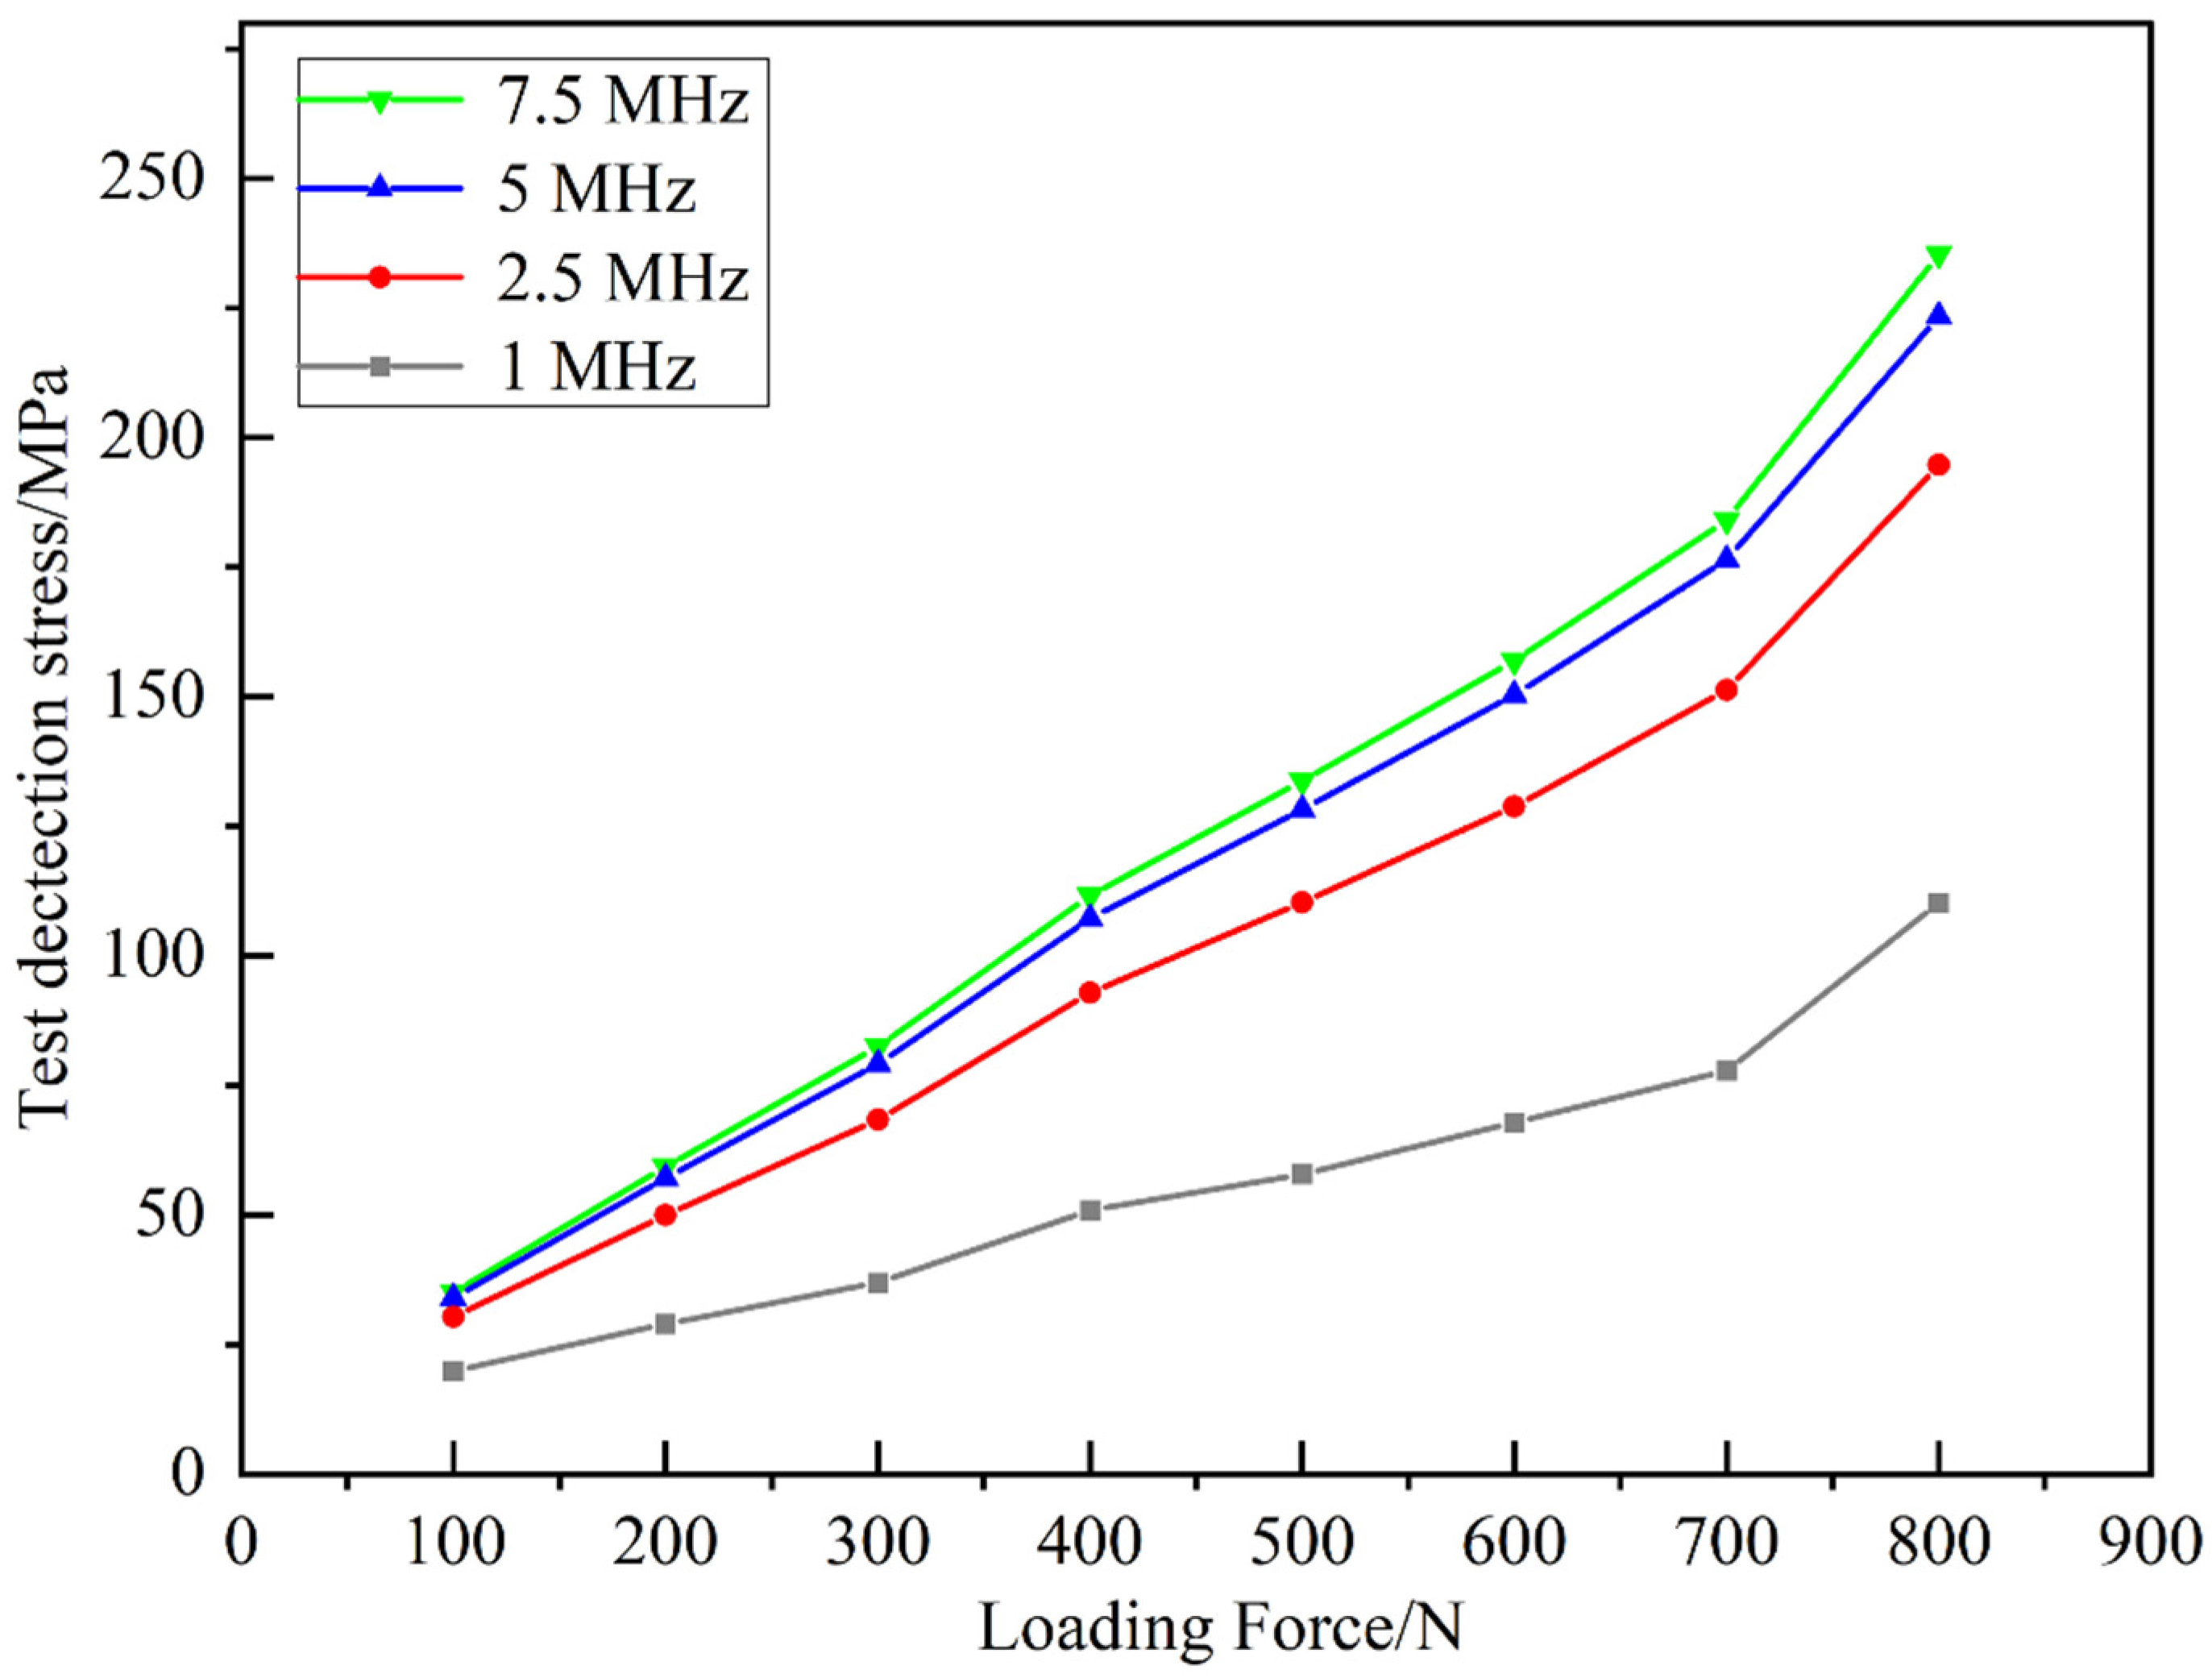
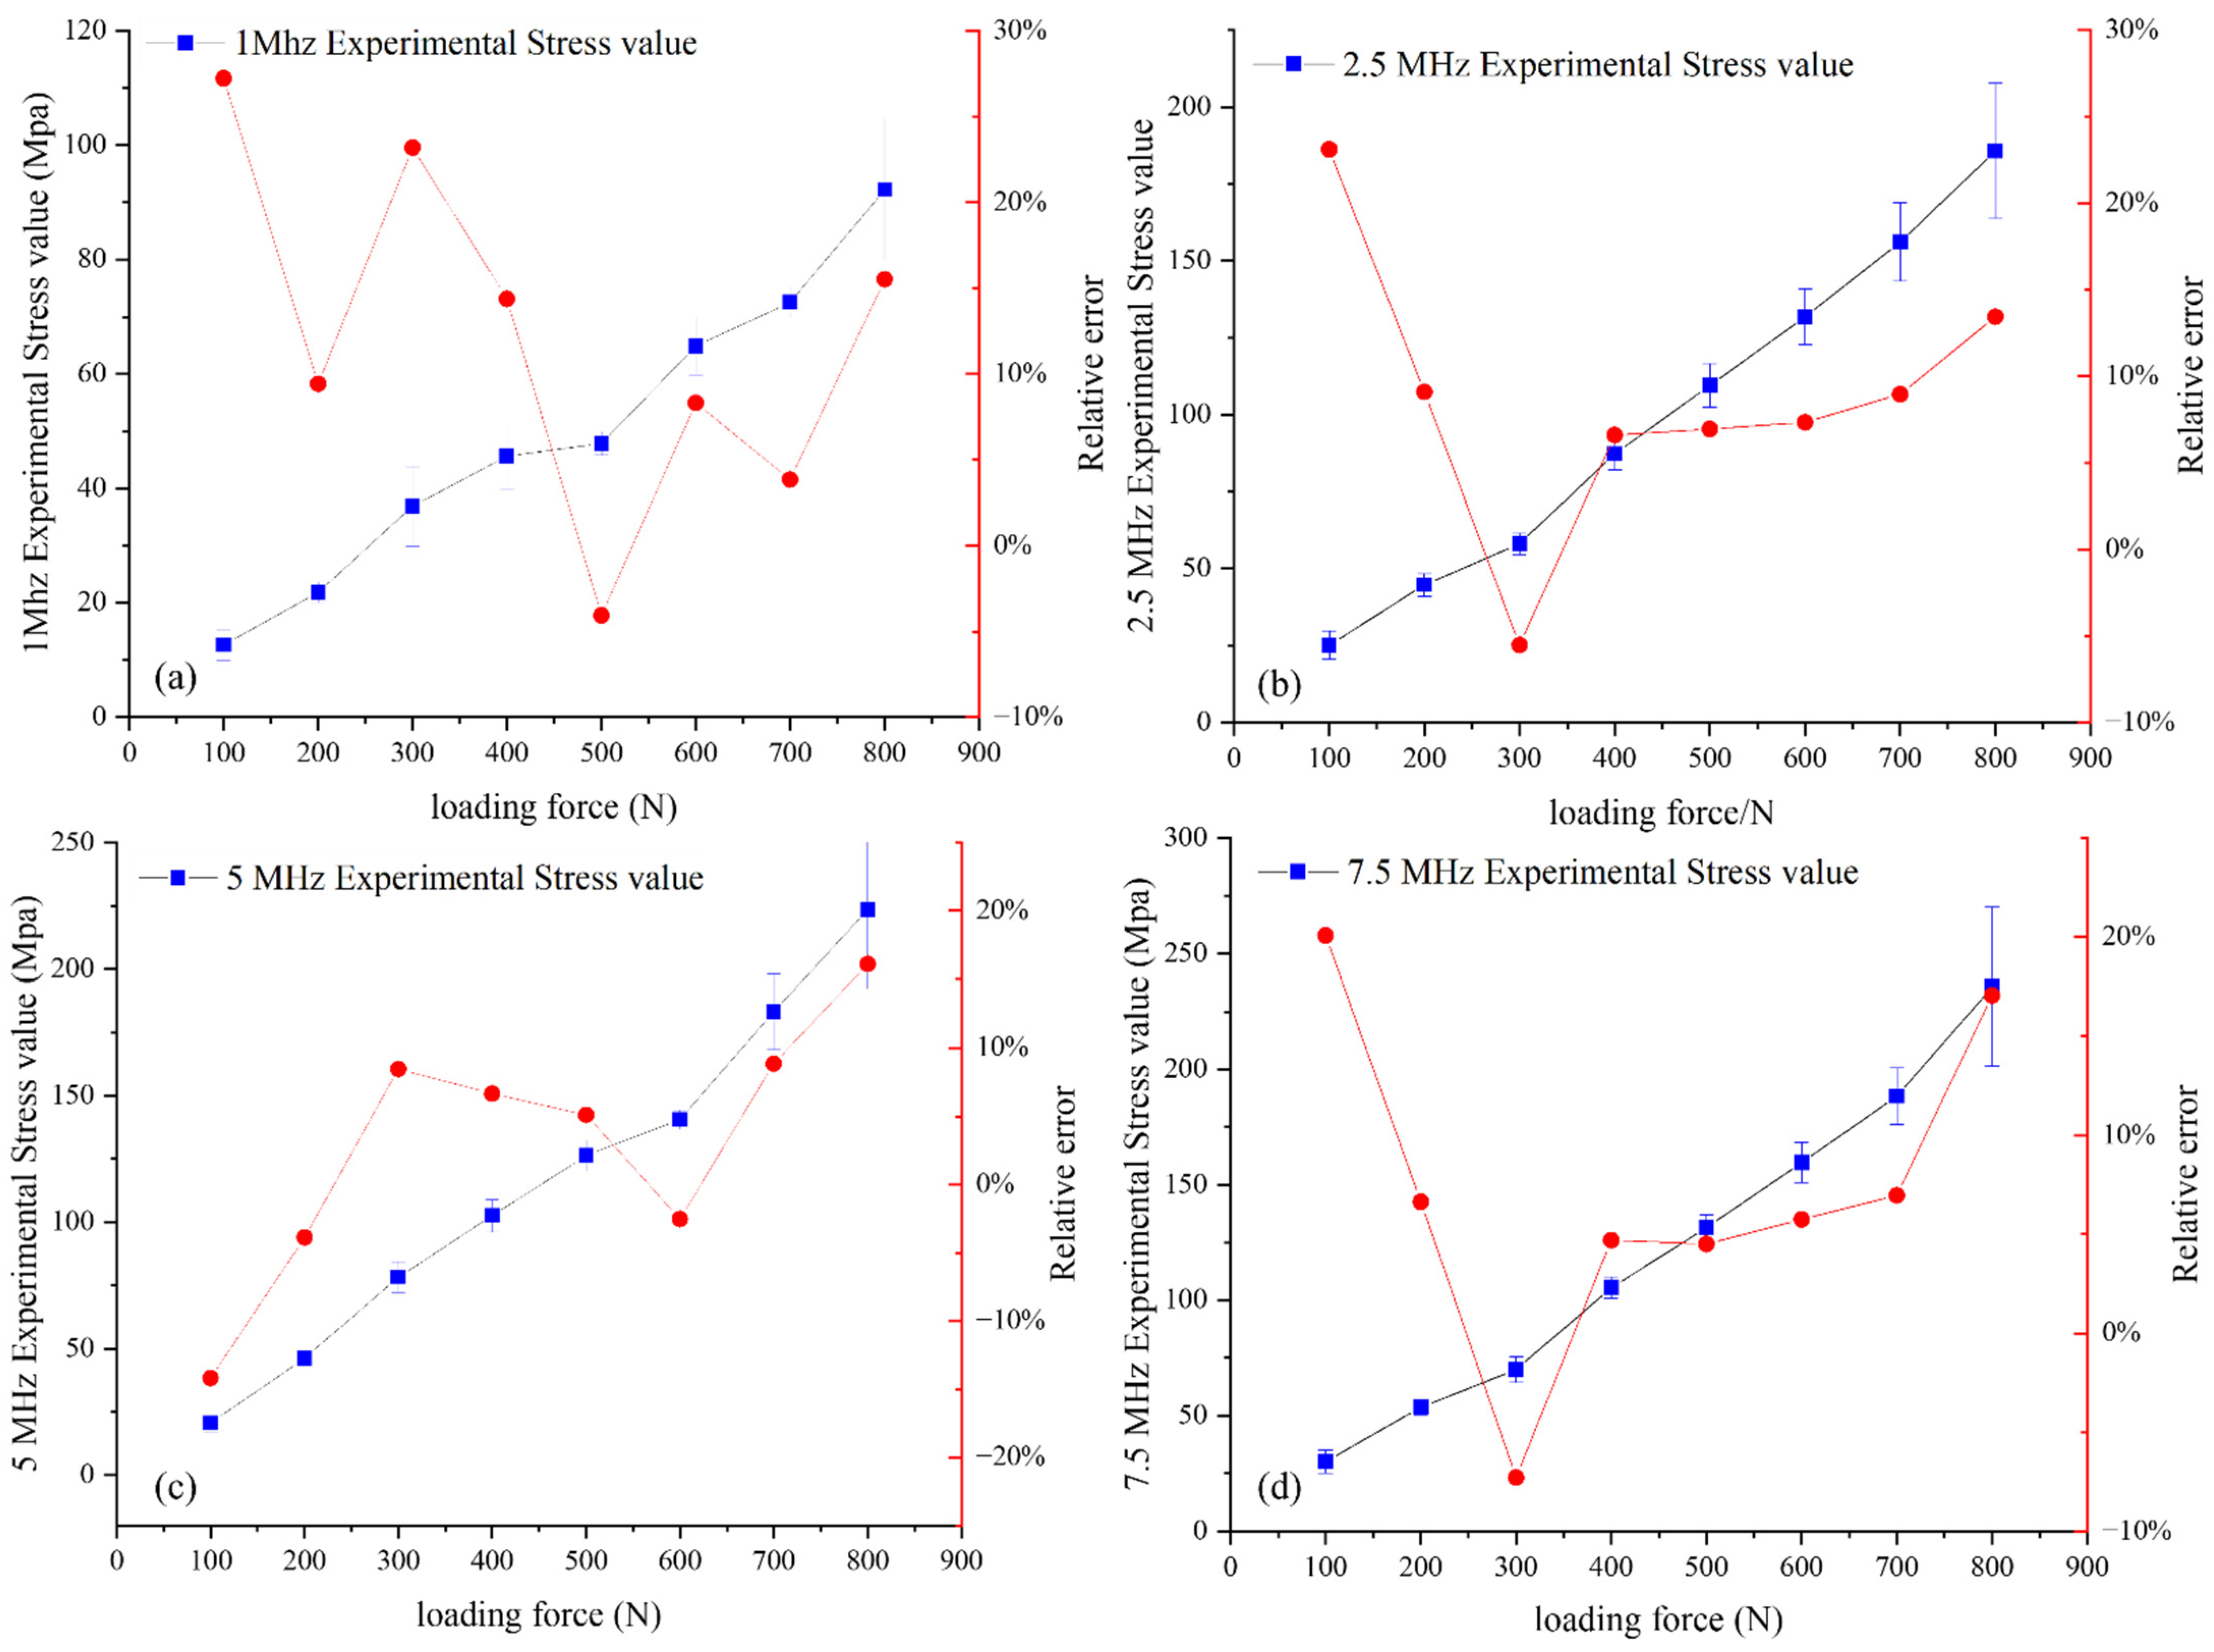
4.3. Multi-Frequency LCR Waves Testing Results of Stress Distribution at Different Depths

We processed the calculation results for the different loading forces and obtained the stress distribution curves under different applied loads. The results are shown in Figure 11.
As shown in Figure 11, as the load force increased, so did the stress generated inside the cantilever beam. At a thickness of 5 mm, the stress at the neutral layer was almost zero, which was consistent with the theory.
We conducted stress tests on the cantilever beam at different loads; the detection position was the same as the stress extraction position in the finite element simulations. During the experiment, the system was first used to perform zero-stress calibration at the detection position before the screw bolt was tightened. The state before the force that was applied to the cantilever beam was regarded as a state of zero stress. Advancing the screw caused the head of the screw bolt to generate pressure on the cantilever and produced a normal stress distribution in the depth direction of the cantilever. The system was then used to measure the stress at the detection position. In this experiment, four groups of detection probes with the commonly used frequencies of 1, 2.5, 5, and 7.5 MHz were used to detect the normal stress in different depth ranges of the cantilever beam with applied pressures in the range of 100 to 800 N.
Based on the experimental design, detection probes with the above four commonly used frequencies were used to acquire the stress values at the detection position when the loading forces were 100, 200, 300, 400, 500, 600, 700, and 800 N. Figure 12 shows the obtained detection results.
Based on the stress distribution curve of the cantilever beam calculated from the simulation results, we obtained the average stress values at different depths from the surface and compared them to the measured stress values. The comparison results of the two are shown in Table 3.
Based on the above stress value comparison table, a correlation curve between the loading force and stress for the different detection frequencies was plotted. At the same time, the theoretical values and detection results were compared, as displayed in Figure 13.
Table 3 shows the values detected by the transducers of different frequencies and the simulation results, which indicated that, when using transducers of different frequencies, the detected values gradually increased with increasing loading force. The variation trend of the detected value with the loading force was similar to the theoretical value, and both showed an approximately positive linear correlation. The stress detection values were very consistent with the simulation data; the maximum error was about 30 Mpa, and the minimum error was only 3 Mpa, which shows that the multi-frequency LCR waves could achieve a relatively accurate degree of stress detection.
As shown in Figure 13, when the loading force was 100 N, there was a large relative error between the theoretical value and the detected value, which was possibly caused by an error in the ultrasonic detection of small stress. In addition, the result was sensitive to the coupling force of the probe when the stress was small, which could lead to large errors. Moreover, we did not consider the residual stress in the aluminum alloy plate in the simulation, which could also cause the detected value to deviate from the theoretical value.
When the loading force was in the range of 200 N to 600 N, the ultrasonic waves at 2.5, 5, and 7.5 Mhz showed good detection accuracy, but the measurement results at 1Mhz ultrasonic had a large error with the theoretical value. As a result, the received signal may hav been a signal superimposed by the LCR waves and the reflected wave, which had an impact on the detection result. Therefore, 1 Mhz can be selected for the stress evaluation of thick plates, but thin plates will affect the detection accuracy.
For a loading force greater than 700 N, there was a large discrepancy between the detected and theoretical values. This was because, when the loading force exceeded 700 N, the cantilever beam started to show obvious bending and geometric deformation. This prevented the probe wedge (flat wedge) from being perfectly coupled to the surface of the cantilever beam, and as the coupling gap increased, the sound path increased, which eventually led to a larger detection value.
The LCR waves of different frequencies were affected differently in different depths. We also observed that the stress values obtained from the test corresponded to the average value in different depths obtained from the simulation. Based on the comparative simulation and experiment study, the effective depths of 1, 2.5, 5, and 7.5 MHz ultrasonic waves that could detect internal stress were 6.4, 2.66, 1.37, and 0.93 mm, respectively. The coefficients in the empirical formulas given in Ref. [27] have a corresponding relationship with the sound speed of longitudinal waves in the material, but the coefficients have some deviations after fitting. Because the designed test was a curvature test block, the ultrasonic propagation behavior was more complicated than that of a flat test block, and it did not consider the uneven stress distribution in the x-direction. The fitting results of aluminum alloy and Q235 corresponding to the depths of different frequencies are shown in Figure 14.

5. Conclusions

Based on the wave equation and acousto-elastic theory, the process of transmitting ultrasonic waves from a piezoelectric element with a diameter of 5 mm on PMMA, to the generation of LCR after refraction, and then to receiving ultrasonic signals after being blocked by grooves of different depths was simulated. By studying the displacement amplitude of the received signal, the different blocking effects of grooves with different depths on LCR waves of different frequencies were characterized, and the corresponding relationship between the propagation depth and frequency of LCR waves was obtained. The aluminum alloy groove test block was designed and processed to verify the LCR wave data and compared with FEM to verify the accuracy of the LCR wave propagation depth at different frequencies. Finally, according to the LCR stress detection model of different depths, a simply-supported beam structure was proposed, and the normal stress was generated at different depths. The finite element simulation results were compared with the experimental detection, which verified the accuracy of the residual stress detected by the LCR wave, and we obtained the theoretical formula of the corresponding stress depth distribution of LCR at different frequencies in aluminum alloys. The method proposed in this paper was used for the stress measurement of aluminum alloy milled and welded components for aerospace, and this study can serve as a valuable theoretical and technical reference for the measurement of residual stress at different depths in the machining of aluminum alloy components and their subsequent assembly.

Author Contributions

Conceptualization, C.X. and Q.P.; methodology, Y.L.; investigation, Y.L. and D.L.; writing—original draft preparation, Y.L. and D.L.; writing—review and editing, C.X. and Q.P.; project administration, C.X. and Q.P. All authors have read and agreed to the published version of the manuscript.

Funding

This research and publication were supported by the project of Basic Technology Research, which was funded by Technology and Quality Division of the Ministry of Industry and Information Technology (grant no. JSZL2018602C001); The National Natural Science Foundation of China (grant no. 51975050).

Conflicts of Interest

The authors declare no conflict of interest.

References

  1. Sun, Z.C.; Zheng, L.S.; Yang, H. Softening mechanism and microstructure evolution of as-extruded 7075 aluminum alloy during hot deformation. Mater. Charact. 2014, 90, 71–80. [Google Scholar] [CrossRef]
  2. Wang, Y.; Wu, X.; Cao, L.; Tong, X.; Zou, Y.; Zhu, Q.; Tang, S.; Song, H.; Guo, M. Effect of Ag on aging precipitation behavior and mechanical properties of aluminum alloy 7075. Mater. Sci. Eng. A 2020, 804, 140515. [Google Scholar] [CrossRef]
  3. Masoudi Nejad, R.; Sina, N.; Ghahremani Moghadam, D.; Branco, R.; Macek, W.; Berto, F. Artificial neural network based fatigue life assessment of friction stir welding AA2024-T351 aluminum alloy and multi-objective optimization of welding parameters. Int. J. Fatigue 2022, 160, 106840. [Google Scholar] [CrossRef]
  4. Nejad, R.M.; Sina, N.; Ma, W.; Liu, Z.; Berto, F.; Gholami, A. Optimization of fatigue life of pearlitic Grade 900A steel based on the combination of genetic algorithm and artificial neural network. Int. J. Fatigue 2022, 162, 106975. [Google Scholar] [CrossRef]
  5. Shaikh, M.Q.; Berfield, T.A.; Atre, S.V. Residual stresses in additively manufactured parts: Predictive simulation and experimental verification. Rapid Prototyp. J. 2022; ahead-of-print. [Google Scholar] [CrossRef]
  6. Chernov, A.; Eleonsky, S.; Pisarev, V. Influence of stress ratio on residual stress evolution near cold-expanded hole due to low-cycle fatigue by crack compliance data. Frat. Ed Integrità Strutt. 2020, 15, 174–186. [Google Scholar] [CrossRef]
  7. Simson, T.; Emmel, A.; Dwars, A.; Böhm, J. Residual stress measurements on AISI 316L samples manufactured by selective laser melting. Addit. Manuf. 2017, 17, 183–189. [Google Scholar] [CrossRef]
  8. Chighizola, C.R.; D’Elia, C.R.; Weber, D.; Kirsch, B.; Aurich, J.C.; Linke, B.S.; Hill, M.R. Intermethod Comparison and Evaluation of Measured Near Surface Residual Stress in Milled Aluminum. Exp. Mech. 2021, 61, 1309–1322. [Google Scholar] [CrossRef]
  9. Acevedo, R.; Sedlak, P.; Kolman, R.; Fredel, M. Residual stress analysis of additive manufacturing of metallic parts using ultrasonic waves: State of the art review. J. Mater. Res. Technol. 2020, 9, 9457–9477. [Google Scholar] [CrossRef]
  10. Guz, A.N.; Makhort, F.G. The physical fundamentals of the ultrasonic nondestructive stress analysis of solids. Int. Appl. Mech. 2000, 36, 1119–1149. [Google Scholar] [CrossRef]
  11. He, J.; Li, Z.; Teng, J.; Li, M.; Wang, Y. Absolute stress field measurement in structural steel members using the Lcr wave method. Measurement 2018, 122, 679–687. [Google Scholar] [CrossRef]
  12. Pei, C.; Demachi, K. Numerical simulation of residual stress measurement with acoustic wave. E-J. Adv. Maint. 2011, 2, 160–167. [Google Scholar]
  13. Ramasamy, R.; Ibrahim, Z.; Chai, H.K. Numerical investigations of internal stresses on carbon steel based on ultrasonic LCR waves. J. Phys. Conf. Ser. 2017, 908, 012044. [Google Scholar] [CrossRef]
  14. Javadi, Y.; Azari, K.; Ghalehbandi, S.M.; Roy, M.J. Comparison between using longitudinal and shear waves in ultrasonic stress measurement to investigate the effect of post-weld heat-treatment on welding residual stresses. Res. Nondestr. Eval. 2017, 28, 101–122. [Google Scholar] [CrossRef]
  15. Javadi, Y.; Pirzaman, H.S.; Raeisi, M.H.; Najafabadi, M.A. Ultrasonic inspection of a welded stainless steel pipe to evaluate residual stresses through thickness. Mater. Des. 2013, 49, 591–601. [Google Scholar] [CrossRef]
  16. Zhan, Y.; Liu, C.; Zhang, J.J.; Mo, G.Z.; Liu, C.S. Measurement of residual stress in laser additive manufacturing TC4 titanium alloy with the laser ultrasonic technique. Mater. Sci. Eng. A 2019, 762, 138093. [Google Scholar] [CrossRef]
  17. Zhan, Y.; Xu, H.; Du, W.; Liu, C. Research on the influence of heat treatment on residual stress of TC4 alloy produced by laser additive manufacturing based on laser ultrasonic technique. Ultrasonics 2021, 115, 106466. [Google Scholar] [CrossRef] [PubMed]
  18. Ma, Y.; Hu, Z.; Tang, Y.; Ma, S.; Chu, Y.; Li, X.; Luo, W.; Guo, L.; Zeng, X.; Lu, Y. Laser opto-ultrasonic dual detection for simultaneous compositional, structural, and stress analyses for wire + arc additive manufacturing. Addit. Manuf. 2019, 31, 100956. [Google Scholar] [CrossRef]
  19. Zhu, Y.; Zhao, H.; Song, C.; Hu, B. The Measurement of Acoustoelastic Constant to evaluate Stress by UsingUltrasonic Waves. J. Phys. Conf. Ser. 2020, 1486, 072057. [Google Scholar] [CrossRef]
  20. Mohammadi, M.; Fesharaki, J.J. Determination of acoustoelastic/acoustoplastic constants to measure stress in elastic/plastic limits by using LCR wave. NDT E Int. 2019, 104, 69–76. [Google Scholar] [CrossRef]
  21. Liu, H.; Li, Y.; Li, T.; Zhang, X.; Liu, Y.; Liu, K.; Wang, Y. Influence factors analysis and accuracy improvement for stress measurement using ultrasonic longitudinal critically refracted (LCR) wave. Appl. Acoust. 2018, 141, 178–187. [Google Scholar] [CrossRef]
  22. Li, Y.; Liu, H.; Liu, Y.; Zhang, X.; Wang, Y. In-plane elastic anisotropic constants (IEACs) measurement of rolling aluminum plate at different depth using ultrasonic LCR wave. Appl. Acoust. 2019, 149, 59–67. [Google Scholar] [CrossRef]
  23. Liu, B.; Li, J.; Dong, S.; Shu, F. Correction for microstructure effect on residual stress measurement of SR-FSW joint with Lcr wave. Russ. J. Nondestr. Test. 2020, 56, 131–140. [Google Scholar] [CrossRef]
  24. Javadi, Y.; Hloch, S. Employing the waves to measure longitudinal residual stresses in different depths of a stainless steel welded plate. Adv. Mater. Sci. Eng. 2013, 2013, 746187. [Google Scholar] [CrossRef]
  25. Javadi, Y.; Najafabadi, M.A. Comparison between contact and immersion ultrasonic method to evaluate welding residual stresses of dissimilar joints. Mater. Des. 2013, 47, 473–482. [Google Scholar] [CrossRef]
  26. Javadi, Y.; Plevris, V. Evaluation of welding residual stress in stainless steel pipes by using the Lcr ultrasonic waves. In Proceedings of the 3rd South-East European Conference on Computational Mechanics—SEECCM III, Kos Island, Greece, 12–14 June 2013; ECCOMAS. pp. 671–681. [Google Scholar] [CrossRef]
  27. Song, W.; Xu, C.; Pan, Q.; Song, J. Nondestructive testing and characterization of residual stress field using an ultrasonic method. J. Mech. Eng. Chin. Ed. 2016, 29, 365–371. [Google Scholar] [CrossRef]
  28. Sadeghi, S.; Najafabadi, M.A.; Javadi, Y.; Mohammadisefat, M. Using ultrasonic waves and finite element method to evaluate through-thickness residual stresses distribution in the friction stir welding of aluminum plates. Mater. Des. 2013, 52, 870–880. [Google Scholar] [CrossRef]
  29. Liu, Y.; Liu, E.; Chen, Y.; Wang, X.; Sun, C.; Tan, J. Study on propagation depth of ultrasonic longitudinal critically refracted (LCR) wave. Sensors 2020, 20, 5724. [Google Scholar] [CrossRef]
  30. Pei, N.; Zhao, B.; Zhao, X.; Liu, Z.; Bond, L.J. Analysis of the directivity of Longitudinal Critically Refracted (LCR) waves. Ultrasonics 2021, 113, 106359. [Google Scholar] [CrossRef]
  31. Rose, J.L. Ultrasonic Waves in Solid Media; Cambridge University Press: Cambridge, UK, 1999. [Google Scholar]
  32. Hughes, D.S.; Kelly, J.L. Second-Order Elastic Deformation of Solids. Phys. Rev. Ser. I 1953, 92, 1145–1149. [Google Scholar] [CrossRef]
  33. Smith, R.T.; Stern, R.; Stephens, R.W.B. Third-Order Elastic Moduli of Polycrystalline Metals from Ultrasonic Velocity Measurements. J. Acoust. Soc. Am. 1966, 40, 1002–1008. [Google Scholar] [CrossRef]
  34. Yang, S.; Wang, M.; Yang, L. Investigation of Uncertain Factors on Measuring Residual Stress with Critically Refracted Longitudinal Waves. Appl. Sci. 2019, 9, 485. [Google Scholar] [CrossRef]
  35. Sotiropoulos, D.; Ogden, R. Generalized Brewster angle for wave reflection from a fluid-transversely isotropic solid interface. Ultrasonics 1996, 34, 487–489. [Google Scholar] [CrossRef]
Figure 1. Directional relationship between LCR wave propagation and stress in orthogonal coordinates.
Metals 12 01602 g001
Figure 2. Diagram showing the principles of residual stress detection at different depths.
Metals 12 01602 g002
Figure 3. The depth distribution model of horizontal normal stress.
Metals 12 01602 g003
Figure 4. The two-dimensional physical model for LCR wave propagation.
Metals 12 01602 g004
Figure 5. Schematic diagram of cantilever beam stress-loading and measurement.
Metals 12 01602 g005
Figure 6. Horizontal normal stress distribution diagram of the cantilever beam.
Metals 12 01602 g006
Figure 7. Longitudinal critically refracted wave propagation contour (no groove).
Metals 12 01602 g007
Figure 8. x-direction and y-direction displacement–time curves were acquired with a 1 MHz transducer for different groove depths: (a) groove depth of 3 mm, x-direction displacement, y-direction displacement; (b) groove depth of 7 mm, x-direction displacement, y-direction displacement.
Metals 12 01602 g008
Figure 9. Experimental results with a 2.5 MHz center frequency detection transducer.
Metals 12 01602 g009
Figure 10. Comparison of longitudinal critically refracted wave signal amplitude with simulation amplitudes at different frequencies: (a) 1 MHz signal simulation and experimental comparison; (b) 2.5 MHz signal simulation and experimental comparison; (c) 5 MHz signal simulation and experimental comparison.
Metals 12 01602 g010
Figure 11. Distribution curves of cantilever beam stress with depth under different loading forces.
Metals 12 01602 g011
Figure 12. Test results of multi-frequency LCR wave cantilever beam stress loading.
Metals 12 01602 g012
Figure 13. Comparison of theoretical stress and detection values at different detection depths: (a) F = 100 N; (b) F = 300 N; (c) F = 500 N; (d) F = 700 N.
Metals 12 01602 g013
Figure 14. Relationship between the detection depth and the frequency of the LCR wave.
Metals 12 01602 g014
Table 1. Second-order and third-order constants of aluminum alloy.
Material λ (Gpa) μ (Gpa) l (Gpa) m (Gpa) n (Gpa)
Aluminum alloy6225−69−354−206
Table 2. Test material properties.
MaterialElastic Modulus (Gpa)Poisson’s RatioDensity (kg/m3)
Aluminum alloy (2A14)720.332750
PMMA6.10.321160
Table 3. Comparison between the theoretical value of loading stress and the test value.
Frequency1 MHz2.5 MHz5 MHz7.5 MHz
Pressing Force (N)Simulation Value (Mpa)Experimental Value (Mpa)Simulation Value (Mpa)Experimental Value (Mpa)Simulation Value (Mpa)Experimental Value (Mpa)Simulation Value (Mpa)Experimental Value (Mpa)
1009.9212.6220.3925.123.9720.5725.0730.1
20019.9521.8340.9344.6548.1146.2450.3153.65
30029.9336.8761.3957.9972.1678.2675.4769.96
40039.9145.6581.8687.2696.21102.6100.63105.36
50049.8947.86102.33109.44120.27126.39125.79131.46
60059.8764.85122.8131.8144.32140.64150.95159.63
70069.8472.52143.26156.07168.38183.28176.1188.36
80079.8292.2163.72185.7192.43223.45201.26235.61
Corresponding depth6.4 mm2.66 mm1.37 mm0.93 mm
Publisher’s Note: MDPI stays neutral with regard to jurisdictional claims in published maps and institutional affiliations.

