
Design of an Aluminum Alloy Using a Neural Network-Based Model


Abstract
1. Introduction
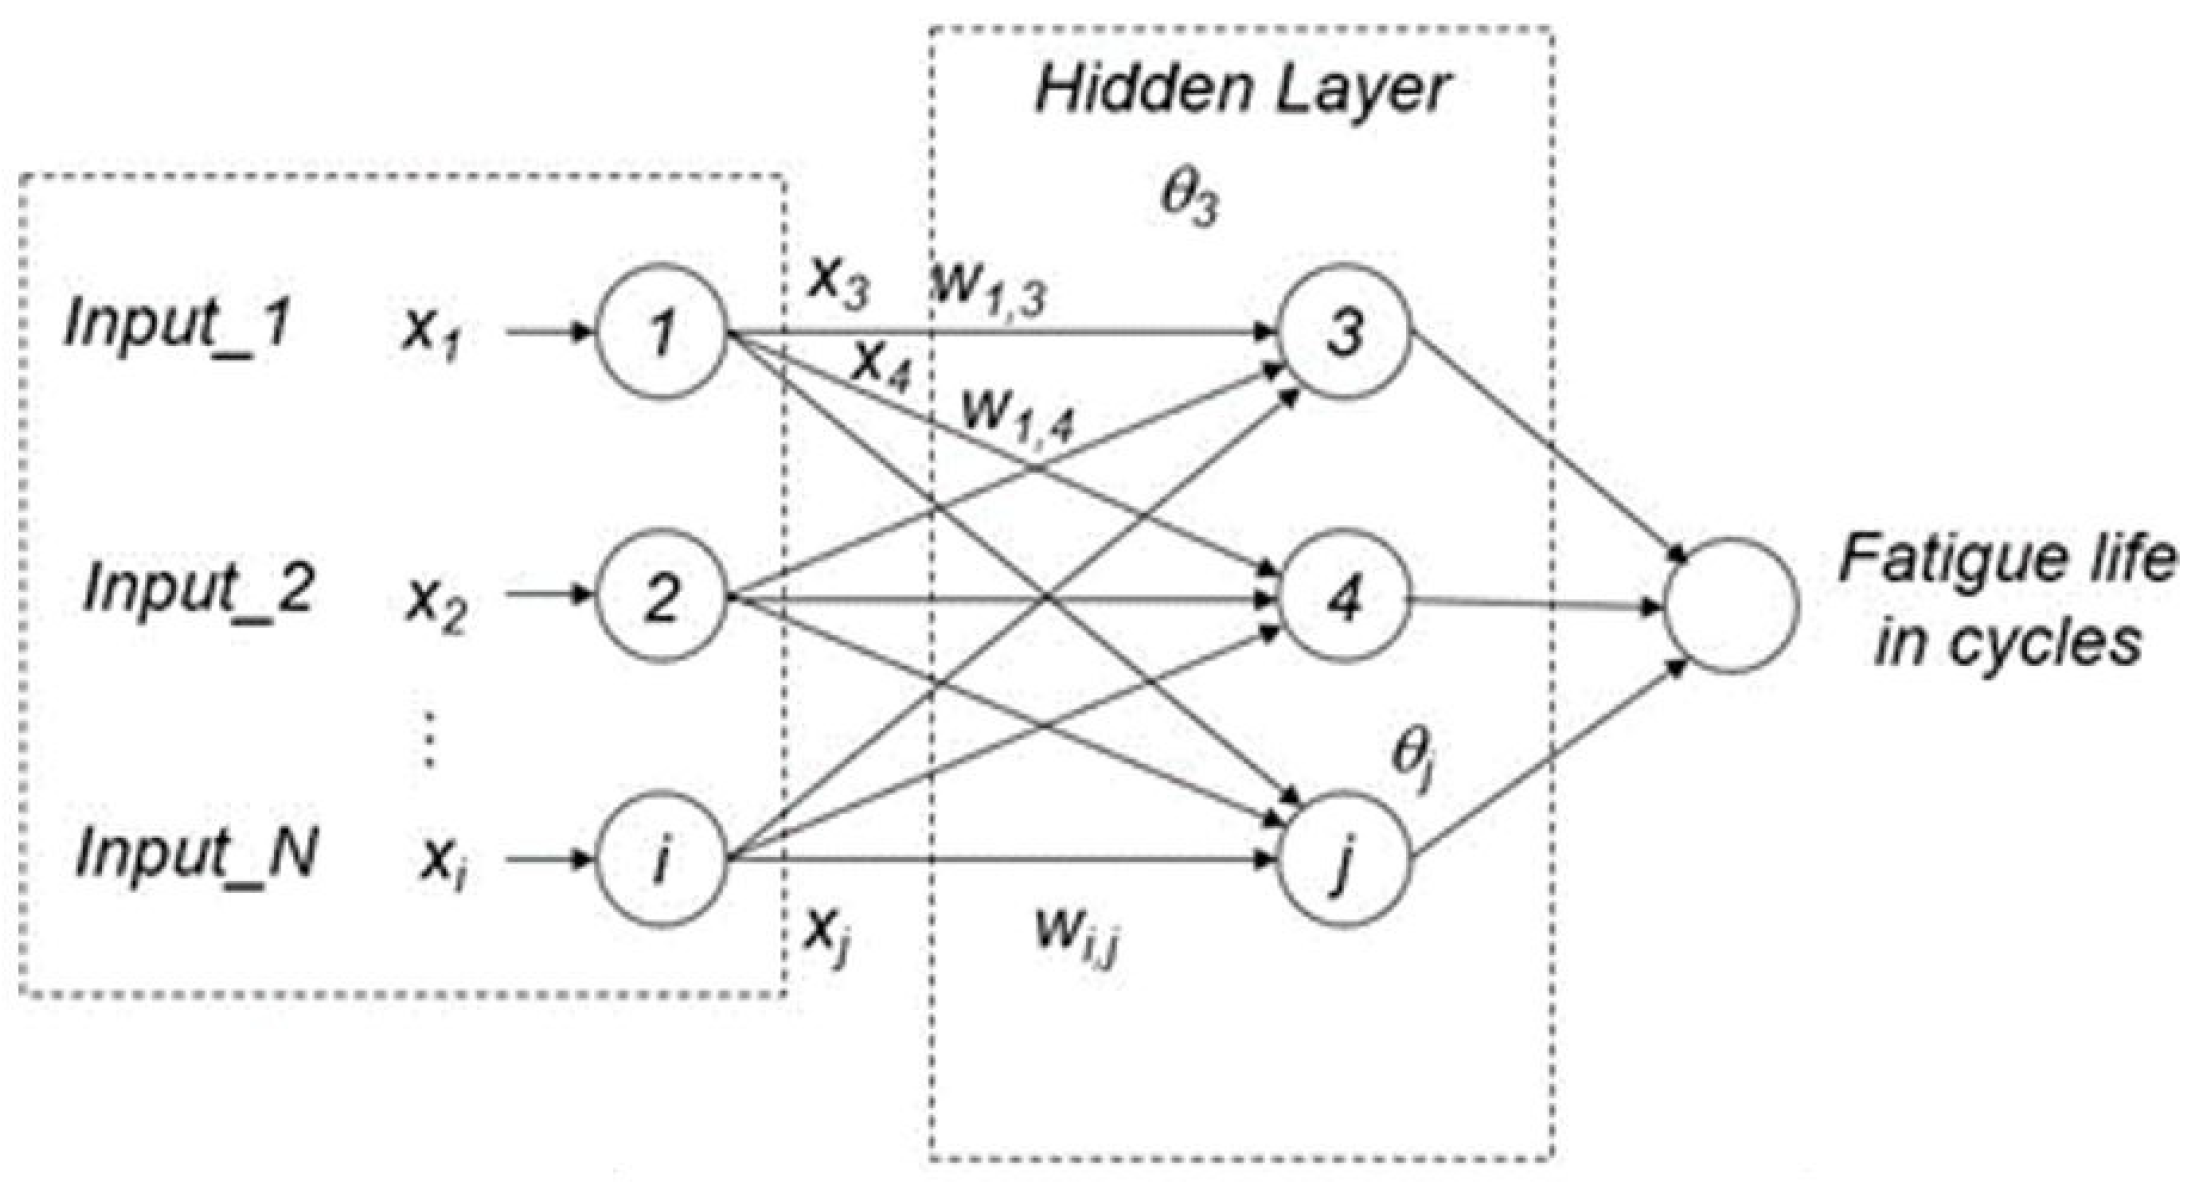
2. Fatigue Life Prediction Using ANN
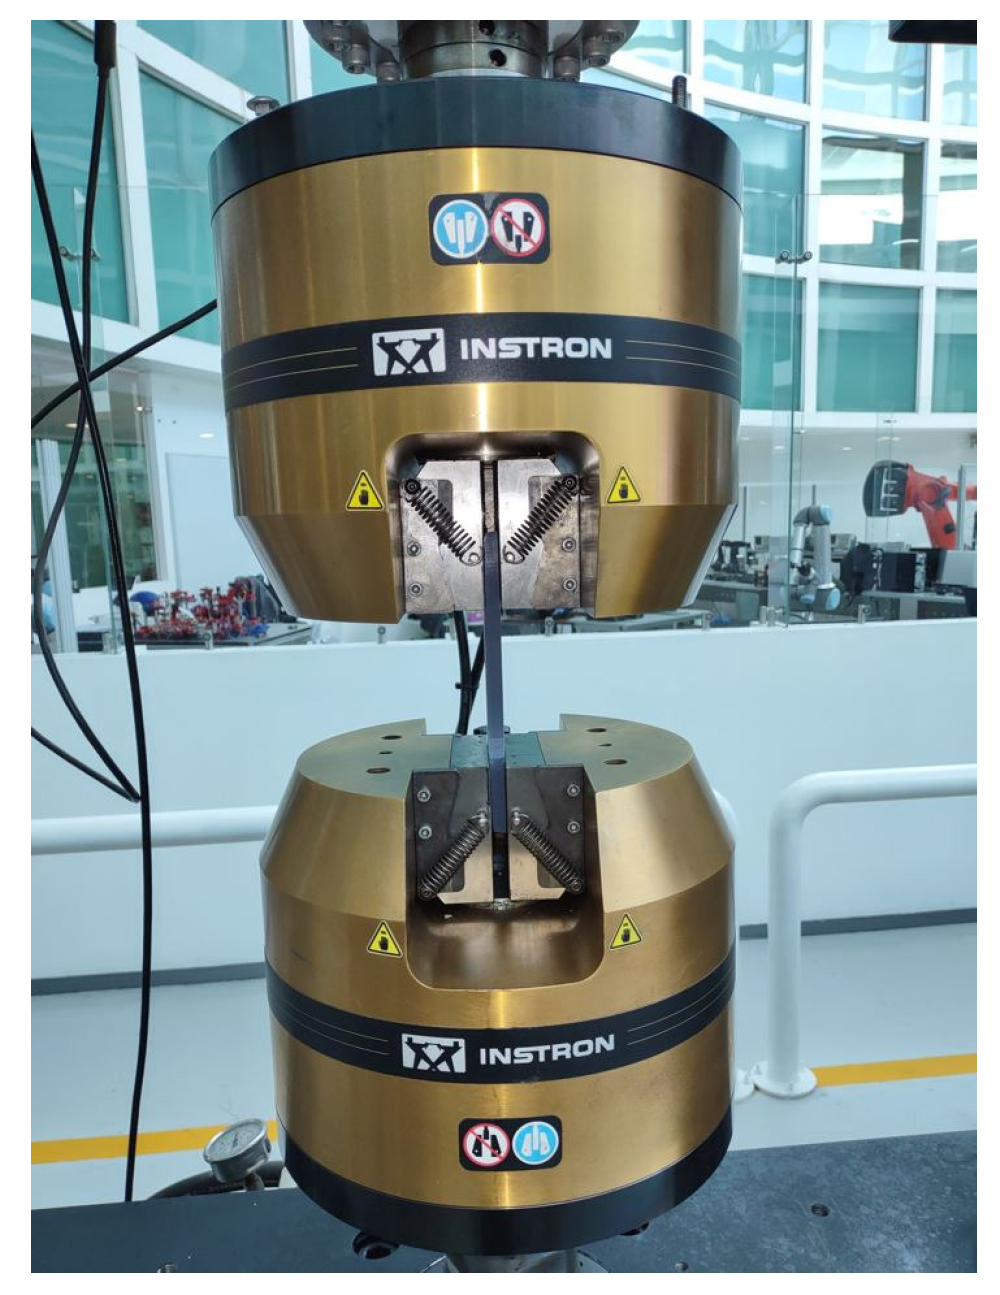
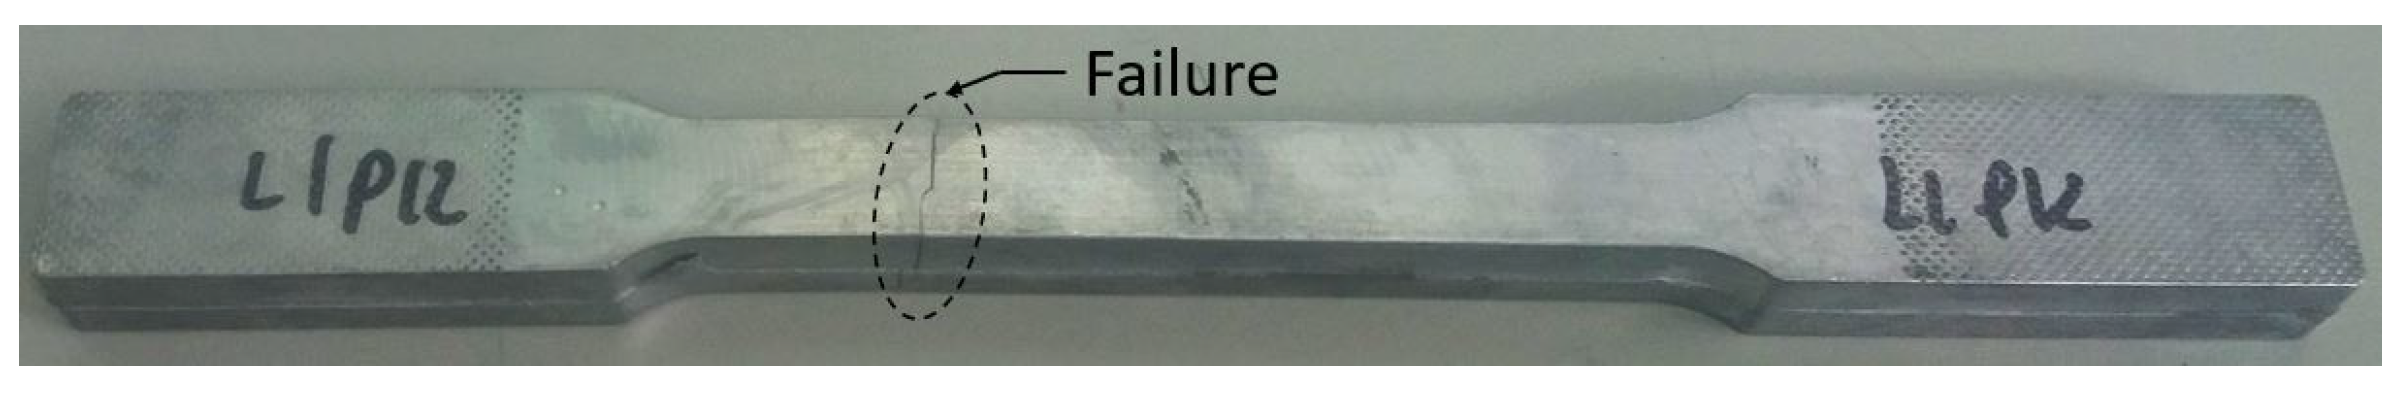
3. Mechanical and Chemical Tests
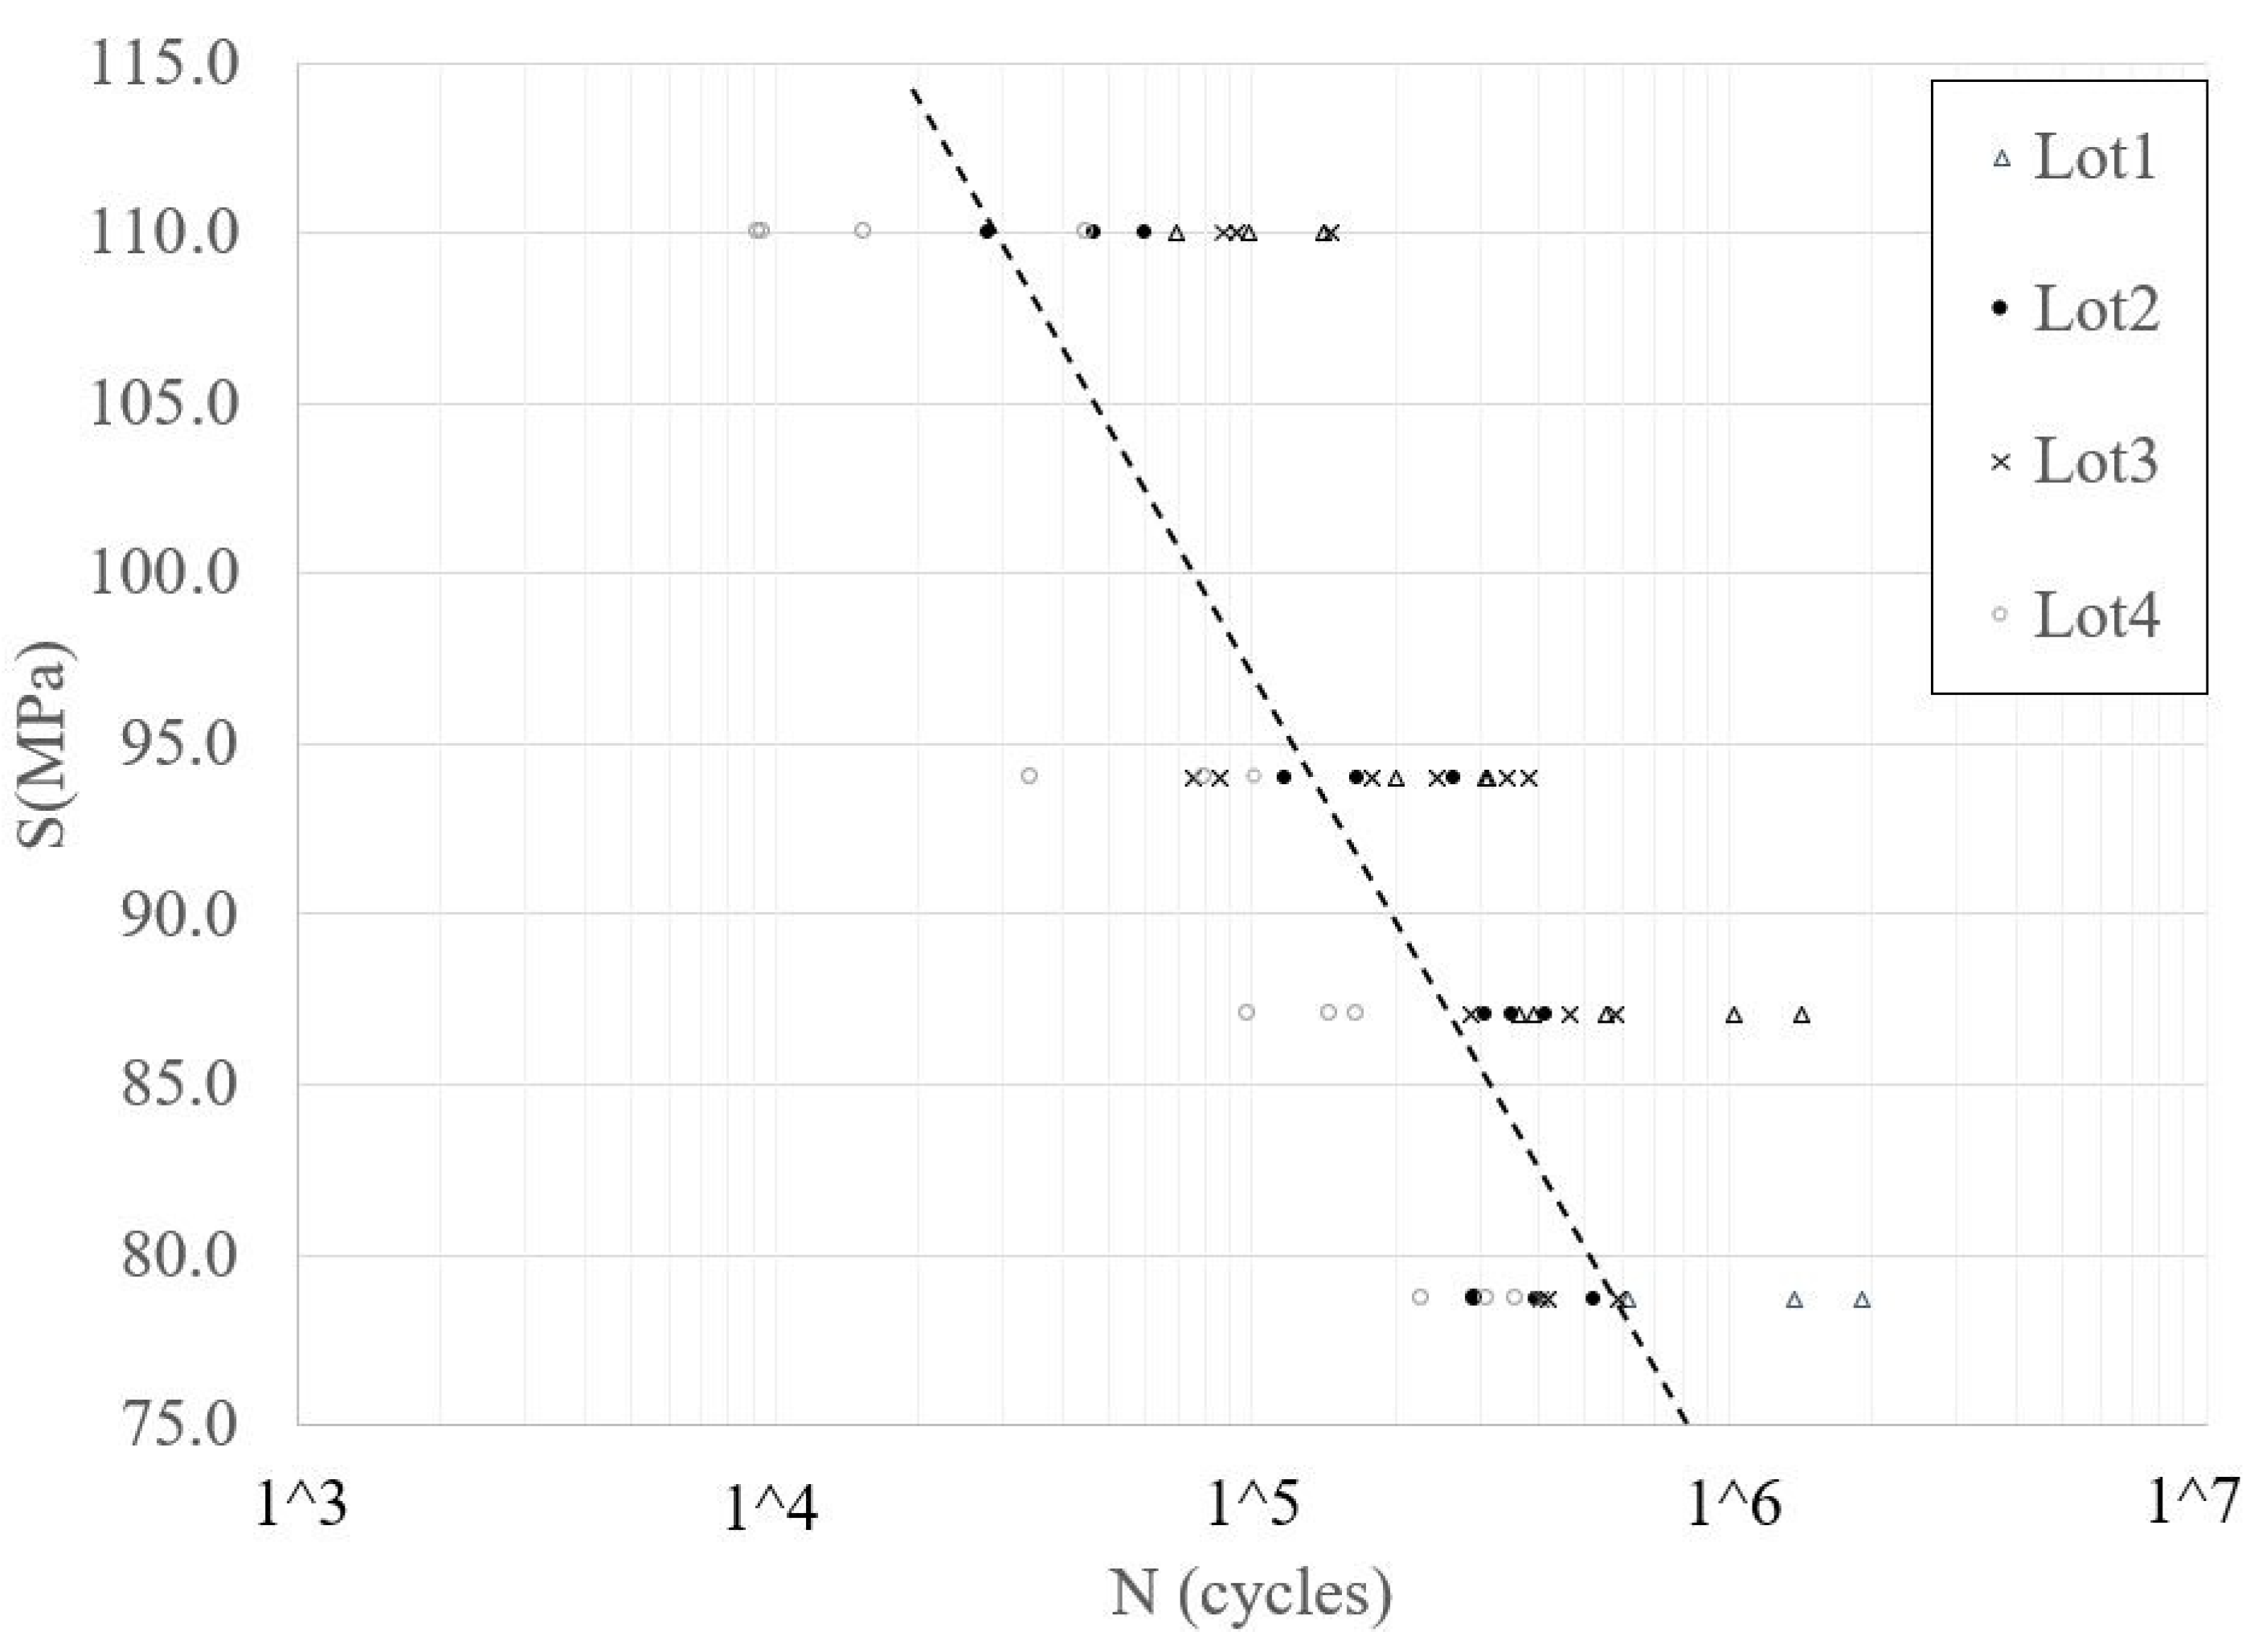
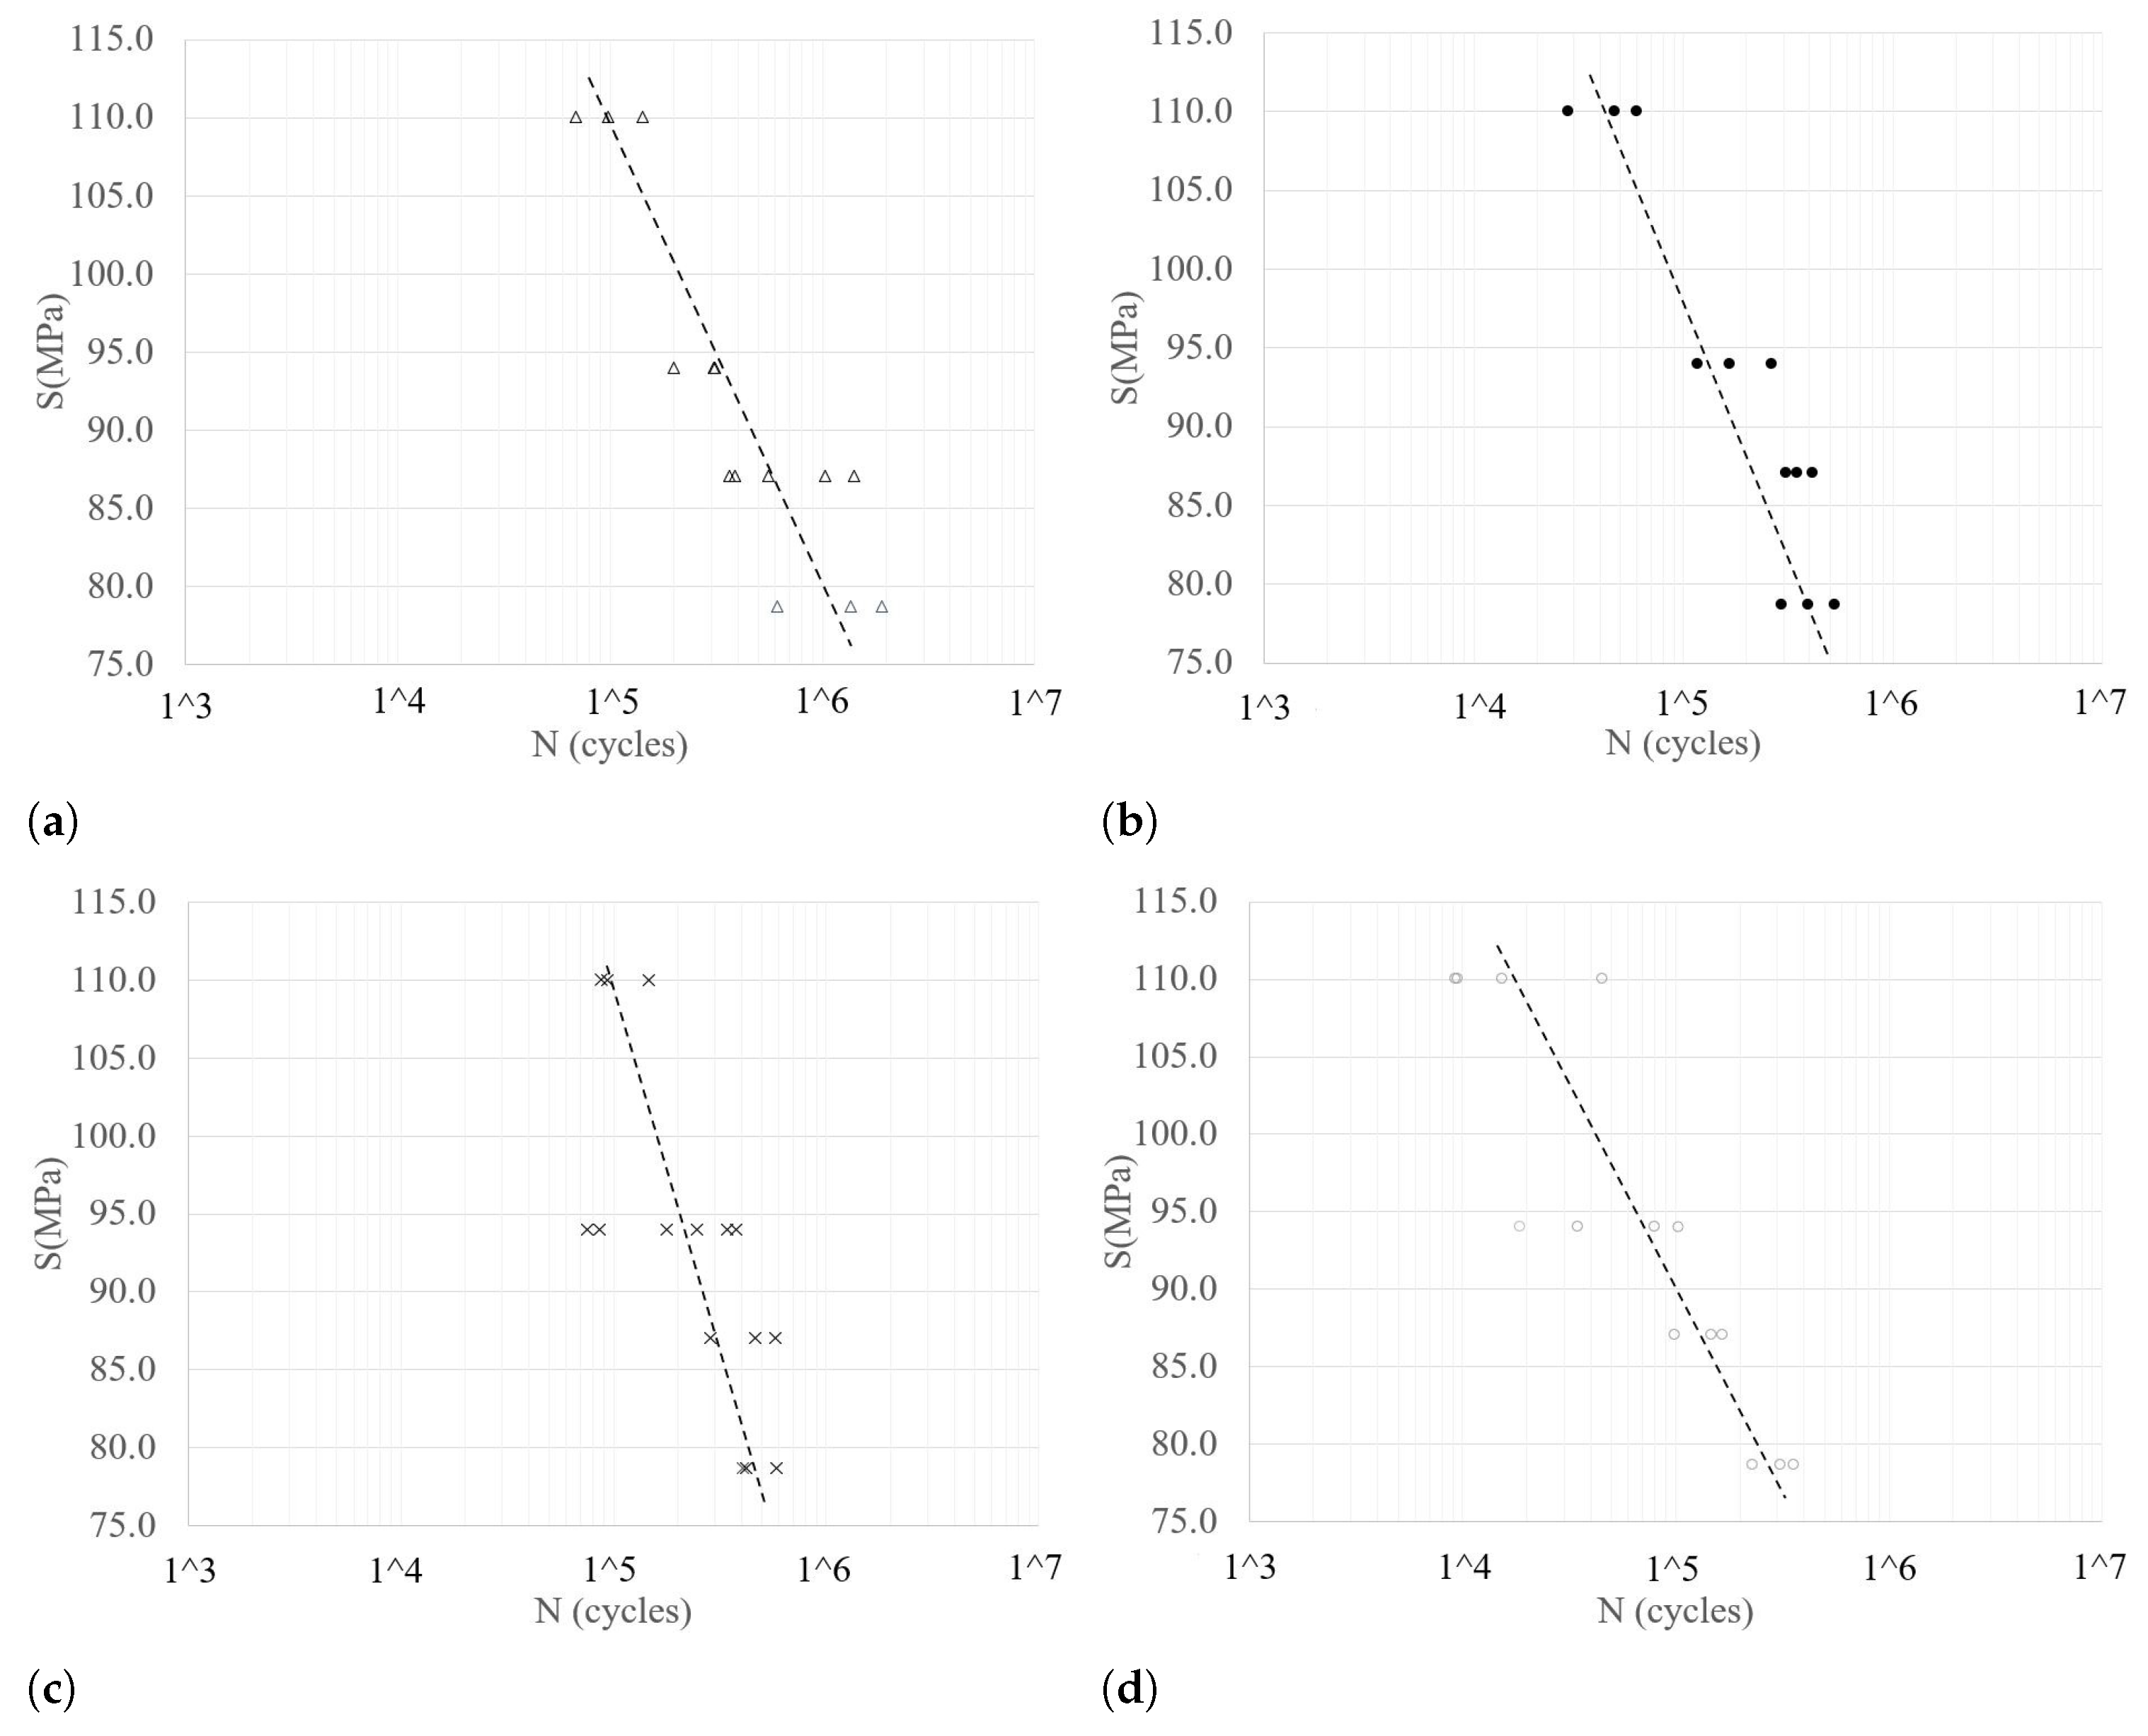
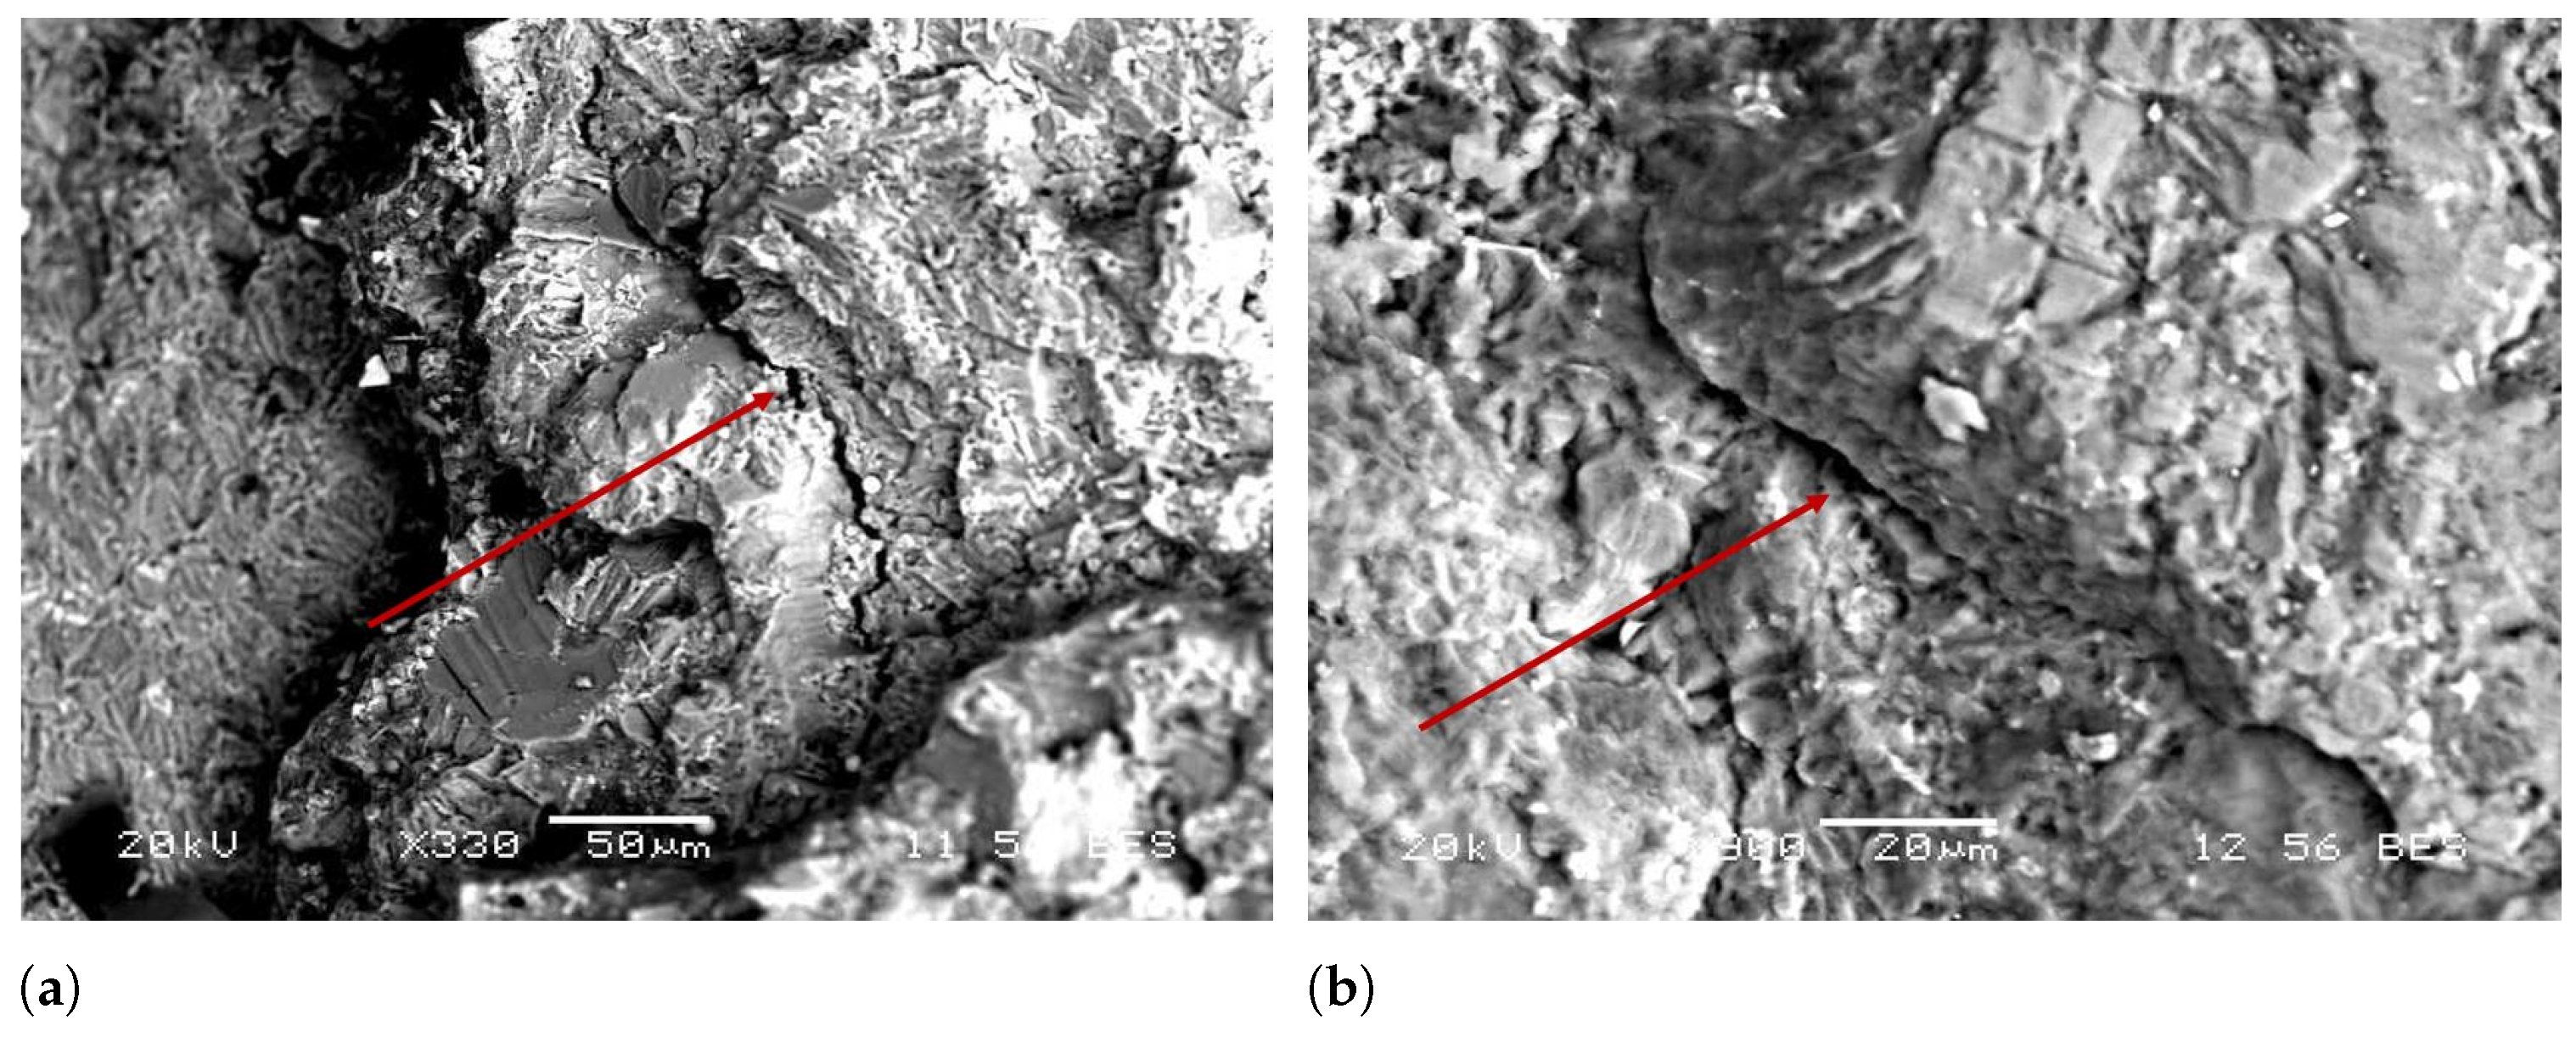
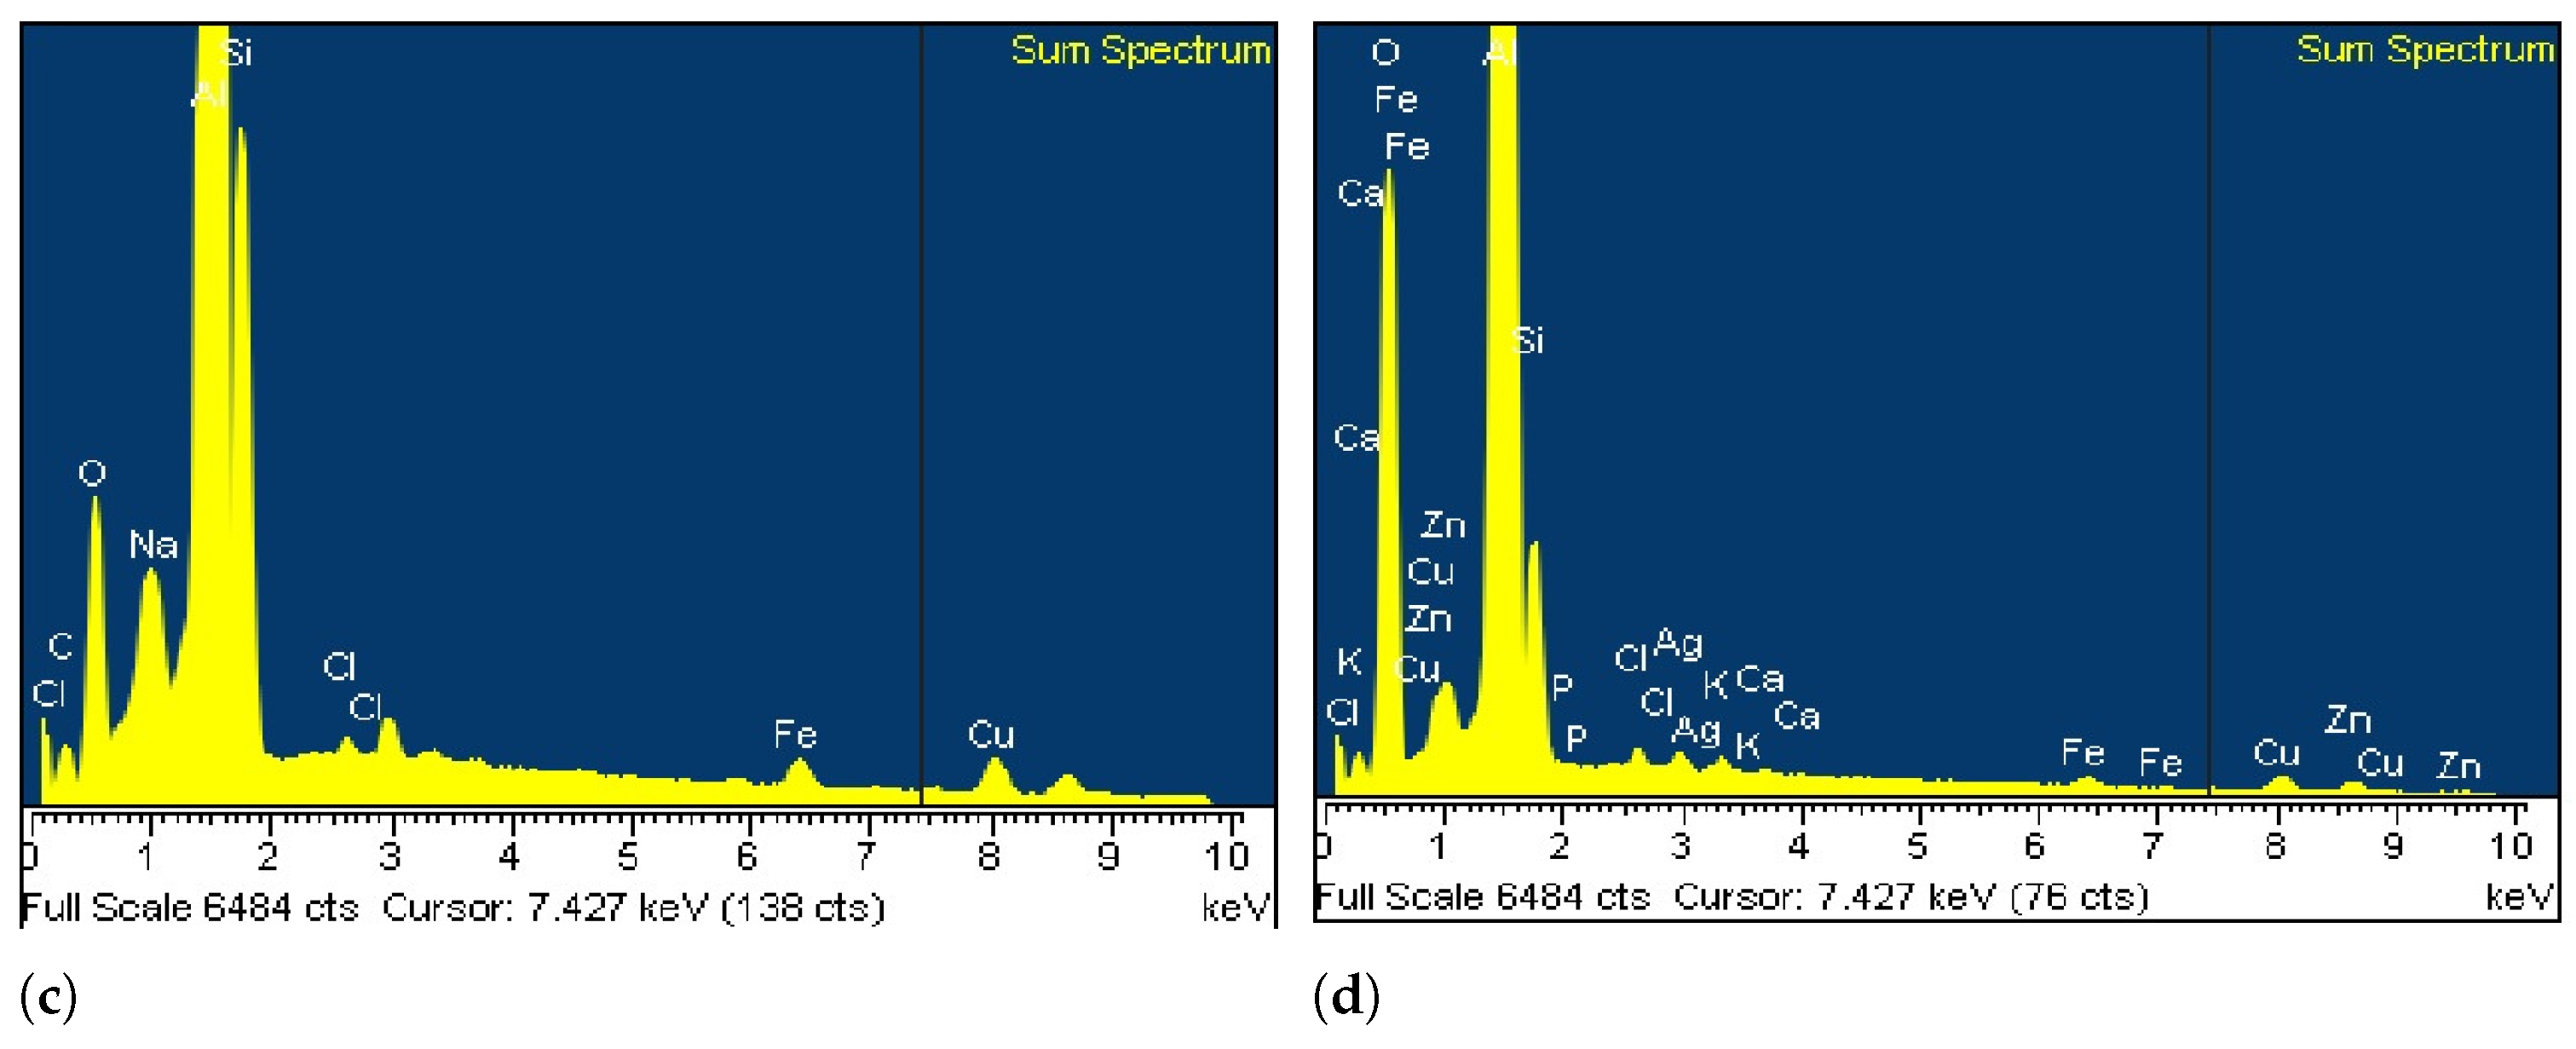
4. Results and Discussion
5. Conclusions
Author Contributions
Funding
Institutional Review Board Statement
Informed Consent Statement
Data Availability Statement
Conflicts of Interest
References
- An Introduction to Integrated Computational Materials Engineering (ICME). In Integrated Computational Materials Engineering (ICME) for Metals; John Wiley & Sons, Ltd.: Hoboken, NJ, USA, 2012; Chapter 1; pp. 1–44.
- Tijani, Y.; Heinrietz, A.; Bruder, T.; Hanselka, H. Quantitative evaluation of fatigue life of cast aluminum alloys by non-destructive testing and parameter model. Int. J. Fatigue 2013, 57, 73–78. [Google Scholar] [CrossRef]
- Zavodska, D.; Tillova, E.; Guagliano, M.; Kucharikova, L.; Chalupova, M. Fatigue Resistance of Self-hardening Aluminium Cast Alloy. Mater. Today Proc. 2017, 4, 6001–6006. [Google Scholar] [CrossRef]
- Sonsino, C.; Franz, R. Multiaxial fatigue assessment for automotive safety components of cast aluminium EN AC-42000 T6 (G-AlSi7Mg0.3 T6) under constant and variable amplitude loading. Int. J. Fatigue 2017, 100, 489–501. [Google Scholar] [CrossRef]
- El Khoukhi, D.; Morel, F.; Saintier, N.; Bellett, D.; Osmond, P.; Le, V.D.; Adrien, J. Experimental investigation of the size effect in high cycle fatigue: Role of the defect population in cast aluminium alloys. Int. J. Fatigue 2019, 129, 105222. [Google Scholar] [CrossRef]
- Serrano-Munoz, I.; Buffiere, J.Y.; Verdu, C. Casting defects in structural components: Are they all dangerous? A 3D study. Int. J. Fatigue 2018, 117, 471–484. [Google Scholar] [CrossRef]
- Belayadi, A.; Bourahla, B. Neural network model for 7000 (Al-Z) alloys: Classification and prediction of mechanical properties. Phys. B Condens. Matter 2019, 554, 114–120. [Google Scholar] [CrossRef]
- Ovono Ovono, D.; Guillot, I.; Massinon, D. Study on low-cycle fatigue behaviours of the aluminium cast alloys. J. Alloys Compd. 2008, 452, 425–431. [Google Scholar] [CrossRef]
- Abuhasel, K.; Ibrahim, M.; Elgallad, E.; Samuel, F. On the impact toughness of Al–Si cast alloys. Mater. Des. 2016, 91, 388–397. [Google Scholar] [CrossRef]
- Le, V.D.; Morel, F.; Bellett, D.; Saintier, N.; Osmond, P. Multiaxial high cycle fatigue damage mechanisms associated with the different microstructural heterogeneities of cast aluminium alloys. Mater. Sci. Eng. A 2016, 649, 426–440. [Google Scholar] [CrossRef]
- Zerbst, U.; Klinger, C. Material defects as cause for the fatigue failure of metallic components. Int. J. Fatigue 2019, 127, 312–323. [Google Scholar] [CrossRef]
- Murakami, Y. Material defects as the basis of fatigue design. Int. J. Fatigue 2012, 41, 2–10. [Google Scholar] [CrossRef]
- Dezecot, S.; Maurel, V.; Buffiere, J.Y.; Szmytka, F.; Koster, A. 3D characterization and modeling of low cycle fatigue damage mechanisms at high temperature in a cast aluminum alloy. Acta Mater. 2017, 123, 24–34. [Google Scholar] [CrossRef]
- Koutiri, I.; Bellett, D.; Morel, F.; Augustins, L.; Adrien, J. High cycle fatigue damage mechanisms in cast aluminium subject to complex loads. Int. J. Fatigue 2013, 47, 44–57. [Google Scholar] [CrossRef]
- Genel, K. Application of artificial neural network for predicting strain-life fatigue properties of steels on the basis of tensile tests. Int. J. Fatigue 2004, 26, 1027–1035. [Google Scholar] [CrossRef]
- Dini, G.; Najafizadeh, A.; Monir-Vaghefi, S.; Ebnonnasir, A. Predicting of mechanical properties of Fe–Mn–(Al, Si) TRIP/TWIP steels using neural network modeling. Comput. Mater. Sci. 2009, 45, 959–965. [Google Scholar] [CrossRef]
- SHABANI, M.O.; ALIZADEH, M.; MAZAHERY, A. Modelling of mechanical properties of cast A356 alloy. Fatigue Fract. Eng. Mater. Struct. 2011, 34, 1035–1040. [Google Scholar] [CrossRef]
- Figueira Pujol, J.C.; Andrade Pinto, J.M. A neural network approach to fatigue life prediction. Int. J. Fatigue 2011, 33, 313–322. [Google Scholar] [CrossRef]
- Fu, Y.; Shao, Z.; Liu, C.; Wang, Y.; Xu, Y.; Zhu, X. Modeling the Mechanical Properties of Heat-Treated Mg-Zn-RE-Zr-Ca-Sr Alloys with the Artificial Neural Network and the Regression Model. Crystals 2022, 12, 754. [Google Scholar] [CrossRef]
- Fu, Y.; Liu, C.; Song, Y.; Hao, H.; Xu, Y.; Shao, Z.; Wang, J.; Zhu, X. Modeling of Microstructure and Mechanical Properties of Heat Treated ZE41-Ca-Sr Alloys for Integrated Computing Platform. Crystals 2022, 12, 1237. [Google Scholar] [CrossRef]
- Abd El-Rehim, A.F.; Zahran, H.Y.; Habashy, D.M.; Al-Masoud, H.M. Simulation and Prediction of the Vickers Hardness of AZ91 Magnesium Alloy Using Artificial Neural Network Model. Crystals 2020, 10, 290. [Google Scholar] [CrossRef]
- Alam, M.A.; Ya, H.H.; Azeem, M.; Yusuf, M.; Soomro, I.A.; Masood, F.; Shozib, I.A.; Sapuan, S.M.; Akhter, J. Artificial Neural Network Modeling to Predict the Effect of Milling Time and TiC Content on the Crystallite Size and Lattice Strain of Al7075-TiC Composites Fabricated by Powder Metallurgy. Crystals 2022, 12, 372. [Google Scholar] [CrossRef]
- Xia, J.; Won, C.; Kim, H.; Lee, W.; Yoon, J. Artificial Neural Networks for Predicting Plastic Anisotropy of Sheet Metals Based on Indentation Test. Materials 2022, 15, 1714. [Google Scholar] [CrossRef] [PubMed]
- Lenzen, N.; Altay, O. Machine Learning Enhanced Dynamic Response Modelling of Superelastic Shape Memory Alloy Wires. Materials 2022, 15, 304. [Google Scholar] [CrossRef] [PubMed]
- Hmede, R.; Chapelle, F.; Lapusta, Y. Review of Neural Network Modeling of Shape Memory Alloys. Sensors 2022, 22, 5610. [Google Scholar] [CrossRef] [PubMed]
- Cheng, P.; Wang, D.; Zhou, J.; Zuo, S.; Zhang, P. Comparison of the Warm Deformation Constitutive Model of GH4169 Alloy Based on Neural Network and the Arrhenius Model. Metals 2022, 12, 1429. [Google Scholar] [CrossRef]
- Vassilopoulos, A.P.; Georgopoulos, E.F.; Dionysopoulos, V. Artificial neural networks in spectrum fatigue life prediction of composite materials. Int. J. Fatigue 2007, 29, 20–29. [Google Scholar] [CrossRef]
- Li, J.; Yang, Z.; Qian, G.; Berto, F. Machine learning based very-high-cycle fatigue life prediction of Ti-6Al-4V alloy fabricated by selective laser melting. Int. J. Fatigue 2022, 158, 106764. [Google Scholar] [CrossRef]
- Câmara, E.C.B.; Kalombo, R.; Ferreira, J.; Araújo, J.A.; Júnior, R.C.S.F. Estimating the fatigue behavior of a family of aluminum conductor cables using ANNs applying the Poffenberger-Swart formula. Int. J. Fatigue 2022, 159, 106766. [Google Scholar] [CrossRef]
- Oliveira, G.A.B.; Júnior, R.C.S.F.; Veloso, L.A.C.M.; Araújo, J.A. A hybrid ANN-multiaxial fatigue nonlocal model to estimate fretting fatigue life for aeronautical Al alloys. Int. J. Fatigue 2022, 162, 107011. [Google Scholar] [CrossRef]
- Zhan, Z.; Ao, N.; Hu, Y.; Liu, C. Defect-induced fatigue scattering and assessment of additively manufactured 300M-AerMet100 steel: An investigation based on experiments and machine learning. Eng. Fract. Mech. 2022, 264, 108352. [Google Scholar] [CrossRef]
- Pierce, S.G.; Worden, K.; Bezazi, A. Uncertainty analysis of a neural network used for fatigue lifetime prediction. Mech. Syst. Signal Process. 2008, 22, 1395–1411. [Google Scholar] [CrossRef]
- Janežič, M.; Klemenc, J.; Fajdiga, M. A neural-network approach to describe the scatter of cyclic stress–strain curves. Mater. Des. 2010, 31, 438–448. [Google Scholar] [CrossRef]
- Artificial neural network for random fatigue loading analysis including the effect of mean stress. Int. J. Fatigue 2018, 111, 321–332. [CrossRef]
- Li, D.; Wang, W.; Ismail, F. Enhanced fuzzy-filtered neural networks for material fatigue prognosis. Appl. Soft Comput. 2013, 13, 283–291. [Google Scholar] [CrossRef]
- Lotfi, B.; Beiss, P. Application of neural networking for fatigue limit prediction of powder metallurgy steel parts. Mater. Des. 2013, 50, 440–445. [Google Scholar] [CrossRef]
- Orbanić, P.; Fajdiga, M. A neural network approach to describing the fretting fatigue in aluminium-steel couplings. Int. J. Fatigue 2003, 25, 201–207. [Google Scholar] [CrossRef]
- Shojaeefard, M.H.; Khalkhali, A.; Akbari, M.; Asadi, P. Investigation of friction stir welding tool parameters using FEM and neural network. Proc. Inst. Mech. Eng. Part L J. Mater. Des. Appl. 2015, 229, 209–217. [Google Scholar] [CrossRef]
- Jimenez-Martinez, M.; Alfaro-Ponce, M. Effects of synthetic data applied to artificial neural networks for fatigue life prediction in nodular cast iron. J. Braz. Soc. Mech. Sci. Eng. 2021, 43, 10. [Google Scholar] [CrossRef]


| Spec | Si | Fe | Cu | Mn | Mg | Cr | Ni | Zn | Ti | Ga | Li | Mo | Pb | Sn | V | Zr | Al | |
|---|---|---|---|---|---|---|---|---|---|---|---|---|---|---|---|---|---|---|
| 1 | 8.354 | 0.868 | 2.312 | 0.166 | 0.132 | 0.025 | 0.112 | 1.857 | 0.056 | 0.008 | 0.0005 | 0.013 | 0.101 | 0.182 | 0.005 | 0.005 | 85.780 | |
| 2 | 8.519 | 0.858 | 2.275 | 0.164 | 0.135 | 0.025 | 0.112 | 1.888 | 0.055 | 0.009 | 0.001 | 0.013 | 0.100 | 0.179 | 0.006 | 0.006 | 85.640 | |
| 3 | 8.226 | 0.848 | 2.226 | 0.163 | 0.131 | 0.025 | 0.110 | 1.856 | 0.056 | 0.008 | 0.001 | 0.013 | 0.099 | 0.176 | 0.005 | 0.006 | 86.030 | |
| batch 1 | 4 | 7.971 | 0.778 | 2.116 | 0.153 | 0.125 | 0.023 | 0.102 | 1.809 | 0.061 | 0.008 | 0.000 | 0.012 | 0.091 | 0.165 | 0.006 | 0.006 | 86.560 |
| Min | 7.971 | 0.778 | 2.116 | 0.153 | 0.125 | 0.023 | 0.102 | 1.809 | 0.055 | 0.008 | 0.000 | 0.012 | 0.091 | 0.165 | 0.005 | 0.006 | 85.640 | |
| Max | 8.519 | 0.868 | 2.312 | 0.166 | 0.135 | 0.025 | 0.112 | 1.888 | 0.061 | 0.009 | 0.001 | 0.013 | 0.101 | 0.182 | 0.006 | 0.006 | 86.560 | |
| Ave | 8.268 | 0.838 | 2.232 | 0.162 | 0.131 | 0.025 | 0.109 | 1.853 | 0.057 | 0.008 | 0.001 | 0.013 | 0.098 | 0.176 | 0.006 | 0.006 | 86.003 | |
| 1 | 7.246 | 0.592 | 0.294 | 0.378 | 0.276 | 0.024 | 0.018 | 0.176 | 0.037 | 0.007 | 0.000 | 0.002 | 0.009 | 0.012 | 0.013 | 0.008 | 90.890 | |
| 2 | 7.279 | 0.601 | 0.291 | 0.380 | 0.279 | 0.023 | 0.018 | 0.177 | 0.036 | 0.007 | 0.000 | 0.002 | 0.010 | 0.011 | 0.012 | 0.002 | 90.850 | |
| 3 | 7.254 | 0.611 | 0.296 | 0.387 | 0.283 | 0.024 | 0.018 | 0.177 | 0.037 | 0.008 | 0.000 | 0.001 | 0.010 | 0.011 | 0.012 | 0.008 | 90.850 | |
| batch 2 | 4 | 7.221 | 0.644 | 0.290 | 0.414 | 0.275 | 0.026 | 0.018 | 0.173 | 0.037 | 0.008 | 0.000 | 0.002 | 0.010 | 0.012 | 0.013 | 0.008 | 90.840 |
| Min | 7.221 | 0.592 | 0.290 | 0.378 | 0.275 | 0.023 | 0.018 | 0.173 | 0.036 | 0.007 | 0.000 | 0.001 | 0.009 | 0.011 | 0.012 | 0.002 | 90.840 | |
| Max | 7.279 | 0.644 | 0.296 | 0.414 | 0.283 | 0.026 | 0.018 | 0.177 | 0.037 | 0.008 | 0.000 | 0.002 | 0.010 | 0.012 | 0.013 | 0.008 | 90.890 | |
| Ave | 7.250 | 0.612 | 0.293 | 0.390 | 0.278 | 0.024 | 0.018 | 0.176 | 0.037 | 0.007 | 0.000 | 0.002 | 0.010 | 0.012 | 0.013 | 0.006 | 90.858 | |
| 1 | 8.272 | 0.646 | 0.474 | 0.594 | 0.275 | 0.027 | 0.021 | 0.329 | 0.042 | 0.008 | 0.001 | 0.002 | 0.015 | 0.018 | 0.012 | 0.009 | 89.240 | |
| 2 | 8.151 | 0.630 | 0.467 | 0.597 | 0.275 | 0.027 | 0.022 | 0.323 | 0.041 | 0.007 | 0.001 | 0.002 | 0.014 | 0.018 | 0.012 | 0.009 | 89.390 | |
| 3 | 8.166 | 0.647 | 0.473 | 0.595 | 0.285 | 0.027 | 0.022 | 0.333 | 0.042 | 0.008 | 0.000 | 0.003 | 0.017 | 0.019 | 0.012 | 0.009 | 89.330 | |
| batch 3 | 4 | 8.288 | 0.653 | 0.474 | 0.594 | 0.278 | 0.027 | 0.022 | 0.330 | 0.042 | 0.008 | 0.001 | 0.002 | 0.015 | 0.018 | 0.012 | 0.009 | 89.210 |
| Min | 8.151 | 0.630 | 0.467 | 0.594 | 0.275 | 0.027 | 0.021 | 0.323 | 0.041 | 0.007 | 0.000 | 0.002 | 0.014 | 0.018 | 0.012 | 0.009 | 89.210 | |
| Max | 8.288 | 0.653 | 0.474 | 0.597 | 0.285 | 0.027 | 0.022 | 0.333 | 0.042 | 0.008 | 0.001 | 0.003 | 0.017 | 0.019 | 0.012 | 0.009 | 89.390 | |
| Ave | 8.219 | 0.644 | 0.472 | 0.595 | 0.278 | 0.027 | 0.022 | 0.329 | 0.042 | 0.008 | 0.001 | 0.002 | 0.015 | 0.018 | 0.012 | 0.009 | 89.293 | |
| 1 | 13.550 | 1.014 | 0.266 | 0.341 | 0.139 | 0.060 | 0.044 | 0.156 | 0.057 | 0.007 | 0.001 | 0.006 | 0.010 | 0.013 | 0.018 | 0.016 | 84.280 | |
| 2 | 13.580 | 1.002 | 0.275 | 0.344 | 0.148 | 0.059 | 0.046 | 0.166 | 0.055 | 0.007 | 0.001 | 0.007 | 0.010 | 0.013 | 0.017 | 0.016 | 84.240 | |
| 3 | 13.220 | 0.986 | 0.264 | 0.340 | 0.146 | 0.059 | 0.043 | 0.167 | 0.055 | 0.007 | 0.000 | 0.007 | 0.010 | 0.013 | 0.017 | 0.015 | 84.630 | |
| batch 4 | 4 | 13.320 | 0.976 | 0.257 | 0.343 | 0.143 | 0.061 | 0.044 | 0.172 | 0.055 | 0.007 | 0.001 | 0.007 | 0.011 | 0.013 | 0.017 | 0.015 | 84.540 |
| Min | 13.220 | 0.976 | 0.257 | 0.340 | 0.139 | 0.059 | 0.043 | 0.156 | 0.055 | 0.007 | 0.000 | 0.006 | 0.010 | 0.013 | 0.017 | 0.015 | 84.240 | |
| Max | 13.580 | 1.014 | 0.275 | 0.344 | 0.148 | 0.061 | 0.046 | 0.172 | 0.057 | 0.007 | 0.001 | 0.007 | 0.011 | 0.013 | 0.018 | 0.016 | 84.630 | |
| Ave | 13.418 | 0.995 | 0.266 | 0.342 | 0.144 | 0.060 | 0.044 | 0.165 | 0.056 | 0.007 | 0.001 | 0.007 | 0.010 | 0.013 | 0.017 | 0.016 | 84.423 |
| Batch 1 | Batch 2 | Batch 3 | Batch 4 | |
|---|---|---|---|---|
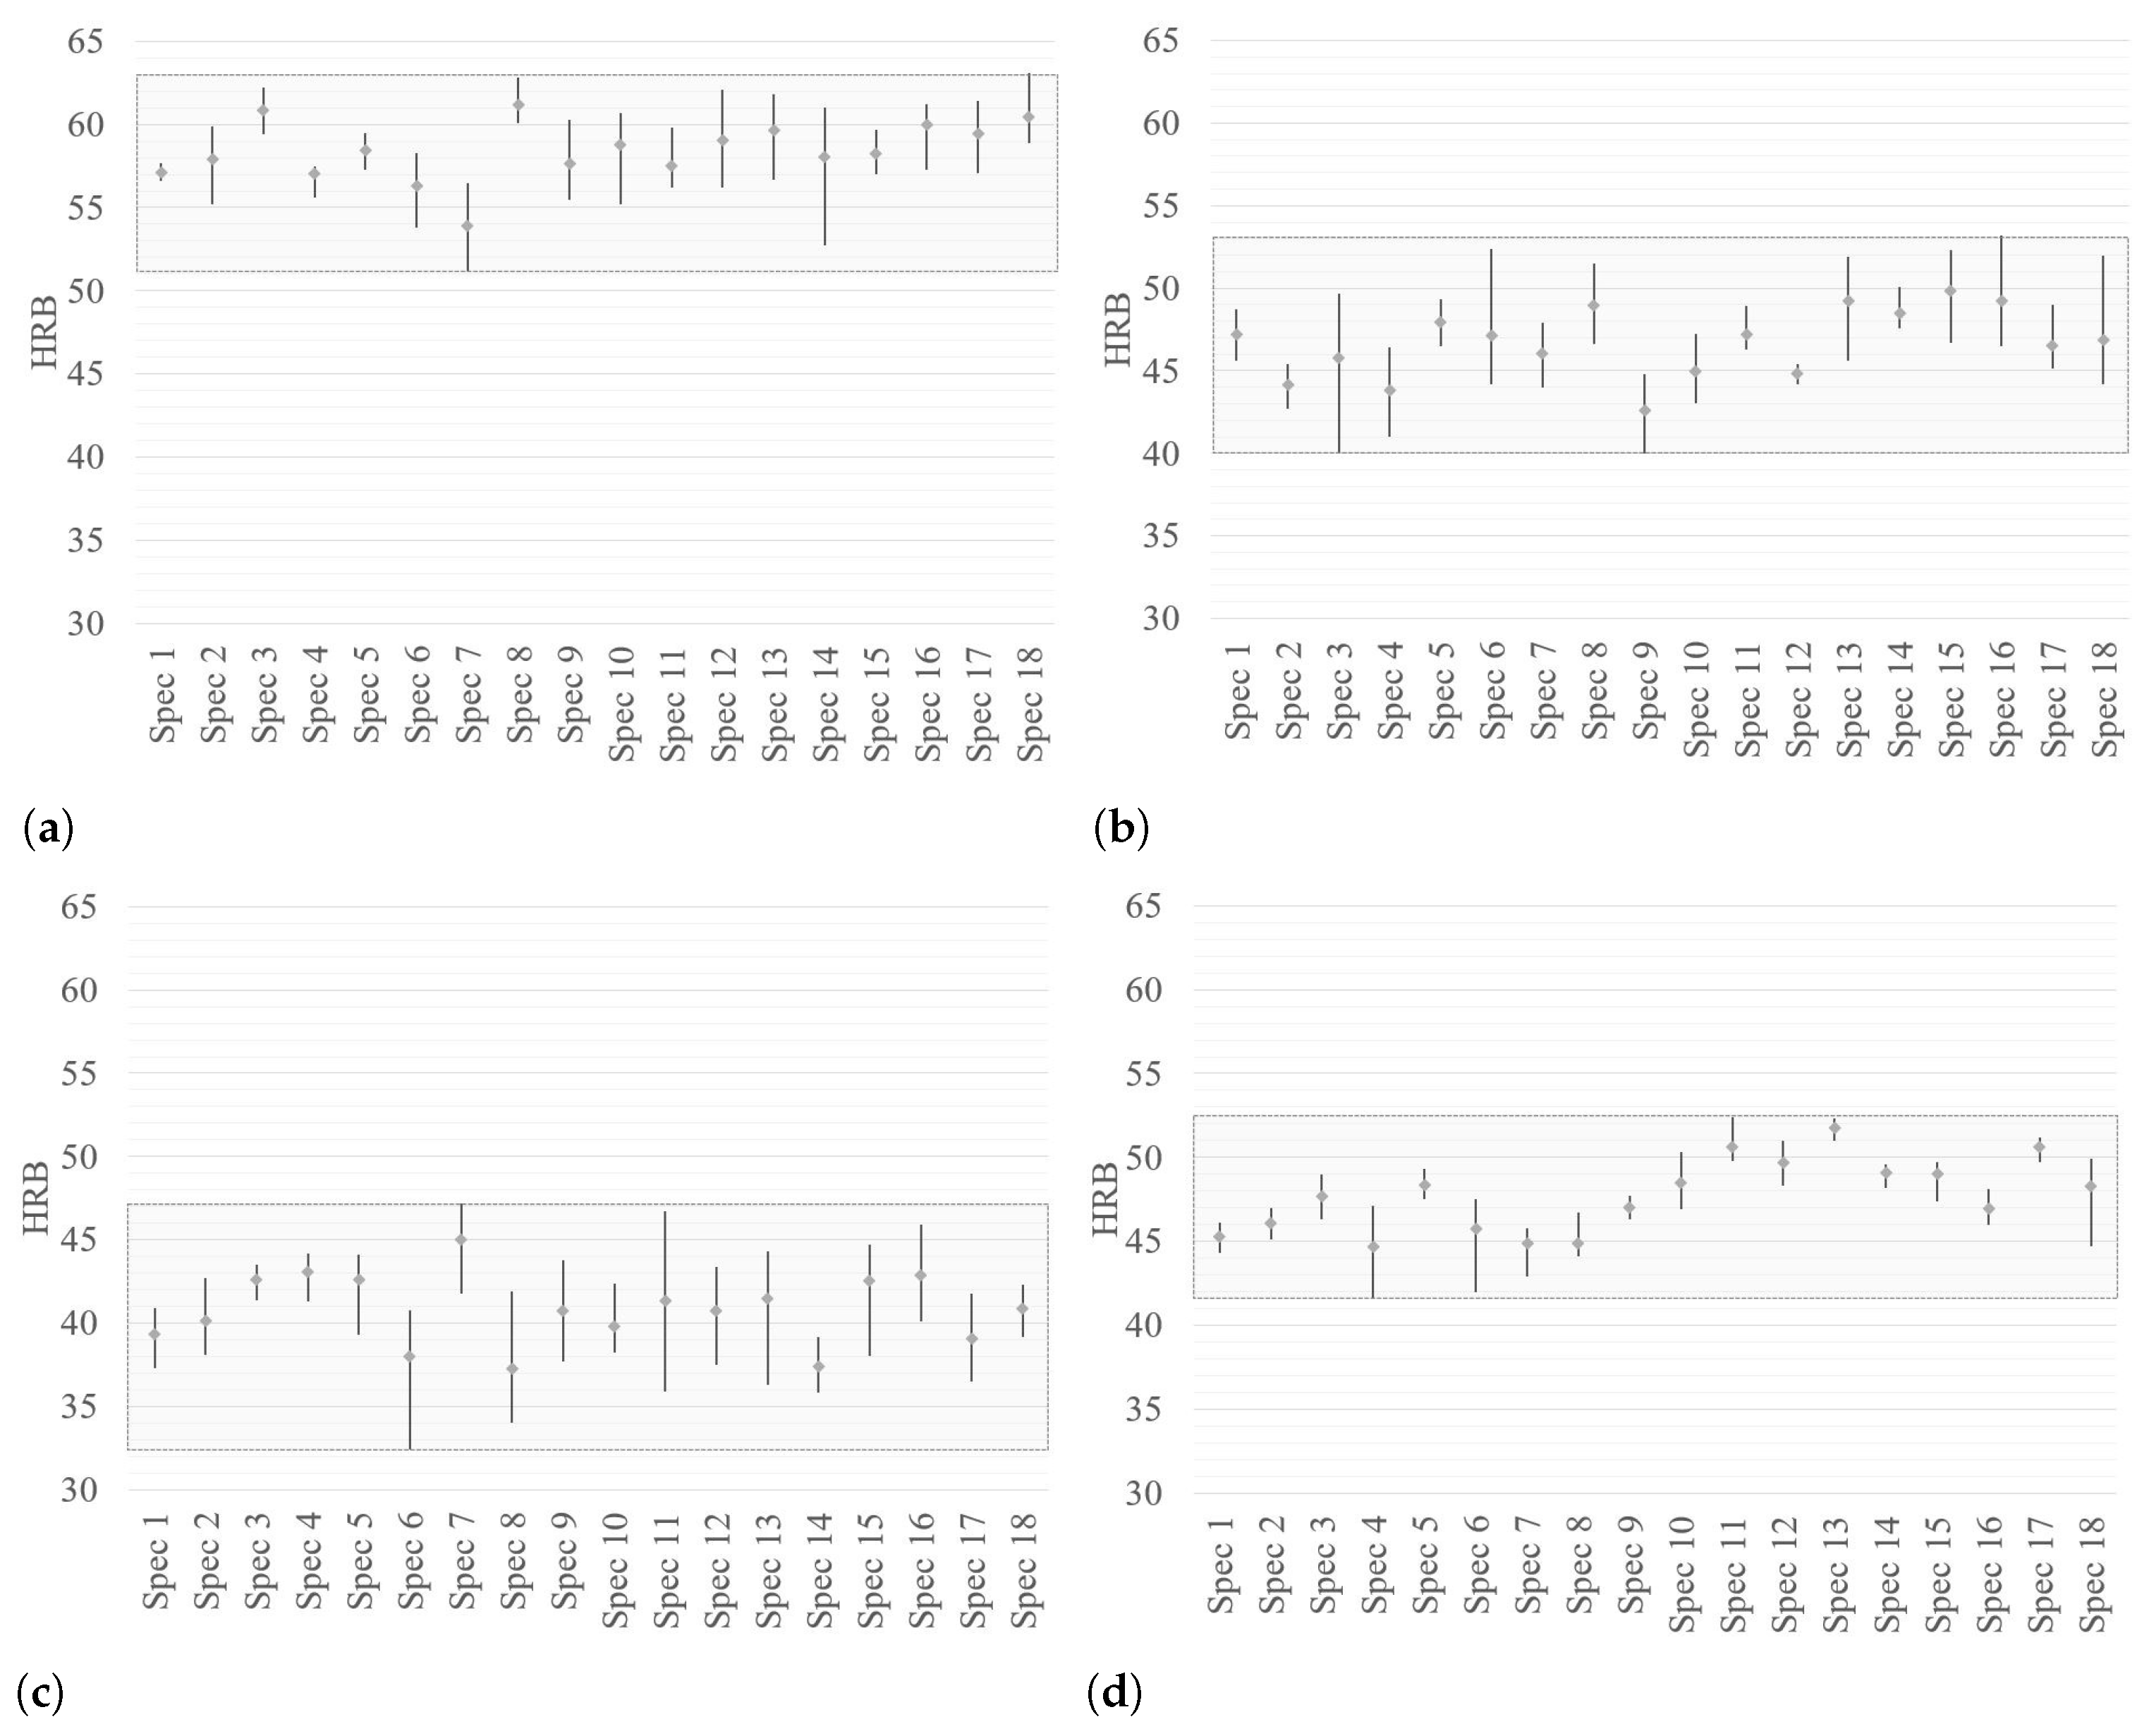
| Ave | 57.82 | 40.97 | 45.95 | 46.07 |
| Min | 56.08 | 38.12 | 43.40 | 44.46 |
| Max | 59.41 | 43.23 | 48.46 | 47.36 |
Publisher’s Note: MDPI stays neutral with regard to jurisdictional claims in published maps and institutional affiliations. |
© 2022 by the authors. Licensee MDPI, Basel, Switzerland. This article is an open access article distributed under the terms and conditions of the Creative Commons Attribution (CC BY) license (https://creativecommons.org/licenses/by/4.0/).
Share and Cite
Jimenez-Martinez, M.; Alfaro-Ponce, M.; Muñoz-Ibañez, C. Design of an Aluminum Alloy Using a Neural Network-Based Model. Metals 2022, 12, 1587. https://doi.org/10.3390/met12101587
Jimenez-Martinez M, Alfaro-Ponce M, Muñoz-Ibañez C. Design of an Aluminum Alloy Using a Neural Network-Based Model. Metals. 2022; 12(10):1587. https://doi.org/10.3390/met12101587
Chicago/Turabian StyleJimenez-Martinez, Moises, Mariel Alfaro-Ponce, and Cristopher Muñoz-Ibañez. 2022. "Design of an Aluminum Alloy Using a Neural Network-Based Model" Metals 12, no. 10: 1587. https://doi.org/10.3390/met12101587
APA StyleJimenez-Martinez, M., Alfaro-Ponce, M., & Muñoz-Ibañez, C. (2022). Design of an Aluminum Alloy Using a Neural Network-Based Model. Metals, 12(10), 1587. https://doi.org/10.3390/met12101587