Article

Recovering Value from End-of-Life Batteries by Integrating Froth Flotation and Pyrometallurgical Copper-Slag Cleaning

1
Department of Chemical and Metallurgical Engineering, School of Chemical Engineering, Aalto University, 02150 Espoo, Finland
2
Geological Survey of Finland, 02150 Espoo, Finland
*
Author to whom correspondence should be addressed.
Metals 2022, 12(1), 15; https://doi.org/10.3390/met12010015
Submission received: 26 November 2021 / Revised: 16 December 2021 / Accepted: 20 December 2021 / Published: 22 December 2021

Abstract

:
In this study, industrial lithium-ion battery (LIB) waste was treated by a froth flotation process, which allowed selective separation of electrode particles from metallic-rich fractions containing Cu and Al. In the flotation experiments, recovery rates of ~80 and 98.8% for the cathode active elements (Co, Ni, Mn) and graphite were achieved, respectively. The recovered metals from the flotation fraction were subsequently used in high-temperature Cu-slag reduction. In this manner, the possibility of using metallothermic reduction for Cu-slag reduction using Al-wires from LIB waste as the main reductant was studied. The behavior of valuable (Cu, Ni, Co, Li) and hazardous metals (Zn, As, Sb, Pb), as a function of time as well as the influence of Cu-slag-to-spent battery (SB) ratio, were investigated. The results showcase a suitable process to recover copper from spent batteries and industrial Cu-slag. Cu-concentration decreased to approximately 0.3 wt.% after 60 min reduction time in all samples where Cu/Al-rich LIB waste fraction was added. It was also showed that aluminothermic reduction is effective for removing hazardous metals from the slag. The proposed process is also capable of recovering Cu, Co, and Ni from both Cu-slag and LIB waste, resulting in a secondary Cu slag that can be used in various applications.

1. Introduction

Waste LIBs represent a complex material mixture comprising various components, including metallic materials (Cu, Al, Fe), plastics, metal salts, graphite, and other inorganic and organic compounds [1,2]. This complexity poses a significant challenge for battery recycling processes, thus requiring careful mechanical pretreatment for the preliminary separation of the components [3,4,5]. In general, this pretreatment is based on physical properties, and serve the purpose of increasing the process throughput, thus helping the economic viability of recycling [6,7]. The most important goal of the initial mechanical processing of LIBs is to separate the mixed active materials (graphite and lithium metal salts, a.k.a., black mass) into a sufficiently pure fraction, from which the individual elements of value can be recovered by chemical methods (pyrometallurgy and hydrometallurgy) [8]. Typical mechanical processing of LIBs involves shredding, crushing, and milling to reduce the particle size of the waste, and to enhance the liberation of individual components [9,10]. Since the active materials are finer than the other constituents of the waste LIB stream, sieving is usually performed to recover them as a concentrate in the underflow, leaving macroscopic components (e.g., casing and wires) in the overflow [11,12].
However, the initial mechanical processing adds another layer of complexity to the downstream refining processes, due to the cross-contamination resulting from shredding and crushing whole battery packs. Not only does this cause the anode and cathode materials to be mixed, but also leaves considerable amounts of the active material adhered on the surfaces of coarse components, such as current collectors and plastics [4]. This complicates the size-based separation, as the coarse components carry the non-liberated active material to the overflow [13,14]. Therefore, to increase the recovery of the active materials in the fine sieve fraction, industrial LIB recycling processes often apply sieves with openings of about an order of magnitude larger (100′s of microns) than the active material particle sizes (tens of microns) [1]. In other words, increasing the black mass recovery happens at the expense of a decrease in black mass grade, as coarser impurities (Cu, Al, and plastics) are inevitably carried into the underflow. Another important factor enabling the laboratory-scale studies to better mimic the complex conditions of an industrial LIB recycling process is the use of mechanically processed feeds rather than any sort of manual disassembly/dismantling of the battery packs [6], a common practice in most recent published studies related to black mass flotation [15,16,17,18,19,20].
A viable option for the current LIB recycling practices would be integrating end-of-life (EoL) battery recycling with industrial processes that are already operational. In an ideal case, this approach could provide synergistic benefits for both individual processes. An example of such a combined process, published by the authors in 2020 and 2021, proposed feeding a mechanically treated battery waste fraction into an industrial Ni-slag cleaning process, showing promising results [21,22]. In those studies, LIB waste was treated by a froth flotation process that selectively separated active particles in the froth phase from a coarse Cu/Al-rich fraction. Benefits included: (1) The proposed process was able to recover valuable metals from the battery waste, as Co, Ni, and Cu were all heavily concentrated in the matte or metal phase. (2) Adding the mechanically treated LIB waste to the Ni slag eliminated the need for an additional reducing agent (conventionally coke), as the reduction reactions were driven by the graphite present in the waste LIB froth fraction. (3) The fine particle size of the graphite provided extremely fast reaction kinetics during the slag cleaning.
In addition to the expected worldwide increase in LIB waste generation, large quantities of Cu-slag are being produced as by-products from different smelters all over the world. This slag contains smaller amounts of CaO and MgO [23,24] and metals such as Cu, Co, and Ni. Cu-slag may also contain Pb, Zn, As, Sb, and therefore, is considered as hazardous material [23,24].
Some possible ways of utilizing Cu-slag were reviewed by Gorai et al. (2003), including the production of cement [25], tiles, cutting tools, and glasses [23]. Before utilization, a slag cleaning stage is required to minimize the environmental risks and recover valuable metals. Different solutions for recovering valuable metals from Cu-slag were summarized in the work of Potysz et al., (2015) [24]. One of the possible ways of cleaning Cu-slag is aluminothermic smelting reduction (ASR), which was recently investigated by Heo et al., (2016) [26]. In the aluminothermic reaction, iron oxides (FeO, Fe3O4, Fe2O3) are reduced to metallic Fe by oxidation of metallic Al into Al2O3 [27]. The study by Heo et al. also showed that this method allows recovering valuable Fe from the slag and eliminates hazardous metals (e.g., As, Pb, Sb) physiochemically dispersed within the slag [26].
Adding spent batteries to Cu-slag increases the concentrations of valuable metals, such as Cu, Co, and Ni, which may improve their recovery due to formation of larger metal/matte droplets facilitating settling. At the same time, metallic Al and remaining graphite in the spent battery fraction could be used as reductants for metal oxides present in both Cu-slag and spent batteries. Based on the literature studies considering the properties of Cu-slag and aluminothermic smelting reduction method [26,27], as well as on our previous efforts on integrating Ni-slag cleaning with battery recycling [21,22], this study explores the integration of Al and Cu-rich fraction obtained after flotation of battery scrap into the Cu-slag reduction process.
In the work hereby presented, pyrometallurgical laboratory scale reduction experiments were conducted at a typical industrial smelting temperature of 1300 °C in Ar atmosphere. The behavior of metals in the matte-metal-slag system was investigated as a function of time. The goal of the study was to test the metallothermic reduction method for copper-slag reduction using Al-wires from spent lithium-ion batteries as the main reductant. Additionally, the influence of different Cu-slag–to–spent batteries ratios on the slag reduction process and recovery of valuable metals into the matte phase were investigated. The purpose of this kinetic study was to determine the optimal reaction time and spent battery amount leading to the highest recovery of metals.
The present study thus expands on the flowchart introduced previously [21], where the possibility of feeding battery scrap flotation underflow to a Cu-slag reduction process is investigated (Figure 1). Two process routes were experimented with, as the underflow was fed to the high-temperature process, both non-ground (process route A) and ground (route B). The material flow scope boundaries (dashed lines) in Figure 1 define the process investigated in this study. Ni slag cleaning with battery flotation overflow fraction was introduced and studied in the earlier articles of the authors [21,22].

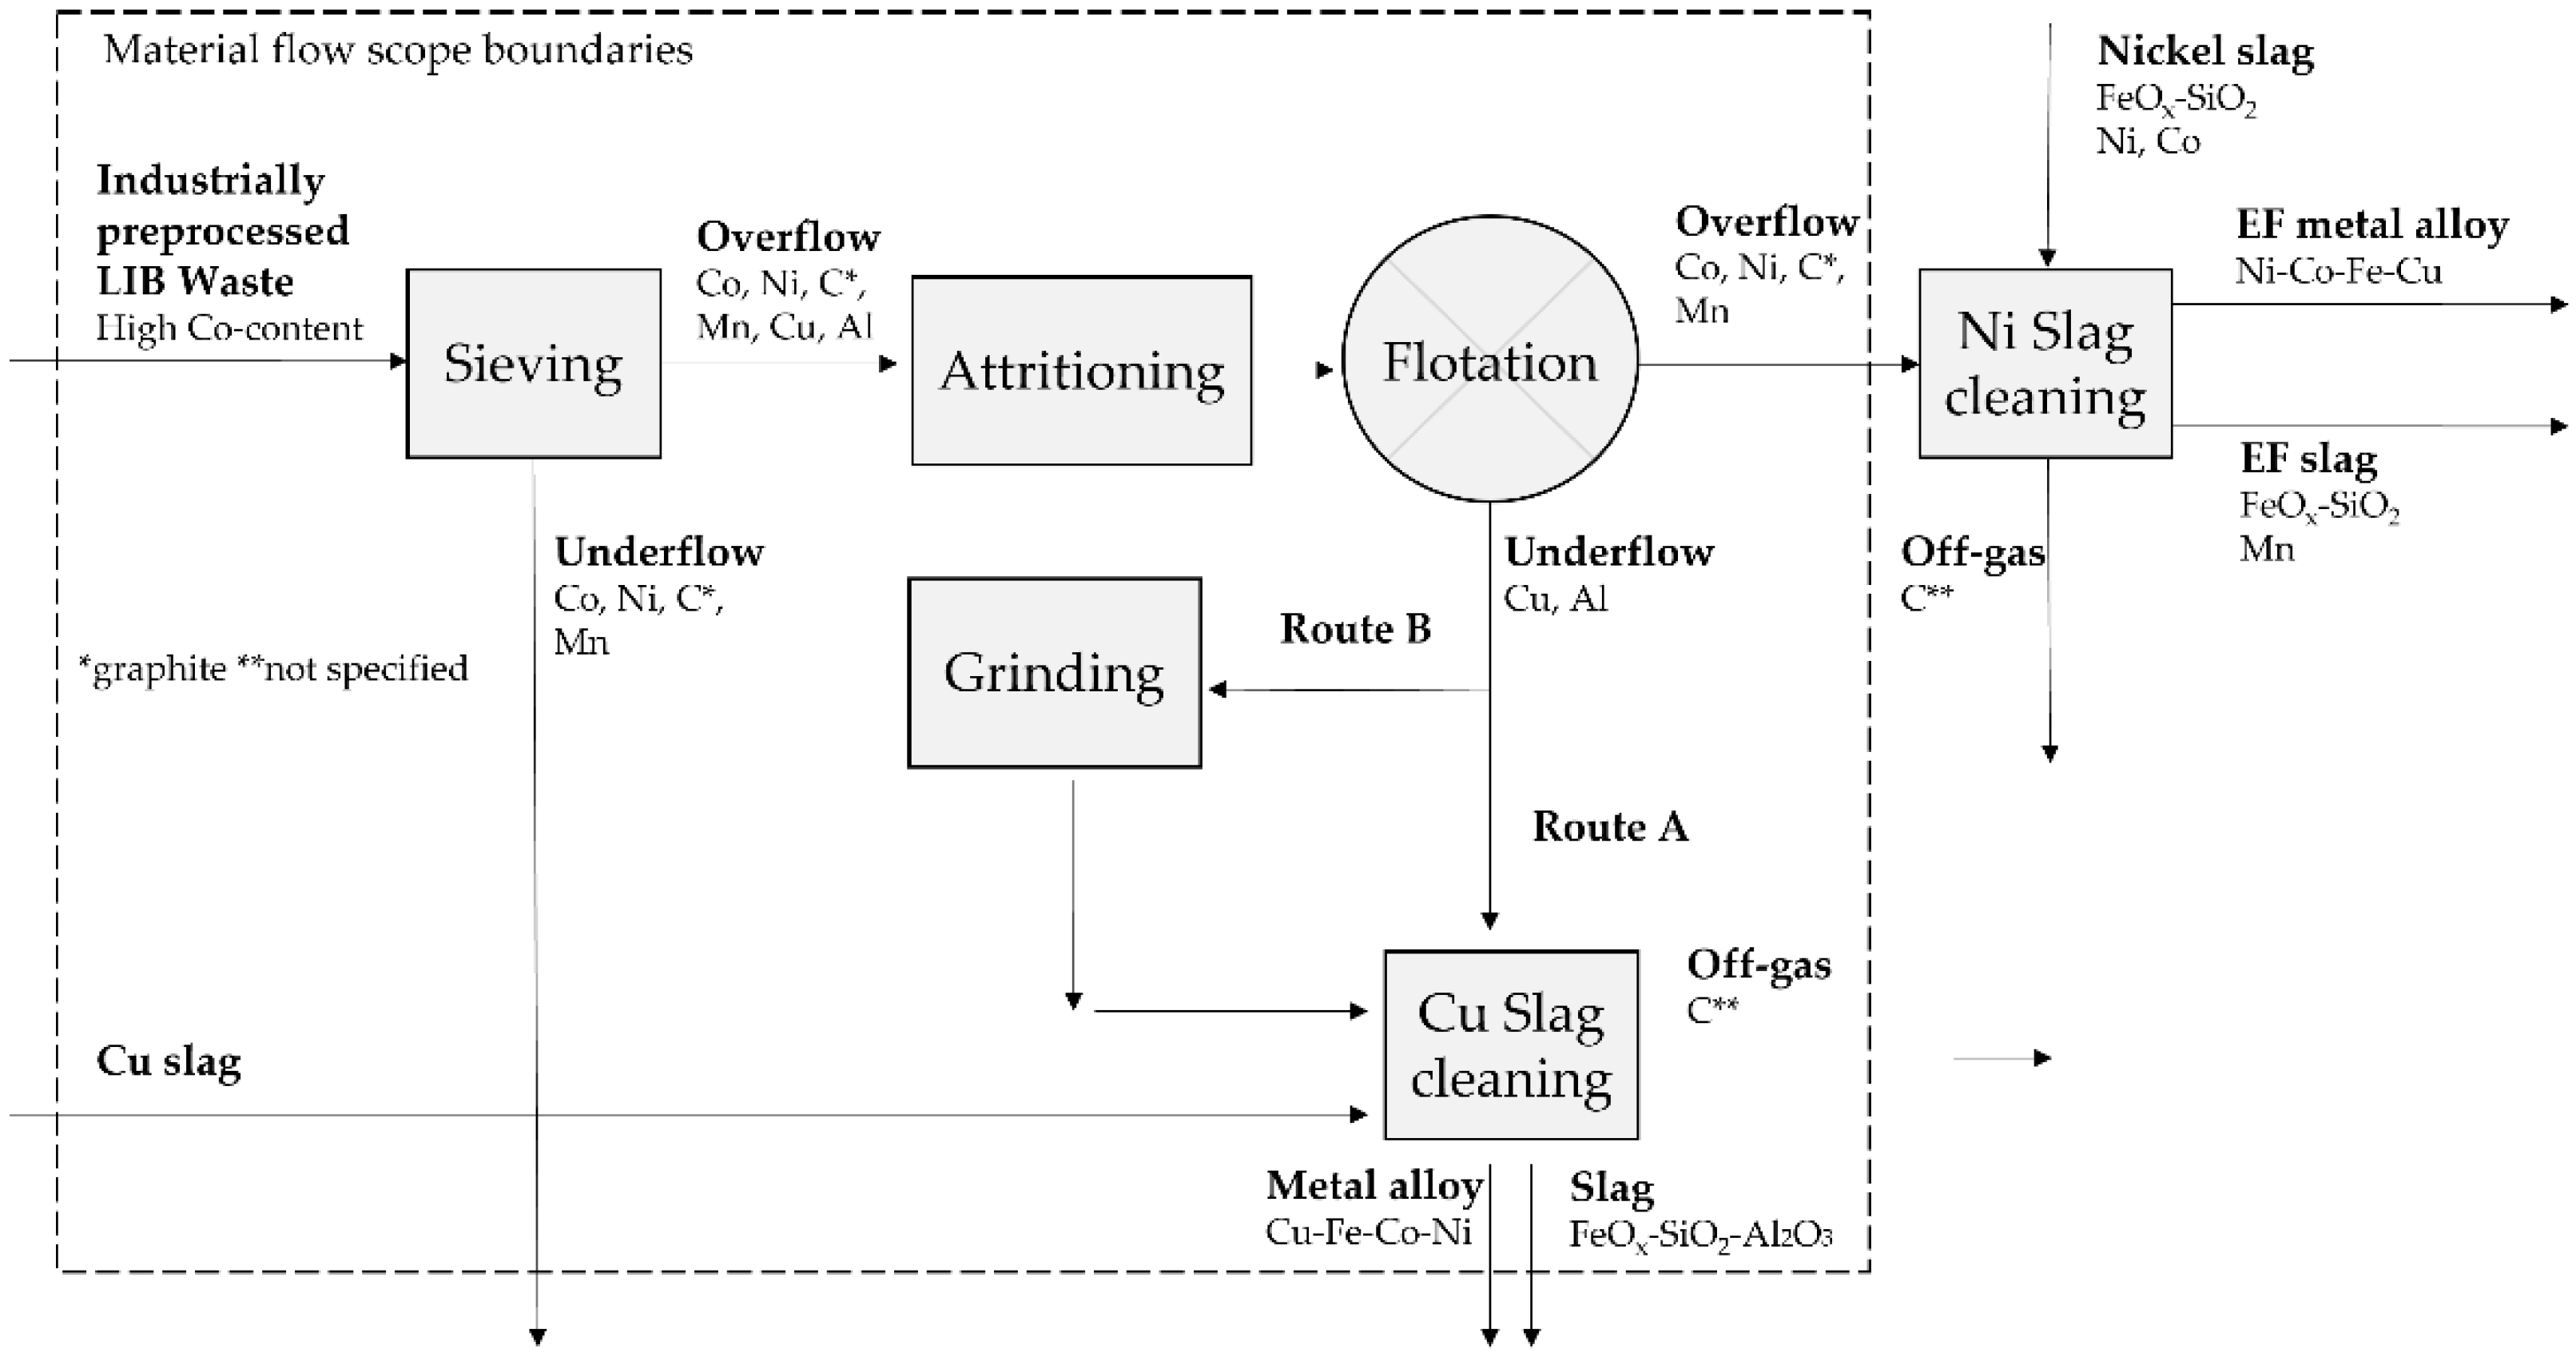
2. Materials and Methods

2.1. Froth Flotation

2.1.1. Sample Preparation

The LIB waste used in the experiments was provided by a Finnish industrial operator. In the industrial process, the various EoL battery types were sorted to produce a stream of LIBs, with the dominant cathode types being LiCoO2 and LiNixMnyCozO2. This high Co waste stream was subsequently processed in a two-stage crushing line, followed by magnetic and mechanical separation stages, to obtain a concentrated fraction of valuables. The fine powder mixture thus obtained is typically referred to as “black mass” and is rich in active material (Co, Ni, Mn, Li, graphite), but also contains Cu and Al from the current collector foils, and plastics from the separator films.
The industrial metal concentrate was further dry-sieved in the laboratory, using a vibratory sieve shaker (Fritsch, Analysette 3, Idar-Oberstein, Germany) with a cut-off point of 500 µm. The batch size of the sieving was kept at a moderate 200 g, to avoid clogging of the sieve openings, and allow for optimal particle separation. The amplitude of the sieve shaker was set at 6 mm, and each individual batch was sieved for a total of 10 min. The sieve overflow (>500 µm) was applied as a feed for the froth flotation experiments.
Based on experience from previous studies by the authors [21], the samples used as feed for froth flotation (>500 µm) were attritioned for 20 min in a vibratory micro mill (Fritsch, Pulverisette 0, Idar-Oberstein, Germany) to promote liberation of detached black mass particles from the other metallic and plastic surfaces. The amplitude of the mill was set at 5.5 mm, with a batch size of 13.33 g. The energy output of the mill under these parameters was relatively low, which ensured that the polyvinylidene fluoride (PVDF) binder layer on the active particle surfaces would not degrade during attritioning. It is worth emphasizing that this was desirable for the specific purposes of this work since the target is not the separation of the anode and the cathode components in the black mass. Indeed, recent research has shown that PVDF promotes the hydrophobization of the cathode particles [28], enhancing the recovery of active particles in the froth phase, and leading to a more selective separation of Cu/Al in the underflow. Three batches were milled prior to each experiment, to acquire a total feed mass of 40 g.

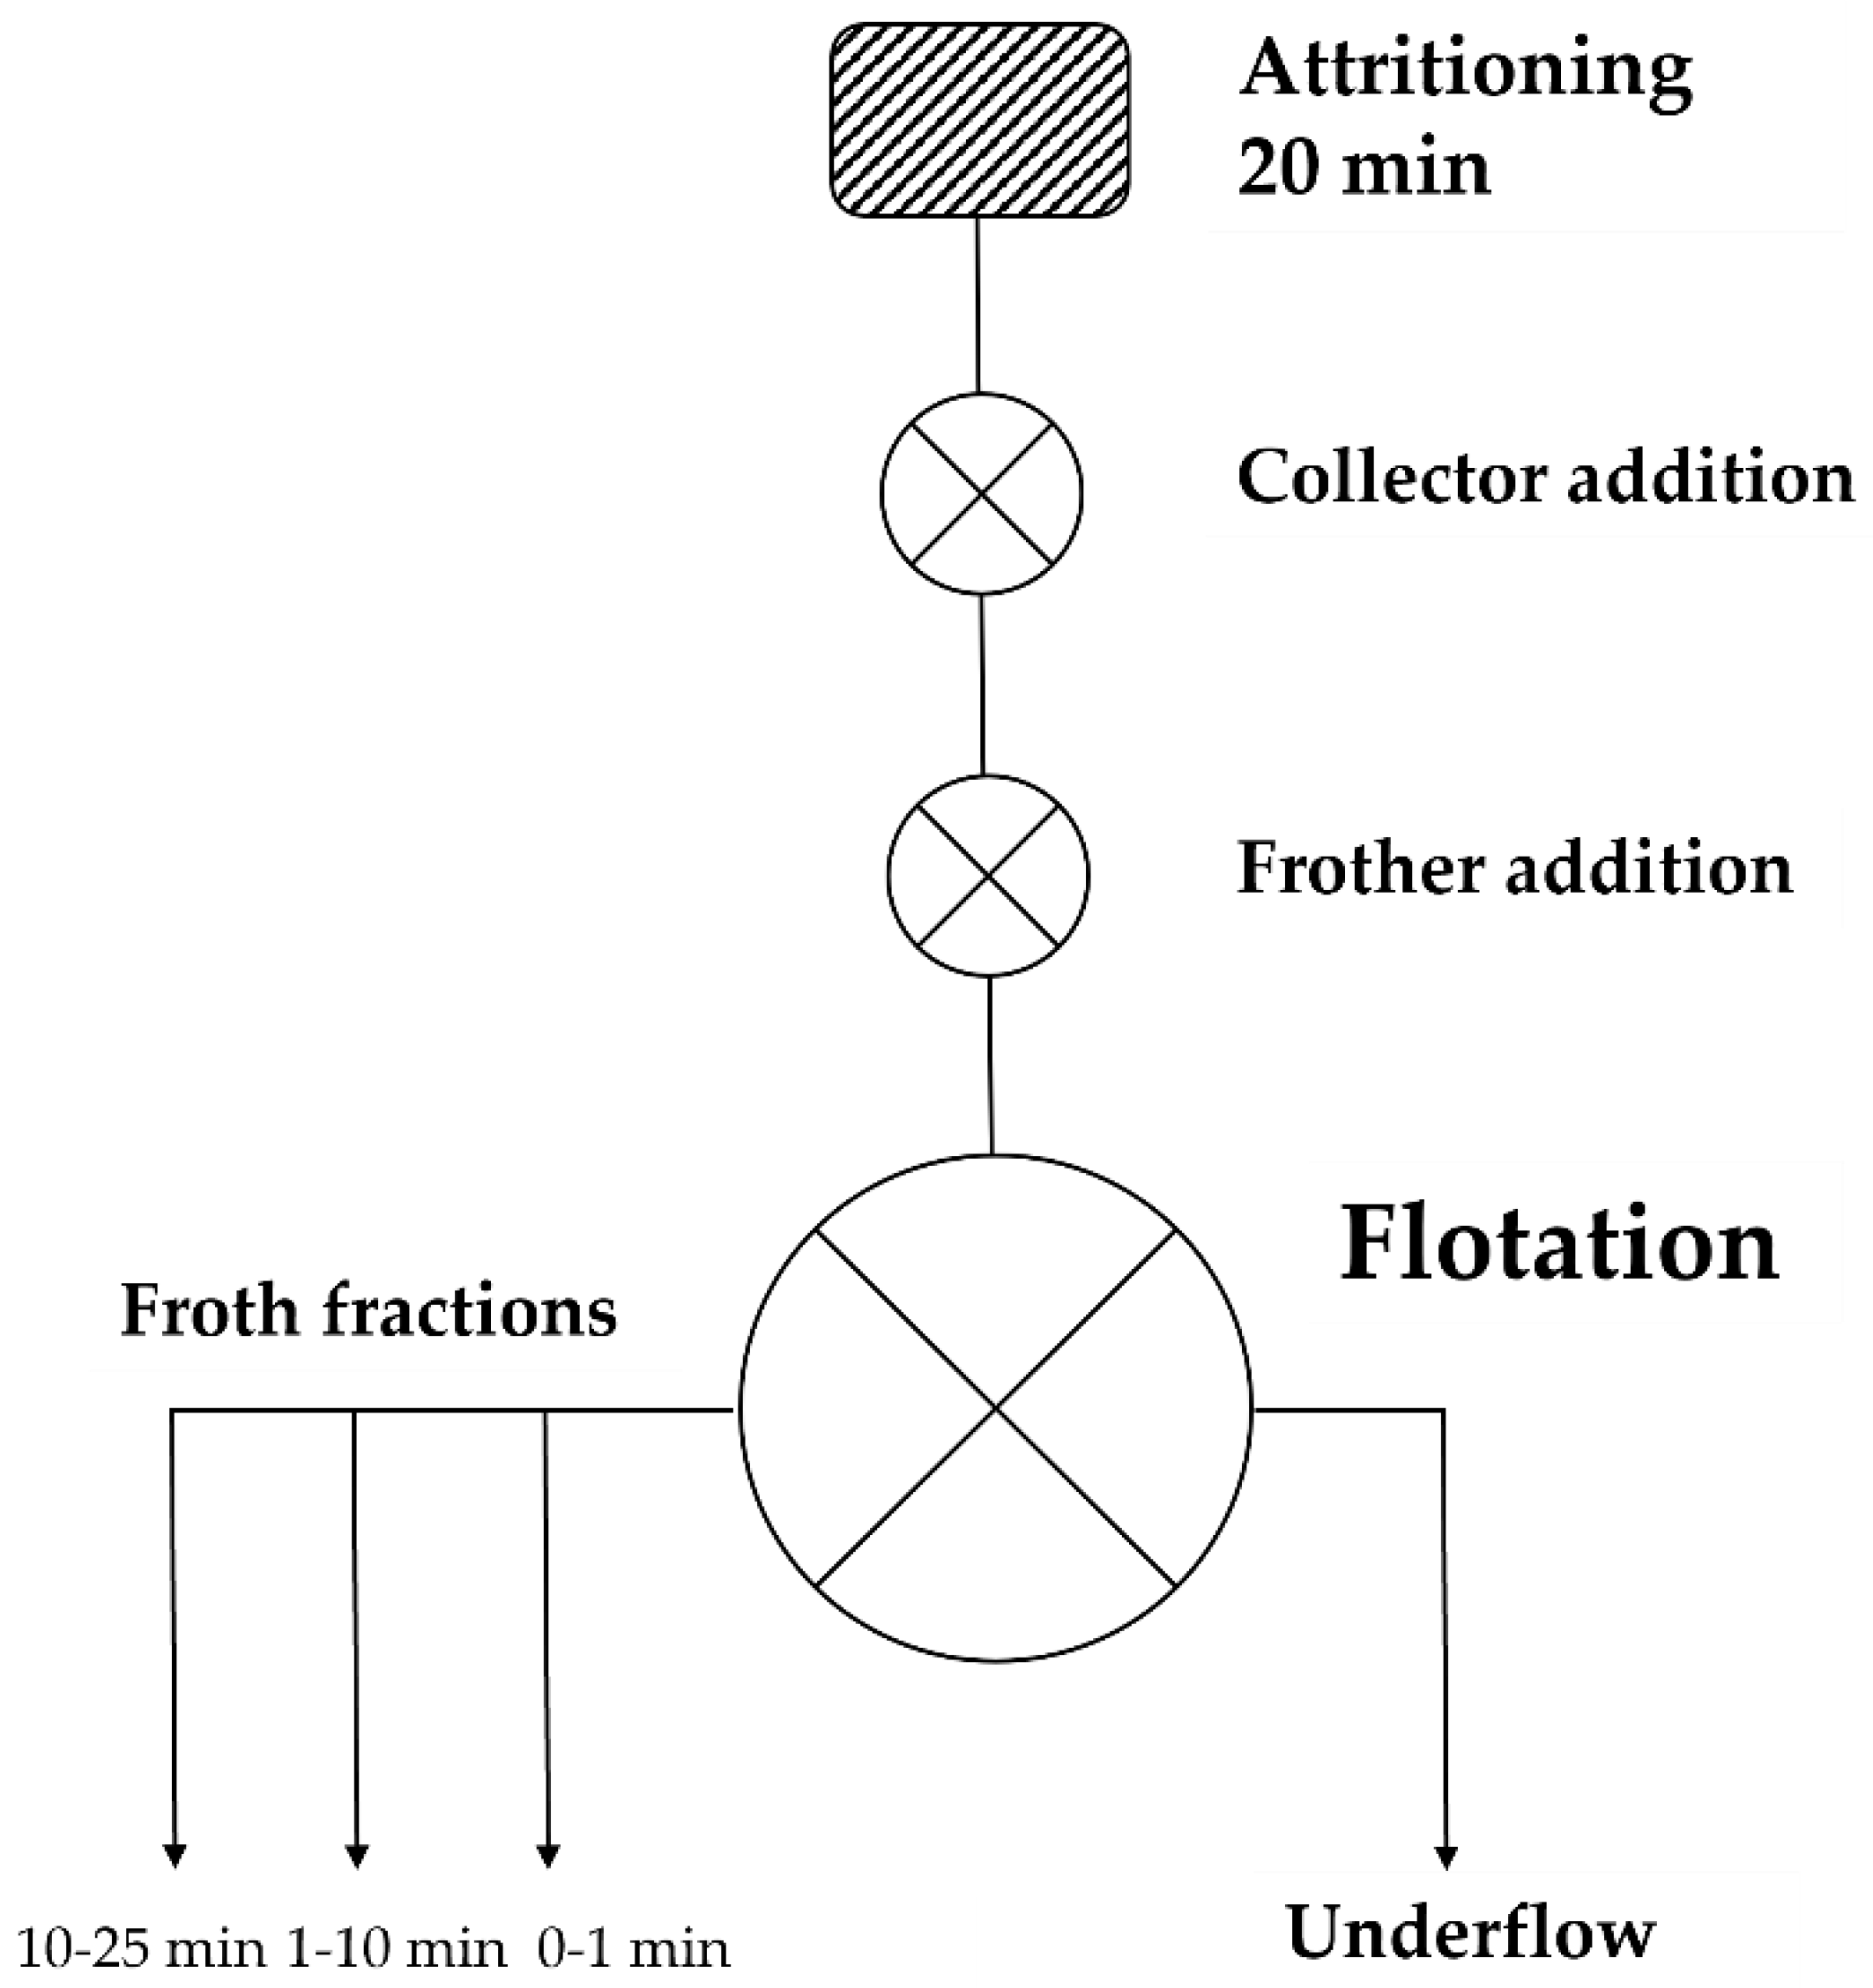
2.1.2. Flotation Experiments

Batch flotation experiments were performed with a bench-scale flotation device (Lab Cell-60 mm FloatForce mechanism, Outotec, Espoo, Finland) using a flotation cell with a 1l capacity. After attritioning, 40 g of the material was placed in the cell, and one liter of tap water was added to obtain a solid–liquid ratio of 40 g/L. The pulp was agitated with an impeller at 1000 RPM for 3 min. After this, kerosene was added as a collector, followed by 3 min of conditioning. Lastly, frother was added, with a conditioning period of 2 min.
Immediately after conditioning, the air flow in the flotation cell was initialized at a rate of 2 L/min, marking the start of the flotation experiments. Collecting the froth was started immediately after the froth layer reached a sufficient height for scooping (ca. 10 s after turning on the air flow). The froth was manually collected into three distinctive containers, to monitor the kinetics of the separation. The first froth fraction was collected during the time period 0–1 min, the second fraction during 1–10 min, and a third fraction during 10–25 min. Due to the froth formation being more frequent in the early stages of the experiment, the froth was collected in a continuous fashion during the first minute, then ten scoops per 30 s in the second fraction, and finally 15 scoops per min in the third fraction. To keep the froth level at a sufficient height for sampling during the experiment, a background solution consisting of tap water and frother was added to the cell in between sampling. Figure 2 depicts the experimental procedure in detail.
In order to produce enough feed for the slag cleaning experiments, and to investigate the reproducibility of the results, four flotation experiments with identical parameters were performed. The operating parameters used were those considered optimal (i.e., 20 min attritioning, 150 g/t kerosene, 8 ppm methyl isobutyl carbinol), according to previous study [21]. The use of these same parameters follows the idea of Cu-slag cleaning being an expansion of previous efforts to integrate mechanical separation and slag cleaning. Furthermore, reproducibility was important, as the factors affecting the recovery of the metallic Cu and Al particles in the froth phase were not completely understood. In the waste LIBs, Cu and Al are present in their metallic form, and would thus not be extracted by hydrophobic forces. It was hypothesized that the Cu/Al recovery in froth was partially subject to statistical factors, such as the shape and size distribution of metal particles in each individual flotation feed. For example, smaller and thinner particles were expected to be more readily drawn towards the pulp surface based on the relatively large buoyant forces and hydrodynamic factors, and would thus be more likely to enter the froth phase. The chemical sensitivity of the system, however, was also tested by performing experiments with alternative frothers, and varying collector concentrations. When determining the frother concentration of the alternative frothers, critical coalescence concentration of the frothers were considered [29].
Three different frothers were applied in the experimental series. One of the frothers was an oil-based commercially available reagent, namely methyl isobutyl carbinol (MIBC, supplied by Sigma-Aldrich, St. Louis, MO, USA), and the other two were cellulose-based reagents. The cellulose-based frothers were hydroxypropyl methylcellulose (HPMC, supplied by Sigma-Aldrich, St. Louis, MO, USA), and an experimental cellulose–surfactant mixture frother recently developed and published by Nuorivaara et al. [30], commonly referred to as CellFroth. With a goal towards more sustainable mineral processing, froth flotation reagents developed from renewable sources are a viable alternative and are thus of interest to study. The present work is the first effort of applying such reagents in the context of LIB active material flotation. The experimental parameters are shown in Table 1.
The resulting froth fractions and underflow were dewatered by vacuum filtering, and air dried in a convection oven (Memmert UE400, Büchenbach, Germany) for 48 h. Drying was carried out at 40 °C, to avoid the decomposition of any fluorine compounds originating from the batteries (PVDF, electrolyte) into potentially hazardous components, such as hydrofluoric acid (HF). Hazards related to HF, and fine particles originating from the black mass were also acknowledged during the experimentation, as all flotation experiments were performed with full body chemical resistant overalls, boots, and gloves. Atmospheric HF (g) was also monitored with a detector (GfG Micro IV, Dortmund, Germany) during all working stages.

2.1.3. Sample Preparation for Pyrometallurgical Reduction Experiments

The dried flotation underflow fractions from the MIBC1-MIBC4 experiments were used in the pyrometallurgical experiments. Underflow fraction was used directly as non-ground material, and additional experiments with ground underflow were conducted in order to provide a fraction with more homogeneous structure for the subsequent pyrometallurgical process, and to investigate whether grinding can increase the kinetics of the redox reactions. To achieve this, the flotation underflow fractions (from the four experiments) were combined after XRF characterization and divided in half to provide a feed for the as-is experiments, and the milling. For the milling, a ring mill with tungsten carbide grinding media (Fritsch Pulverisette 9, Idar-Oberstein, Germany) was applied. A 15 g batch was placed in the mill, and milling was performed in 30 s intervals for 30, 60, and 90 s. In between the intervals, sampling for the particle size measurements was performed, and a sample of ca. 1 g was scooped from the grinding vessel.

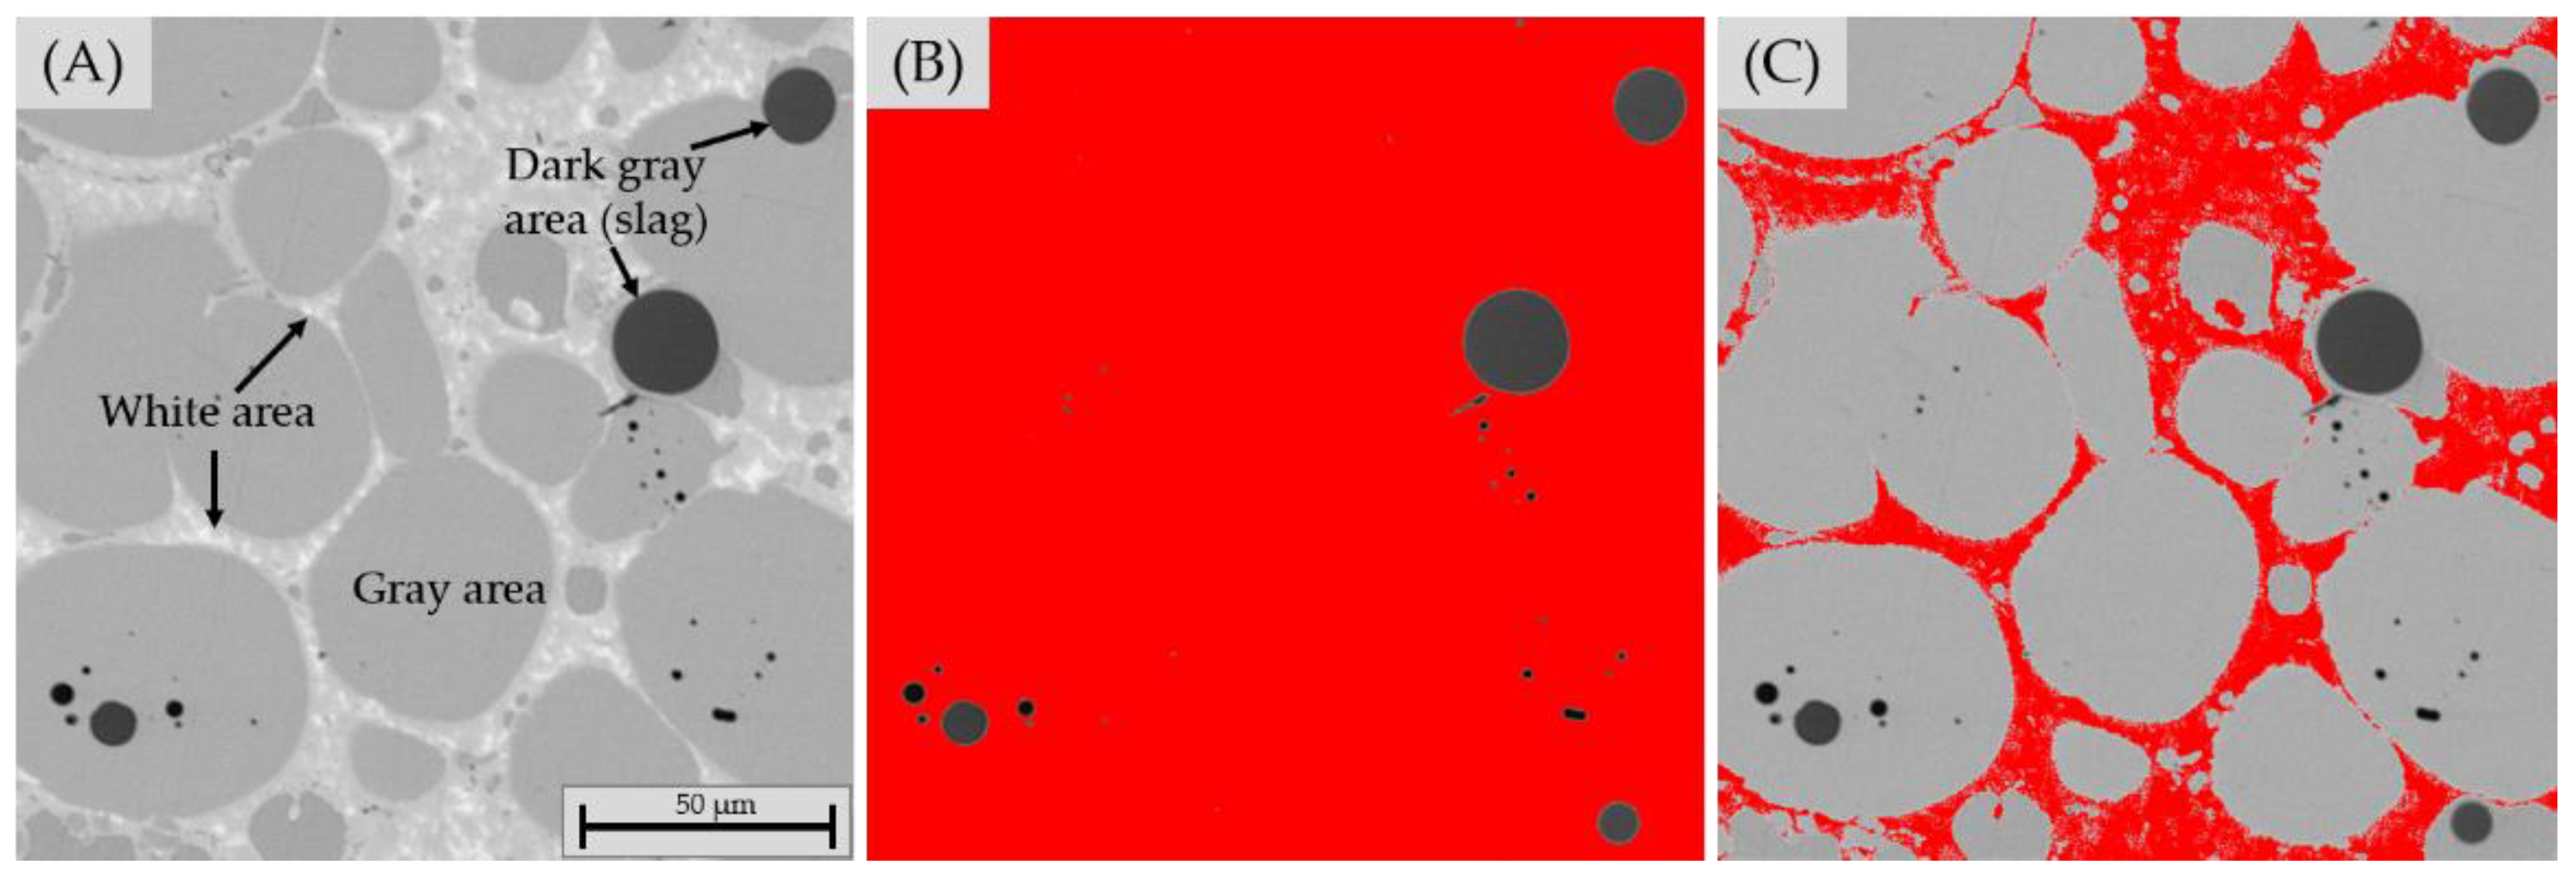
2.1.4. Characterization

Particle size measurements for the flotation feed and milled underflow products were performed with a laser diffraction particle size analyzer (Malvern Panalytical Mastersizer 3000, Malvern, UK). Four underflow samples were analyzed in total, with grinding times of 0, 30, 60, and 90 s. Measurements were performed in aqueous media. Prior to the particle size measurements, the measured samples were stirred vigorously at 2500 RPM for ca. 2 min, after which five measurements were performed and average values for the frequency distribution and cumulative distribution were calculated.
Froth flotation products (froth fractions and underflow) were weighed and characterized for their Co, Ni, Mn, and Cu content using an X-ray fluorescence (XRF) gun (Oxford Instruments, X-MET 5000, Abingdon, UK). In order to improve the statistical significance of the XRF results, each sample was characterized five times from different locations on the sample surface, and an average value was calculated. Similarly to the authors’ previous article [21], a regression model that was based on inductively coupled plasma mass spectrometry (ICP-MS) results for selected samples was utilized to adjust the XRF values and improve its accuracy. Graphite concentrations in selected fractions were commissioned to an external, certified laboratory (ALS Global, Loughrea, Ireland).
Based on the results of the characterization, values for head grade, cumulative grade, and cumulative recovery were calculated for Co, Ni, Mn, and Cu in every experiment. Furthermore, separation efficiency (SE) was calculated for Cu in the froth flotation experiments. The calculations were performed according to Equation (1) [31].
SE = 100 C m ( c f ) ( m f ) f
where:
  • C = Fraction of feed weight reporting to the froth/overflow of the sieve (wt.%)
  • m = Metal content of Cu (wt.%)
  • c = Fraction of Cu reporting to the froth/overflow of the sieve (wt.%)
  • f = Fraction of Cu reporting to the feed/underflow of the sieve (wt.%)
In the Cu SE calculations for froth flotation, cumulative values for C, c, and f were applied for each fraction (0–1 min, 0–10 min, 0–25 min). Since all Cu in the mixture was assumed to proceed from metallic foils, the m value was determined as 100. Nevertheless, SE values were not calculated for cathode active particles as the different stoichiometric ratios of elements in the varying cathode chemistries involved in the industrial LIB waste made it challenging to determine an accurate single value for m.

2.2. Pyrometallurgy

The Cu-slag utilized in this study was an industrial, non-cleaned copper smelting slag and its chemical composition is shown in Table 2. The slag was pre-ground by the smelter company. The chemical composition of the underflow fraction from froth flotation of spent batteries (SBs) was analyzed with ICP-OES at Labtium Oy (Kuopio, Finland), and the graphite content by ALS Global (Loughrea, Ireland). These results are presented later in Section 3.1.5.
Two different methods were used for sample preparation. In the first method, the Cu-slag was weighed into a cone-shaped crucible (fused quartz with purity of >99.998% by Finnish SpecialGlass Oy, Espoo, Finland) and not-ground SBs were weighted separately and added on top of the slag. In the second method, Cu-slag was firstly mixed with the ground SBs in the mortar and the prepared mixture was weighted into a crucible. The amount of mixture in the crucible was always 1.0 g. Two different concentrations of SBs in the starting mixture were used: 10 and 20 wt.%. The chemical composition of the starting mixture is presented in Section 3.2.1.
The pyrometallurgical experiments were conducted in an LTF 16/450 single phase vertical tube furnace (Lenton, Parsons Lane, Hope, UK) at 1300 °C, which corresponds to the temperature used in the industrial copper flash smelting process. A detailed schematic of the furnace was presented in the study of Ruismäki et al., [21] and details on the furnace parameters were summarized in our previous study [22].
The crucible with the sample was placed in a basket made from Kanthal A-wire, and then the basket was attached to the Kanthal A-wire hanging from inside of the furnace. In the next step, the sample was lifted to the cold zone and the bottom part of the furnace was closed with a rubber plug. After closing the furnace, argon flow (99.999%, Linde-AGA, Espoo, Finland) was turned on and the furnace was flushed with agon for approximately 15 min. After that, the sample was lifted to the hot zone of the furnace and kept there for different contact times: 5, 10, 20, 40, and 60 min. At the end of the pre-set contact time, the sample was quenched to solid state very rapidly (2–3 s) [32].
After quenching, the samples were mounted in epoxy (Struers, Ballerup, Denmark), sectioned in half, then remounted in epoxy. After that, the sample cross-section was ground and polished with traditional wet metallographic method. The polished samples were coated with a carbon layer using a vacuum evaporator (JEOL IB-29510VET, Peabody, MA, USA) to achieve sufficient electrical conductivity on the sample surface.

2.3. Characterization of Sample Composition

The microstructures of all prepared samples were analyzed with Scanning Electron Microscope (SEM, Mira3, Tescan, Brno, Czech Republic) and the chemical concentration of major elements in the slag as well as chemical composition of metal alloy and matte were determined with Energy Dispersive Spectrometry (UltraDry Silicon Drift EDS, Thermo Fisher Scientific, Waltham, MA, USA). The following parameters were used in the analysis: an acceleration voltage of 15 kV and beam current between 9 and 10 nA on the sample surface. Standards were used for the concentration quantifications: Al (Kα, aluminum), As (Lα, cobaltite), Ca (Kα, anhydrite), Co (Kα, cobalt), Cu (Kα, copper), Fe (Kα, hematite), K (Kα, sanidine), Mg (Kα, magnesium), Mn (Kα, manganese), Ni (Kα, nickel), O (Kα, quartz), Pb (Mα, lead), S (Kα, marcasite), Sb (Lα, antimony), Si (Kα, quartz), Sn (Lα, tin), Zn (Kα, zinc).
Analysis of sample microstructures with SEM showed that the metal alloy formed on top of the slag consisted of two compositionally distinct areas (white and gray in SEM backscattered electron images, Figure 3A). EDS analysis indicated that the main compositional differences between these areas are in Cu/Fe. The heterogeneous structure of the metal alloy was most likely due to insufficient cooling rate during quenching, short experimental times, and/or grain boundary effects. Additionally, round, dark gray patches were observed within the metal alloy. The chemical composition of these areas was relatively close to the composition of the slag phase.
Due to the heterogeneity of the metal alloy, the average chemical composition was determined using a statistical approach. Between 20 and 40 SEM images of the metal alloy were taken from each sample. The number of images taken depended on the size of the metal alloy visible in the sample cross-section. All photos were taken with 1200× magnification, using the same brightness and contrast settings for all samples. Each image was then analyzed with ImageJ Fiji software, which allowed measuring the area percentage of different phases. As the first step, the threshold of the image was adjusted in a way that the dark grey phase (slag) was excluded from the calculation, as presented in Figure 3B. The measured area percentage corresponded to total area of white and gray phase (white + gray phase %). In the second step, the image threshold was changed in a way that the software measured only the area percentage of the white phase (white phase %), as shown in Figure 3C. Finally, the area percentage of the gray phase was calculated according to Equation (2):
gray phase % = (white + gray phase %) − white phase %
The calculated percentages of white and gray areas were then normalized to 100% to exclude the dark grey phase (slag) from the calculations. After that, the average area percentage for both phases were calculated for each sample, based on the 20–40 SEM images obtained.
After analyzing the compositions of each phase (white area and light gray area) with EDS, the chemical concentration of each element in the metal alloy was calculated according to Equation (3):
C ¯ M e ( metal alloy ) = ( C ¯ M e ( W ) X ¯ ( W ) ) + ( C ¯ Me ( g ) X ¯ ( g ) ) 100
where C ¯ Me ( metal alloy ) is the average concentration of metal Me in metal alloy; C ¯ Me ( W ) is the average concentration of metal Me in white phase; X ¯ ( W ) is the average area percentage of white phase; C ¯ Me ( g ) is the average concentration of metal Me in gray phase; X ¯ ( g ) is the average area percentage of gray phase.
One of the ways to monitor the reduction progress was to plot the concentrations of minor/trace elements in the slag as a function of reduction time. In order to do this, reliable trace element concentration data had to be obtained using the LA-ICP-MS technique. The details of the apparatus, as well as the analysis parameters were the same as presented in an earlier article [22]. The time-resolved analysis signals were individually treated with the Glitter software (version 4.5) [33]. Table 3 shows the standards used and detection limits obtained.
From each sample, 11–15 points were analyzed from the slag. Most of these points were selected closer to the bottom of the sample, i.e., nearer the matte phase. However, three to five points were taken closer to the surface, i.e., nearer the metal alloy phase, for comparing the trace element concentrations in different parts of the samples. For most trace elements, moderate concentration gradients existed in the slag, which was expected due to the relatively short high-temperature contact times. For lead and zinc, the concentration differences were the highest: their concentrations close to the top of the samples were much lower, most likely due to increased vaporization. The lower concentrations obtained closer to the alloy were excluded from the results presented in this work.

3. Results and Discussion

3.1. Froth Flotation Experiments

3.1.1. Chemical Composition of the LIB Waste

A detailed mass balance and elemental analysis of the sieved industrial black mass used in this study were published already in the previous article of the authors [21] and is therefore not reported here. However, the specific head grades of Co, Ni, Mn, and Cu in the flotation experiments are listed in Table 4 below. These values were calculated based on the elemental composition of the froth and underflow fractions, individually for each experiment. Additionally, the average graphite concentration in the flotation feed is also shown in Table 4.
As shown in Table 4, the head grade values of the components fluctuate quite noticeably, reflecting the heterogeneous nature of the industrial black mass feed. For example, the lowest head grade of Cu was calculated at 18.1 wt.% (experiment MIBC3), whereas the highest was 27.4 wt.% (experiment MIBC 2). Therefore, calculating the composition of each individual feed batch allows for a more accurate evaluation of the flotation separation performance.

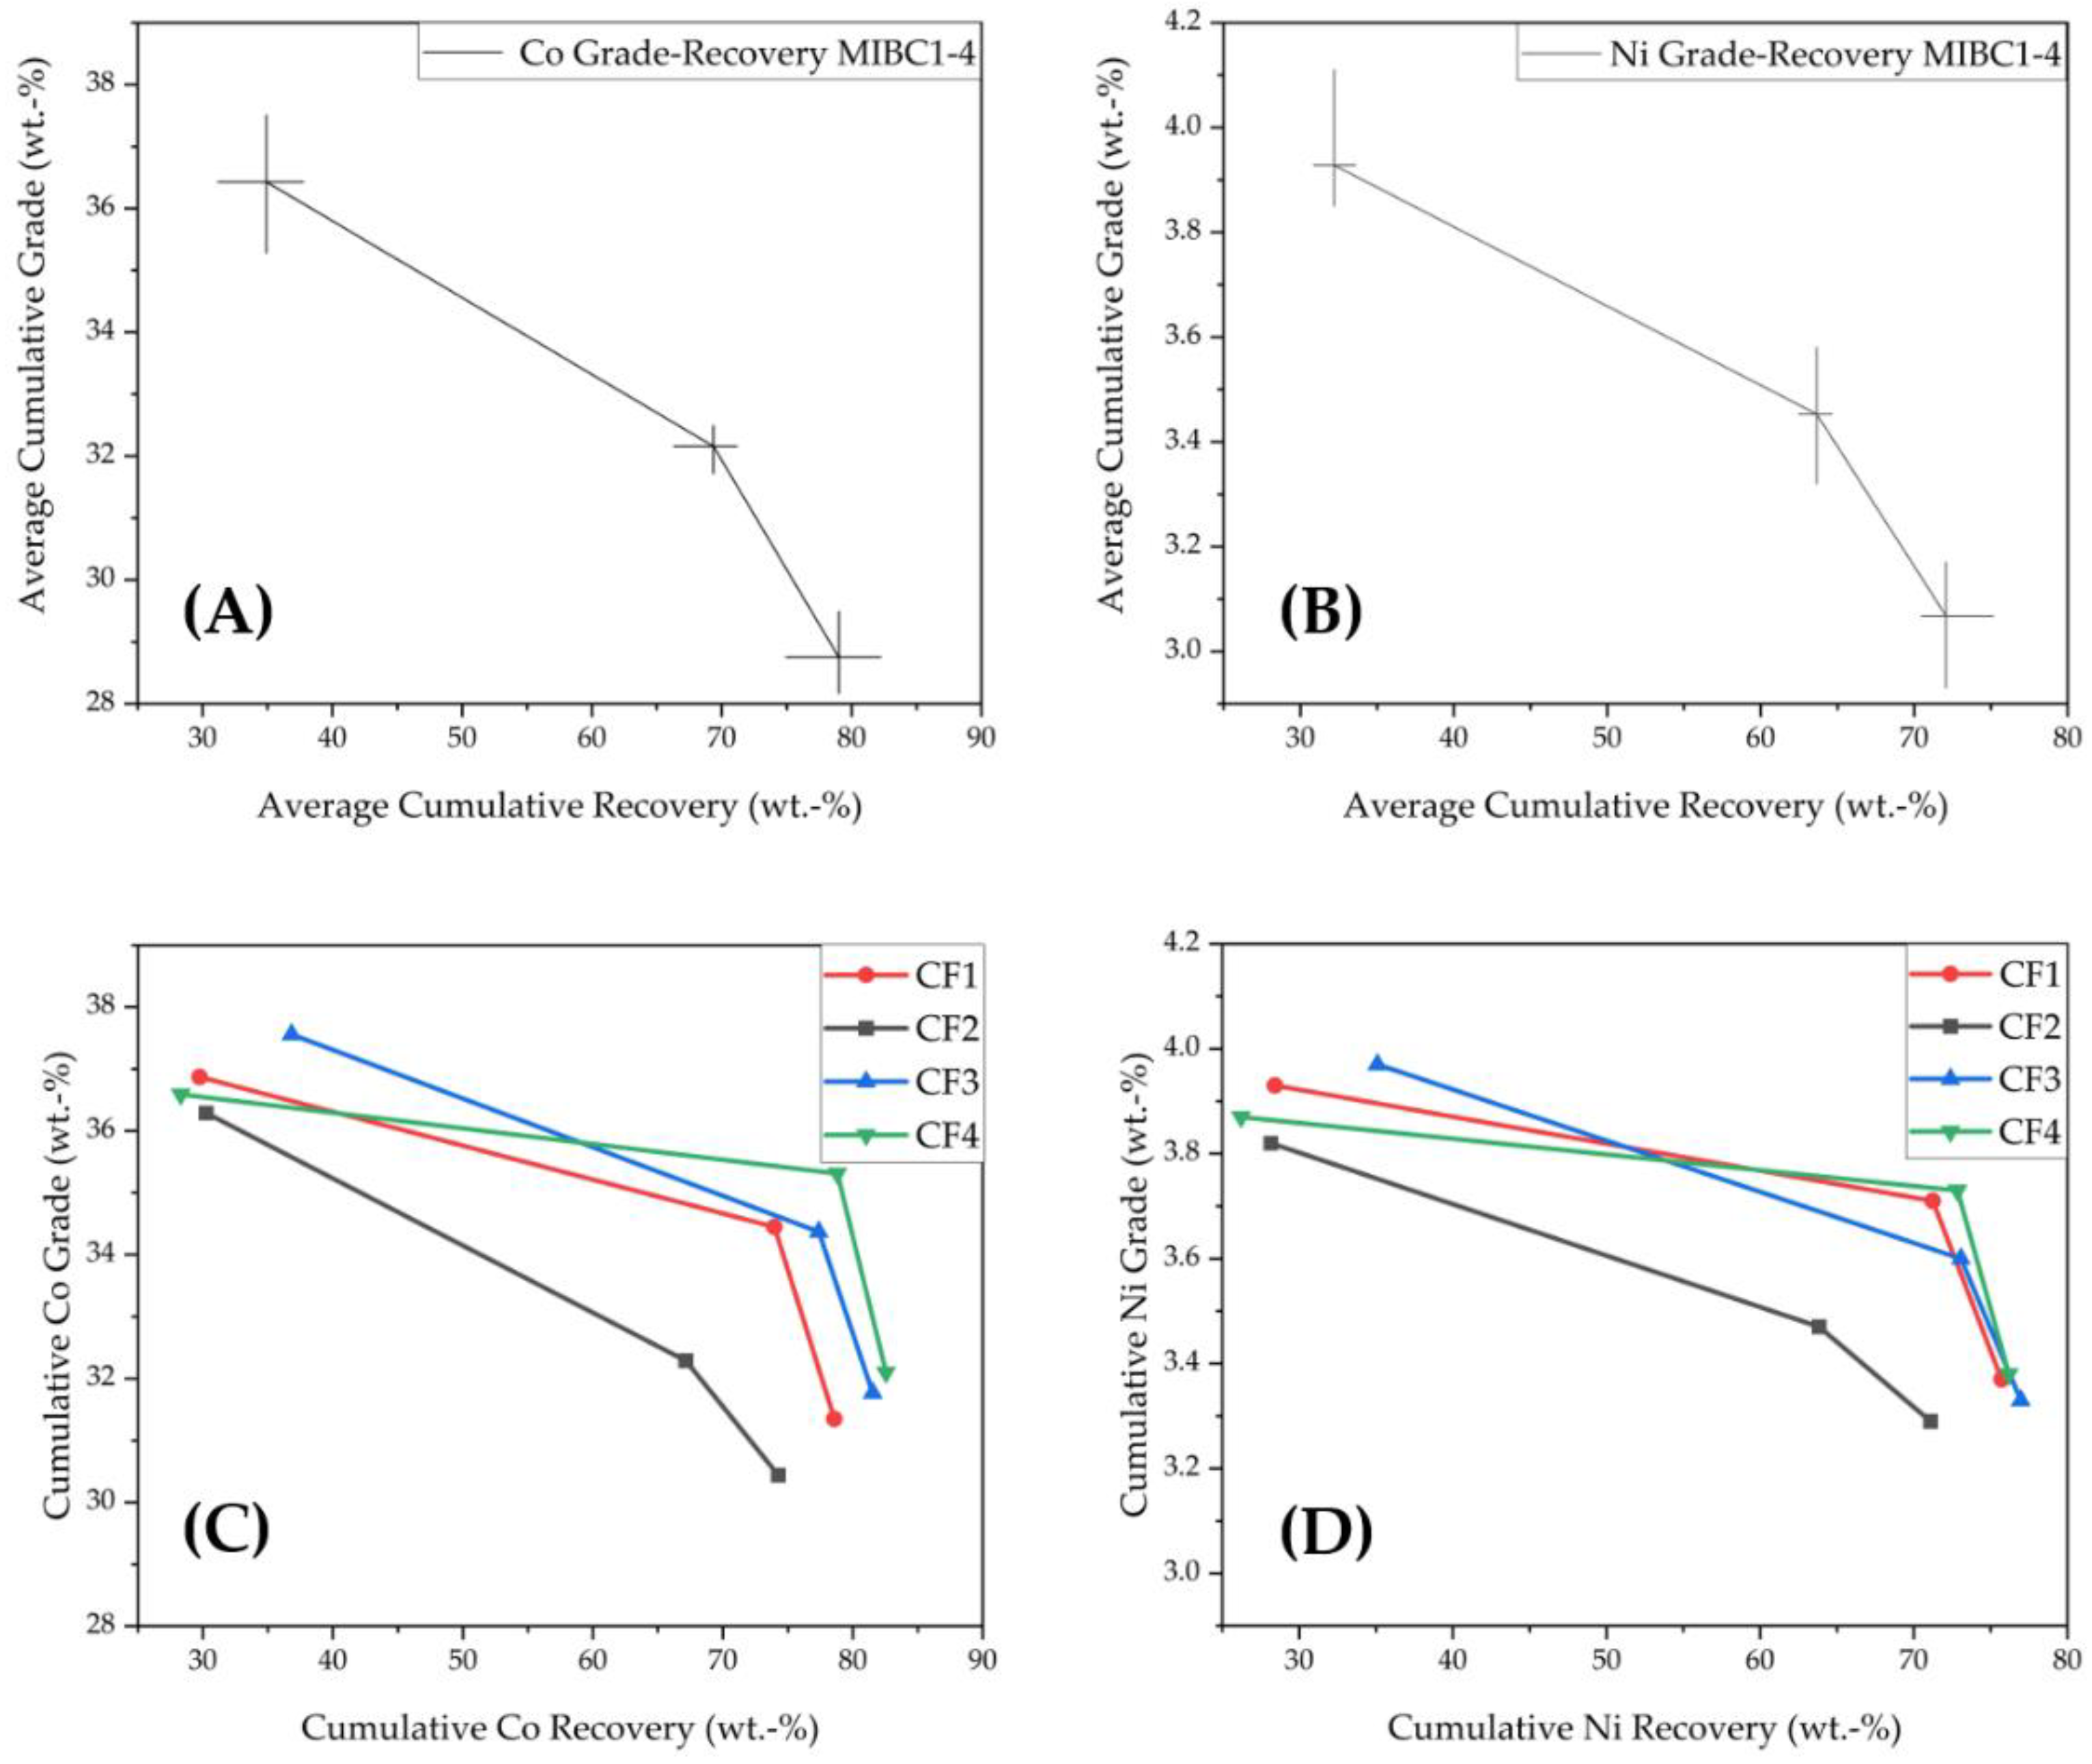
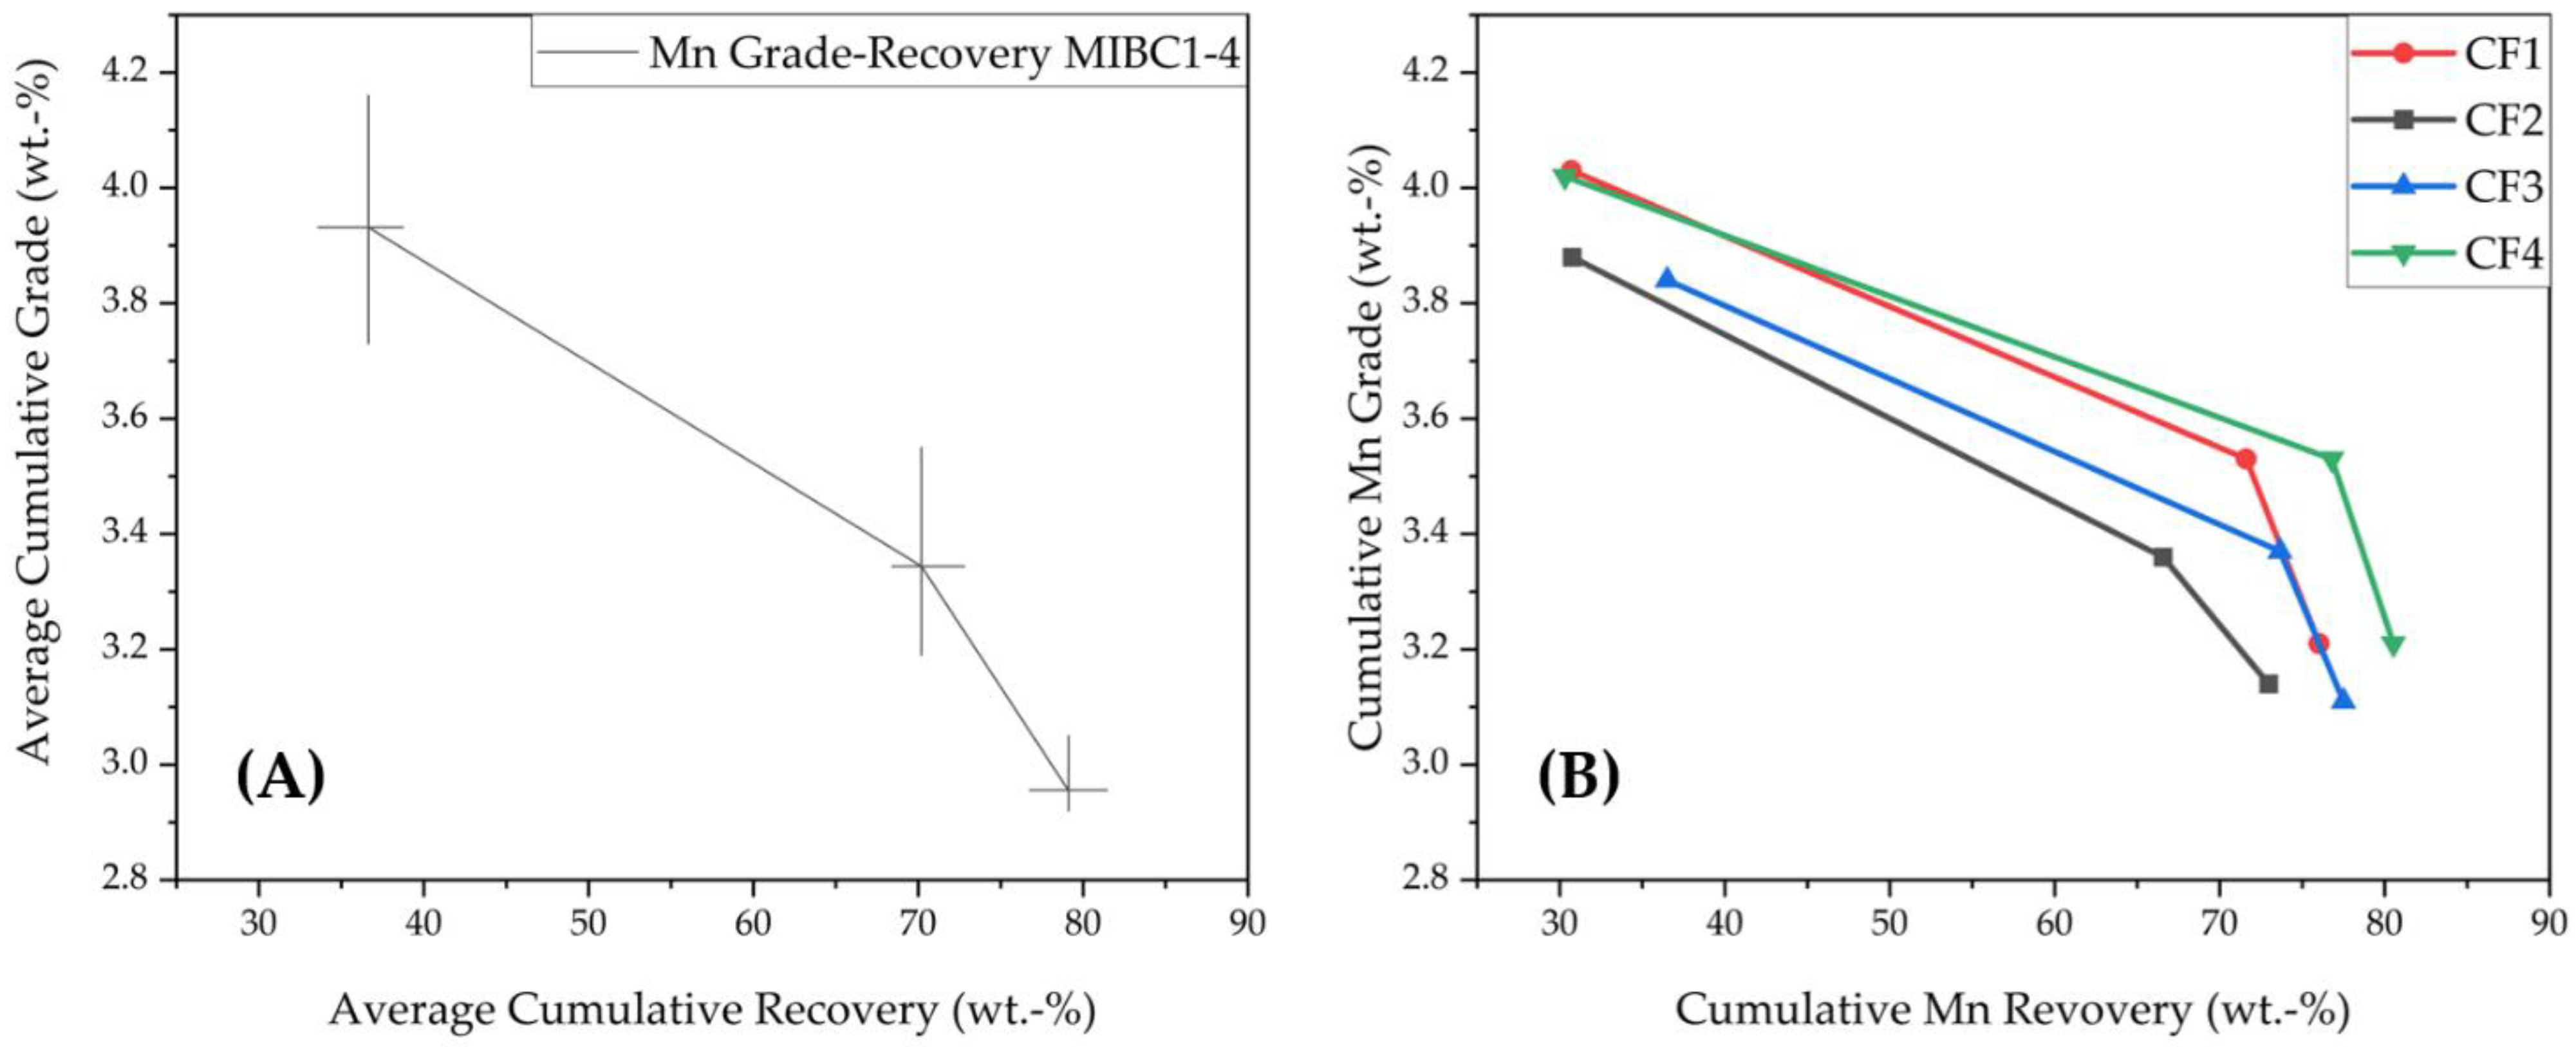
3.1.2. Grade-Recovery Curves for Co and Ni

Figure 4 shows the grade-recovery curves for Co and Ni in the flotation experiments. The data points in the graphs correspond to the cumulative grade and recovery values (cumulative froth fractions) at flotation time of 1, 10, and 25 min. Additionally, grade-recovery curves calculated for Mn are found in the Appendix A, in Figure A1. For the repetition experiments (MIBC 1–4) depicted in Figure 4A,B, the average grade-recovery curves are shown. The horizontal error bars indicate the highest and lowest recoveries recorded in the individual experiments (per cumulative froth fraction), and the vertical error bars indicate the highest and lowest grades measured in the individual experiments (per cumulative froth fraction).
Figure 4A,B show that, when MIBC is used, the cumulative recovery for Co and Ni present average values of 79.01, and 72.09%, respectively. The average final grades for Co and Ni in these experiments were 28.75 and 3.07%, respectively. When compared to the head grades presented in Table 4, these results clearly indicate that the enrichment of black mass is possible. Nevertheless, it is of note that despite the identical operating parameters used in these experiments, a meaningful fluctuation in the performance was observed, likely due to the varying feed composition. When compared to the benchmark separation achieved in the authors’ previous publication (Co grade 29%, recovery 81%, Ni grade 3.0%, recovery 74%) [21], the repeatability of the results can be considered acceptable within experimental error.
From Figure 4C,D, the results with the alternative frothers (CellFroth/HPMC) and varying collector concentrations can be compared. The froth Co grade values in these experiments range from 30 to 32%, with recoveries between 74–83%. Ni grades range from 3.3–3.4%, and recoveries of 71–77% are recorded. Again, when compared to Table 4, a selective enrichment of active particles is evident from this data.
Interestingly, the alternative frother(s) seem to perform slightly better than MIBC. However, it can also be stated that the chemical sensitivity of the system seems to be relatively low. For example, in the CellFroth experiments (CF1–CF3), the collector concentration does not seem to have a significant effect on the separation, with variations well within the experimental error deduced from the MIBC experiments. Indeed, while the best Co grade-recovery (31.77%, 81.52%) is achieved with the highest collector dosage of 300 g/t, similar results were obtained in the absence of collector (31.35%, 78.58%). Furthermore, the 0 g/t collector seems to work better than the 150 g/t collector setup (30.44%, 74.26%). When 30 ppm of HPMC is applied as frother (CF4), the Co separation at 0 g/t collector is slightly better (32.10% Co grade, 82.54% recovery), even compared with the CellFroth experiment with a 300 g/t collector dosage. Total recovery of the active material in the CellFroth/HPMC experiments is marginally higher, when compared to MIBC. These results show promise for the application of sustainable frothers, such as CellFroth, in black mass flotation. However, one factor that justifies the use of MIBC, at least presently, is that it achieves similar active particle recoveries in much lower concentrations (8 ppm of MIBC vs. 30 ppm CellFroth/HPMC).
In general, the results indicate that when the PVDF is not decomposed, the majority of the cathode particles are sufficiently hydrophobic for bubble-particle attachments to take place and are thus extracted in the froth–a result in line with other recently published studies [28]. Another mechanism increasing the cathode active material recovery might include the agglomeration of hydrophobic/hydrophilic species, which increases the recovery of hydrophilic black mass particles in the froth due to entrapment. Oil-based collectors, such as kerosene used in this study, have also been shown to promote cathode hydrophobization [28]. Nevertheless, as shown in experiments CF1 and CF4, cathode active particles can be predominantly recovered in the froth even in the absence of collector. It should also be noted that the fine particles (<10 µm) present in the LIB waste (as seen later in Section 3.1.4) might also be recovered via entrainment. In summary, high recoveries of black mass cathode particles (ca. 80%) can be achieved whenever an adequate dosage of frother combination is introduced to the system.

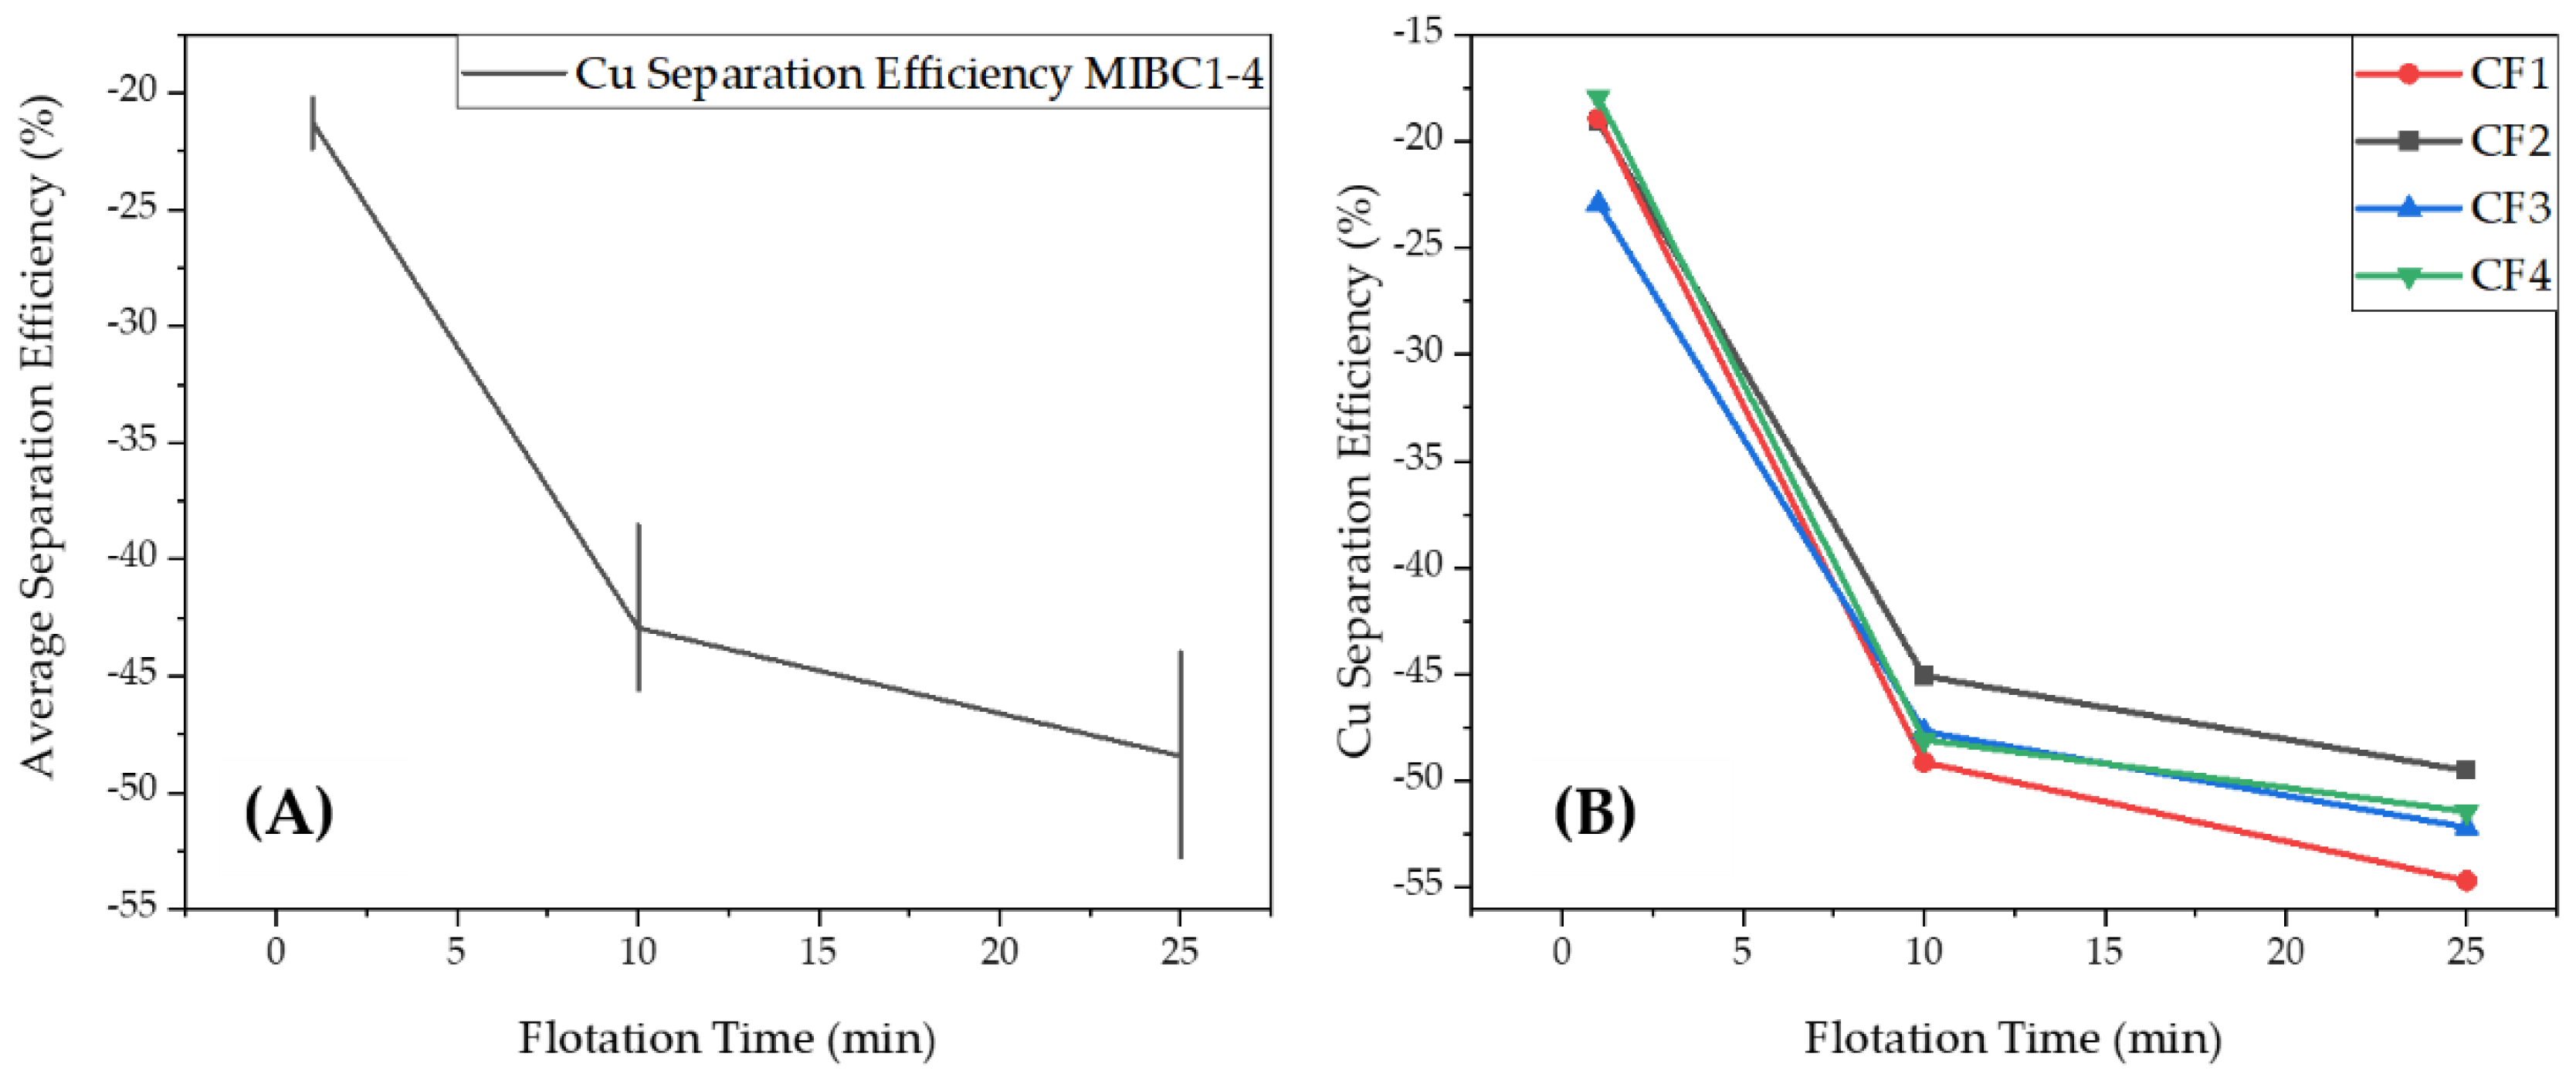
3.1.3. Separation Efficiency of Cu

Figure 5 depicts the separation efficiency (SE) values for Cu in the froth flotation experiments. For the repetition experiments (MIBC 1–4) depicted in Figure 5A, the average SE(t) is shown, with error bars indicating the high and low limit SE values calculated for the individual experiments.
The negative Cu SE values in both the CellFroth and MIBC experiments show a clear trend of Cu being enriched effectively in the underflow fraction. In the experiments performed with MIBC (Figure 5A), SE values (at t = 25 min) between −44 and −53% are reported. The fluctuation in the values might indicate that, to some extent, Cu is drawn to the froth fraction via non-selective processes. As Cu is present in a metallic phase in the LIB waste feed, hydrophobic forces are not expected to be responsible for the extraction of Cu in the froth. Instead, buoyant forces and hydrodynamic factors are expected to draw the metallic flakes of Cu towards the pulp surface and ultimately to the froth layer. Thin and small Cu particles with a relatively large surface area are affected by such forces the most and are therefore more likely to be extracted in the froth. However, the majority of the Cu is still clearly extracted in the underflow.
Interestingly, experiments performed with the alternative frother (CF1–CF4) show more consistent and marginally better SE values for Cu, as the SE values range from −50 to −55%, as seen in Figure 5B. The most efficient Cu separation (−55%) is recorded in experiment CF1. This experiment performs marginally better even when compared to the benchmark Cu SE value achieved in the previously published study of the authors (−54%) [21]. The results confirm the finding that flotation can be utilized to selectively separate the LIB active materials in the froth while enriching metallic Cu in the underflow.

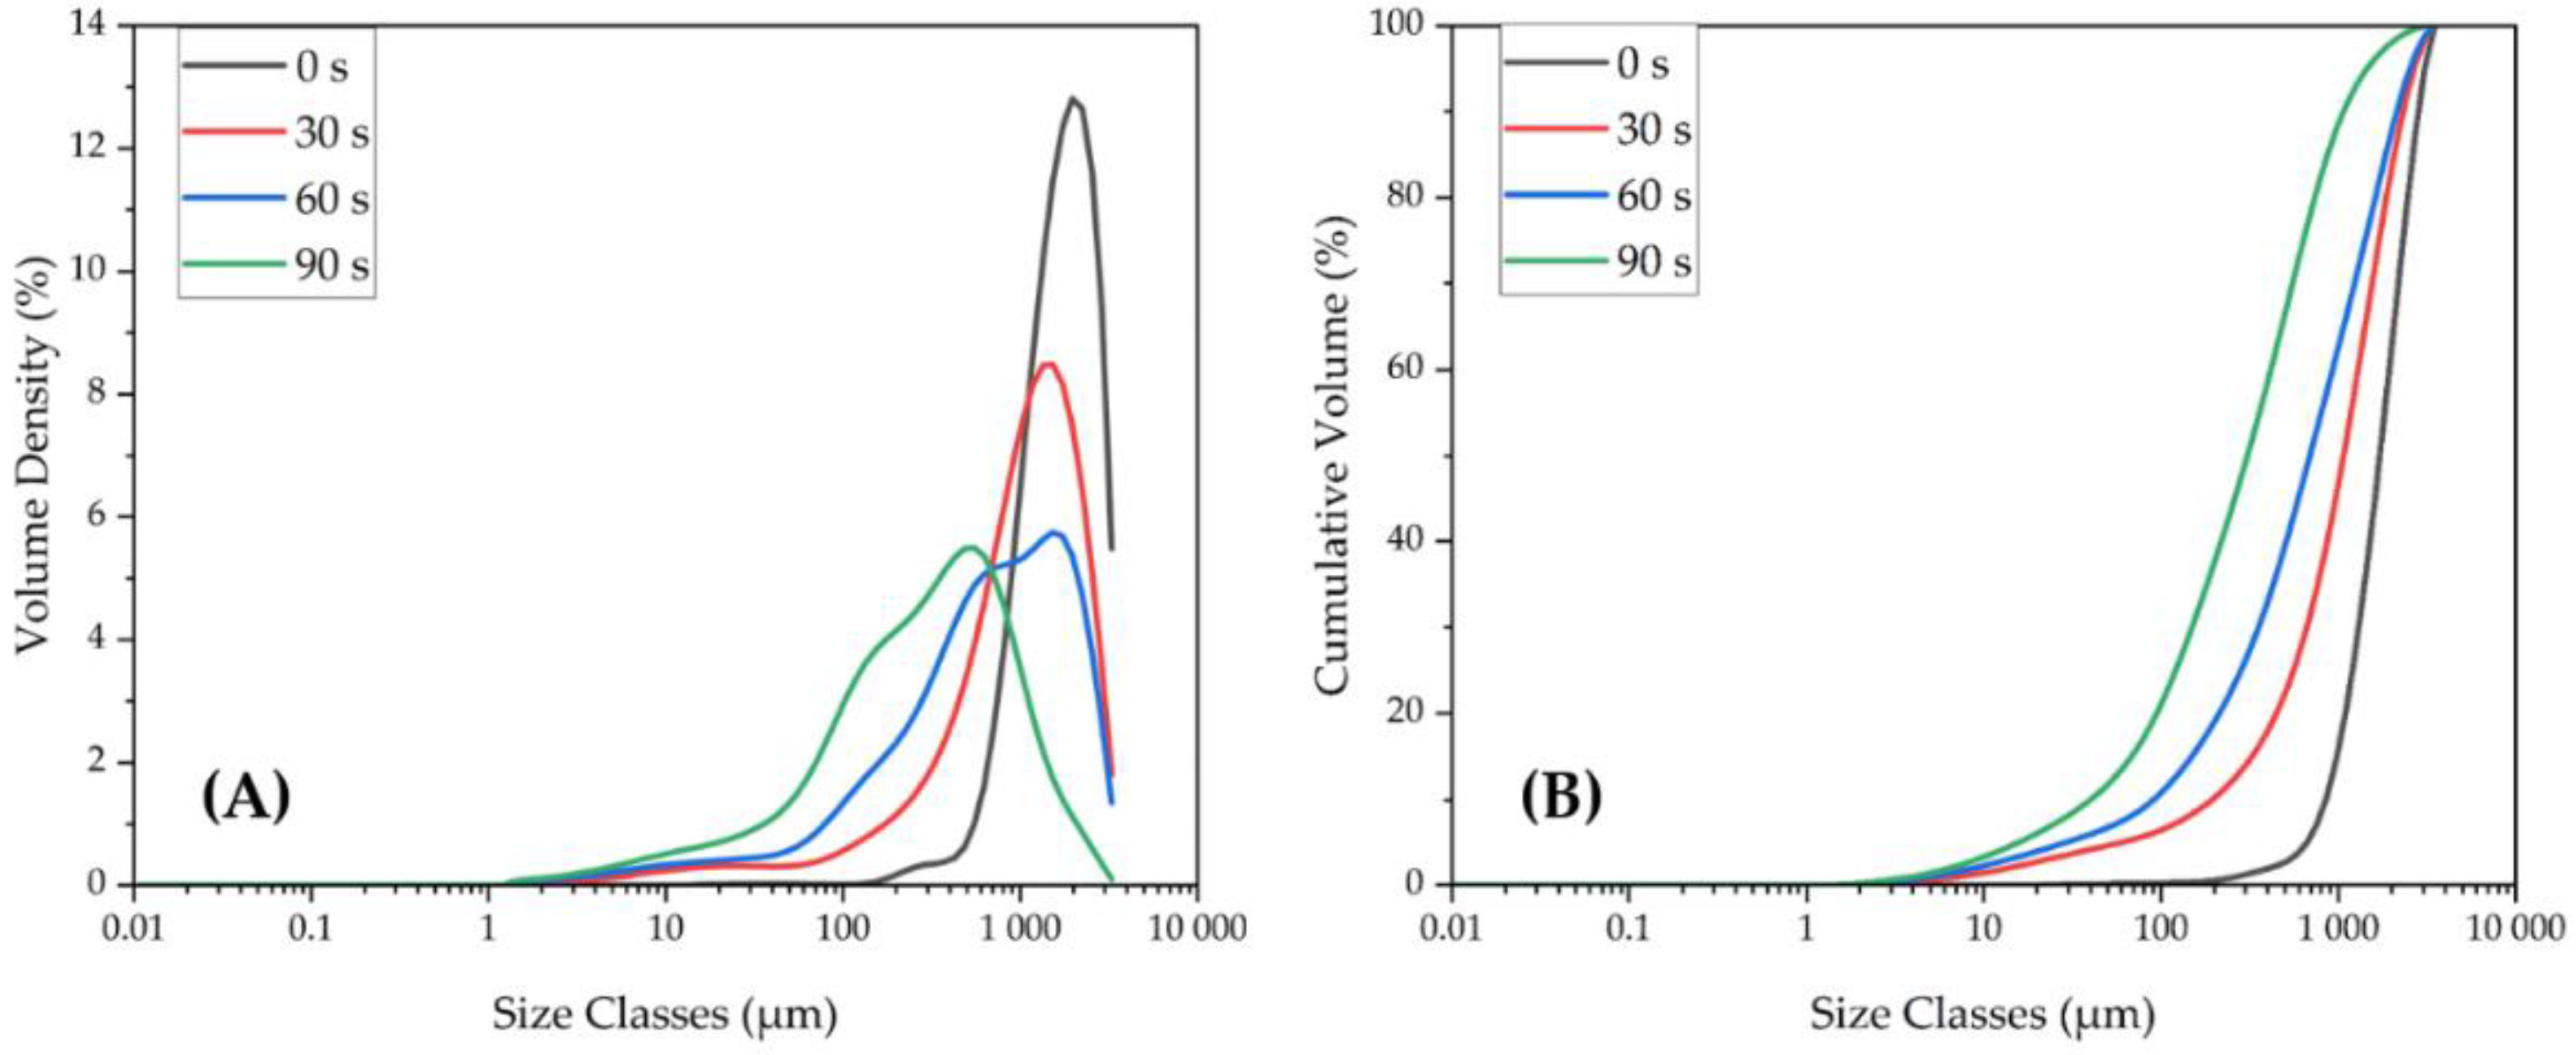
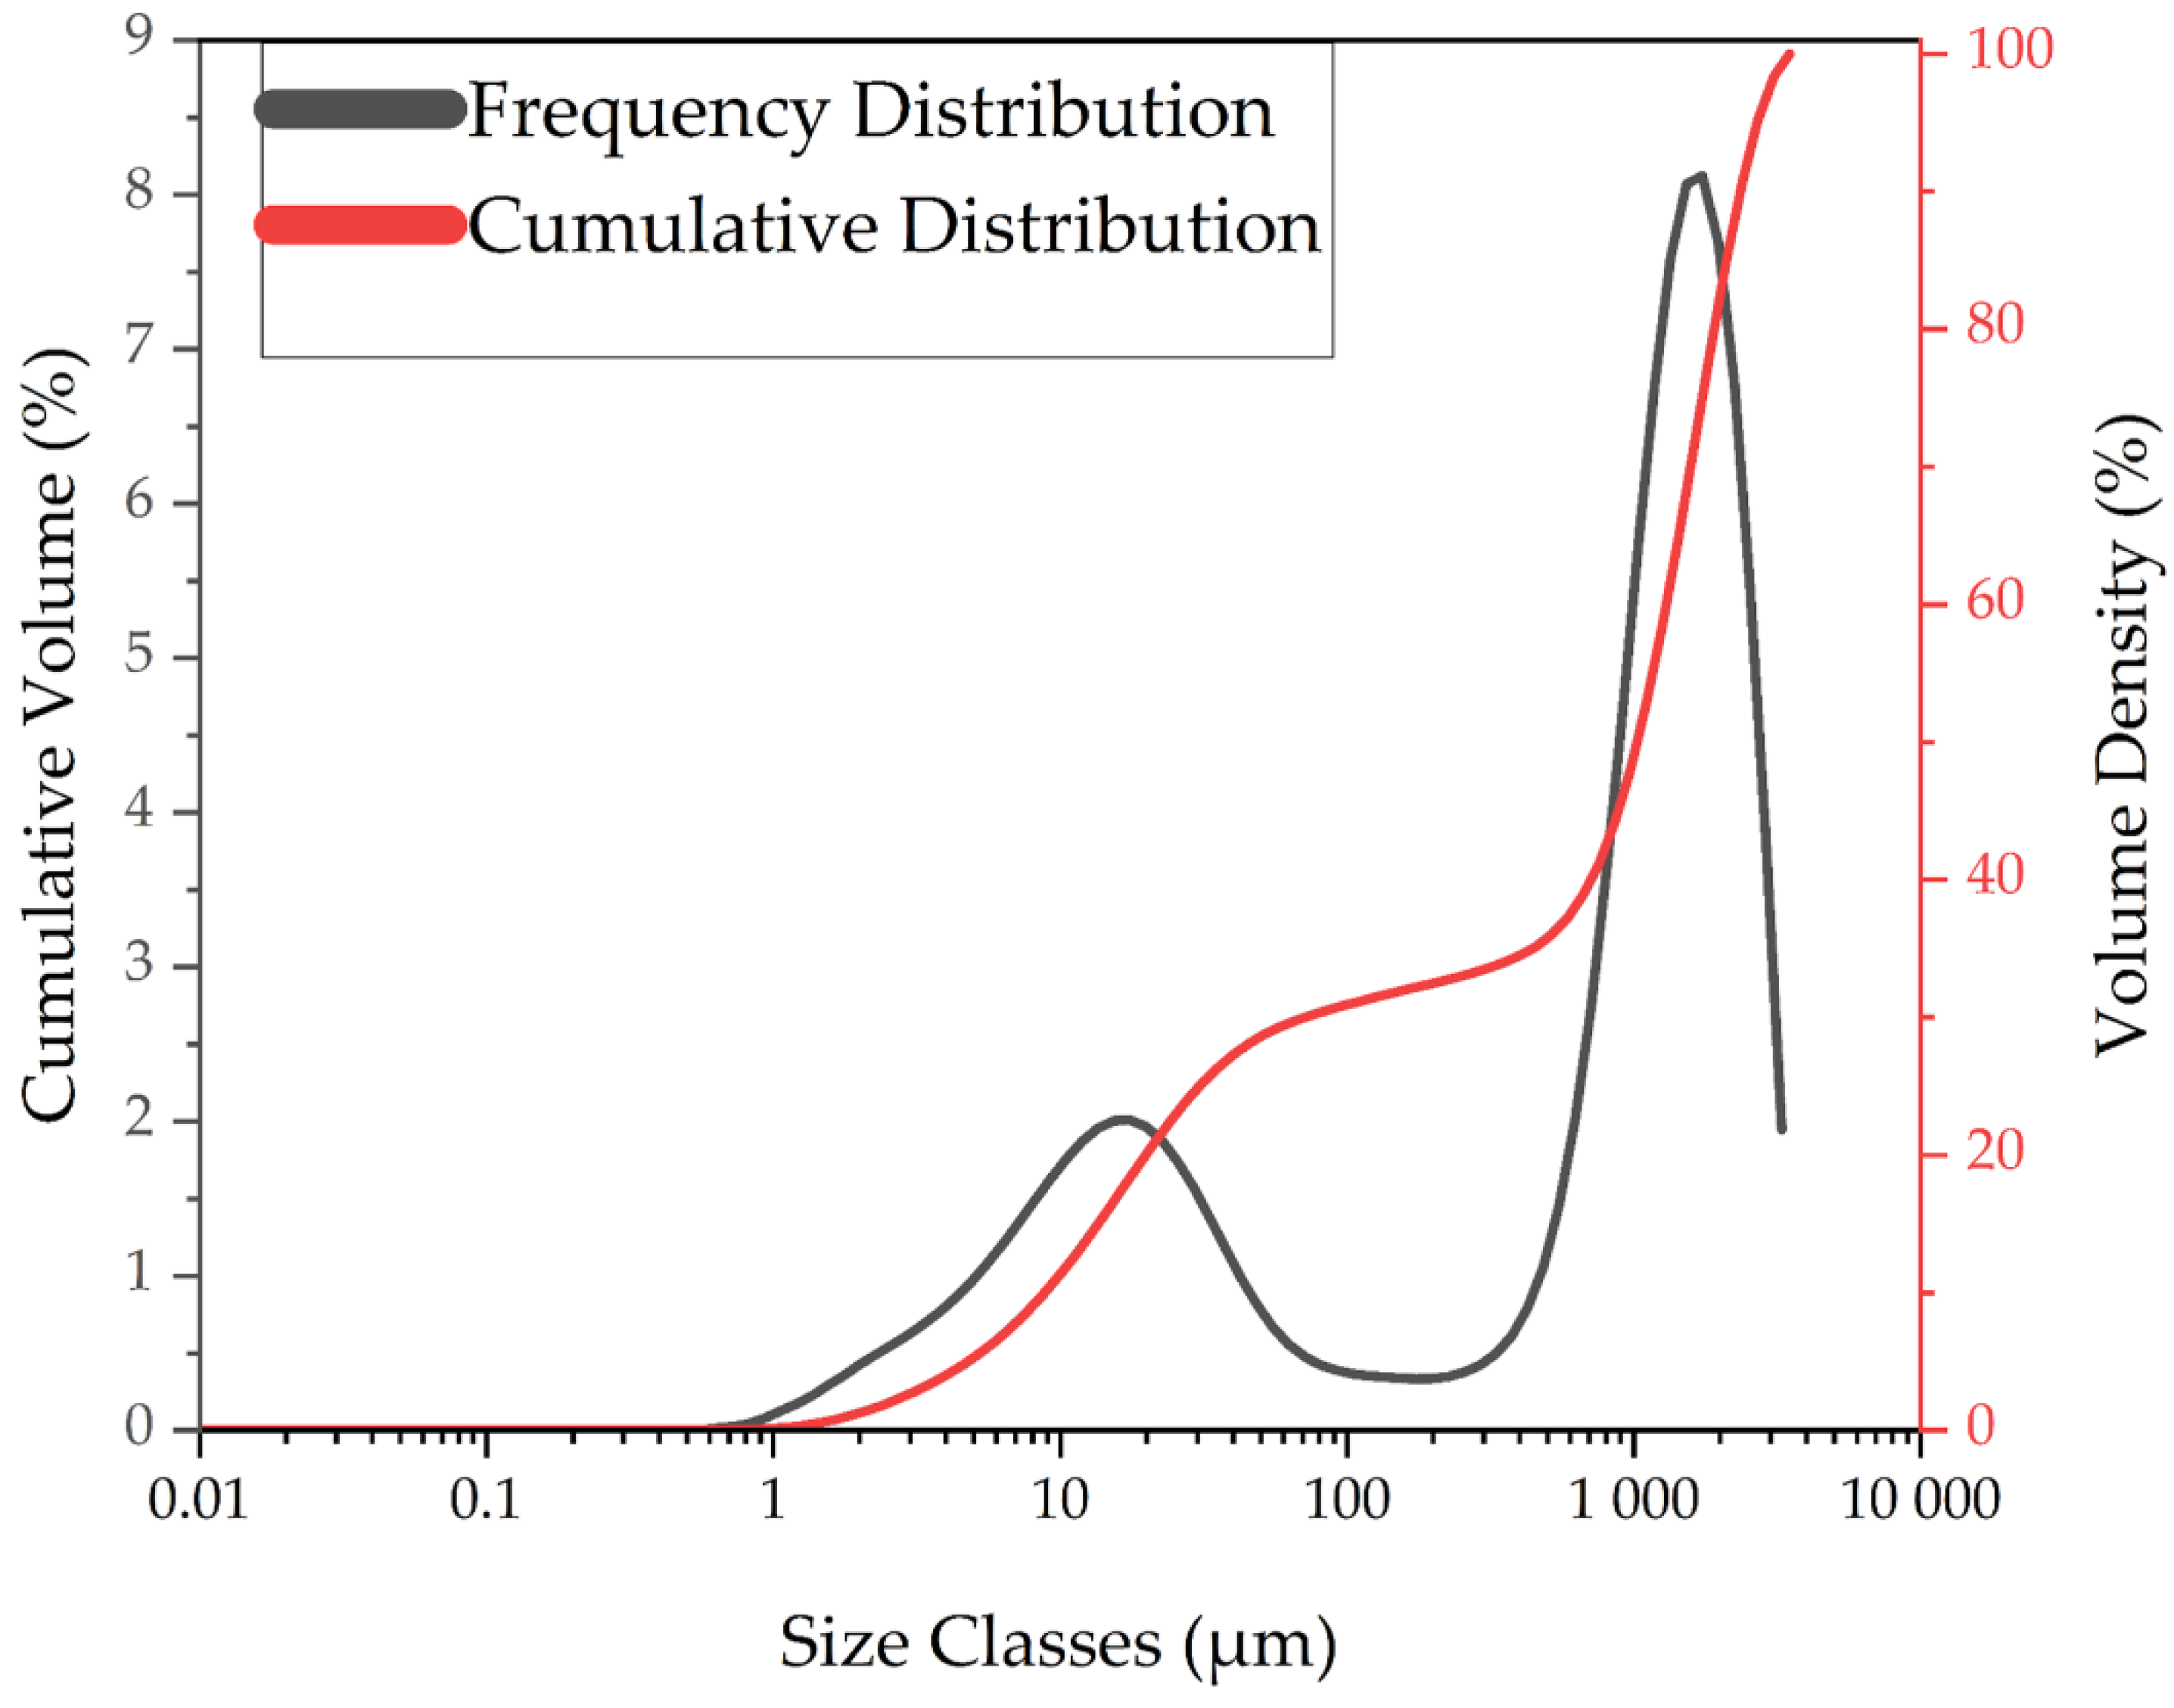
3.1.4. Particle Size Distributions of LIB Waste and Ground Flotation Underflow

The cumulative particle size distribution and frequency distribution of the black mass fraction used as flotation feed (>500 µm) are shown in Figure 6.
As seen in Figure 6, the sieved black mass has a bi-modal frequency distribution, with the finer fraction (ca. 1–100 µm) likely corresponding to the active particles, and the coarser particles corresponding to the Al/Cu wires and separator plastics. As the cumulative distribution shows, the d30-value is ~100 µm, indicating that a considerable amount of fine particles have been carried to this fraction during sieving, adhered on the coarse particle surfaces. These adhered particles can be clearly seen in the EDS-mapping presented later in Section 3.1.5. The presence of ultrafine particles can also be seen from Figure 6, as the d10-value is around 10 µm.
Figure 7A,B shows the frequency distribution and cumulative distribution for the particle sizes of the flotation underflow with various milling times (0, 30, 60, and 90 s).
When comparing the frequency distributions of the flotation feed (Figure 6) and the flotation underflow fraction as-is (Figure 7A, 0 s), the underflow no longer presents a bimodal distribution, indicating the selective extraction of fine (active) particles in the froth fraction during flotation. This is further evidence that both the anode and the cathode have hydrophobic surface properties in the absence of PVDF removal, and can thus be selectively recovered in the froth. Figure 7B shows rapid reduction in the particle size distribution of the underflow during the ring mill treatment. For example, the d50 value drops from ca. 1700 µm (0 s) to below 700 µm over the course of the first minute of milling.
In order to test for the effect of the underflow particle size to the reduction kinetics of the pyrometallurgical process, additional pyrometallurgical experiments were chosen to be performed with a underflow sample that had been milled for 60 s. It was hypothesized that a reduction in the underflow particle size would lead to an increment in the Cu slag cleaning reaction kinetics. Experiments performed with the milled underflow will be referred to as “mixed SBs experiments” hereafter in the article.

3.1.5. Chemical Composition of Flotation Underflow

The chemical composition of the combined flotation underflow is presented in Table 5.
Table 5 indicates that, in flotation, graphite is recovered significantly more effectively than Co, Ni, and Mn. The average concentration of graphite decreases from 19.85 wt.% in the feed (Table 4) to 0.58 wt.% in the underflow, which indicates a recovery rate of 98.8%. Graphite recovery can be expected to be higher compared to the cathode active components for two reasons. Firstly, graphite is a naturally hydrophobic mineral and is therefore recoverable in the froth even if the PVDF coating is partially decomposed. The Li-salts in the cathode, however, are considered to have a hydrophilic character and will therefore remain in the aqueous suspension if the hydrophobizing PVDF film is damaged. Thus, the presence of Li-salts in the underflow indicates that the mechanical processes applied for the preliminary separation of the battery components might partially decompose the PVDF surfaces. However, it is still evident that a lot of hydrophobic cathode materials still remain in the feed, as indicated by the high recoveries of Co, Ni (Figure 5), and Mn (Figure A1) in the froth phase. Secondly, the liberation of the cathode particles (from the Al foil) has been shown to be significantly less efficient compared to the liberation of graphite (from the Cu foil) [35]. Because of this, the attritioning treatment performed prior to flotation might result in non-liberated Li-salt–foil aggregates in the feed, even if the graphite liberation was close to 100%. These non-liberated cathode particles would not be recoverable in the froth phase, even if their surfaces would remain hydrophobic. As shown in Figure 7A (0 s grinding), <100 µm particles are recovered from the LIB waste very efficiently. This suggests that the majority of the non-recovered cathode active particles are still aggregated with the metal foil and show up as coarse (>100 µm) particles in the particle size distribution.
Figure 8 shows the elemental mapping of two microstructures of froth flotation underflow performed with Scanning Electron Microscopy (SEM) with energy dispersive X-ray spectrometry (EDS). The original SEM images are shown in Figure 8A,G. The mapping confirmed that Al and Cu are present in metallic form as small wires. Co, Ni, and Mn are concentrated together in the grains, similarly as in the froth flotation overflow, which was described in our previous article [21]. It was observed that grains of cathode material are tightly attached to the Al wires, which proves that liberation of Al wires from Co-, Mn-, Ni-containing grains is difficult to achieve. This finding is in line with other research published recently [35].

3.2. Pyrometallurgical Treatment

3.2.1. Chemical Composition of the Feed Mixture

Table 6 shows chemical composition of the feed mixture with 0, 10, and 20 wt.% of SBs. Concentration of elements were calculated based on the chemical composition of Cu-slag, presented in Section 2.2. (Table 2), and the chemical composition of battery scrap. All three mixtures were prepared by weighing Cu-slag into the crucible and adding not-ground SBs on top of the slag. Additionally, in case of the mixture with 10 wt.% of SBs, battery scrap with reduced particle size (60 s ring milling) was mixed together in the mortar and then placed in the crucible. This experimental setup is depicted as process route B in Figure 1.

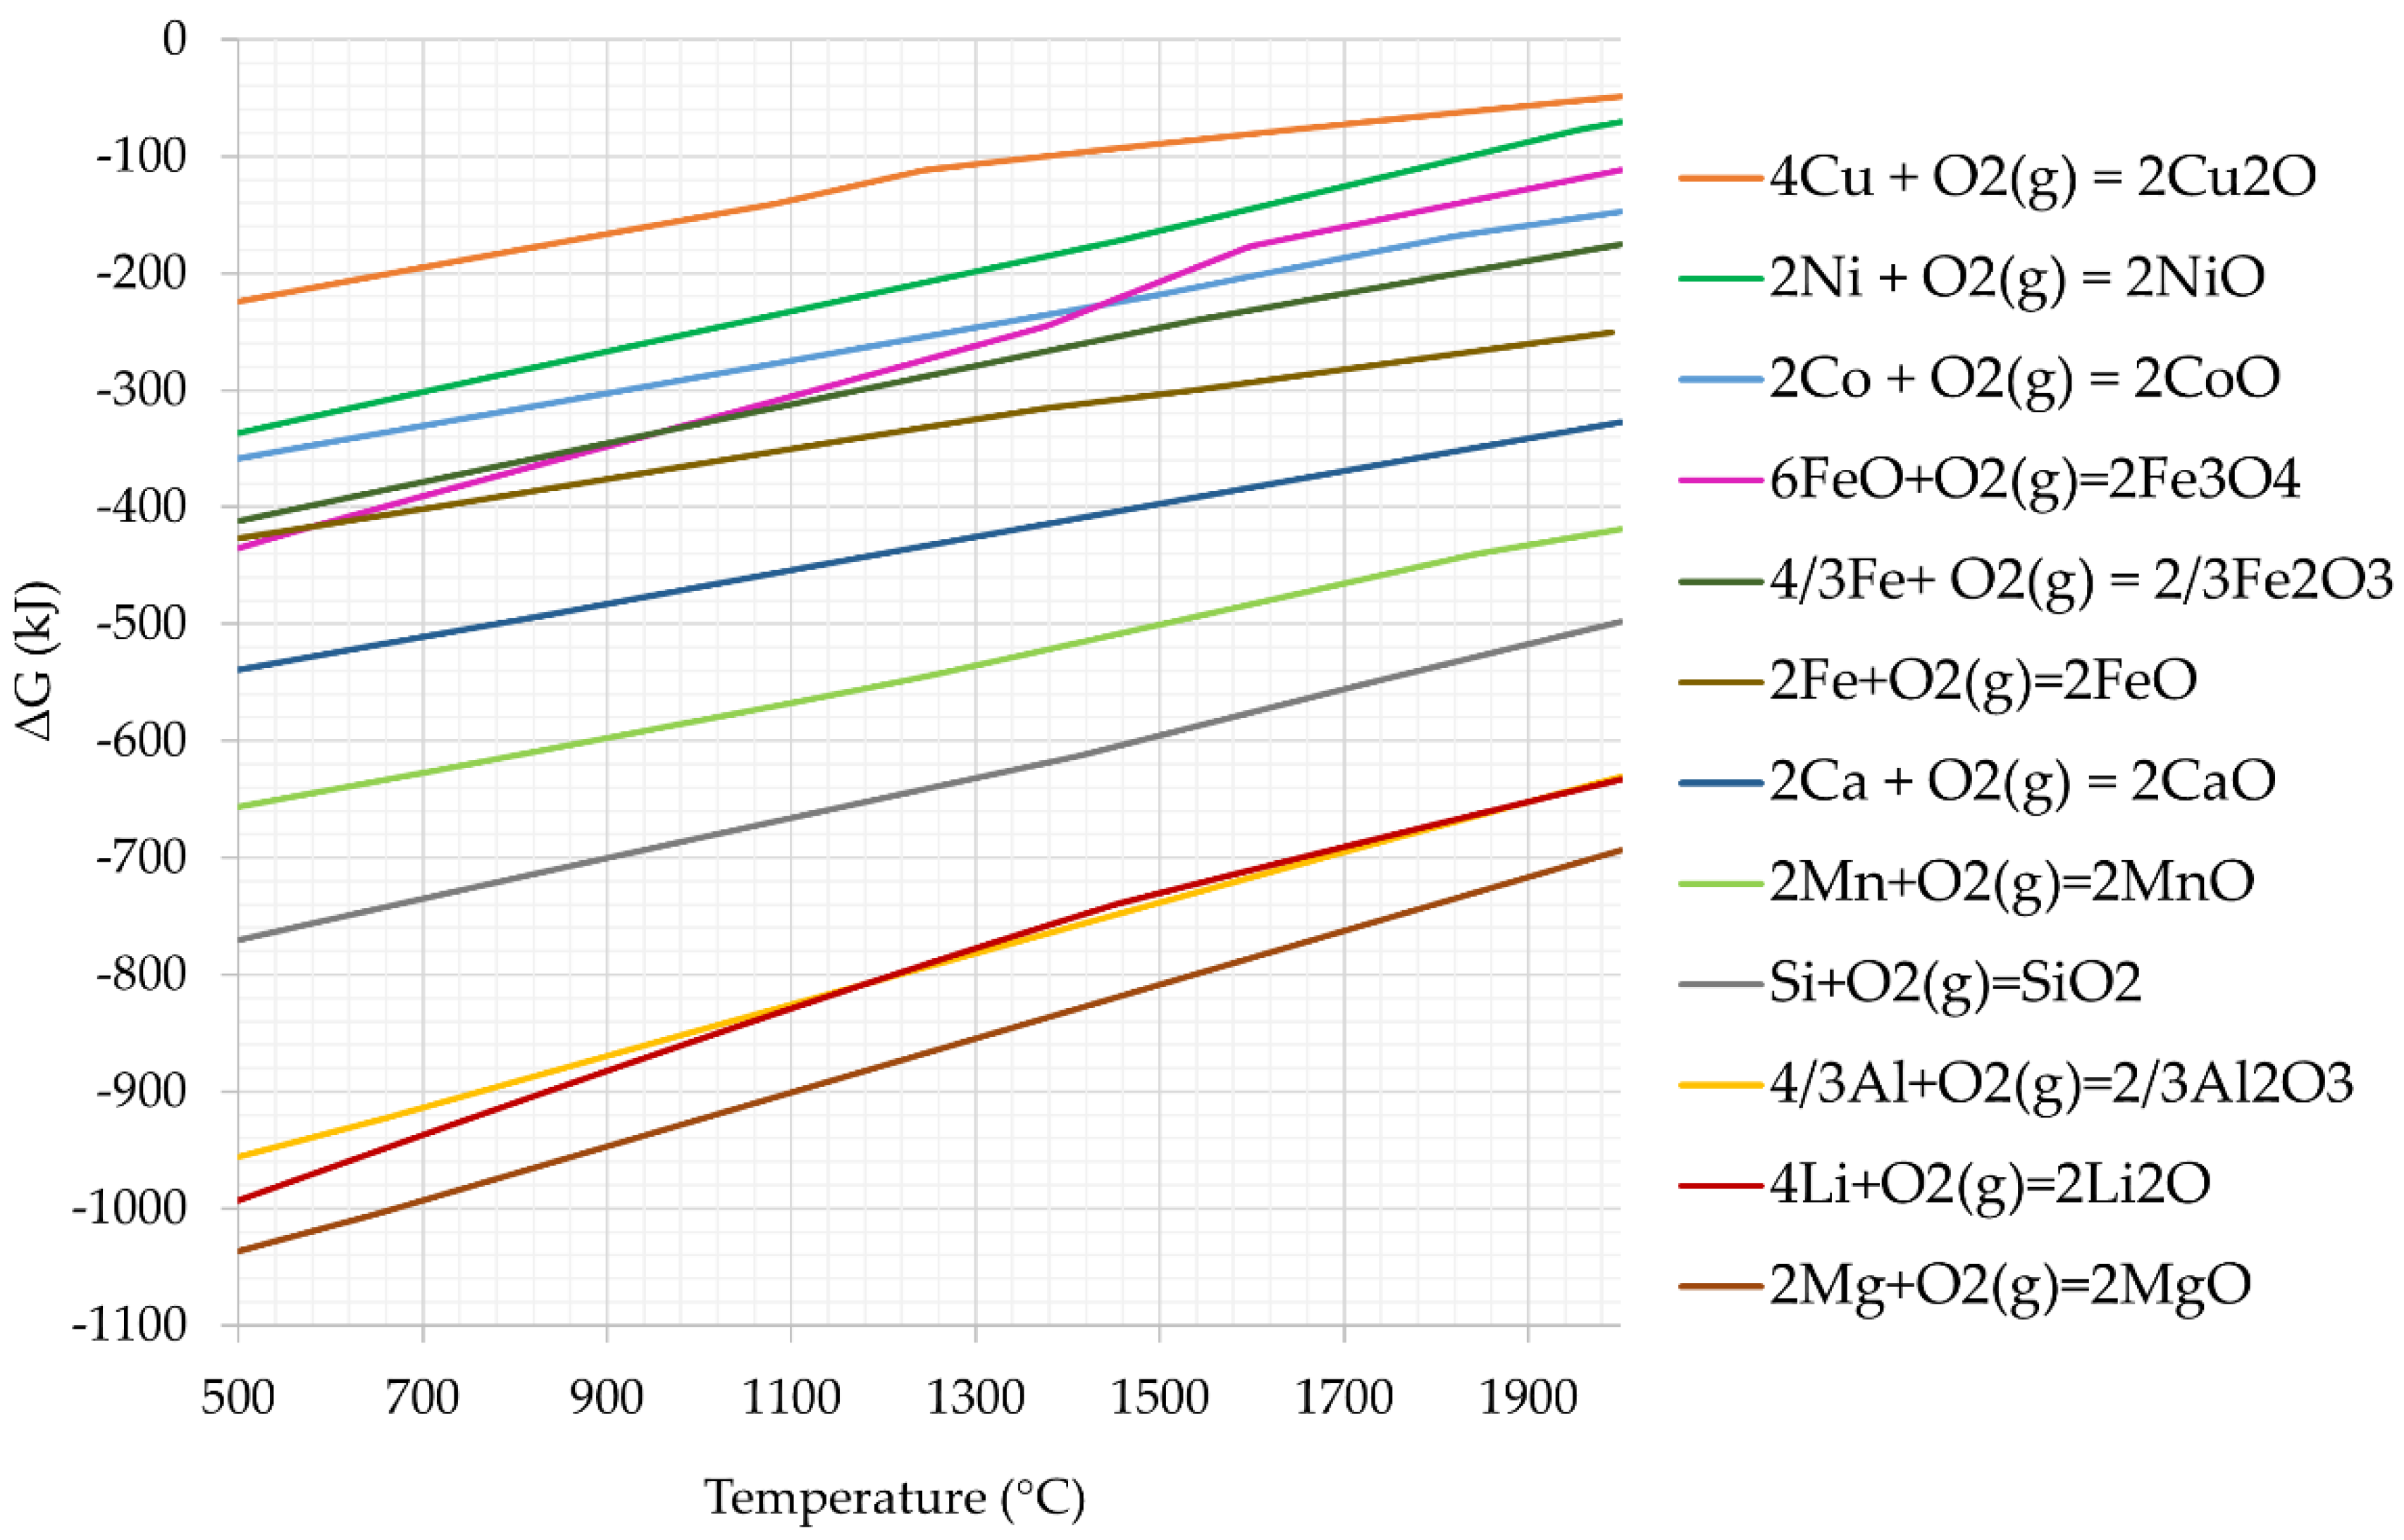
3.2.2. Chemical Reactions

Most of the metals presented in Table 6 are present in oxidic form. The goal of the pyrometallurgical treatment in this study was the prereduction of Cu-slag and metal oxides from SBs. Metal oxide reduction is the main process in metallurgy, and it can be expressed by the general reaction [36], as shown in reaction Equation (4):
( 1 y ) Me x O y ( s   or   l   or   dissolved   in   slag ) + R ( reductant ) ( x y ) Me ( g ,   l ,   s   or   dissolved   in   metal   M ) + RO   ( s   or   l   or   dissolved   in   slag )
Coke and other carbon-based reagents are the most conventionally used reductants in pyrometallurgy. However, as carbon neutrality is one of the main targets for the metallurgical industry, carbon-free reduction processes are needed. Several studies have been carried out in order to replace coke with alternative reductants in various metallurgical processes.
In this study, metallothermic reduction was applied. In this process, one metal acts as the reductant for other metal oxides. When integrating industrial copper slag cleaning with spent lithium-ion battery recycling, many different metals and their compounds are introduced to the system. The tendency of metals to act as reductants/oxidants can be expressed by their affinity towards oxygen, which can be indicated by the heat of formation of oxides (ΔH). The standard affinity of reaction is a function of the standard free energy of oxides formation [36], expressed as shown in Equation (5):
A 0 = RTlnK 0 ( T ) = Δ G 0 ( T )
The results can be presented in an Ellingham diagram. Figure 9 shows the Ellingham diagram for the investigated system. The lines presented on the diagram present the free energy of oxide if the metal that is considered as reducing agent. Elements whose lines are located in lower part of the diagram, e.g., aluminum, silicon, magnesium, are the most powerful reductants as their oxides very stable. In contrast, the oxides whose lines are in the upper part will be easily reduced by different reducing agents.
As shown in Table 4, the main metal present in metallic form in the starting mixture is aluminum, which has a very high affinity for oxygen, according to the Ellingham diagram. The aluminothermic reduction reaction is a well-known exothermic reaction and it is expected to take place under the experimental conditions used in this study. It can be described by Equation (6):
MeO x + Al = Me + Al 2 O 3 + heat
It was described by Heo et al. that the main phase in the copper slag is fayalite (2FeO·SiO2) from which iron can be recovered through the aluminothermic reaction [26]. In the industrial copper slag utilized in our study, a large portion of the iron is in the form of magnetite (Fe3O4), which, according to the Ellingham diagram (Figure 9) is the easiest to reduce of all iron oxides present in the system. Iron oxides can be reduced by metallic aluminum according to following reaction Equations (7)–(9) [27].
3 4 Fe 3 O 4 + 2 Al 9 4 Fe + Al 2 O 3
3 FeO + 2 Al 3 Fe + Al 2 O 3
Fe 2 O 3 + 2 Al 2 Fe + Al 2 O 3
In addition to the aluminum, the small amount of remaining graphite from spent batteries will also potentially work as a reductant similarly to our previous studies connected to Ni-slag cleaning process [21,22].

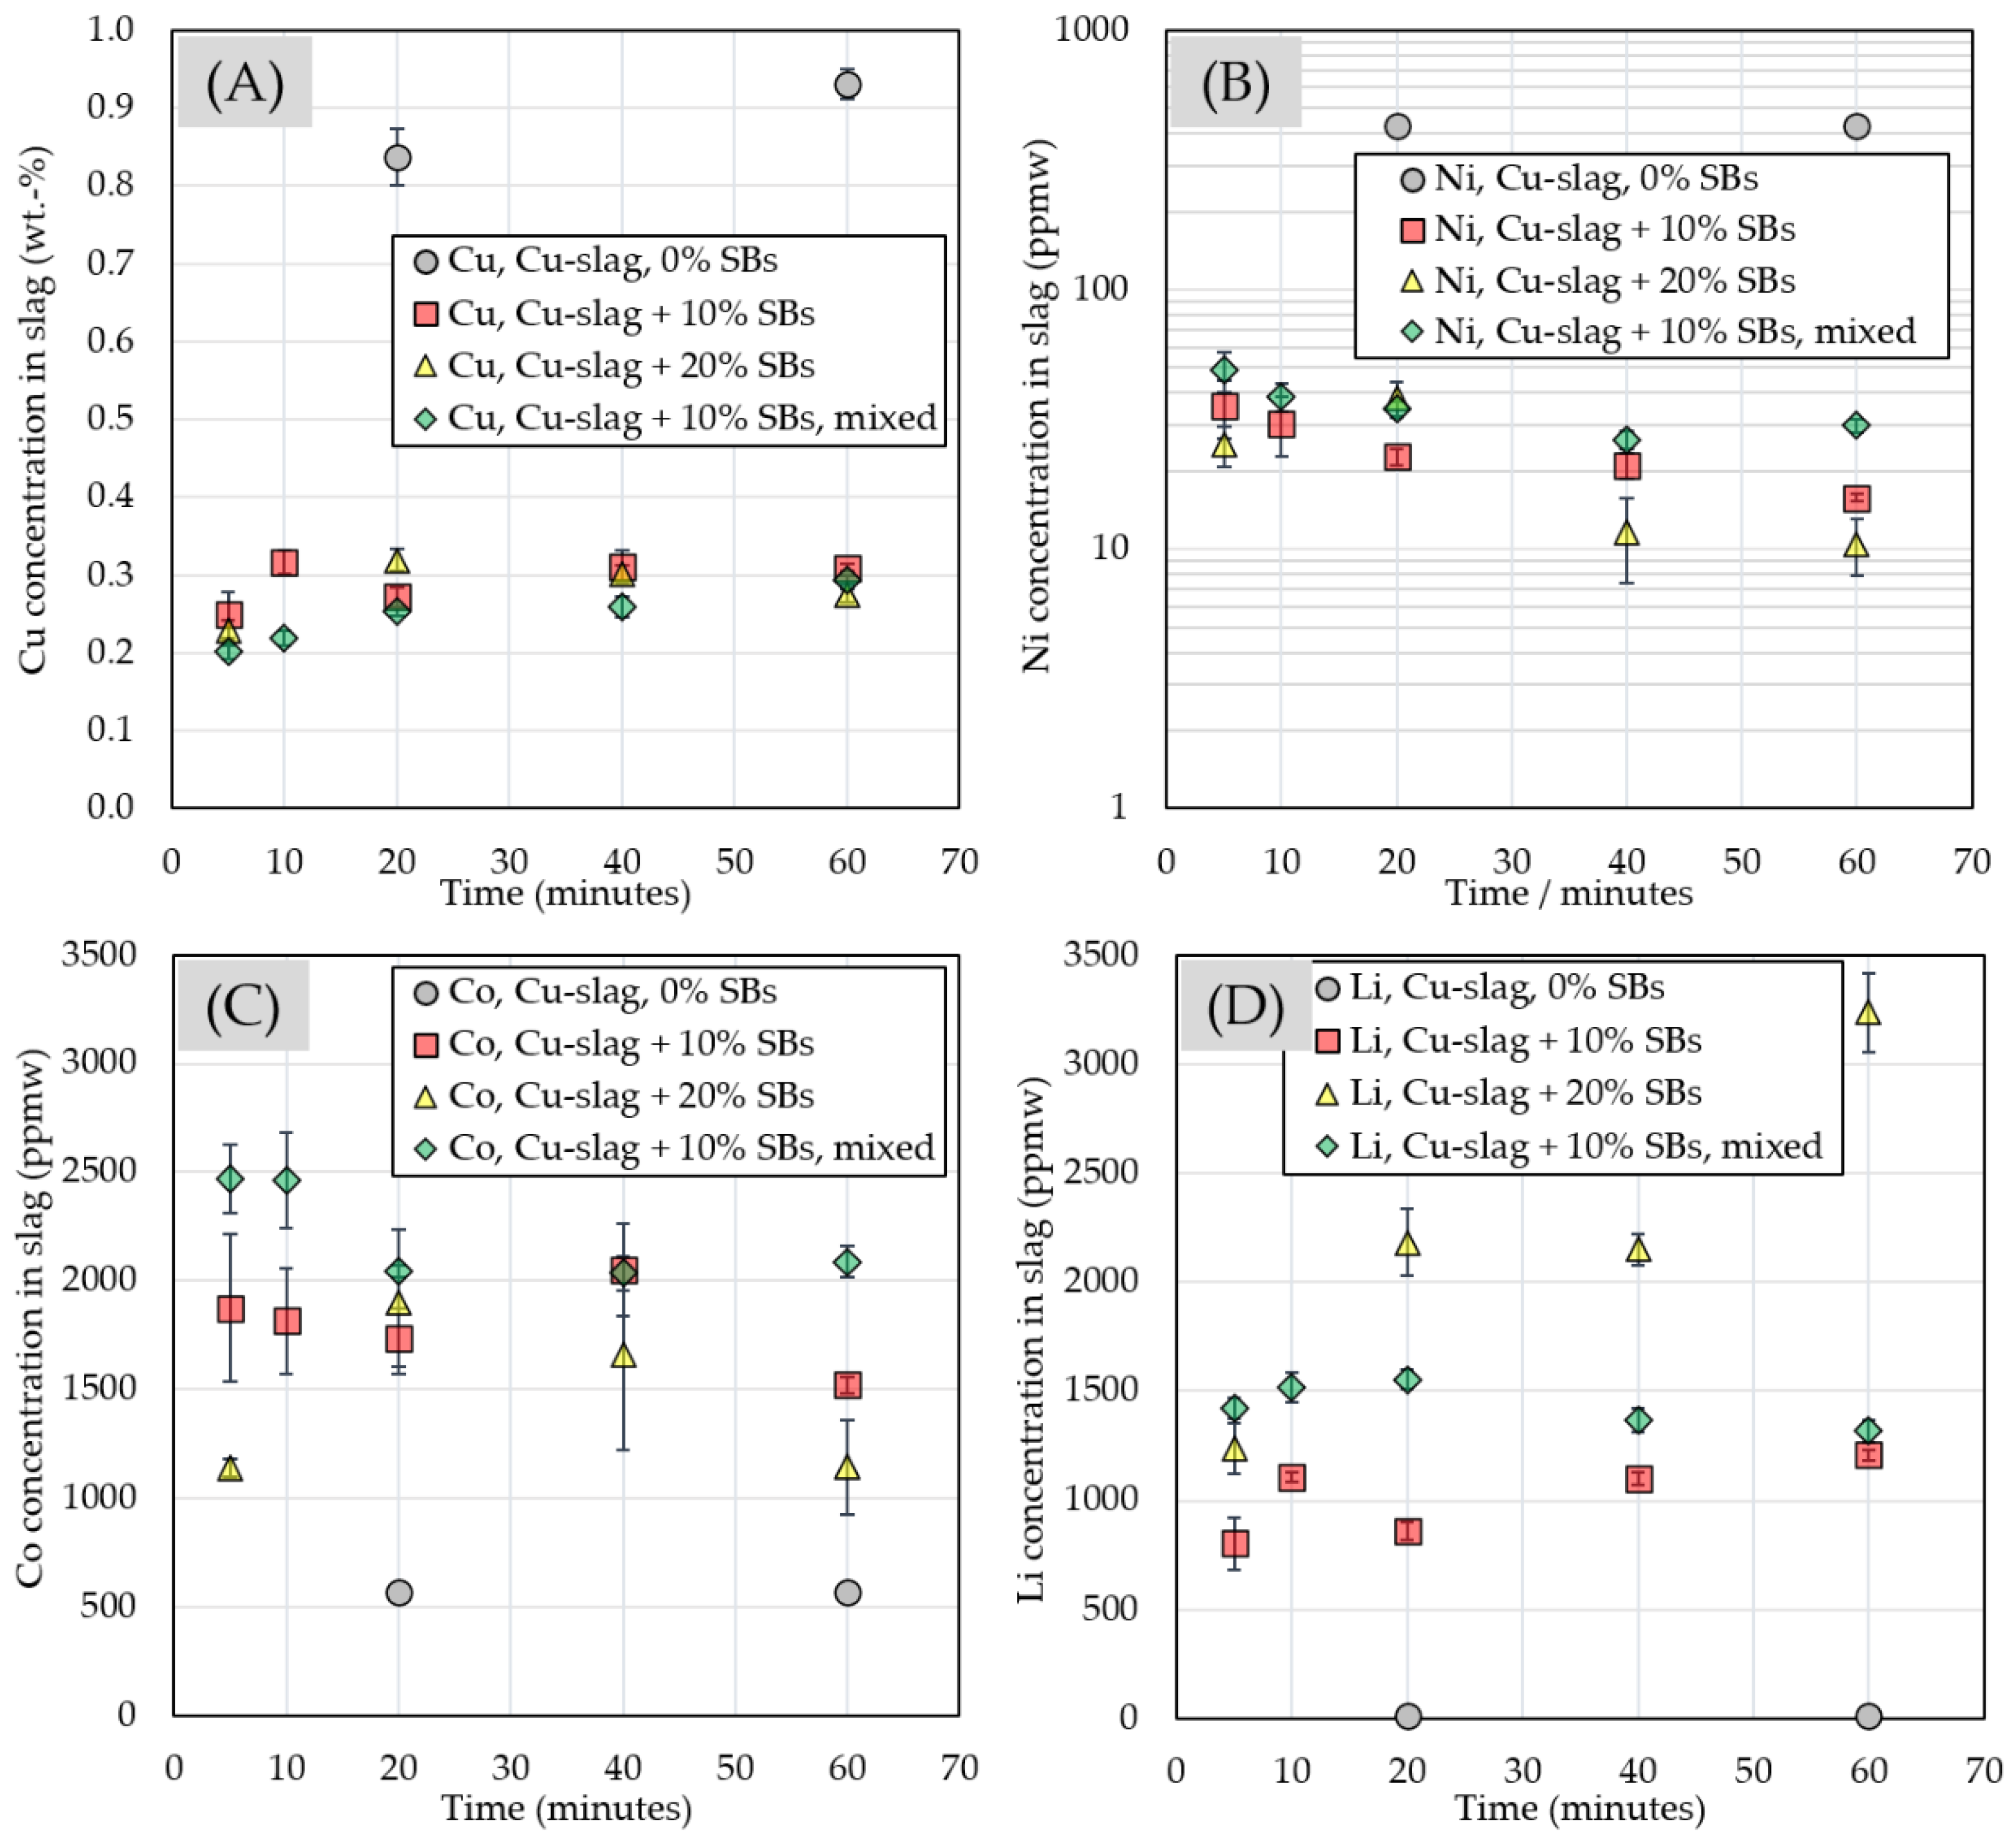
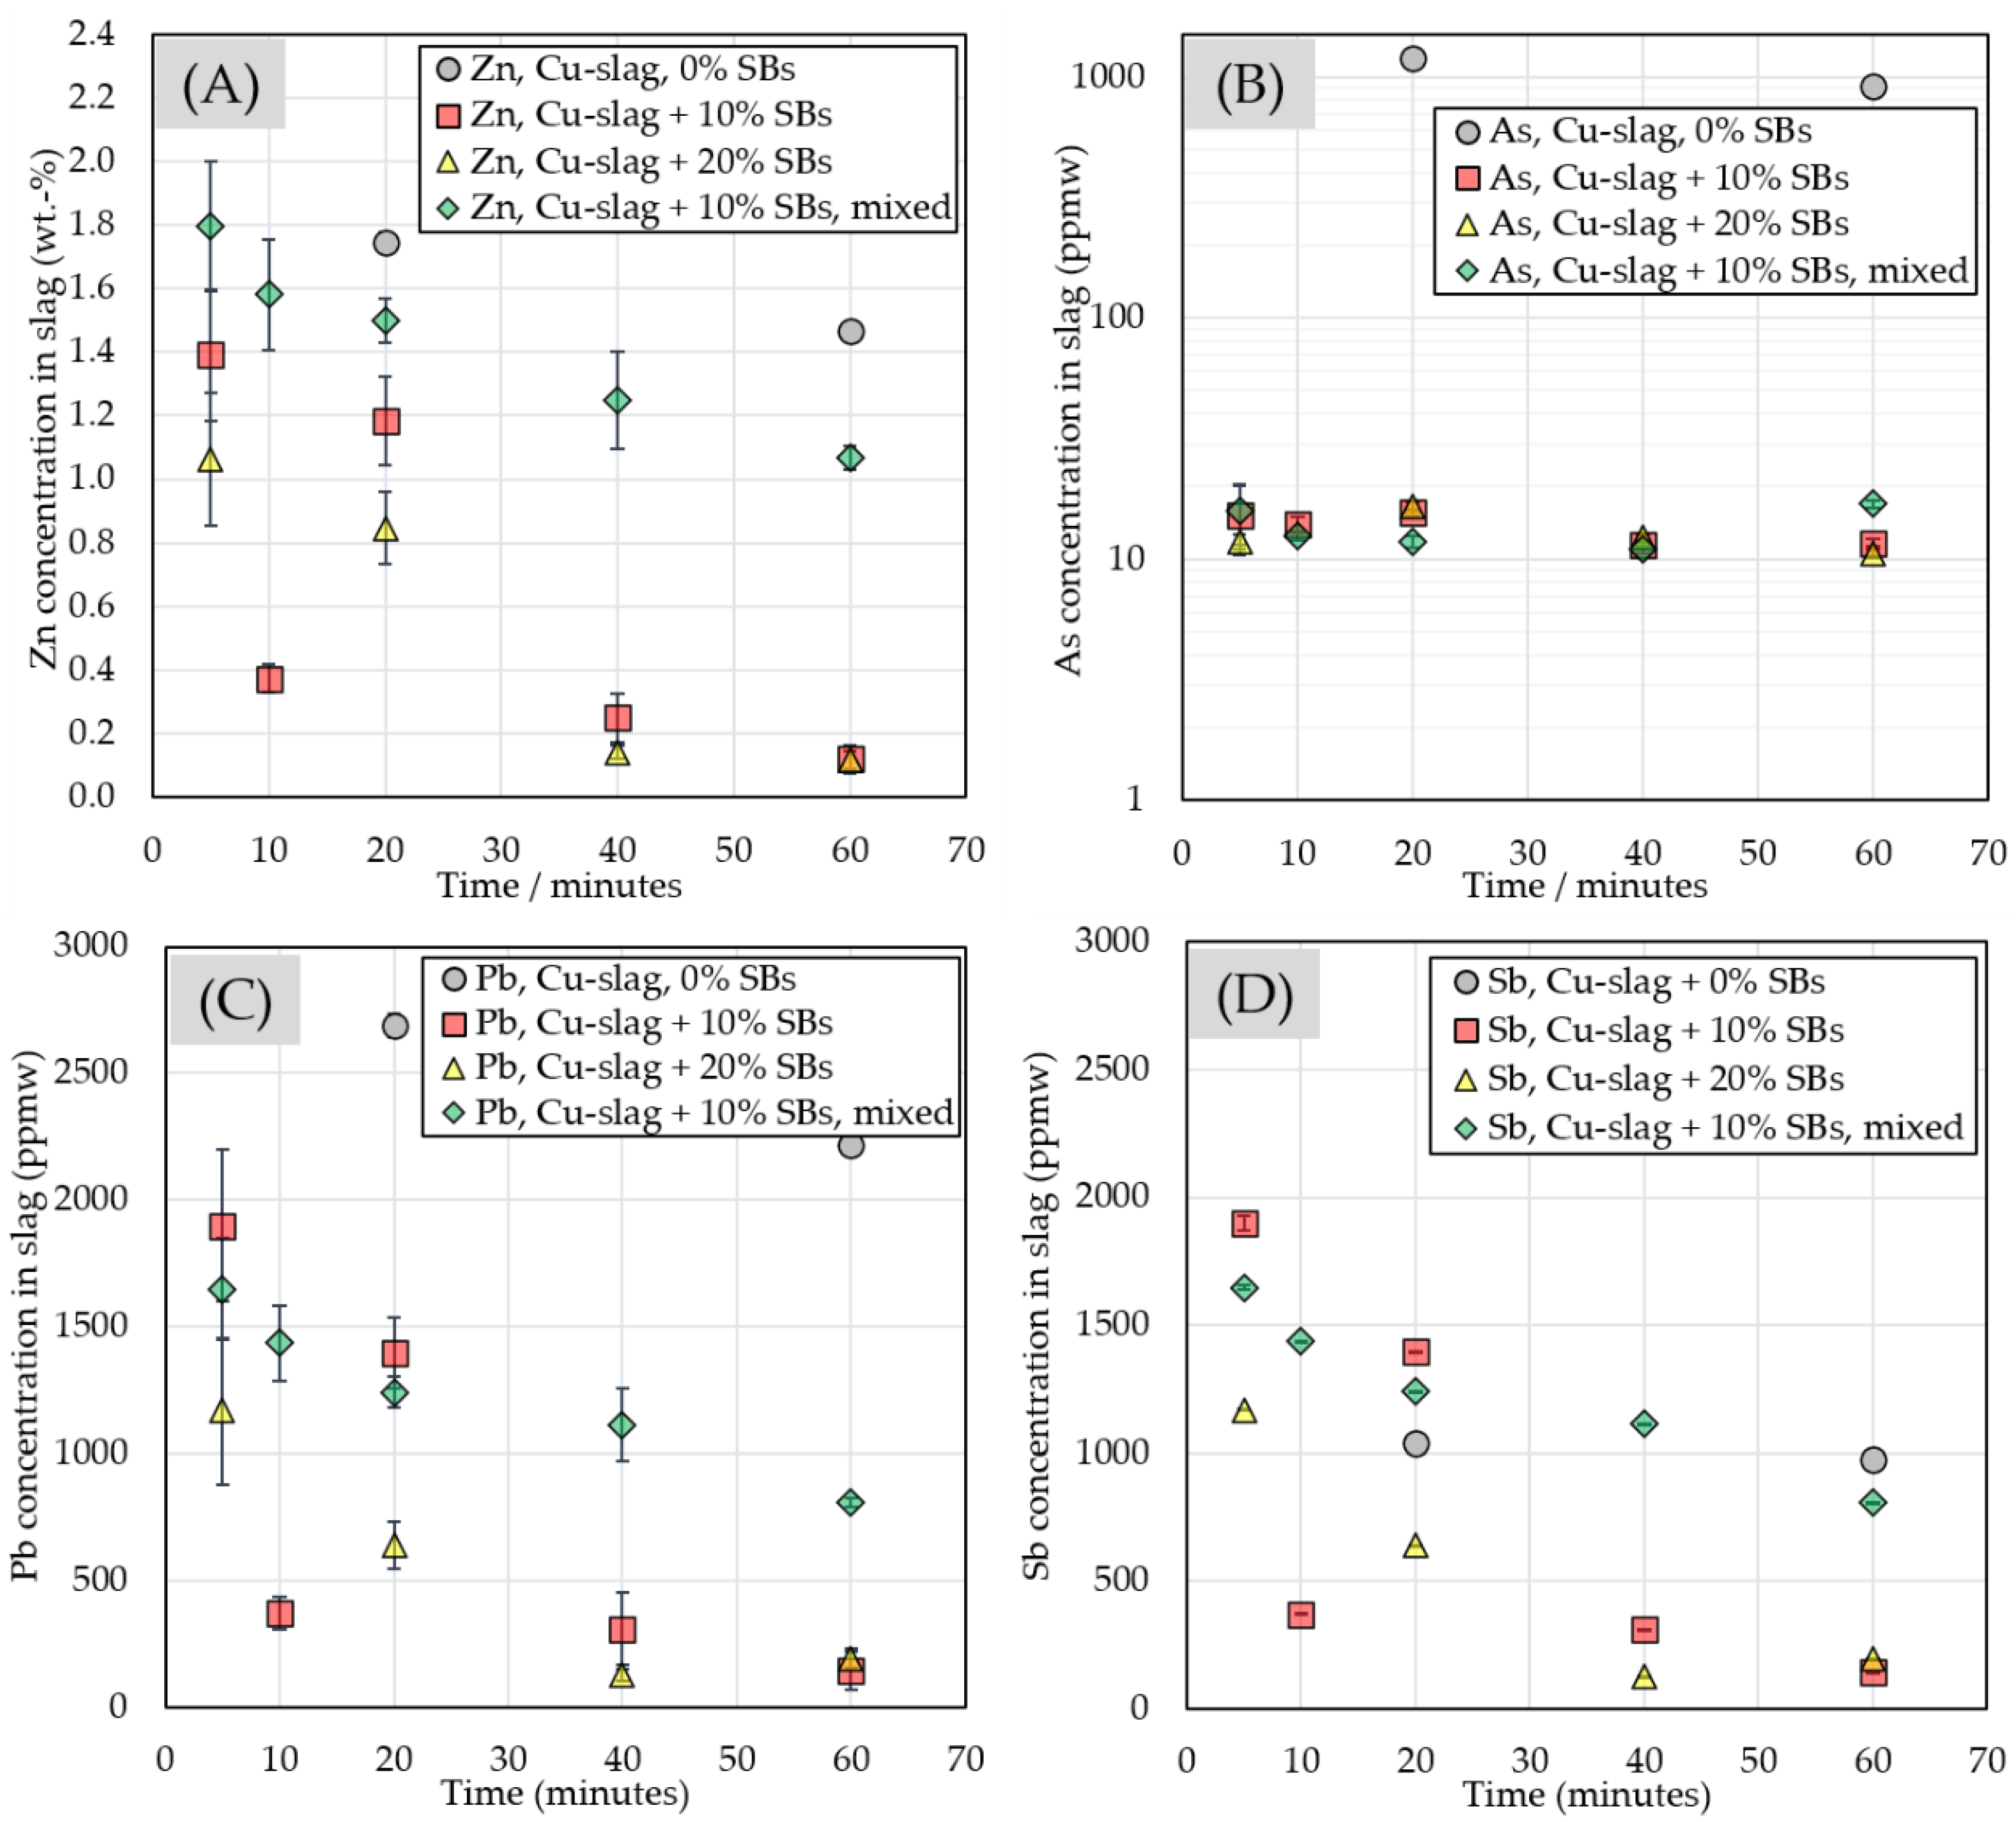
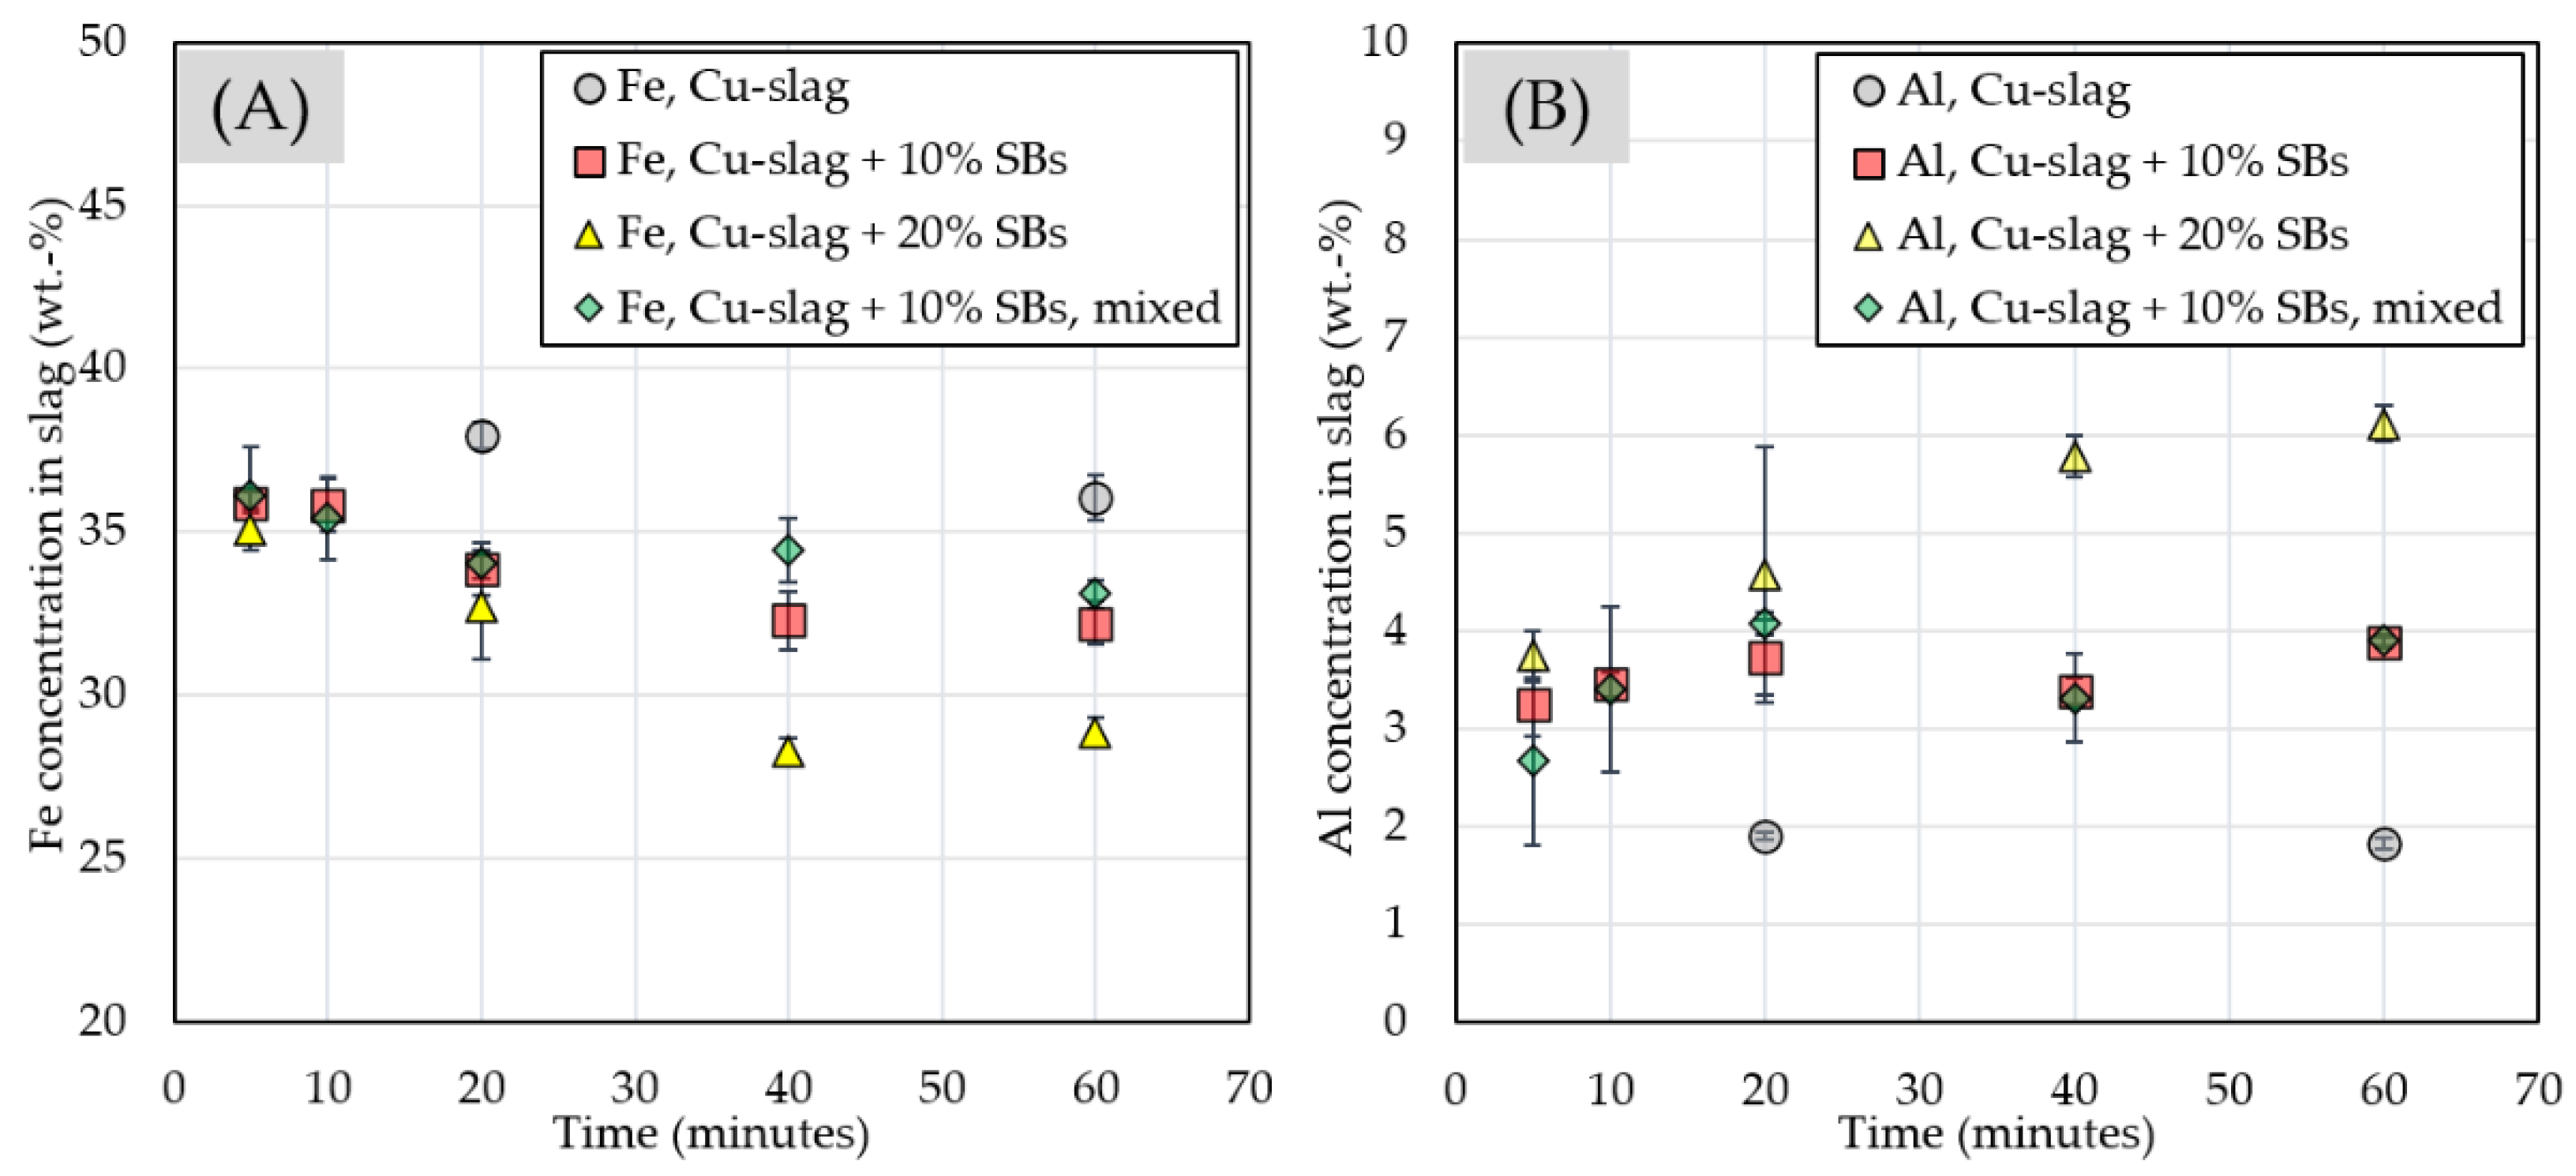
3.2.3. Chemical Composition of Slag

Figure 10 presents Fe and Al concentrations in the slag. With increasing SBs addition, the final Fe concentration in the slag decreased. In the samples, where SBs were mixed with the slag, the iron concentration decreased slightly less than in the non-mixed. With no SBs addition, the Fe concentration was 36 wt.% after 60 min contact time. In the system with 20 wt.% of SBs, its concentration decreased to 29 wt.%. With an increasing amount of reducing agents, the more iron was reduced to the metal or matte phase. However, not all of the decrease can be attributed to the metallothermic reduction. The concentration of Fe is also diluted as the concentrations of Si and Al increase over time.
Al concentration increased with the increasing amount of SBs added to the mixture. This indicates that Al was oxidized and aluminothermic reaction was achieved. No major difference was observed between non-mixed and mixed samples. After 60 min, the Al concentration in slag was approximately 6 wt.% with 20% SB addition. With 10% addition, the concentration was 4 wt.%. With no addition, the concentration was around 2 wt.%, slightly lower than the concentration in the starting mixture, due to the increased concentration of Si in the slag because of crucible dissolution.
Si concentration in the slag increased with increasing time as the silica crucible dissolved in the slag. This phenomenon was observed in the author’s previous studies [21,22] and other studies [37] where silica crucible was also used in the high-temperature experiments. After 5 min contact time, SiO2 concentration in the slag was around 37 wt.% regardless of the sample starting composition, and after 60 min its concentration increased to 40.5 wt.% in the sample without SBs addition, and to 43 or 48 wt.% in the samples with 10 or 20 wt.% of SBs, respectively.
Additionally, the slag contained Mg and Ca, the concentrations of which remained relatively stable over time. The different addition of SBs in the mixture also did not seem to have a significant influence on Mg and Ca concentrations, which were around 1.1 and 0.8 wt.%, respectively. The concertation of Si, Mg, and Ca in slag in all samples are presented in Table A2 in Appendix B.
Figure 11 shows the concentration of trace elements Cu, Ni, Co, and Li in the slag as a function of contact time.
Concentration of Cu in the industrial slag, presented in Table 2, was 1.2 wt.%. As Figure 11 shows, after experiments in argon atmosphere at 1300 °C, Cu-concentration in the slag without SBs addition reached 0.8 wt.% after 20-min contact time and 0.9 wt.% after 60-min contact time. In the starting mixtures with 10 and 20 wt.% of SBs, Cu concentration was much higher in comparison to the slag without SBs: 2.8 and 5.4 wt.%, respectively. The concentration of Cu in the slag remained relatively stable, between 0.2–0.3 wt.%, in all samples regardless of the reduction time or the amount of SBs added to the mixture. This indicates that copper was rapidly and effectively reduced to the matte and alloy phases, which is in line with the Ellingham diagram in Figure 9.
The concentration of Ni in the slag (Figure 11B) decreased over the time and with increasing amounts of SBs in the starting mixture. In the samples with 10 wt.% of SBs, slightly higher concentration of nickel was obtained in the system with SBs mixed together with the slag. Similarly, Co concentration in the slag (Figure 11C) decreased over the time and with increasing amount of SBs in the starting mixture.
Lithium concentration in the slag (Figure 11D) increased over time in the system with 20 wt.% SBs added on top of the slag. In the samples with 10 wt.% SBs mixed together with the slag or added on top of the slag, Li concentration remained relatively stable with the increasing contact time.
Figure 12 shows the chemical concentrations of Zn, As, Pb, Sb in the slag. The concentration of Zn (Figure 12A), Pb (Figure 12C), and Sb (Figure 12D) decreased as the contact time increased and as the amount of added SBs increased. Arsenic concentration in the slag (Figure 12B) seemed to be relatively stable over the time, between 10 and 17 ppmw, which is much lower than the concentration of As in the slag without SBs additions. The reason for decreasing concentrations of Zn, Pb, and Sb is their distribution to the metal alloy/matte phase and partially also the volatilization in the gas phase. The obtained results are in line with the findings of Heo et al., where the aluminothermic smelting reduction was found to be suitable for removing hazardous metals (As, Bi, Pb, and Sb) from the copper-slag [26]. The concentration of all trace elements in the slag are additionally presented in numerical form in Table A1 in Appendix B.

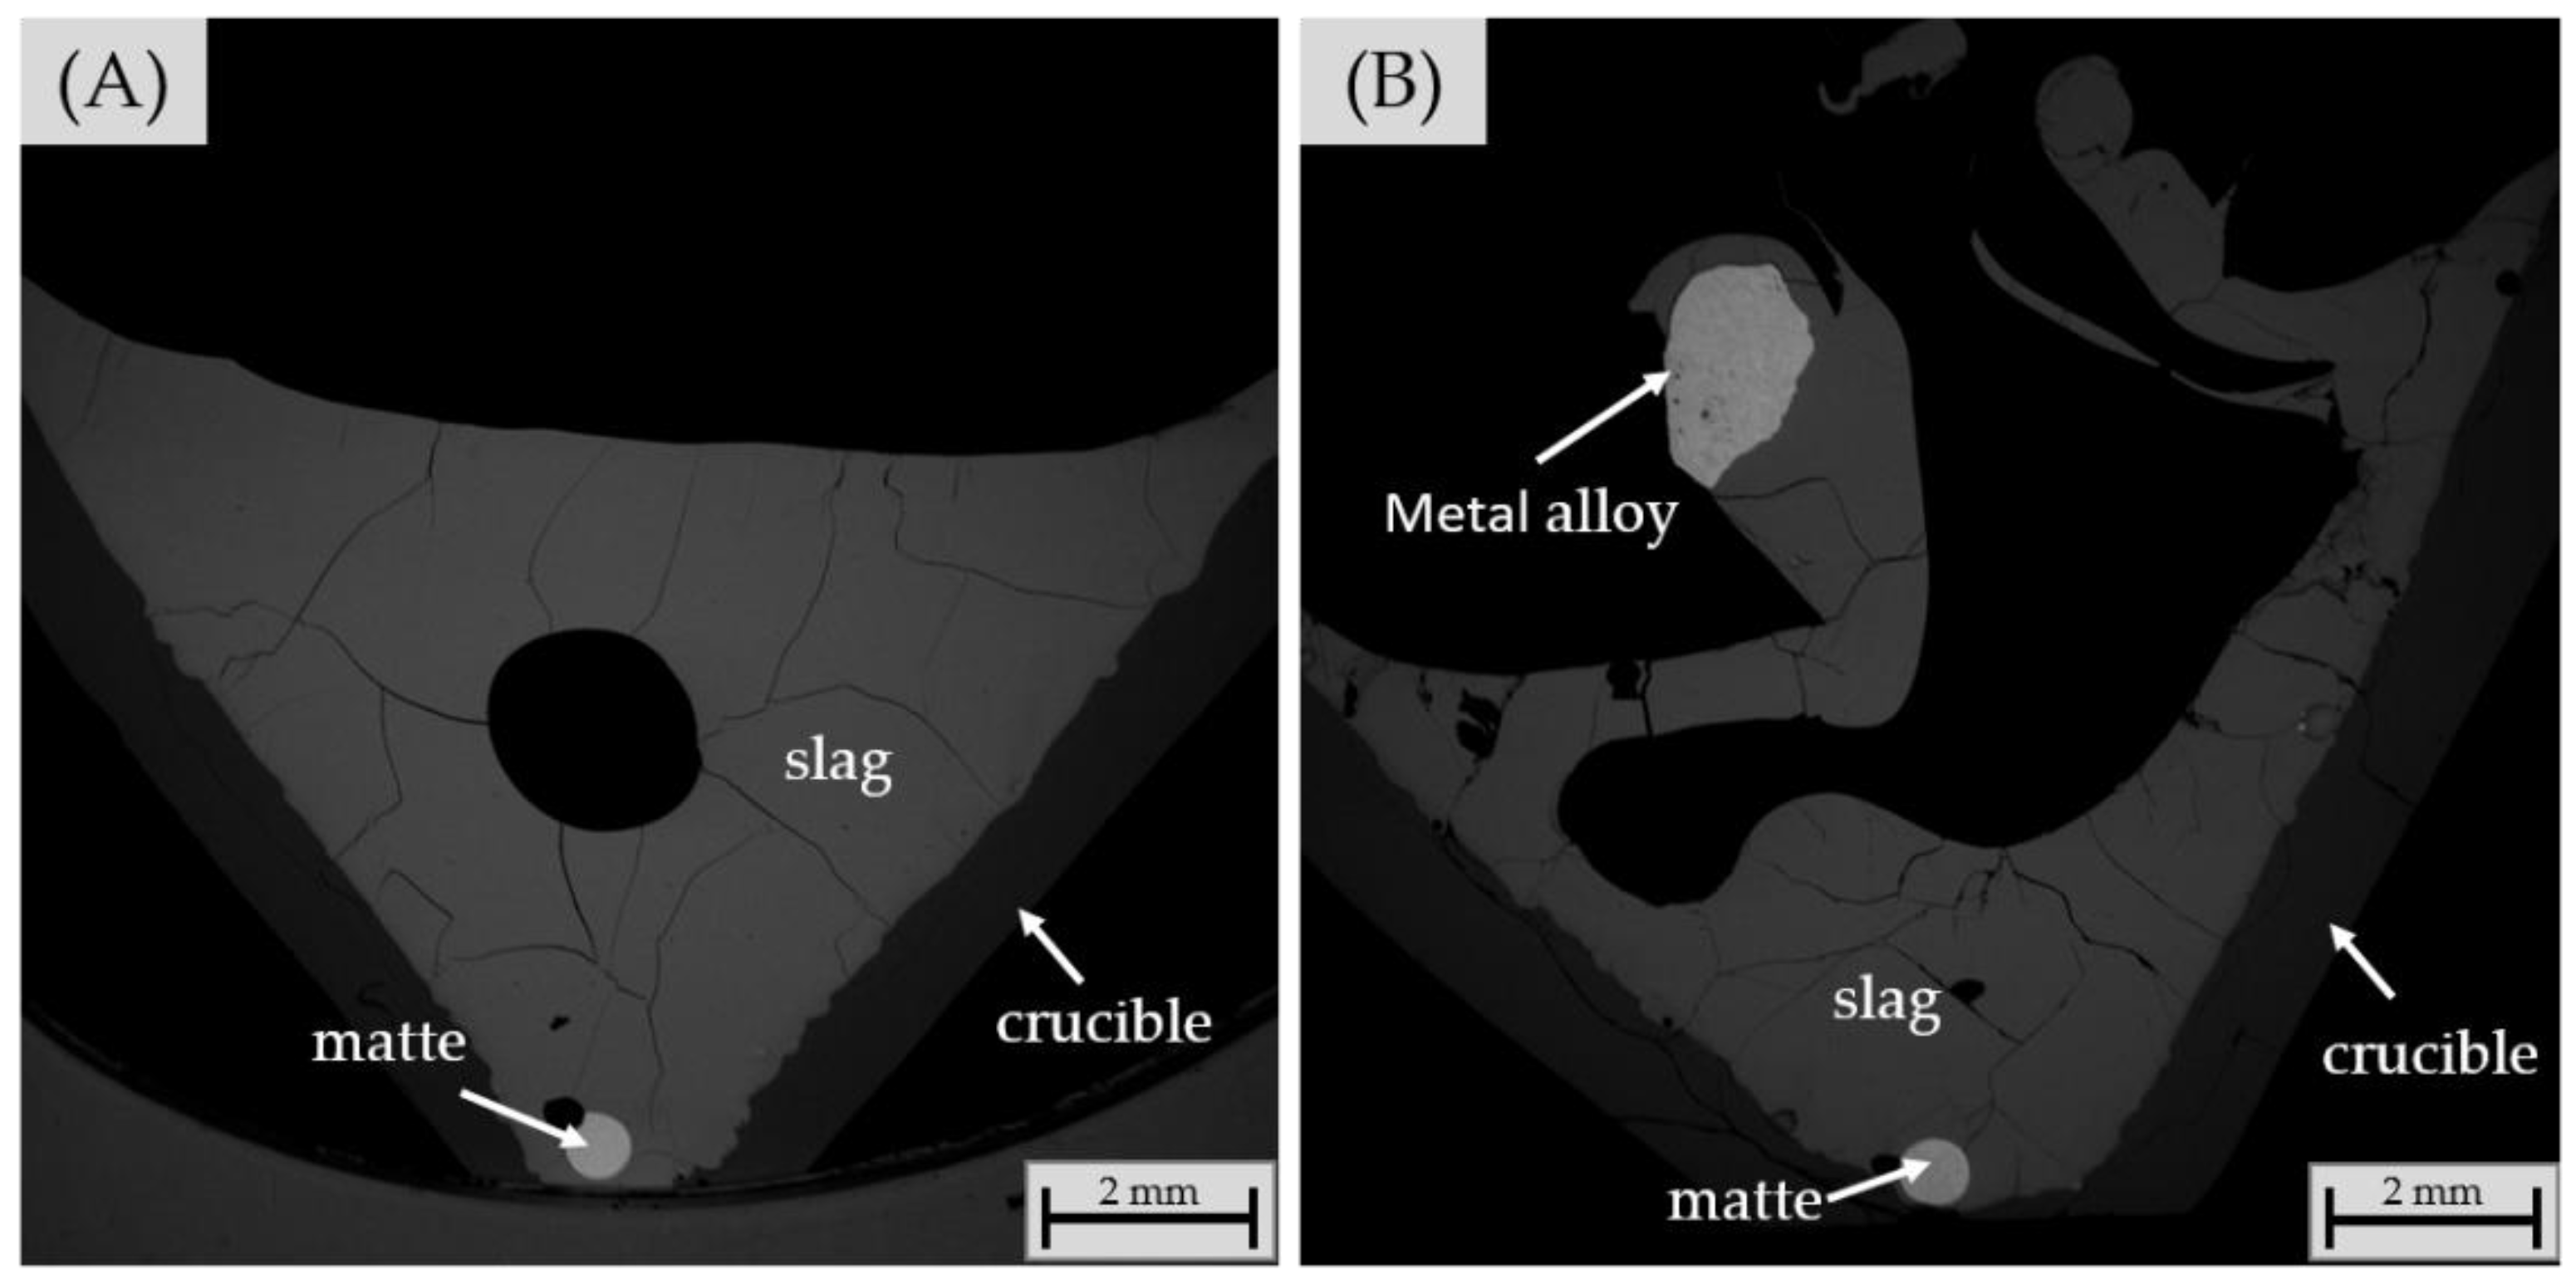
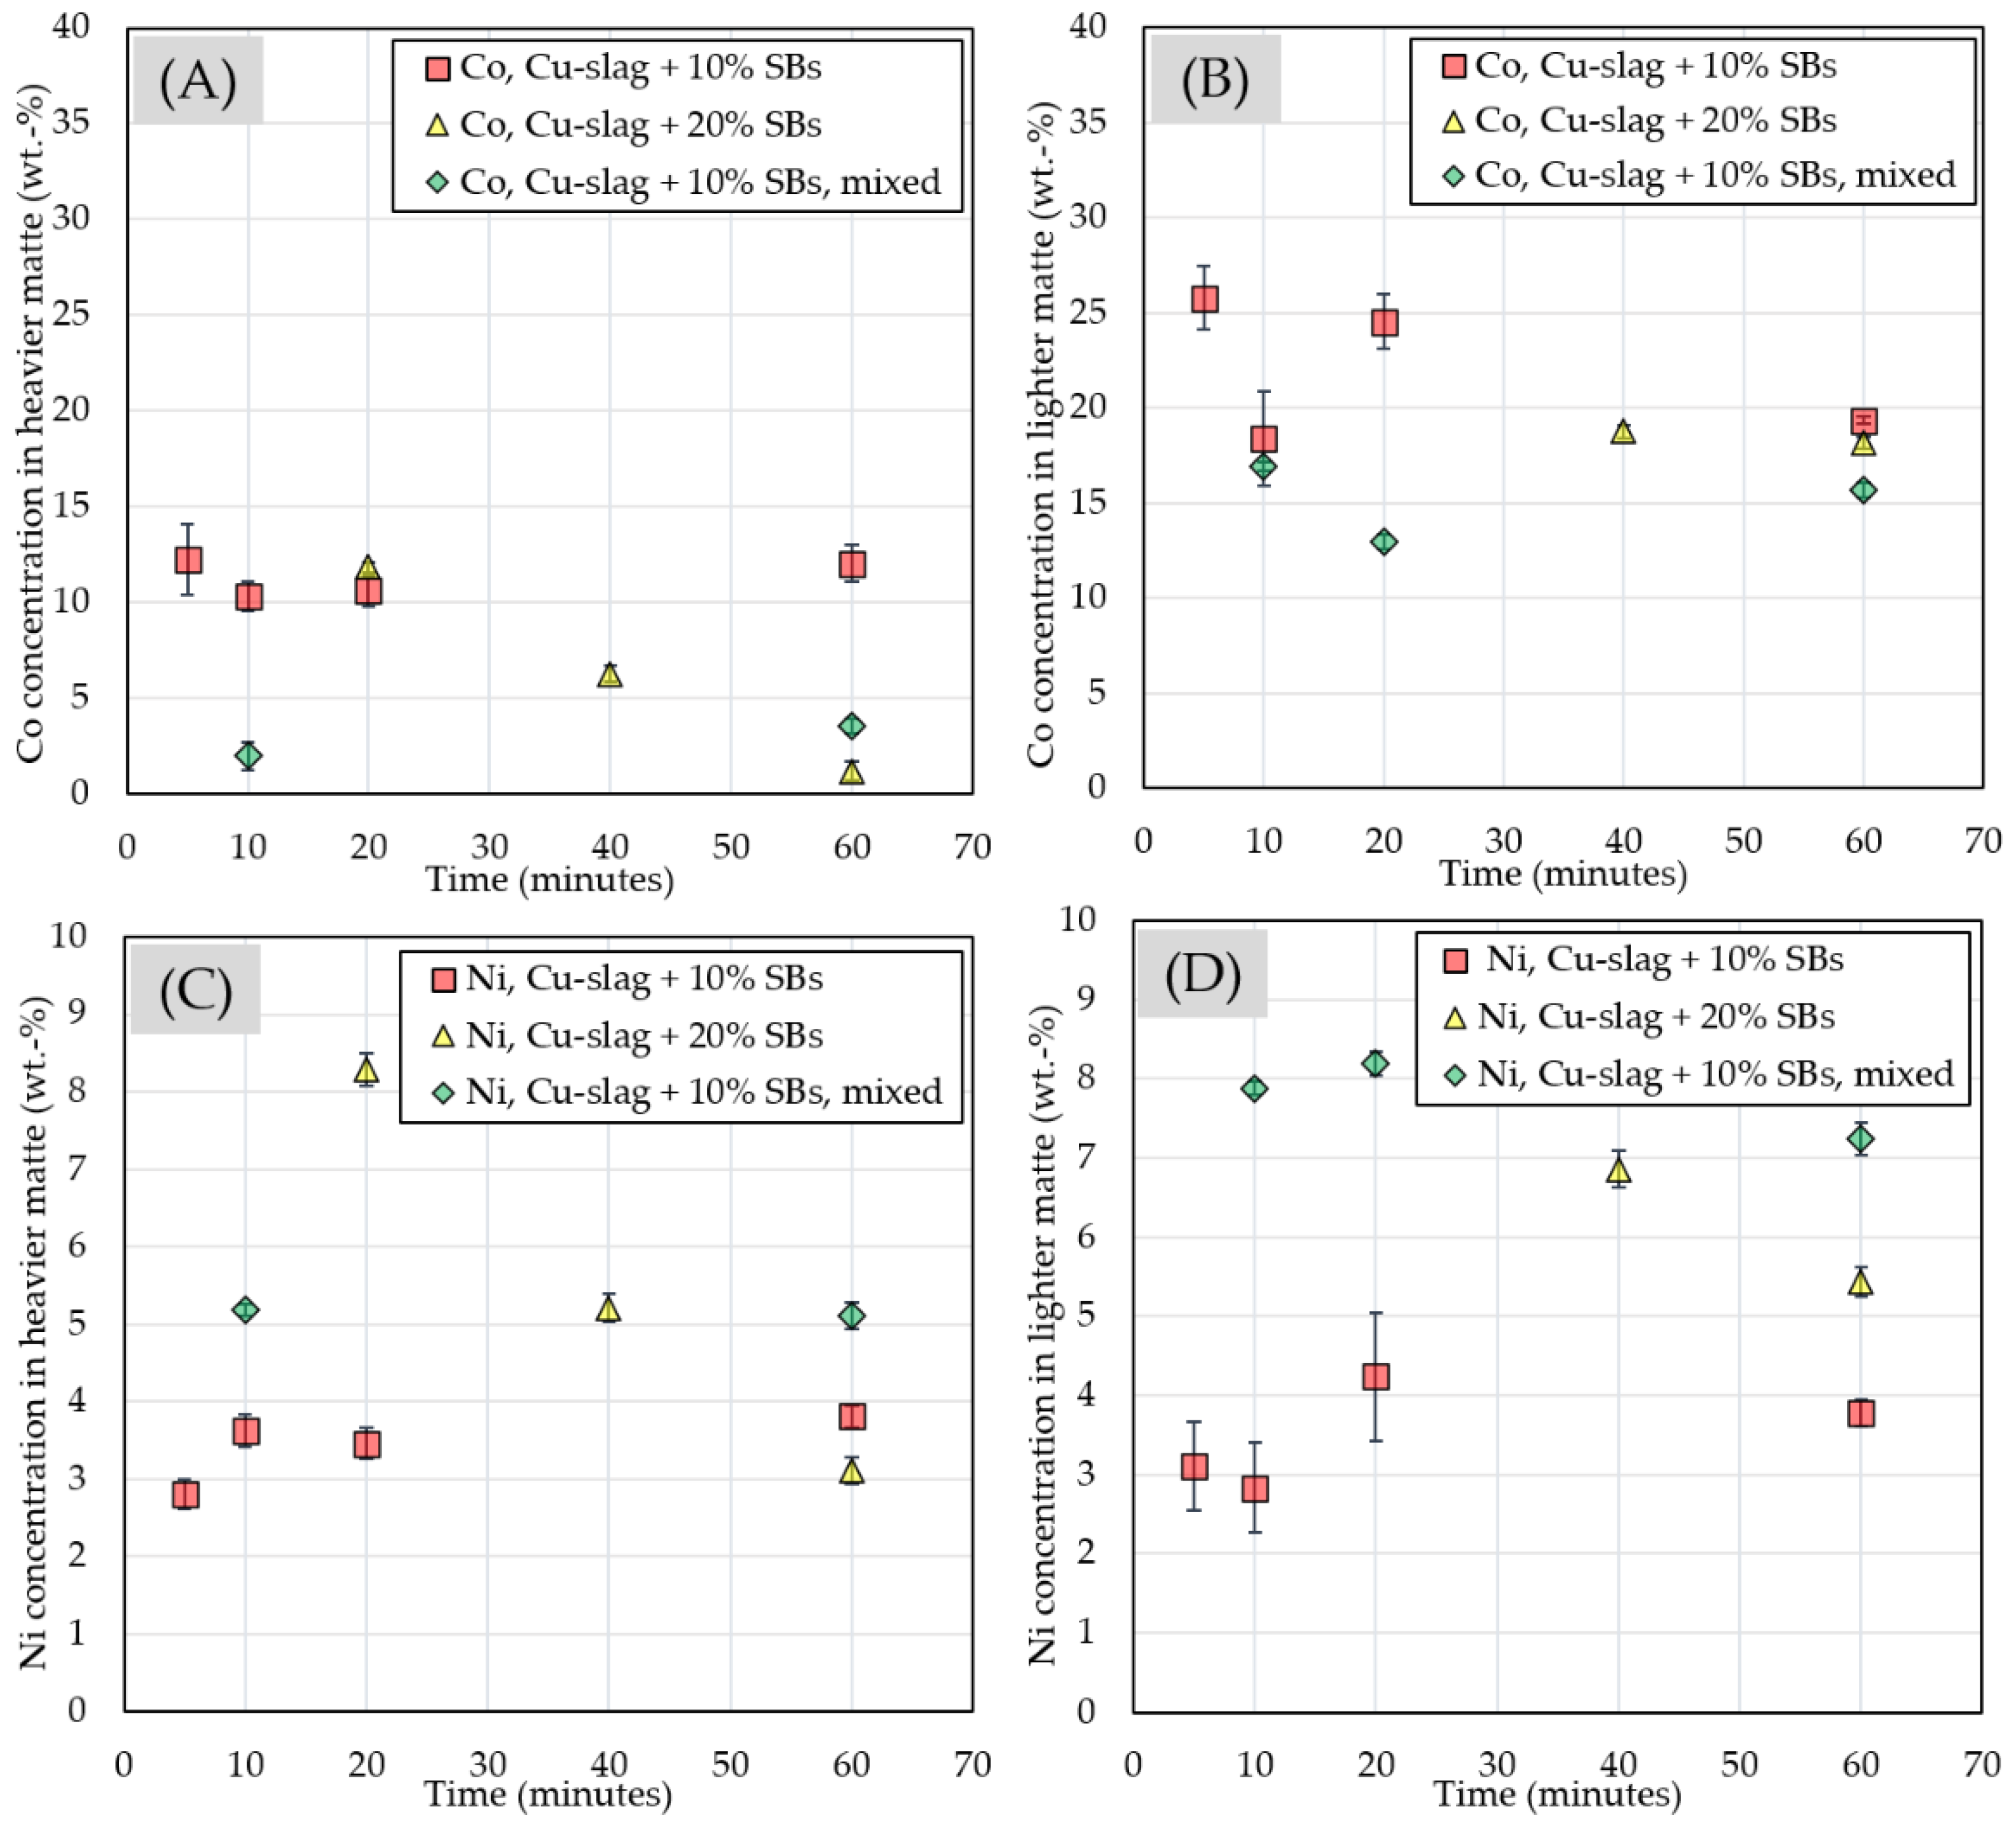
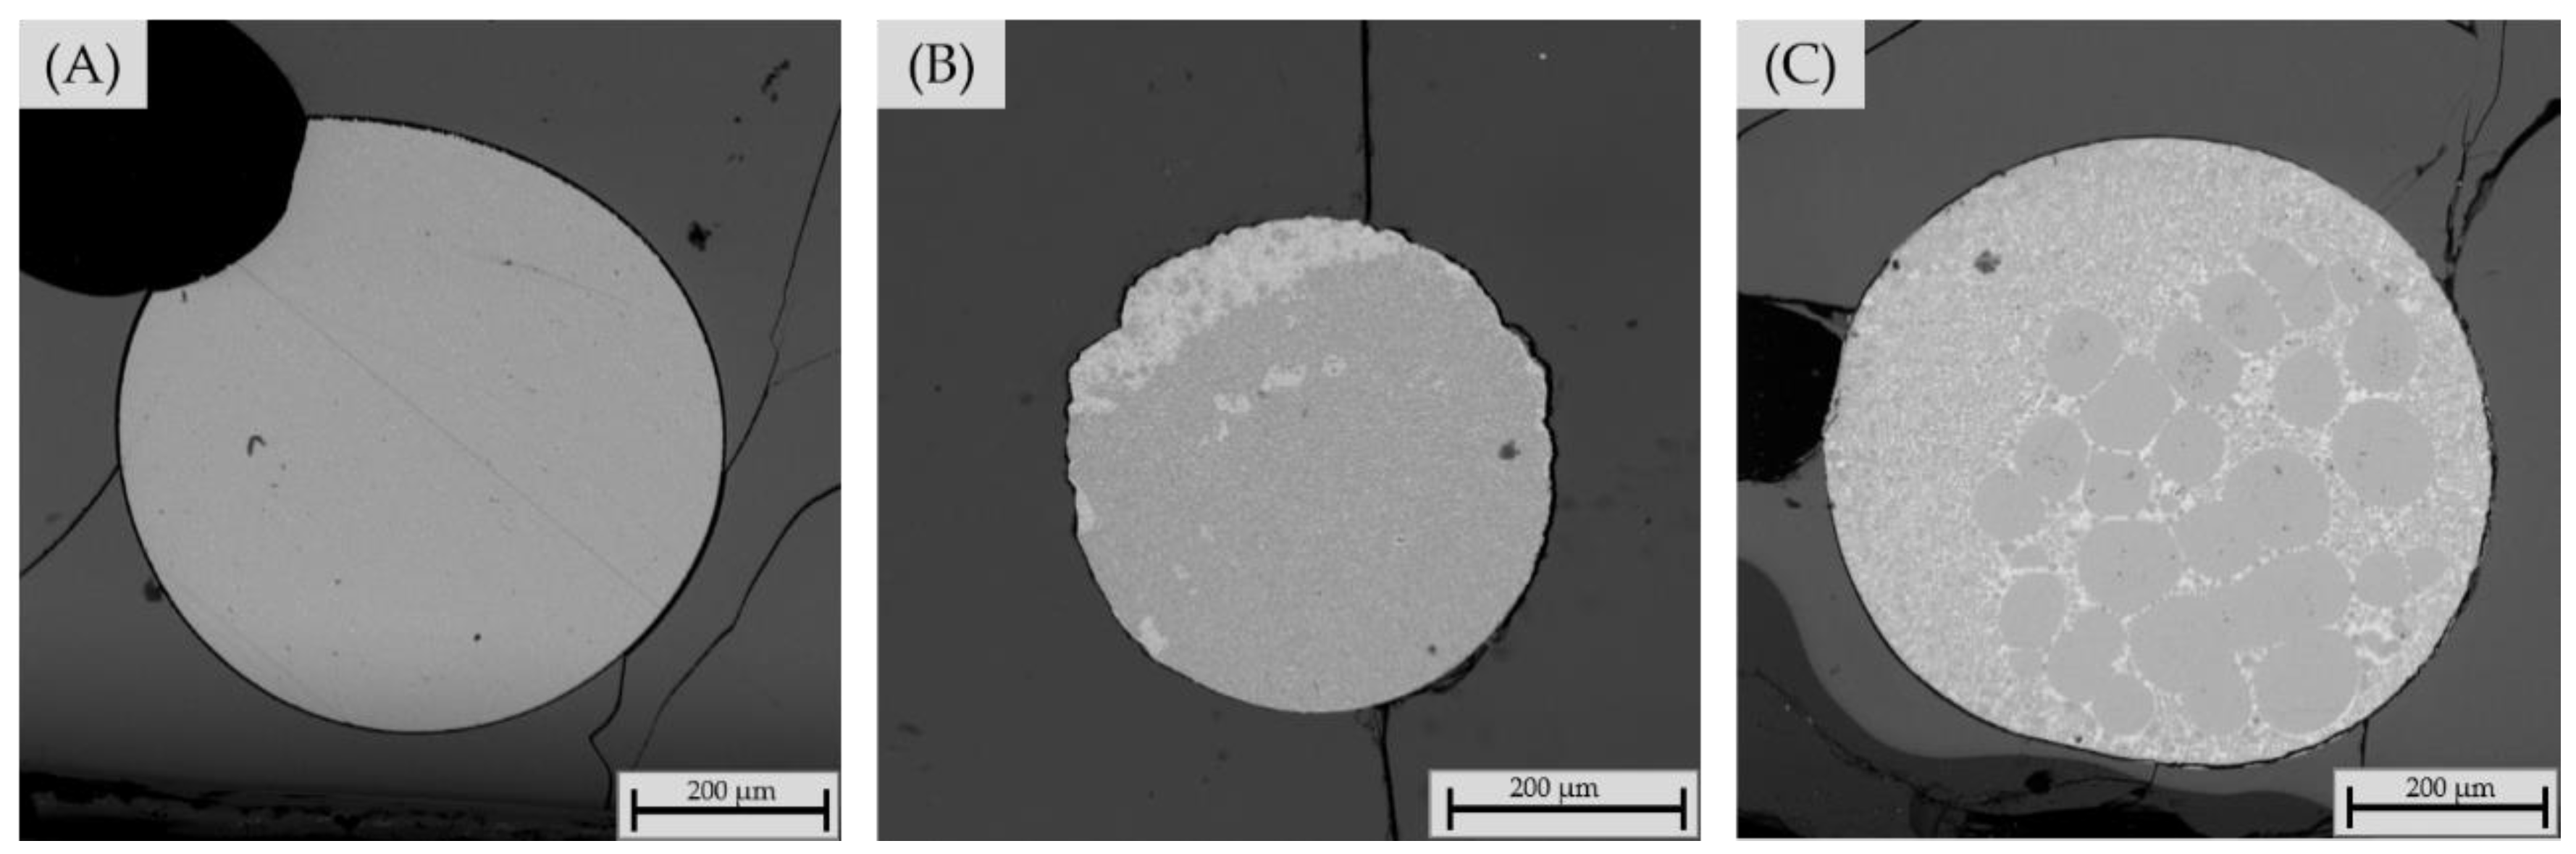
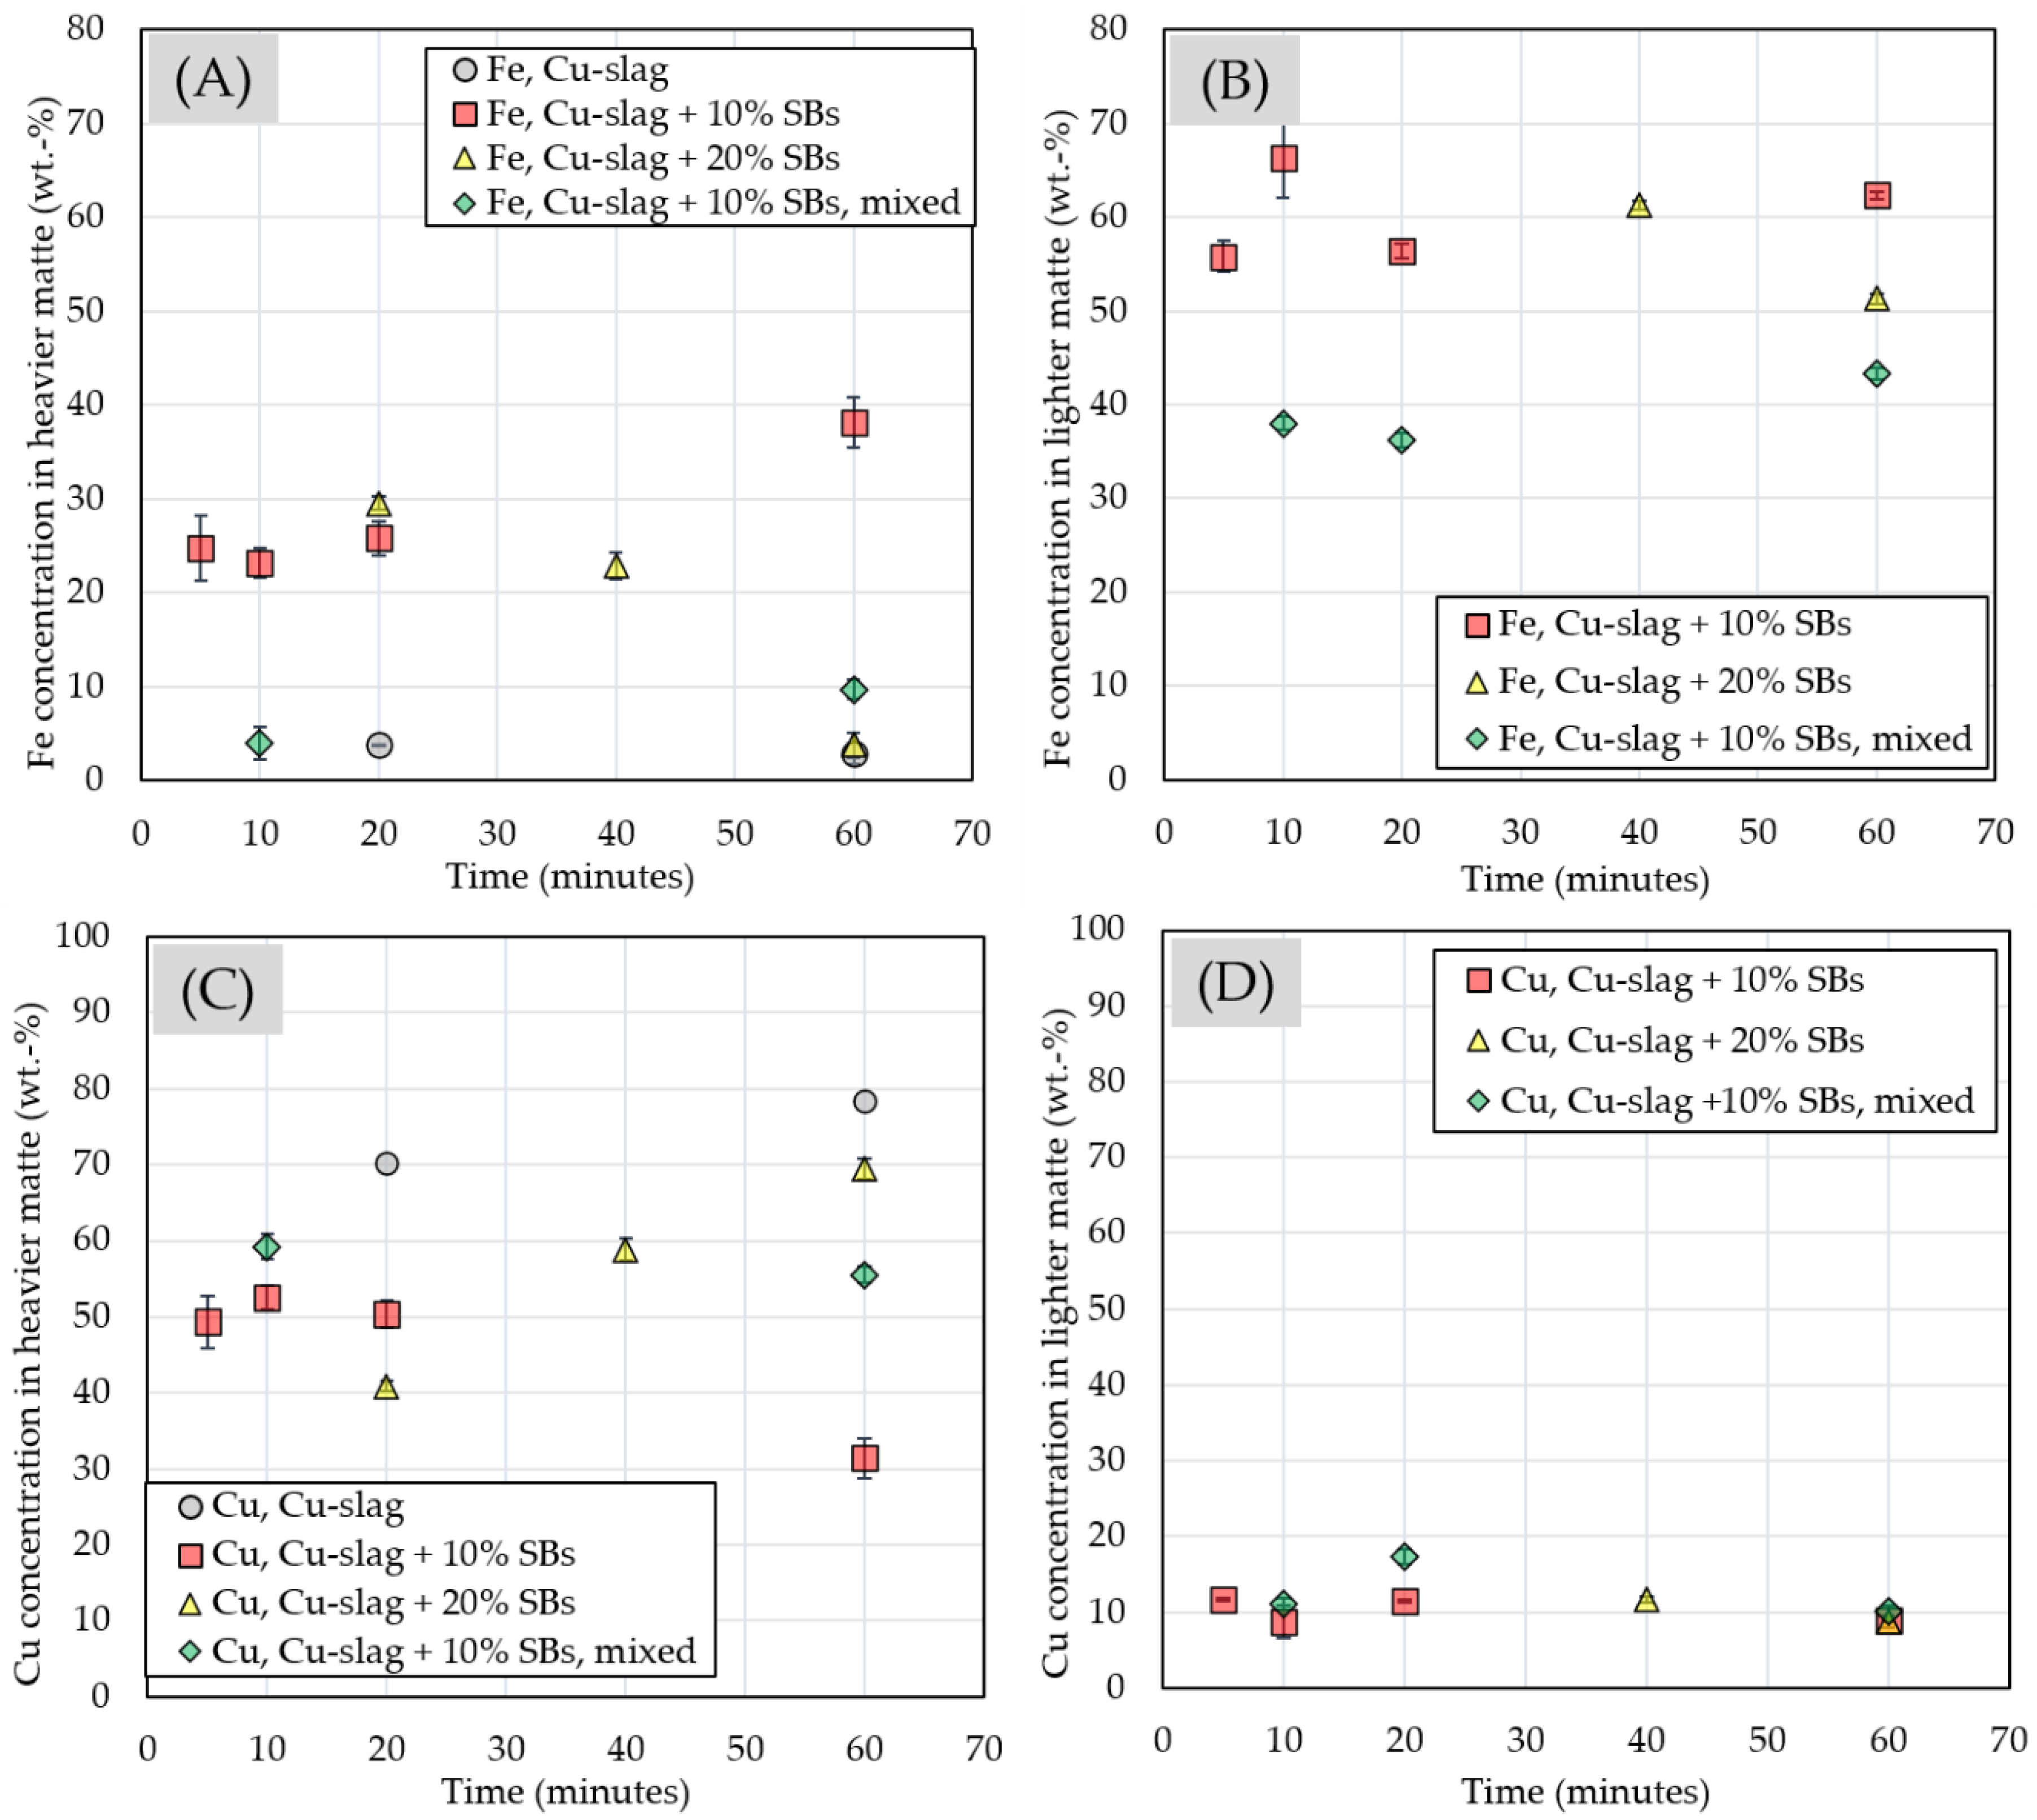
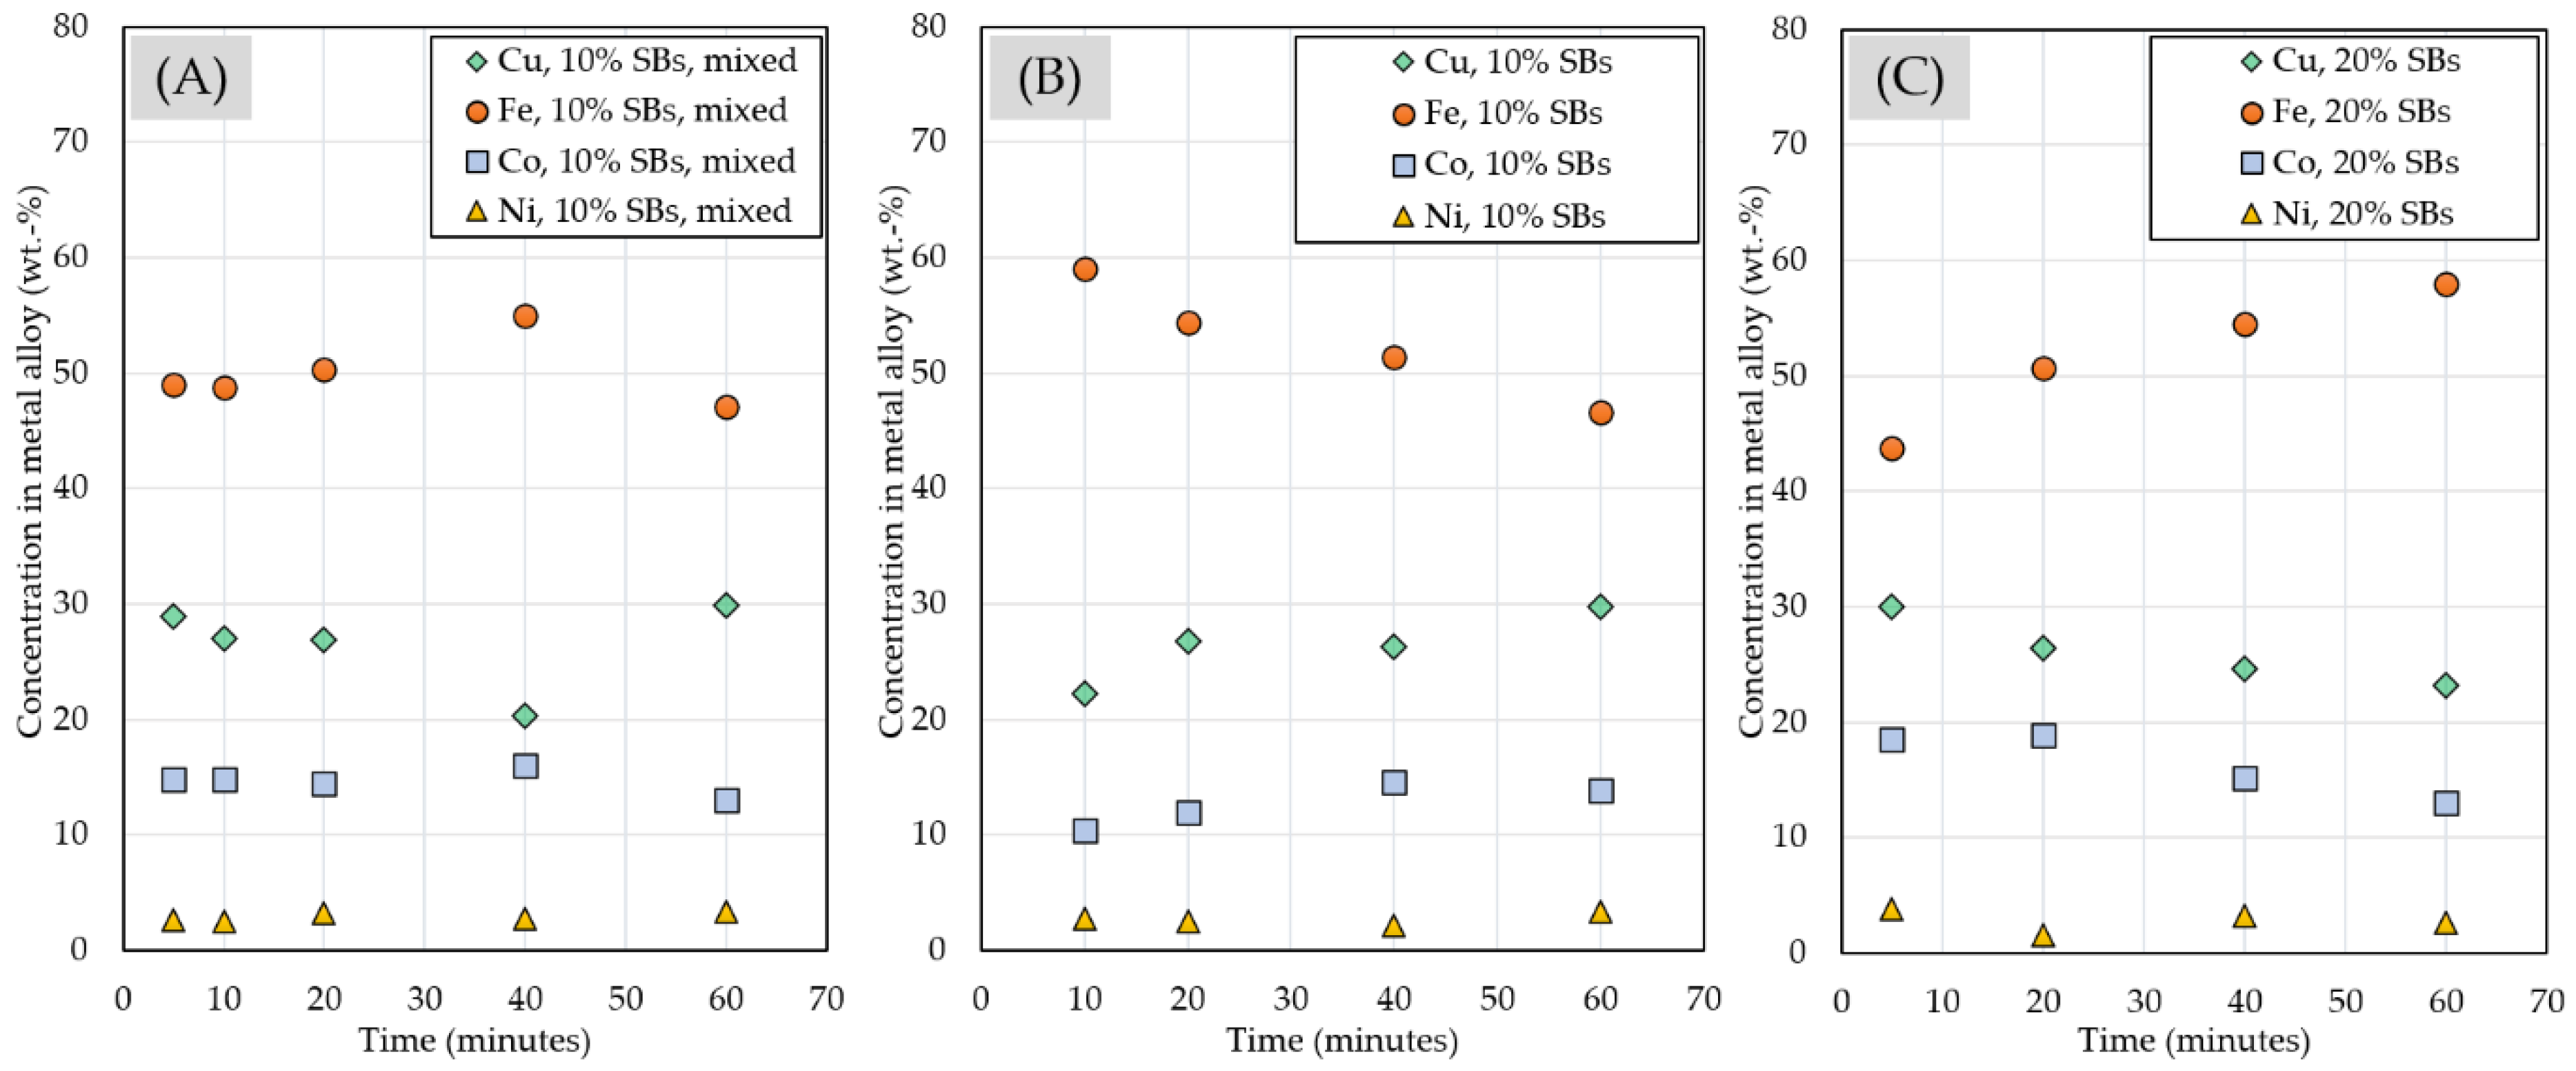
3.2.4. Chemical Composition of Matte and Alloy Phases

In the samples with only Cu-slag in the starting mixture, only two phases were formed: slag and matte, which can be seen from Figure 13A. The matte was formed as a droplet on the bottom of the crucible in both experiments conducted with 20 and 60 min contact time. The copper concentration in matte in samples without SB addition was 70 and 78.4 wt.%, whereas iron concentration was much lower, around 3.9 and 2.9 wt.% in the samples after 20 and 60 min contact time, respectively. Sulfur was the third major element in the matte formed in this system and its concentration reached 20.1 wt.% at 20 min contact time and decreased to 14.4 wt.% after 60 min contact time.
The matte droplet was found in most of the samples with SBs added to the system. Even though the cross-section of each sample was chosen close to the bottom part of the conical crucible, it is possible that the matte phase was located somewhere else in the sample. In the samples with SBs added, an additional metal alloy phase with very low sulfur concentration (approximately 0.4 wt.%) was formed on top of the slag. The metal alloy was formed in the samples regardless of the sample preparation method—whether the SBs were added on top of the Cu-slag of mixed together with the Cu-slag before the experiment.
In comparison to samples without SB addition, the matte phase contained two distinct phases with different composition and structure, as can be seen in Figure 14. Only in one sample with 20 wt.% of SBs (after 20 min contact time), one phase was visible in the sample cross-section. The matte with the darker color consisted of lighter elements of which iron was the major element, whereas the matte with the brighter color contained more heavy elements of which copper was the major element. The lighter matte (darker color) seemed to have a homogenous phase structure, whereas the heavier matte (brighter color) had a net-type structure. The chemical compositions of both heavier and lighter matte are presented in Figure 15 and Figure 16 as well as in Table A3 and Table A4 in Appendix B.
The concentration of Fe and Cu varied significantly between heavier (brighter color) and lighter (darker color) matte. Fe concentration in heavier matte was the highest in the system with 10 wt.% SBs added on top of the slag and increased from 24.7 wt.% after 5 min contact time up to 38.2 wt.% after 60 min contact time. In the case of battery scrap mixed with the Cu-slag, Fe concentration was much lower at 4.0 wt.% after 10-min contact time and 9.7 wt.% after 60 min contact time. Fe concentration in the lighter matte varied between 55.8 and 62.3 wt.% in the system with 10 wt.% SBs added on top of the slag and between 38.0 and 43.3 wt.% in case of the system with 10 wt.% mixed with the Cu-slag. In comparison to iron concentration, Cu concentration was higher in the heavier matte and lower in the lighter matte. In the lighter matte, Cu concentration varied randomly between 8.8 and 17.4 wt.% in the samples, whereas in heavier matte its concentration decreased from 49.3 wt.% after 5 min contact time to 31.4 wt.% after 60 min contact time in the system with 10 wt.% added on top of the Cu-slag. The decrease in Cu concentration was caused by increasing Fe-concentration in the same system.
Figure 16 shows Co and Ni concentrations in heavier and lighter matte phase. Co concentration in heavier matte remained relatively stable over time in the systems with 10% SB addition: 10–12 wt.% in the system with 10 wt.% SBs added on top of the slag and about 2–3.5 wt.% in the system with 10 wt.% SBs mixed with Cu-slag. The Co concentration with 20% SB addition decreased from approximately 12 to 2 wt.% with increasing contact time. In comparison to heavier matte phase, Co concentration in lighter matte reached higher values, between 25 and 18 wt.% in the systems with SBs added on top of the slag and 13–17 wt.% in the case of SBs mixed together with the slag. In the case of the system with 10% SBs mixed together with the Cu-slag, Ni-concentration in heavier matte reached approximately 5 wt.%, and between 7 and 8 wt.% in the lighter matte phase. When 10% of SBs were added without mixing, the Ni concentrations in both matte phases were lower compared to the mixed samples. With higher SB addition, the Ni concentrations in both phases decreased over time.
As described in Section 2.3, the metal alloy also consisted of two different phases. Both phases consisted of only metals; however, their compositions were different. The concentration of copper in the brighter color area was between 45 and 87 wt.%, and iron concentration was between 4 and 31 wt.%. In the darker color phase, copper concentration was lower, between, 8 and 12 wt.%, whereas iron concentration was higher, between 58 and 77 wt.%. The average composition of the whole metal alloy was calculated using statistical approach described in Section 2.3, and the compositions have been presented numerically in Table A5 in Appendix B
Figure 17 shows the average chemical concentrations of Cu, Fe, Co, and Ni in the metal alloy. In the samples with 10 wt.% of SBs mixed with the slag, the Fe concentration changed only slightly, whereas in the case of samples where 10% SBs were added on top of the slag, its concentration decreased over the time. However, the final Fe concentration in both systems with 10 wt.% SBs, mixed with the slag or added on top of the slag, reached the same value of around 47 wt.%. In the system with 20 wt.% SBs, Fe concentration increased from 44 wt.% after 5 min contact time to 58 wt.% after 60 min contact time. This is in agreement with Figure 10, which shows that Fe concentration in the slag decreased quite rapidly as a function of time in the samples with 20 wt.% SBs. Therefore, it can be concluded that when more SBs were added to the system, the reduction of iron oxides progressed further over time as there were more reductants (metallic aluminum as well as graphite) added to the system.
Cu concentration in the metal alloy changed slightly in the system with 10 wt.% SBs mixed with the slag. Its concentration in the system with 10 wt.% SBs added on top of the slag increased from 22 wt.% after 10 min contact time to 30 wt.% after 60-min contact time. Similarly as with Fe concentration, Cu concentration reached the same value after 60 min contact time in both systems with 10 wt.% SBs, regardless of whether the SBs were added on top of the slag or mixed together with the slag. In the system with 20 wt.% of battery scrap, Cu concentration decreased from 30 to 23 wt.% over time, which was caused by increasing concentration of iron in the metal alloy.
Co concentration was relatively constant, around 15 wt.%, in the system with 10 wt.% SBs mixed with the slag. In the system with SBs added on top of the slag, Co concentration increased slightly over the time, between 10 and 14 wt.%, in the samples with 10 wt.% of SBs, and decreased slightly, between 19 and 13 wt.% in the samples with 20 wt.% SBs.
Ni concentration in metal alloy was much lower that the concentrations of Cu, Fe, and Co, and its value remain relatively constant, between 1.5 and 3.8 wt.% regardless of the amount of SBs added to the system.

4. Conclusions

The results shown in this article suggest that industrial Cu slag prereduction can be integrated with LIB waste recycling, and that synergistic benefits for both processes can be achieved. This study expands on the previously published research of the authors [21,22] related to integrating battery recycling with Ni slag cleaning, introducing another novel process route for the recovery of valuables (Cu, Co, and Ni) simultaneously from Cu slag and mechanically pre-treated LIB waste.
Froth flotation was applied for the preliminary separation of a coarse (>500 µm) Cu/Al rich sieve fraction of LIB waste, from which most of the remaining active materials were recovered in the froth phase selectively, while simultaneously enriching Cu and Al to the underflow. In other words, flotation was used to successfully separate the coarse LIB fraction into two valuable concentrates: an active material concentrate, and a Cu/Al concentrate. This separation step was desirable as it increased the overall separation efficiency of the initial mechanical processing. Separation of the active material and the metallic/plastic components in the current industrial mechanical process is difficult, due to the antagonistic effect of the PVDF binder, and the cross-contamination that happens when the battery packs are crushed and ground as a whole. This leaves some of the active material adhered on the coarse particle surfaces, hindering size-based separation by sieves. Therefore, sieve sizes much larger than the active particle diameter are needed, allowing for more Cu, Al, and plastic contaminants to enter the active material concentrate. This study, together with the previously published studies of the authors [21,22], demonstrate the applicability of flotation for increasing the Co, Ni, Mn, Li, and graphite grade in the active material concentrate, while allowing for a sufficient recovery.
The selective separation of the active material in the froth was made possible due to the PVDF coating (originating from the LIBs) giving rise to hydrophobic surface properties for both the anode and the cathode active particles. In the MIBC flotation experiments, up to 82% of recoveries for Co were achieved with an average Co grade of 28.75%. The alternative frothers (CellFroth/HPMC) achieved a slightly better separation, as Co recoveries ranged between 74–83%, with grades of 30–32%. However, since the process flowchart introduced in this study (Figure 1) directly expands on a previously published process [21,22], it was desirable to apply the same flotation parameters as previously, and the MIBC experiments′ underflow fractions were therefore applied for the pyrometallurgical experiments.
Prereduction of the valuable components (Cu slag and battery metal oxides) was then demonstrated in an integrated process, in which the flotation underflow and industrial Cu slag were mixed and fed to a high-temperature slag cleaning process. The aluminum from the flotation fraction served as the main reducing agent. Additionally, a small amount of graphite, which was not recovered in the froth phase during flotation, was also a reducing element in the slag/underflow mixture. Applying metallic Al as a reductant was beneficial from multiple perspectives. Firstly, aluminothermic reduction reaction has been shown to remove hazardous elements originating from the Cu slag (As, Pb, Sb) [26], a result, which was also confirmed in this study. Secondly, the process seemed to be relatively efficient in recovering Ni, Co, and Cu both from the spent batteries as well as from the Cu slag. Thirdly, aluminothermic reduction is a highly exothermic reaction, which decreases the energy input required for the pyrometallurgical process. The fact that the Al reductant used in this study originated from the waste LIBs gave economic justification for its usage, even though pure Al as a metallothermic reductant would otherwise be relatively expensive. Further economic benefits were obtained by the possibility to efficiently recover the copper from the battery flotation underflow, since the copper and aluminum cannot be easily separated into their own fractions through mechanical processing.
In this study, the reduction behavior of elements was investigated as a function of time. It was shown that the use of SBs mixed with the slag resulted in achieving relatively stable concentrations of elements in the slag and matte over time. In case of SBs added on top of the slag, more significant changes in elemental concentrations were observed as the reduction time increased. However, after 60 min contact time, the concentrations of most of the elements reached similar values as in the system with the same amount of SBs mixed together with the slag. Therefore, it can be concluded that the grinding step, as the most energy consuming operation in mechanical processing, should be omitted in the industrial process where the residence time in the slag cleaning furnace is sufficiently long.
For future research, factors affecting the settling of the metal alloy phase towards the bottom of the crucible should be investigated. Additionally, elements such as lithium were lost in the slag, and their recovery possibilities could be further studied.

Author Contributions

Conceptualization, A.J. and R.S.-G.; Methodology, T.R., A.K., L.K., R.R., A.J. and R.S.-G.; Software, T.R., A.K., H.O. and L.K.; Validation, T.R., A.K., L.K., R.R., A.J. and R.S.-G.; Formal analysis, T.R., A.K. and L.K.; Investigation, T.R., A.K., L.K. and R.R.; Resources, H.O., A.J. and R.S.-G.; Data curation, T.R., A.K., R.R. and L.K.; Writing—original draft preparation, T.R., A.K. and L.K.; Writing—review and editing, R.R., H.O., A.J. and R.S.-G.; Visualization, T.R., A.K., R.R. and L.K.; Supervision, A.J. and R.S.-G.; Project administration, A.J. and R.S.-G.; Funding acquisition, A.J. and R.S.-G. All authors have read and agreed to the published version of the manuscript.

Funding

This research was funded by Business Finland BATCircle2.0 project, grant number 44886/31/2020, and SYMMET project, grant number 3891/31/2018.

Data Availability Statement

Not applicable.

Acknowledgments

T.R. thanks the Technology Industries of Finland Centennial Foundation (Steel and Metal Producers Fund) for a Doctoral studies scholarship. The authors are grateful Akkuser Oy (Finland) for providing battery scrap. The authors would like to thank Ted Nuorivaara for providing the CellFroth samples used in the flotation experiments of this study. This study utilized the RawMatTERS Finland infrastructure (RAMI, Academy of Finland) in Aalto University, VTT Espoo and GTK Espoo.

Conflicts of Interest

The authors declare no conflict of interest.

Appendix A

Figure A1. The grade–recovery curves for Mn in the (A) MIBC experiments and (B) CellFroth experiments.
Metals 12 00015 g0a1

Appendix B

Table A1. Chemical concentration of trace elements in the slag phase analyzed with LA-ICP-MS.
Slag phase
0% SBsppmw
time/minutesCuZnCoNiLiMnAsSnSbPb
208362 ± 36117,282 ± 414568 ± 21.0428 ± 12.112.6 ± 0.32453 ± 10.41206 ± 44.6975 ± 18.91037 ± 28.42688 ± 46.7
609309 ± 19414,700 ± 345570 ± 21.1426 ± 6.7012.7 ± 0.17442 ± 8.24916 ± 27.7910 ± 19.3972 ± 16.22215 ± 35.0
10% SBsppmw
time/minutesCuZnCoNiLiMnAsSnSbPb
52487 ± 29913,890 ± 22081875 ± 33835.5 ± 8.92804 ± 121786 ± 11115.2 ± 4.83608 ± 84.537.2 ± 27.91899 ± 302
103172 ± 1533806 ± 3721814 ± 24230.6 ± 7.851105 ± 18.41876 ± 44.114 ± 1.03226 ± 16.211.5 ± 4.33371 ± 61.9
202719 ± 11911,612 ± 14051736 ± 13522.6 ± 1.67858 ± 41.61052 ± 40.315.6 ± 0.48457 ± 30.07.30 ± 0.731396 ± 141
403104 ± 2092620 ± 7822049 ± 21221.0 ± 2.361101 ± 27.71036 ± 84.111.5 ± 0.35202 ± 68.43.31 ± 1.45308 ± 142
603097 ± 42.81242 ± 4621520 ± 36.215.8 ± 0.561206 ± 24.21463 ± 50.011.7 ± 0.39159 ± 70.91.08 ± 0.12144 ± 73.8
20% SBsppmw
time/minutesCuZnCoNiLiMnAsSnSbPb
52288 ± 12410,639 ± 21591139 ± 39.225.2 ± 4.541234 ± 1181257 ± 16311.8 ± 0.78494 ± 70.810.5 ± 3.241167 ± 286
203192 ± 1428466 ± 8901902 ± 33238.1 ± 5.862180 ± 1541954 ± 21316.5 ± 0.65109 ± 27.91.63 ± 0.91638 ± 91.9
403019 ± 1041498 ± 2431661 ± 44111.6 ± 4.202151 ± 71.41764 ± 13412.3 ± 0.3973.3 ± 18.11.16 ± 0.56126 ± 23.7
602737 ± 84.41172 ± 2861141 ± 21410.4 ± 2.593236 ± 1823053 ± 14710.5 ± 0.41165 ±34.40.98 ± 0.21193 ± 39.1
10% SBs, mixppmw
time/minutesCuZnCoNiLiMnAsSnSbPb
52012 ± 82.117,939 ± 19732470 ± 15948.7 ± 8.341418 ± 48.41173 ± 64.215.9 ± 4.51494 ± 47.421.9 ± 10.31647 ± 200
102189 ± 89.715,956 ± 18972463 ± 22138.7 ± 4.941516 ± 66.61260 ± 71.012.4 ± 0.49446 ± 32.514.4 ± 2.831434 ± 147
202533 ± 65.714,972 ± 6582045 ± 25.734.9 ± 2.381552 ± 42.51339 ± 48.211.8 ± 0.61406 ± 18.86.22 ± 1.161240 ± 60.9
402592 ± 12712,475 ± 18442035 ± 79.926.4 ± 2.091367 ± 55.71221 ± 52.810.9 ± 0.45350 ± 30.76.21 ± 0.841113 ± 142
602936 ± 65.910,724 ± 4602087 ± 74.030.0 ± 1.791317 ± 51.61437 ± 28.416.9 ± 0.65344 ± 27.15.44 ± 0.34809 ± 16.4
Table A2. Chemical concentration of major elements in the slag phase analyzed with SEM-EDS.
Slag phase
0% SBswt.%
time/minutesAlCaFeMgOSi
201.90 ± 0.040.85 ± 0.0437.97 ± 0.411.07 ± 0.0835.67 ± 0.6417.32 ± 0.23
601.83 ± 0.060.78 ± 0.0436.08 ± 0.691.02 ± 0.0436.90 ± 0.7218.93 ± 0.63
10% SBswt.%
time/minutesAlCaFeMgOSi
53.25 ± 0.330.80 ± 0.0635.89 ± 0.311.06 ± 0.0437.28 ± 0.2216.96 ± 0.23
103.45 ± 0.120.84 ± 0.0435.81 ± 0.821.15 ± 0.0336.13 ± 0.6618.39 ± 0.59
203.73 ± 0.400.76 ± 0.0333.87 ± 0.811.08 ± 0.0237.68 ± 0.3218.68 ± 0.53
403.38 ± 0.130.74 ± 0.0332.28 ± 0.901.04 ± 0.0238.40 ± 0.4620.36 ± 0.57
603.89 ± 0.060.79 ± 0.0432.21 ± 0.661.05 ± 0.0238.24 ± 0.2520.06 ± 0.43
20% SBswt.%
time/minutesAlCaFeMgOSi
53.74 ± 0.260.89 ± 0.0235.07 ± 0.621.15 ± 0.0337.10 ± 0.4517.40 ± 0.16
204.57 ± 1.300.82 ± 0.0732.69 ± 1.581.04 ± 0.1436.14 ± 0.5720.89 ± 0.81
405.78 ± 0.210.73 ± 0.0528.28 ± 0.421.13 ± 0.0338.87 ± 0.3822.36 ± 0.37
606.12 ± 0.180.76 ± 0.0328.87 ± 0.431.10 ± 0.0437.86 ± 0.6022.30 ± 0.41
10% SBs, mixwt.%
time/minutesAlCaFeMgOSi
52.67 ± 0.850.80 ± 0.0636.13 ± 1.481.17 ± 0.0336.87 ± 0.8117.26 ± 0.46
103.40 ± 0.850.85 ± 0.0635.43 ± 1.261.12 ± 0.1336.64 ± 0.8118.13 ± 0.66
204.08 ± 0.120.93 ± 0.0234.02 ± 0.441.13 ± 0.0236.55 ± 0.3919.28 ± 0.21
403.31 ± 0.450.83 ± 0.0934.45 ± 0.961.06 ± 0.0536.75 ± 0.5619.75 ± 0.42
603.90 ± 0.060.82± 0.0633.11 ± 0.431.09 ± 0.0236.72 ± 0.7620.67 ± 0.31
Table A3. Chemical composition of heavier matte phase analyzed with SEM-EDS.
Heavier matte phase
0% SBswt.%
time/minutesCoCuFeNiAsSbSnPbS
20˂dl70.2 ± 0.313.91 ± 0.020.24 ± 0.01˂dl0.06 ± 0.04˂dl0.51 ± 0.0520.1 ± 0.01
60˂dl78.4 ± 5.882.94 ± 1.060.30 ± 0.25˂dl0.06 ± 0.05˂dl1.00 ± 0.6414.4 ± 8.02
10% SBswt.%
time/minutesCoCuFeNiAsSbSnPbS
512.2 ± 1.8549.3 ± 4.9724.7 ± 3.462.81 ± 0.193.10 ± 0.471.27 ± 0.292.11 ± 0.470.71 ± 0.172.68 ± 1.19
1010.3 ± 0.7752.5 ± 2.1823.2 ± 1.573.63 ± 0.212.88 ± 0.231.40 ± 0.171.62 ± 0.240.67 ± 0.172.43 ± 0.88
2010.6 ± 0.8150.3 ± 2.2125.9 ± 1.773.46 ± 0.202.44 ± 0.401.26 ± 0.281.46 ± 0.340.36 ± 0.112.90 ± 1.43
40---------
6012.1 ± 0.9531.4 ± 2.3938.2 ± 2.683.81 ± 0.144.43 ± 0.712.18 ± 0.232.39 ± 0.341.65 ± 0.272.83 ± 0.44
20% SBswt.%
time/minutesCoCuFeNiAsSbSnPbS
5---------
2011.8 ± 0.2840.9 ± 1.2229.6 ± 0.738.28 ± 0.212.26 ± 0.181.25 ± 0.080.72 ± 0.051.00 ± 0.142.74 ± 0.26
406.28 ± 0.4258.8 ± 1.8323.0 ± 1.425.21 ± 0.181.64 ± 0.111.02 ± 0.071.36 ± 0.050.20 ± 0.062.25 ± 0.33
601.21 ± 0.4769.4 ± 1.383.84 ± 1.333.11 ± 0.183.95 ± 0.8412.0 ± 1.544.52 ± 0.440.30 ± 0.090.43 ± 0.29
10% SBs, mixwt.%
time/minutesCoCuFeNiAsSbSnPbS
5---------
102.00 ± 0.7159.2 ± 2.014.00 ± 1.685.19 ± 0.086.55 ± 0.5217.5 ± 1.613.33 ± 0.220.99 ± 0.150.69 ± 0.32
20---------
40---------
603.56 ± 0.3855.5 ± 1.639.74 ± 1.085.11 ± 0.175.21 ± 0.2014.5 ± 0.513.45 ± 0.310.84 ± 0.130.99 ± 0.20
Table A4. Chemical composition of lighter matte phase analyzed with SEM-EDS.
Lighter matte phase
10% SBswt.%
time/minutesCoCuFeNiAsSbSnPbS
525.8 ± 1.6511.7 ± 0.2455.8 ± 1.673.11 ± 0.560.43 ± 0.110.08 ± 0.050.13 ± 0.081.71 ± 0.180.76 ± 0.11
1018.4 ± 2.468.80 ± 2.1766.4 ± 4.202.83 ± 0.570.57 ± 0.070.06 ± 0.04˂dl1.48 ± 0.210.70 ± 0.12
2024.6 ± 1.4111.6 ± 0.1956.4 ± 0.834.24 ± 0.820.42 ± 0.040.06 ± 0.05˂dl1.38 ± 0.140.57 ± 0.05
40---------
6019.4 ± 0.228.97 ± 0.2662.3 ± 0.463.78 ± 0.170.85 ± 0.040.14 ± 0.030.18 ± 0.052.68 ± 0.161.12 ± 0.03
20% SBswt.%
time/minutesCoCuFeNiAsSbSnPbS
5---------
20---------
4018.8 ± 0.3611.7 ± 0.3861.3 ± 0.466.86 ± 0.230.32 ± 0.05˂dl0.05 ± 0.040.20 ± 0.130.36 ± 0.03
6018.1 ± 0.308.79 ± 0.7451.3 ± 0.555.44 ± 0.188.71 ± 0.321.43 ± 0.150.48 ± 0.322.19 ± 0.212.41 ± 0.14
10% SBs, mixwt.%
time/minutesCoCuFeNiAsSbSnPbS
5---------
1017.0 ± 0.2411.2 ± 0.7738.0 ± 0.657.88 ± 0.0816.1 ± 0.204.03 ± 0.260.78 ± 0.092.21 ± 0.121.80 ± 0.12
2013.0 ± 0.3617.4 ± 0.9336.2 ± 0.828.19 ± 0.1611.1 ± 0.326.44 ± 0.471.31 ± 0.092.84 ± 0.092.02 ± 0.19
40---------
6015.7 ± 0.3510.1 ± 0.9143.3 ± 0.657.24 ± 0.2011.4 ± 0.213.31 ± 0.270.76 ± 0.084.04 ± 0.112.88 ± 0.13
Table A5. Chemical composition of metal alloy.
Metal alloy phase
10% SBswt.%
time/minutesCoCuFeNiAsSbSnPbS
5---------
1010.322.259.12.711.691.060.790.820.62
2011.926.854.42.551.180.840.820.260.41
4014.526.351.52.151.750.820.720.940.52
6013.929.846.63.332.251.380.860.780.41
20% SBswt.%
time/minutesCoCuFeNiAsSbSnPbS
518.630.143.73.860.860.580.910.280.26
2018.926.550.71.590.740.350.340.210.38
4015.224.754.63.200.350.380.360.440.39
601323.257.92.571.050.660.540.120.30
10% SBs, mixwt.%
time/minutesCoCuFeNiAsSbSnPbS
514.828.949.02.581.400.760.880.660.30
1014.827.048.82.522.151.111.040.910.52
2014.526.950.43.251.400.810.910.880.42
4016.020.455.02.791.330.680.540.840.40
6013.029.947.13.292.021.140.960.820.37

References

  1. Velázquez-Martínez, O.; Valio, J.; Santasalo-Aarnio, A.; Reuter, M.; Serna-Guerrero, R. A Critical Review of Lithium-Ion Battery Recycling Processes from a Circular Economy Perspective. Batteries 2019, 5, 68. [Google Scholar] [CrossRef] [Green Version]
  2. Lv, W.; Wang, Z.; Cao, H.; Sun, Y.; Zhang, Y.; Sun, Z.H. A Critical Review and Analysis on the Recycling of Spent Lithium-Ion Batteries. ACS Sustain. Chem. Eng. 2018, 6, 1504–1521. [Google Scholar] [CrossRef]
  3. Pinegar, H.; Smith, Y.R. Mechanical Beneficiation of End-of-Life Lithium-Ion Battery Components. In Proceedings of the Energy Technology 2020: Recycling, Carbon Dioxide Management, and Other Technologies, San Diego, CA, USA, 23–27 February 2020; Chen, X., Zhong, Y., Zhang, L., Howarter, J.A., Baba, A.A., Wang, C., Sun, Z., Zhang, M., Olivetti, E., Luo, A., et al., Eds.; Springer: Cham, Switzerland, 2020; pp. 259–267. [Google Scholar]
  4. Zhang, G.; Yuan, X.; He, Y.; Wang, H.; Zhang, T.; Xie, W. Recent advances in pretreating technology for recycling valuable metals from spent lithium-ion batteries. J. Hazard. Mater. 2021, 406, 124332. [Google Scholar] [CrossRef]
  5. Velázquez-Martinez, O.; Porvali, A.; van den Boogaart, K.G.; Santasalo-Aarnio, A.; Lundström, M.; Reuter, M.; Serna-Guerrero, R. On the Use of Statistical Entropy Analysis as Assessment Parameter for the Comparison of Lithium-Ion Battery Recycling Processes. Batteries 2019, 5, 41. [Google Scholar] [CrossRef] [Green Version]
  6. Harper, G.; Sommerville, R.; Kendrick, E.; Driscoll, L.; Slater, P.; Stolkin, R.; Walton, A.; Christensen, P.; Heidrich, O.; Lambert, S.; et al. Recycling lithium-ion batteries from electric vehicles. Nature 2019, 575, 75–86. [Google Scholar] [CrossRef] [Green Version]
  7. Brückner, L.; Frank, J.; Elwert, T. Industrial Recycling of Lithium-Ion Batteries—A Critical Review of Metallurgical Process Routes. Metals 2020, 10, 1107. [Google Scholar] [CrossRef]
  8. Widijatmoko, S.D.; Fu, G.; Wang, Z.; Hall, P. Recovering lithium cobalt oxide, aluminium, and copper from spent lithium-ion battery via attrition scrubbing. J. Clean. Prod. 2020, 260, 120869. [Google Scholar] [CrossRef]
  9. Wang, X.; Gaustad, G.; Babbitt, C.W. Targeting high value metals in lithium-ion battery recycling via shredding and size-based separation. Waste Manag. 2016, 51, 204–213. [Google Scholar] [CrossRef] [PubMed] [Green Version]
  10. Sommerville, R.; Shaw-Stewart, J.; Goodship, V.; Rowson, N.; Kendrick, E. A review of physical processes used in the safe recycling of lithium ion batteries. Sustain. Mater. Technol. 2020, 25, e00197. [Google Scholar] [CrossRef]
  11. Zhang, G.; Du, Z.; He, Y.; Wang, H.; Xie, W.; Zhang, T. A Sustainable Process for the Recovery of Anode and Cathode Materials Derived from Spent Lithium-Ion Batteries. Sustainability 2019, 11, 2363. [Google Scholar] [CrossRef] [Green Version]
  12. Pinegar, H.; Smith, Y.R. Recycling of End-of-Life Lithium Ion Batteries, Part I: Commercial Processes. J. Sustain. Metall. 2019, 5, 402–416. [Google Scholar] [CrossRef]
  13. Widijatmoko, S.D.; Gu, F.; Wang, Z.; Hall, P. Selective liberation in dry milled spent lithium-ion batteries. Sustain. Mater. Technol. 2019, 23, e00134. [Google Scholar] [CrossRef]
  14. Yu, J.; Tan, Q.; Li, J. Exploring a green route for recycling spent lithium-ion batteries: Revealing and solving deep screening problem. J. Clean. Prod. 2020, 255, 120269. [Google Scholar] [CrossRef]
  15. Yu, J.; He, Y.; Ge, Z.; Li, H.; Xie, W.; Wang, S. A promising physical method for recovery of LiCoO2 and graphite from spent lithium-ion batteries: Grinding flotation. Sep. Purif. Technol. 2018, 190, 45–52. [Google Scholar] [CrossRef]
  16. Wang, F.; Zhang, T.; He, Y.; Zhao, Y.; Wang, S.; Zhang, G.; Zhang, Y.; Feng, Y. Recovery of valuable materials from spent lithium-ion batteries by mechanical separation and thermal treatment. J. Clean. Prod. 2018, 185, 646–652. [Google Scholar] [CrossRef]
  17. Liu, J.; Wang, H.; Hu, T.; Bai, X.; Wang, S.; Xie, W.; Hao, J.; He, Y. Recovery of LiCoO2 and graphite from spent lithium-ion batteries by cryogenic grinding and froth flotation. Miner. Eng. 2020, 148, 106223. [Google Scholar] [CrossRef]
  18. Zhang, G.; He, Y.; Feng, Y.; Wang, H.; Zhu, X. Pyrolysis-Ultrasonic-Assisted Flotation Technology for Recovering Graphite and LiCoO2 from Spent Lithium-Ion Batteries. ACS Sustain. Chem. Eng. 2018, 6, 10896–10904. [Google Scholar] [CrossRef]
  19. Zhang, G.; He, Y.; Wang, H.; Feng, Y.; Xie, W.; Zhu, X. Application of mechanical crushing combined with pyrolysis-enhanced flotation technology to recover graphite and LiCoO2 from spent lithium-ion batteries. J. Clean. Prod. 2019, 231, 1418–1427. [Google Scholar] [CrossRef]
  20. He, Y.; Zhang, T.; Wang, F.; Zhang, G.; Zhang, W.; Wang, J. Recovery of LiCoO2 and graphite from spent lithium-ion batteries by Fenton reagent-assisted flotation. J. Clean. Prod. 2017, 143, 319–325. [Google Scholar] [CrossRef]
  21. Ruismäki, R.; Rinne, T.; Dańczak, A.; Taskinen, P.; Serna-Guerrero, R.; Jokilaakso, A. Integrating Flotation and Pyrometallurgy for Recovering Graphite and Valuable Metals from Battery Scrap. Metals 2020, 10, 680. [Google Scholar] [CrossRef]
  22. Dańczak, A.; Ruismäki, R.; Rinne, T.; Klemettinen, L.; O’Brien, H.; Taskinen, P.; Jokilaakso, A.; Serna-Guerrero, R. Worth from Waste: Utilizing a Graphite-Rich Fraction from Spent Lithium-Ion Batteries as Alternative Reductant in Nickel Slag Cleaning. Minerals 2021, 11, 784. [Google Scholar] [CrossRef]
  23. Gorai, B.; Jana, R. Premchand Characteristics and utilisation of copper slag—A review. Resour. Conserv. Recycl. 2003, 39, 299–313. [Google Scholar] [CrossRef]
  24. Potysz, A.; van Hullebusch, E.D.; Kierczak, J.; Grybos, M.; Lens, P.N.L.; Guibaud, G. Copper Metallurgical Slags—Current Knowledge and Fate: A Review. Crit. Rev. Environ. Sci. Technol. 2015, 45, 2424–2488. [Google Scholar] [CrossRef]
  25. Alp, I.; Deveci, H.; Süngün, H. Utilization of flotation wastes of copper slag as raw material in cement production. J. Hazard. Mater. 2008, 159, 390–395. [Google Scholar] [CrossRef]
  26. Heo, J.H.; Chung, Y.; Park, J.H. Recovery of iron and removal of hazardous elements from waste copper slag via a novel aluminothermic smelting reduction (ASR) process. J. Clean. Prod. 2016, 137, 777–787. [Google Scholar] [CrossRef]
  27. Messler, R. Aluminothermic Welding. In Principles of Welding: Processes, Physics, Chemistry, and Metallurgy, 1st ed.; John Wiley & Sons: Hoboken, NJ, USA, 1999. [Google Scholar]
  28. Vanderbruggen, A.; Sygusch, J.; Rudolph, M.; Serna-Guerrero, R. A contribution to understanding the flotation behavior of lithium metal oxides and spheroidized graphite for lithium-ion battery recycling. Colloids Surf. A Physicochem. Eng. Asp. 2021, 626, 127111. [Google Scholar] [CrossRef]
  29. Nuorivaara, T.; Serna-Guerrero, R. Amphiphilic cellulose and surfactant mixtures as green frothers in mineral flotation. 1. Characterization of interfacial and foam stabilization properties. Colloids Surf. A Physicochem. Eng. Asp. 2020, 604, 125297. [Google Scholar] [CrossRef]
  30. Nuorivaara, T.; Serna-Guerrero, R. Unlocking the potential of sustainable chemicals in mineral processing: Improving sphal-erite flotation using amphiphilic cellulose and frother mixtures. J. Clean. Prod. 2020, 261, 121143. [Google Scholar] [CrossRef]
  31. Wills, B.A.; Finch, J. Wills’ Mineral Processing Technology: An Introduction to the Practical Aspects of Ore Treatment and Mineral Recovery, 8th ed.; Butterworth-Heinemann: Oxford, UK, 2015; pp. 1–27. [Google Scholar]
  32. Dańczak, A.; Klemettinen, L.; O’Brien, H.; Taskinen, P.; Lindberg, D.; Jokilaakso, A. Slag Chemistry and Behavior of Nickel and Tin in Black Copper Smelting with Alumina and Magnesia-Containing Slags. J. Sustain. Met. 2021, 7, 1–14. [Google Scholar] [CrossRef]
  33. Van Achterberg, E.; Ryan, C.G.; Jackson, S.E.; Griffin, W.L. Data reduction software for LA-ICP-MS: Appendix. In Laser Ablation-ICP-Mass Spectrometry in the Earth Sciences: Principles and Applications; Sylvester, P.J., Ed.; Short Course Series; Mineralogical Association of Canada: Ottawa, ON, Canada, 2001; pp. 239–243. [Google Scholar]
  34. Jochum, K.P.; Weis, U.; Stoll, B.; Kuzmin, D.; Yang, Q.; Raczek, I.; Jacob, D.E.; Stracke, A.; Birbaum, K.; Frick, D.A.; et al. Determination of Reference Values for NIST SRM 610-617 Glasses Following ISO Guidelines. Geostand. Geoanal. Res. 2011, 35, 397–429. [Google Scholar] [CrossRef]
  35. Vanderbruggen, A.; Gugala, E.; Blannin, R.; Bachmann, K.; Serna-Guerrero, R.; Rudolph, M. Automated mineralogy as a novel approach for the compositional and textural characterization of spent lithium-ion batteries. Miner. Eng. 2021, 169, 106924. [Google Scholar] [CrossRef]
  36. Vignes, A. Extractive Metallurgy 2: Metallurgical Reaction Processes, 1st ed.; John Wiley & Sons: Hoboken, NJ, USA, 2013; ISBN 9781848212879. [Google Scholar]
  37. Avarmaa, K.; Järvenpää, M.; Klemettinen, L.; Marjakoski, M.; Taskinen, P.; Lindberg, D.; Jokilaakso, A. Battery Scrap and Biochar Utilization for Improved Metal Recoveries in Nickel Slag Cleaning Conditions. Batteries 2020, 6, 58. [Google Scholar] [CrossRef]
Figure 1. Flowchart of the combined waste LIB enrichment and refining processes investigated in the present and previous studies [21,22].
Metals 12 00015 g001
Figure 2. Experimental setup of the flotation experiments.
Metals 12 00015 g002
Figure 3. Typical microstructure of the metal alloy (A) with three different areas visible. (B,C) show the same image with the adjusted thresholds by ImageJ software. (B): image used for measuring the area percentage of white and gray phase together; (C): image used for measuring the area percentage of the white phase.
Metals 12 00015 g003
Figure 4. Grade–recovery curves for specific elements in the flotation experiments. (A) Co in the MIBC experiments. (B) Ni in the MIBC experiments. (C) Co in the CellFroth experiments. (D) Ni in the CellFroth experiments.
Metals 12 00015 g004
Figure 5. The separation efficiency values for Cu in the (A) MIBC experiments and (B) CellFroth experiments.
Metals 12 00015 g005
Figure 6. Frequency distribution and cumulative distribution of the sieved LIB waste used as flotation feed.
Metals 12 00015 g006
Figure 7. (A) The frequency distributions of the ground flotation underflow. (B) The cumulative distributions of the ground flotation underflow.
Metals 12 00015 g007
Figure 8. EDS-mapping of spent battery flotation underflow, (A,G) overview, (B,H) oxygen, (C,I) aluminum, (D,J) cobalt, (E) manganese, (K) copper, (F,L) nickel.
Metals 12 00015 g008
Figure 9. Ellingham diagram drawn with HSC Chemistry 9.0.
Metals 12 00015 g009
Figure 10. Concentration of iron (A) and aluminum (B) in the slag as a function of contact time.
Metals 12 00015 g010
Figure 11. Concentration of trace elements Cu (A), Ni (B), Co (C), Li (D) in the slag as a function of contact time.
Metals 12 00015 g011
Figure 12. Concentration of trace elements Zn (A), As (B), Pb (C), Sb (D) in the slag as a function of contact time.
Metals 12 00015 g012
Figure 13. General microstructure of samples. (A) Sample without SB addition after 60 min contact time; (B) Sample with 10 wt.% of SBs added on top of the slag after 60 min contact time.
Metals 12 00015 g013
Figure 14. Matte phase formed in the system (A) without SBs addition; (B) with 10 wt.% of SBs mixed with the slag; (C) 10 wt.% of SBs added on top of the slag.
Metals 12 00015 g014
Figure 15. Concentrations of Fe (A,B) and Cu (C,D) in heavier (A,C) and lighter (B,D) matte phase as a function of contact time.
Metals 12 00015 g015
Figure 16. Concentrations of Co (A,B) and Ni (C,D) in heavier (A,C) and lighter (B,D) matte phase as the function of contact time.
Metals 12 00015 g016
Figure 17. Concentration of Cu, Fe, Co, and Ni in metal alloy in the samples with different starting compositions ((A) 10 wt.% SBs mixed with slag; (B) 10 wt.% SBs on top of the slag; (C) 20 wt.% SBs on top of the slag).
Metals 12 00015 g017
Table 1. The experimental parameters in the flotation campaign. Constant parameters include an aeration rate of 2 L/min and grinding time of 20 min, and black mass particle size of >500 µm.
ExperimentFrotherCollector
CF1CellFroth 30 ppmno collector
CF2CellFroth 30 ppmkerosene 150 g/t
CF3CellFroth 30 ppmkerosene 300 g/t
CF4HPMC 30 ppmNo collector
MIBC1MIBC 8 ppmkerosene 150 g/t
MIBC2MIBC 8 ppmkerosene 150 g/t
MIBC3MIBC 8 ppmkerosene 150 g/t
MIBC4MIBC 8 ppmkerosene 150 g/t
Table 2. Chemical composition of industrial Cu-slag used in this study.
Componentwt.%
Na0.416
Mg1.19
Al2.14
K0.893
Ca0.805
Cr0.034
Fe 138.3
Co0.062
Ni0.048
Cu1.19
Zn1.78
As0.19
Sb0.10
Pb0.309
S0.47
SiO233
Fe3O411.7
1 total iron concentration (as magnetite and in other oxidic forms).
Table 3. LA-ICP-MS standards and obtained detection limits for the isotopes used in this work.
CuCoLiNiMnPbSnZnSAsSb
External standard for slagNIST610 [34]
Internal standard for slag29Si
Detection limit for slag (ppmw) for the isotope used65Cu: 0.01859Co: 0.0177Li: 0.04360Ni: 0.07155Mn: 0.020208Pb: 0.002120Sn: 0.02567Zn: 0.22834S: 3.44075As: 0.081121Sb: 0.007
Table 4. The experiment-specific head grades for Co, Ni, Mn, and Cu, and the average head grade of graphite in the froth flotation experiments.
CF1CF2CF3CF4MIBC1MIBC2MIBC3MIBC4
Co (wt.%)18.719.119.520.319.218.021.618.7
Ni (wt.%)2.12.22.22.32.22.12.52.2
Mn (wt.%)2.02.02.02.12.01.92.21.9
Cu (wt.%)26.426.123.521.727.422.018.123.4
Graphite (average) (wt.%)19.85
Table 5. The chemical composition of froth flotation underflow.
ElementAlCoCuFeLiMnNiPGraphite
wt.%16.117.722.453.012.161.682.530.090.58
Table 6. Chemical composition of the starting mixtures utilized in pyrometallurgical experiments.
ElementMixture 1Mixture 2Mixture 3
Cu-slag + 0 wt.% SBsCu-slag + 10 wt.% SBsCu-slag + 20 wt.% SBs
Al as Al2O32.141.931.71
Al metallic-1.613.22
As0.190.170.15
C 1-0.0580.116
Ca0.8050.720.64
Co0.0621.833.59
Cu1.192.845.44
Fe38.334.831.2
K0.890.800.71
Li-0.220.43
Mg1.191.070.95
Mn-0.170.34
Ni0.0480.300.54
Pb0.310.280.25
S0.470.420.38
Sb0.10.090.08
Si15.413.912.3
Zn1.781.601.42
1 carbon in the SBs present as graphite.
Publisher’s Note: MDPI stays neutral with regard to jurisdictional claims in published maps and institutional affiliations.

