
Silver Nanoparticles: An Instantaneous Solution for Anticancer Activity against Human Liver (HepG2) and Breast (MCF-7) Cancer Cells


Abstract
:1. Introduction
2. Materials and Methods
2.1. Materials
2.1.1. Reagents and Consumables for the Biological Study
2.1.2. Methods
Synthesis of Silver Nanoparticles (AgNPs)
Material Characterization
2.2. Cell Culture (HepG2, MCF-7 Cells) and Treatment with AgNPs
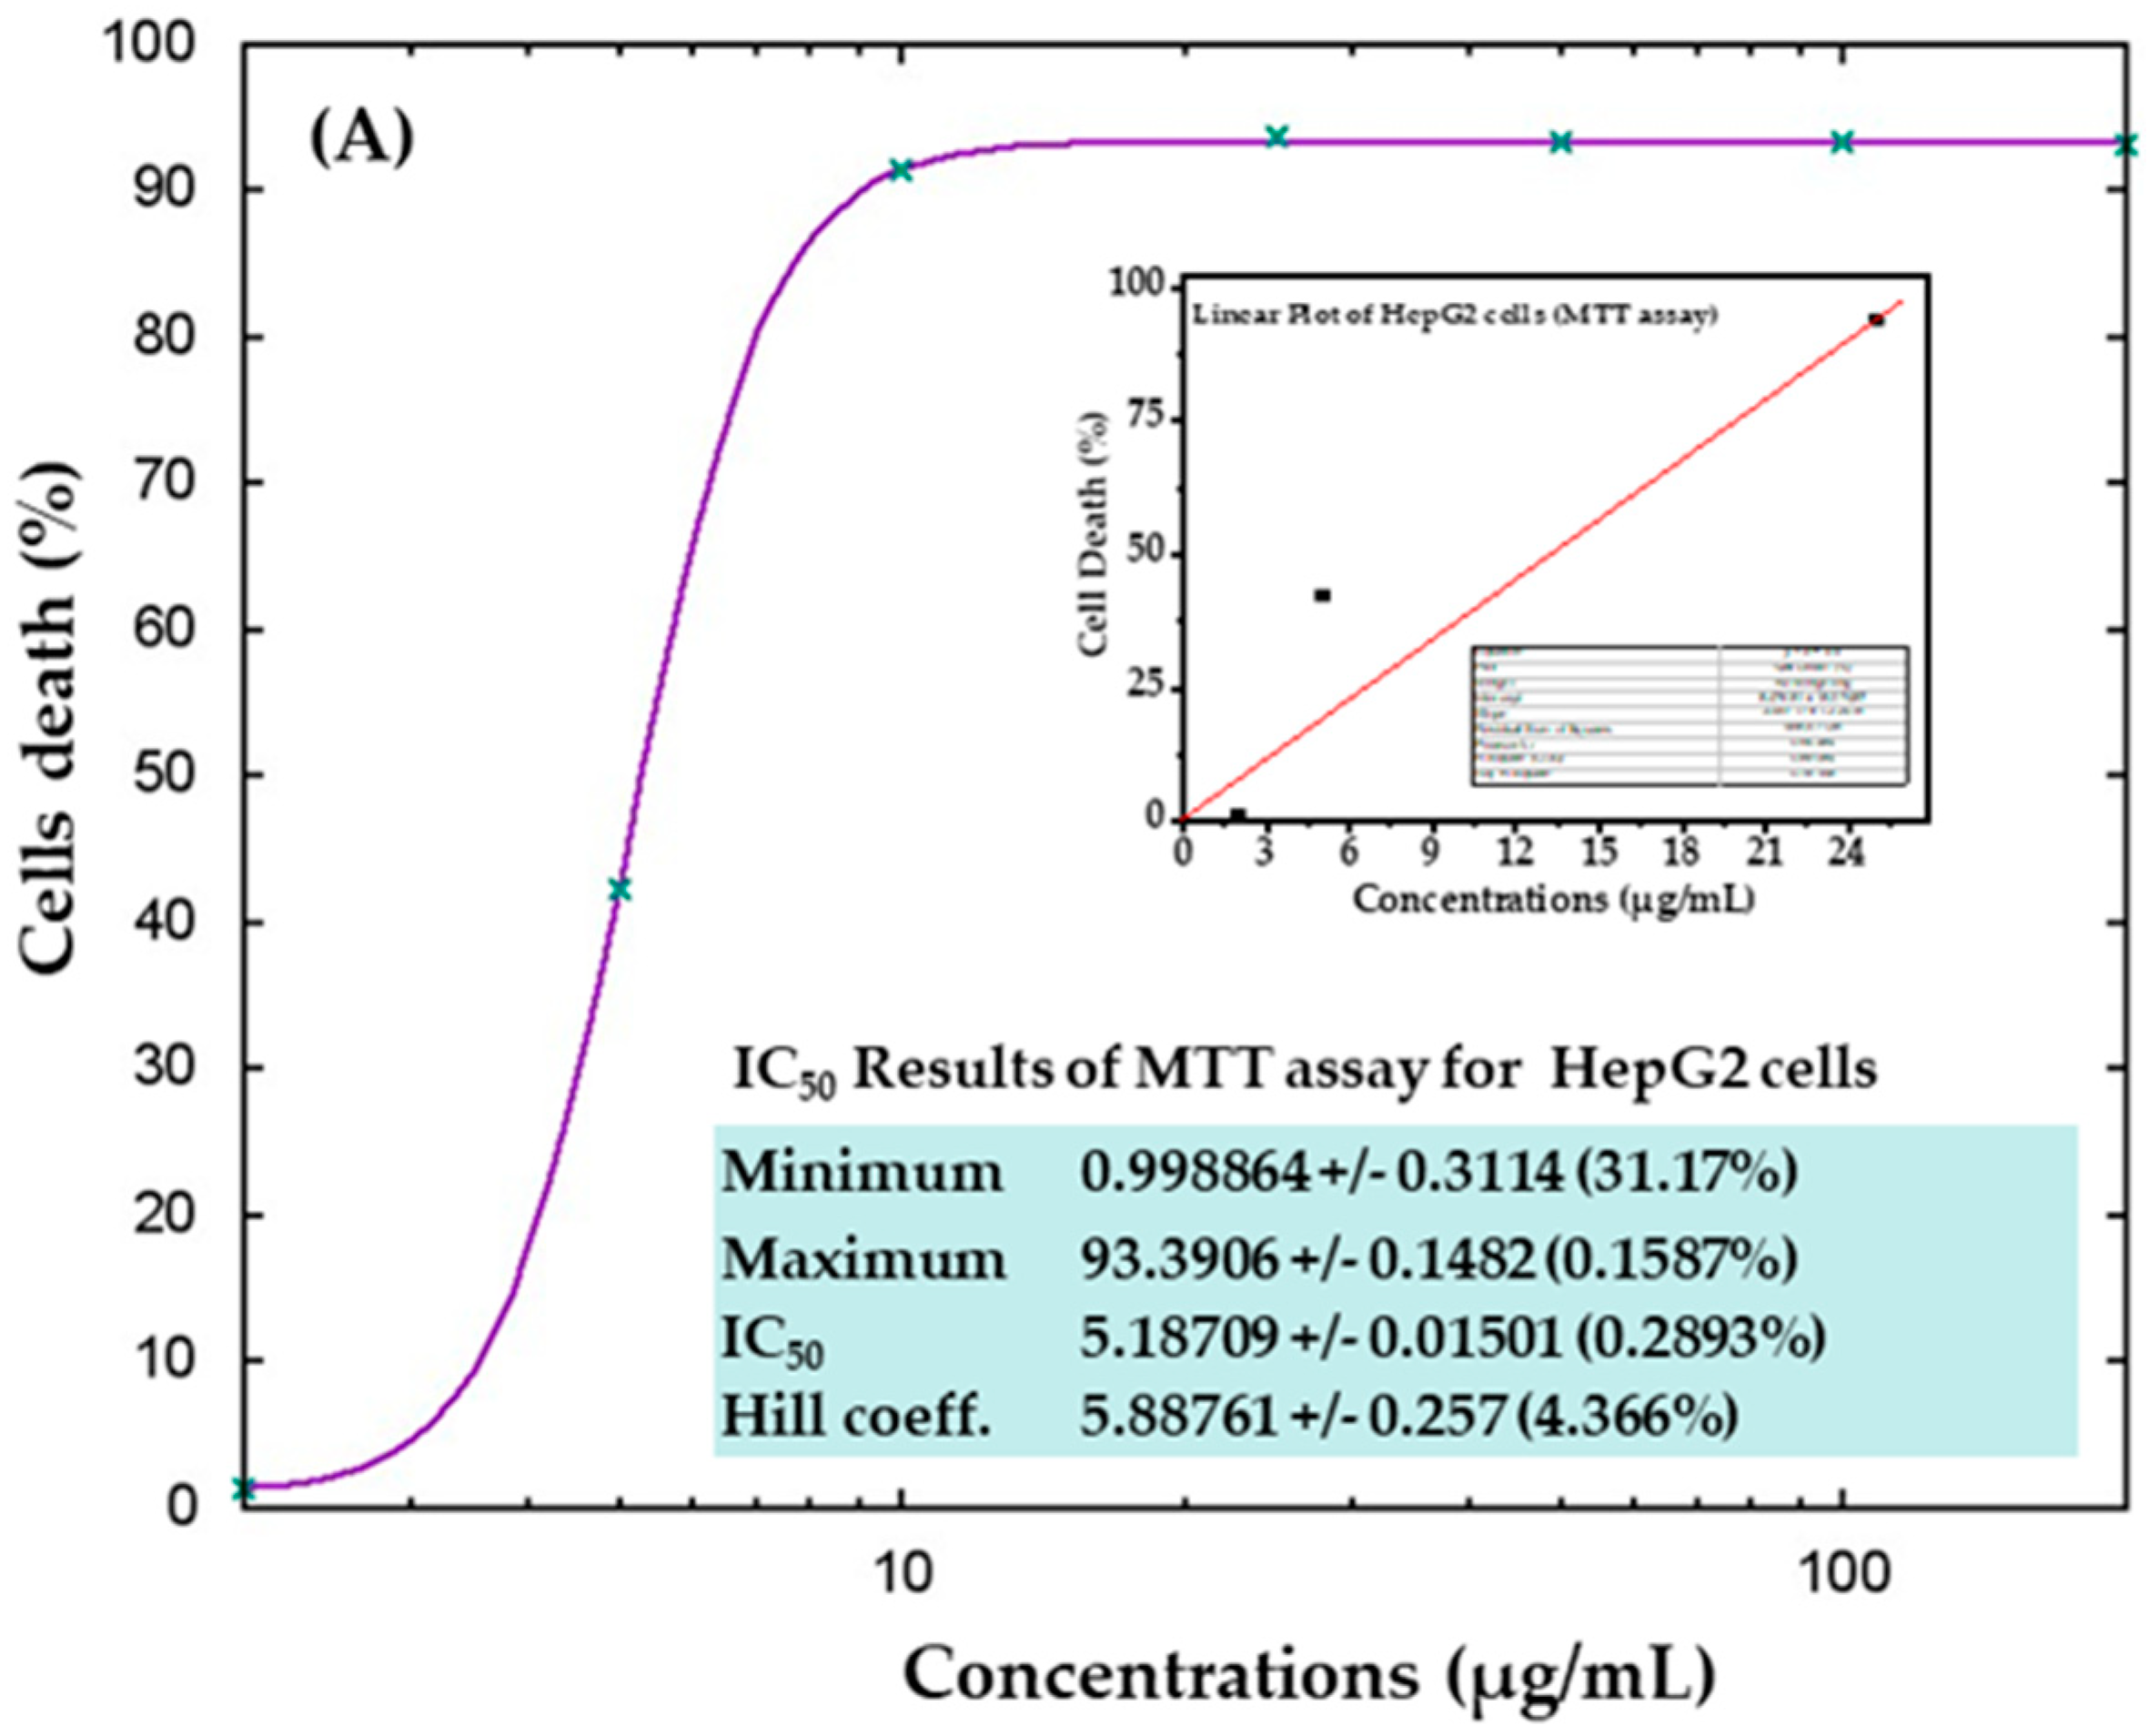
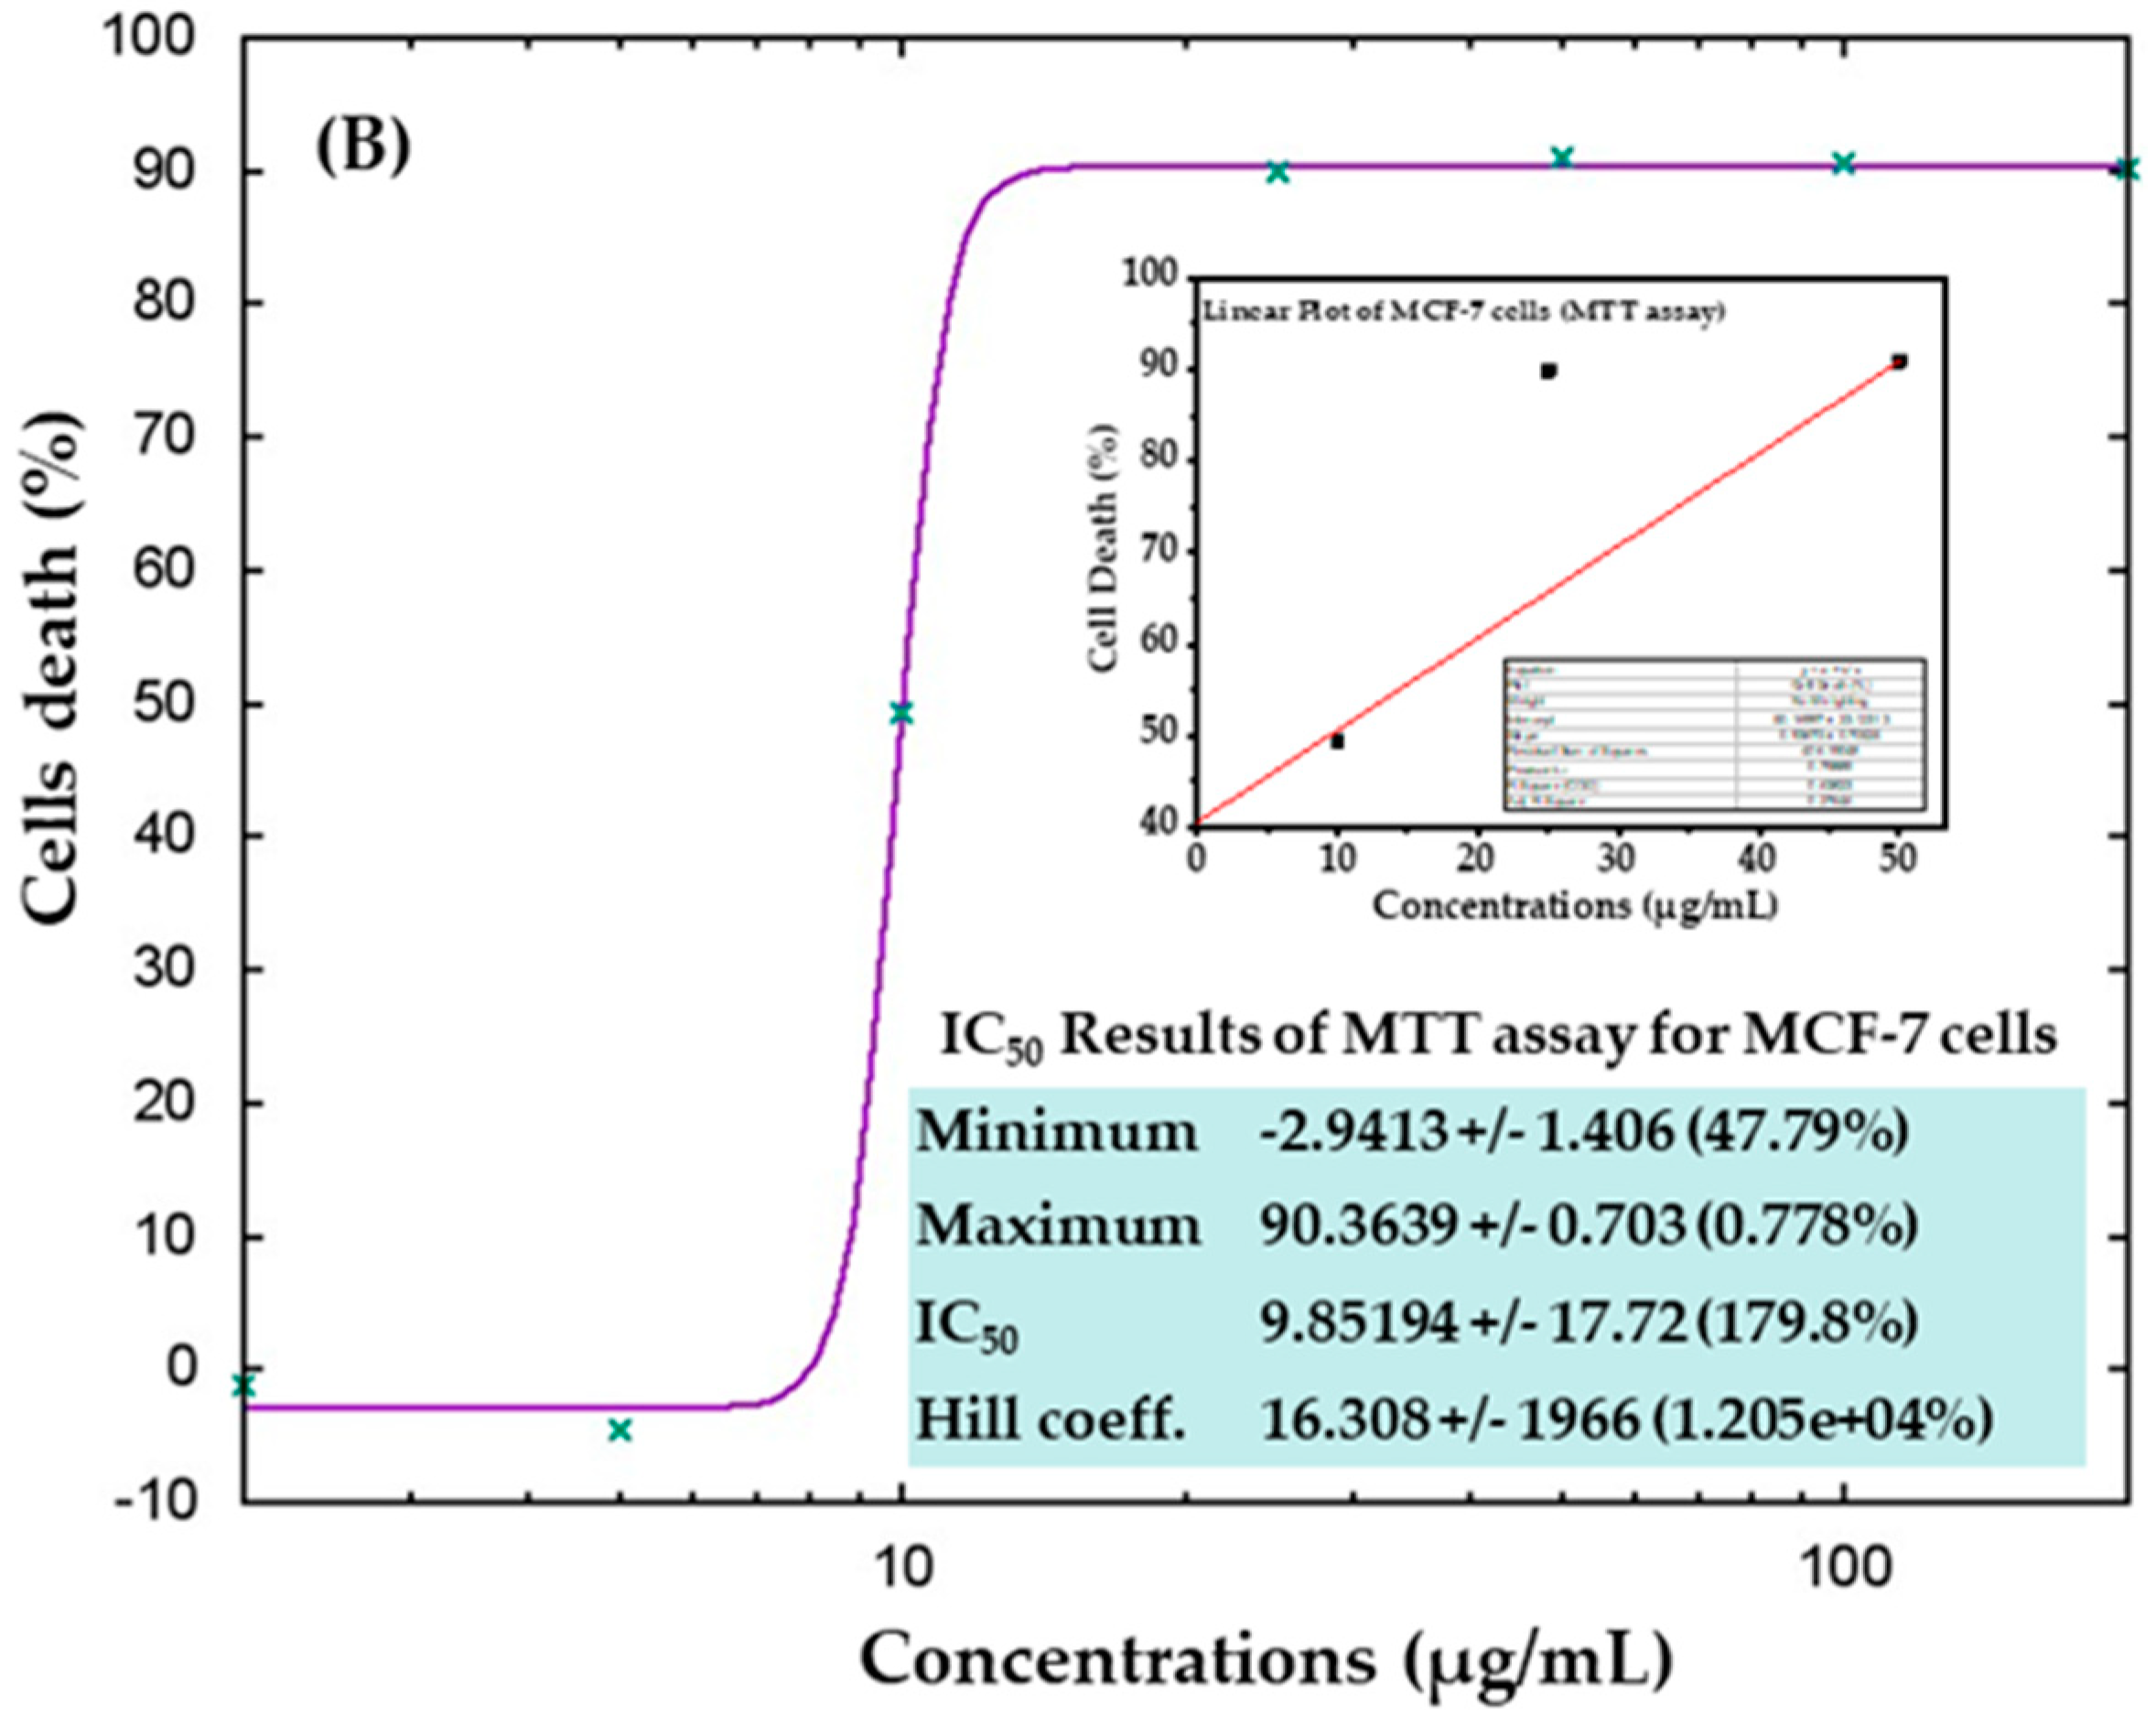
2.3. MTT Assay
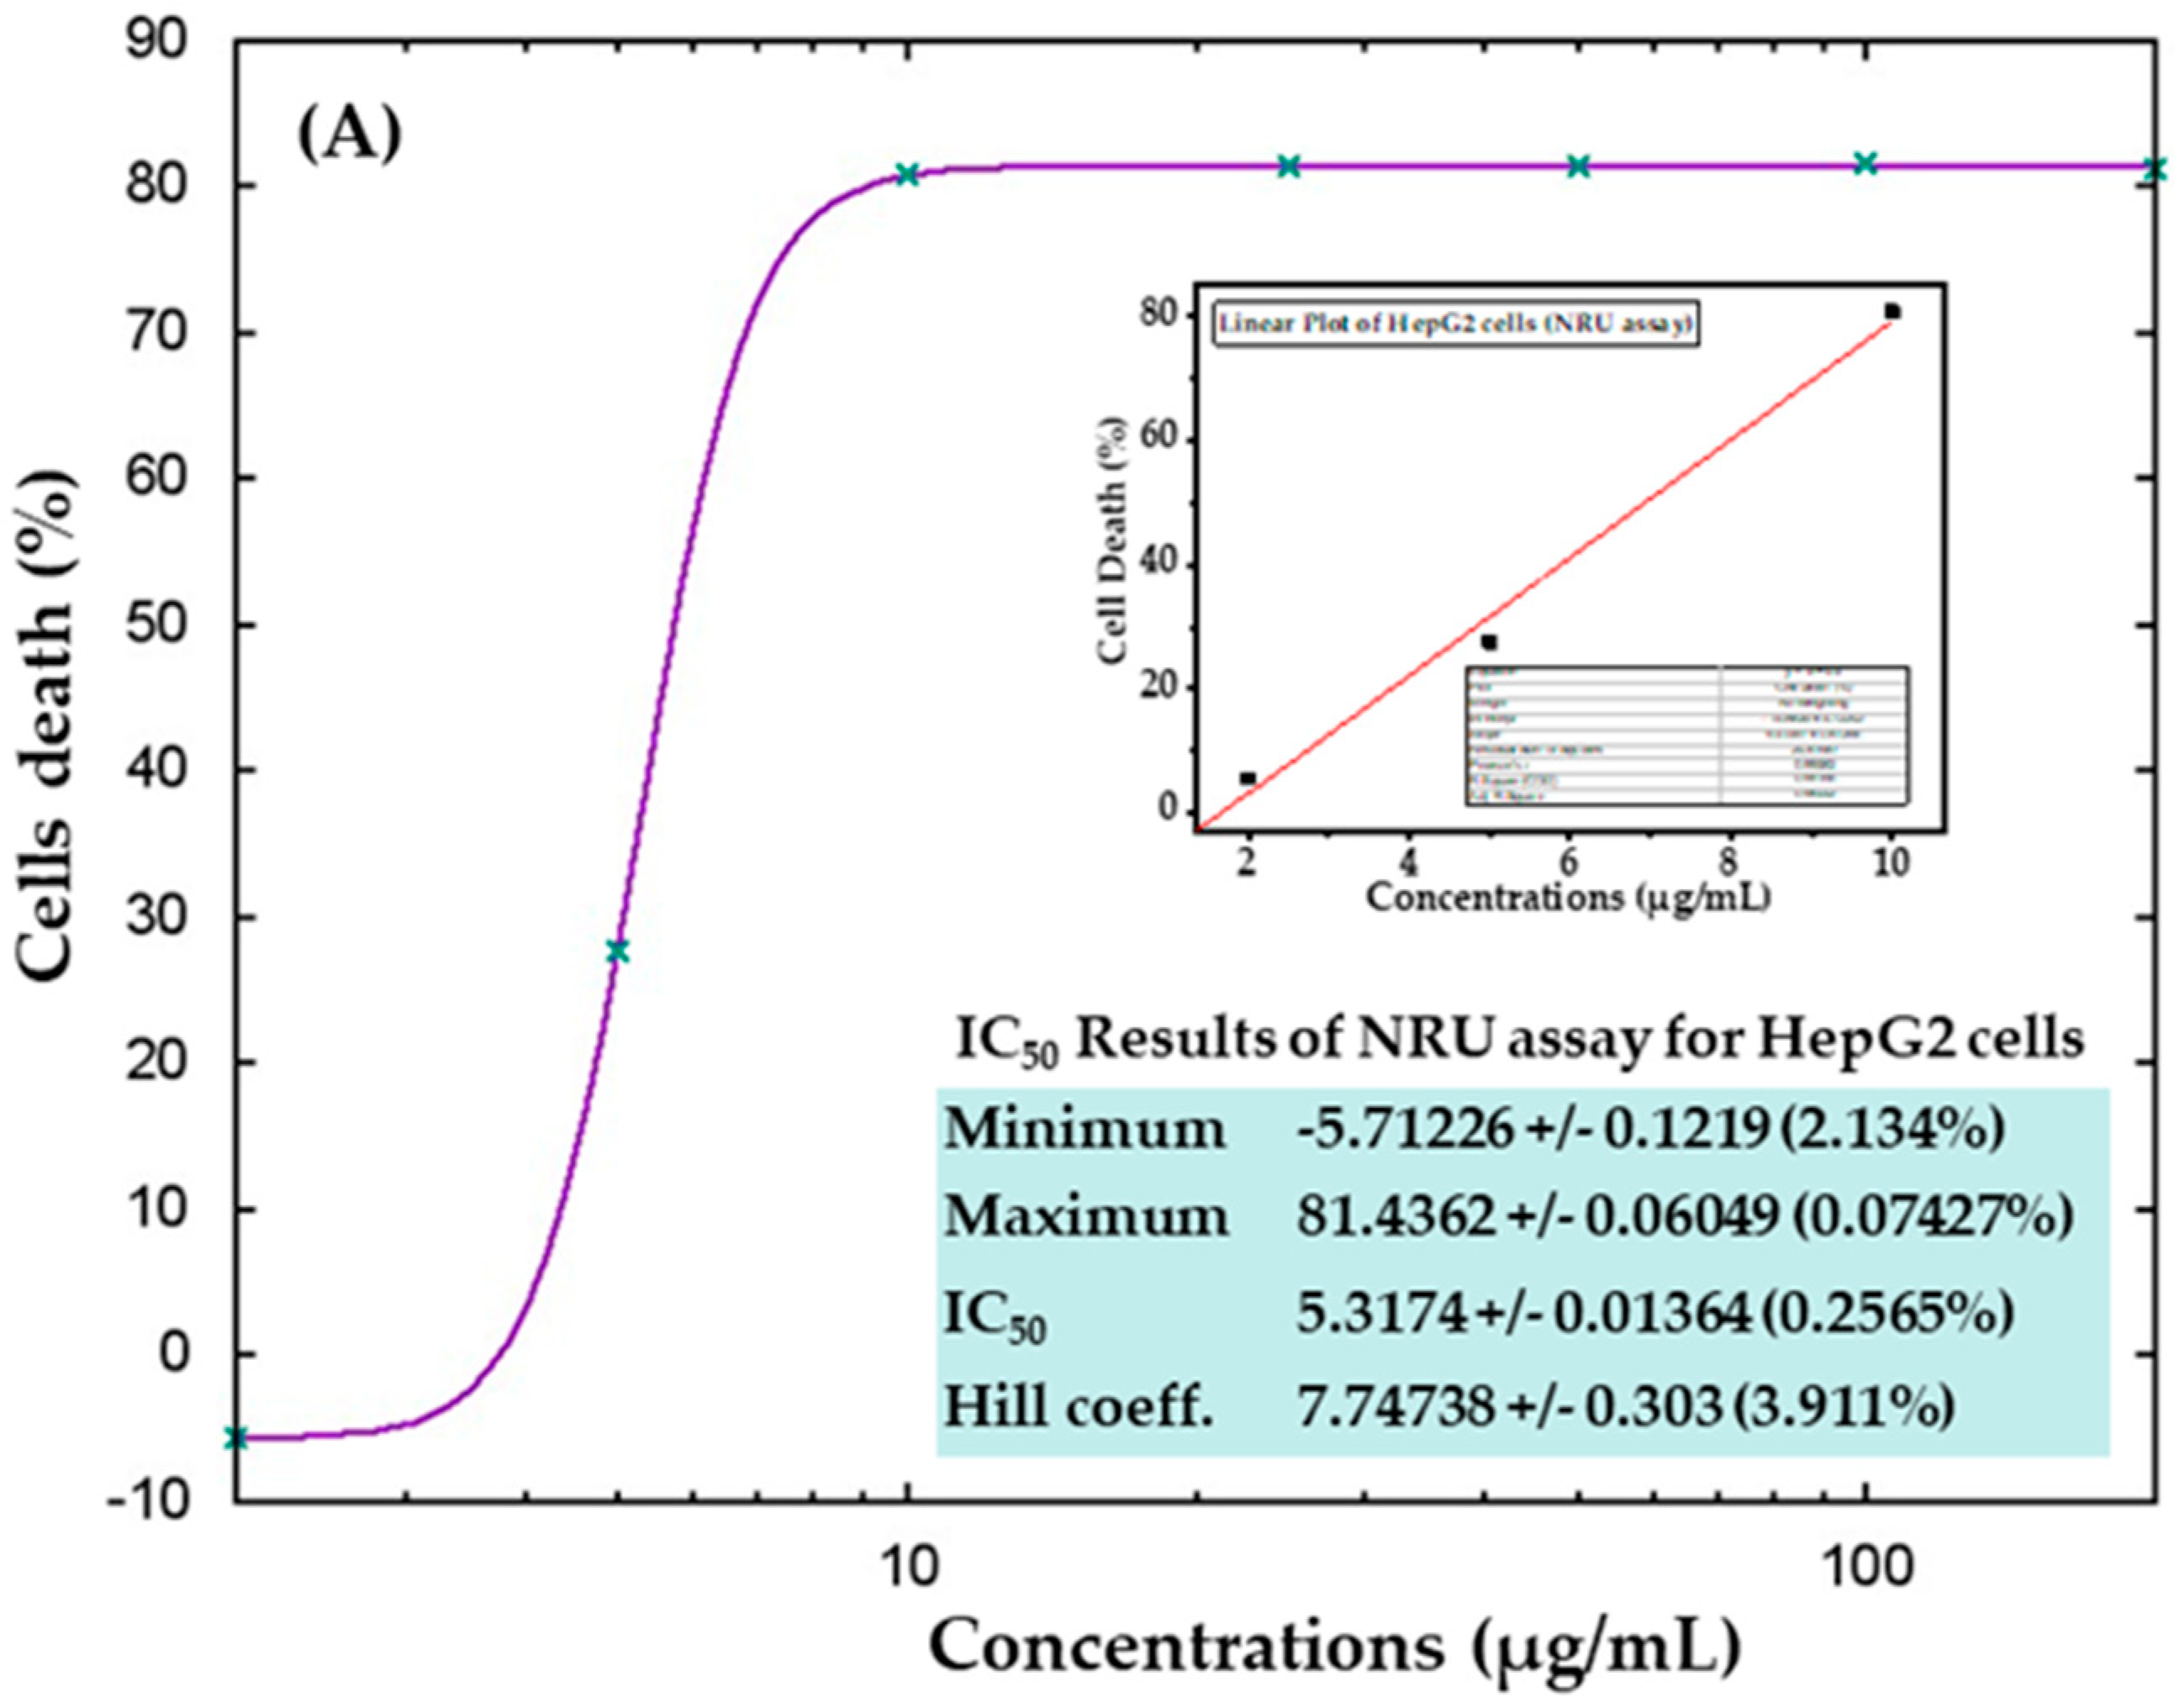
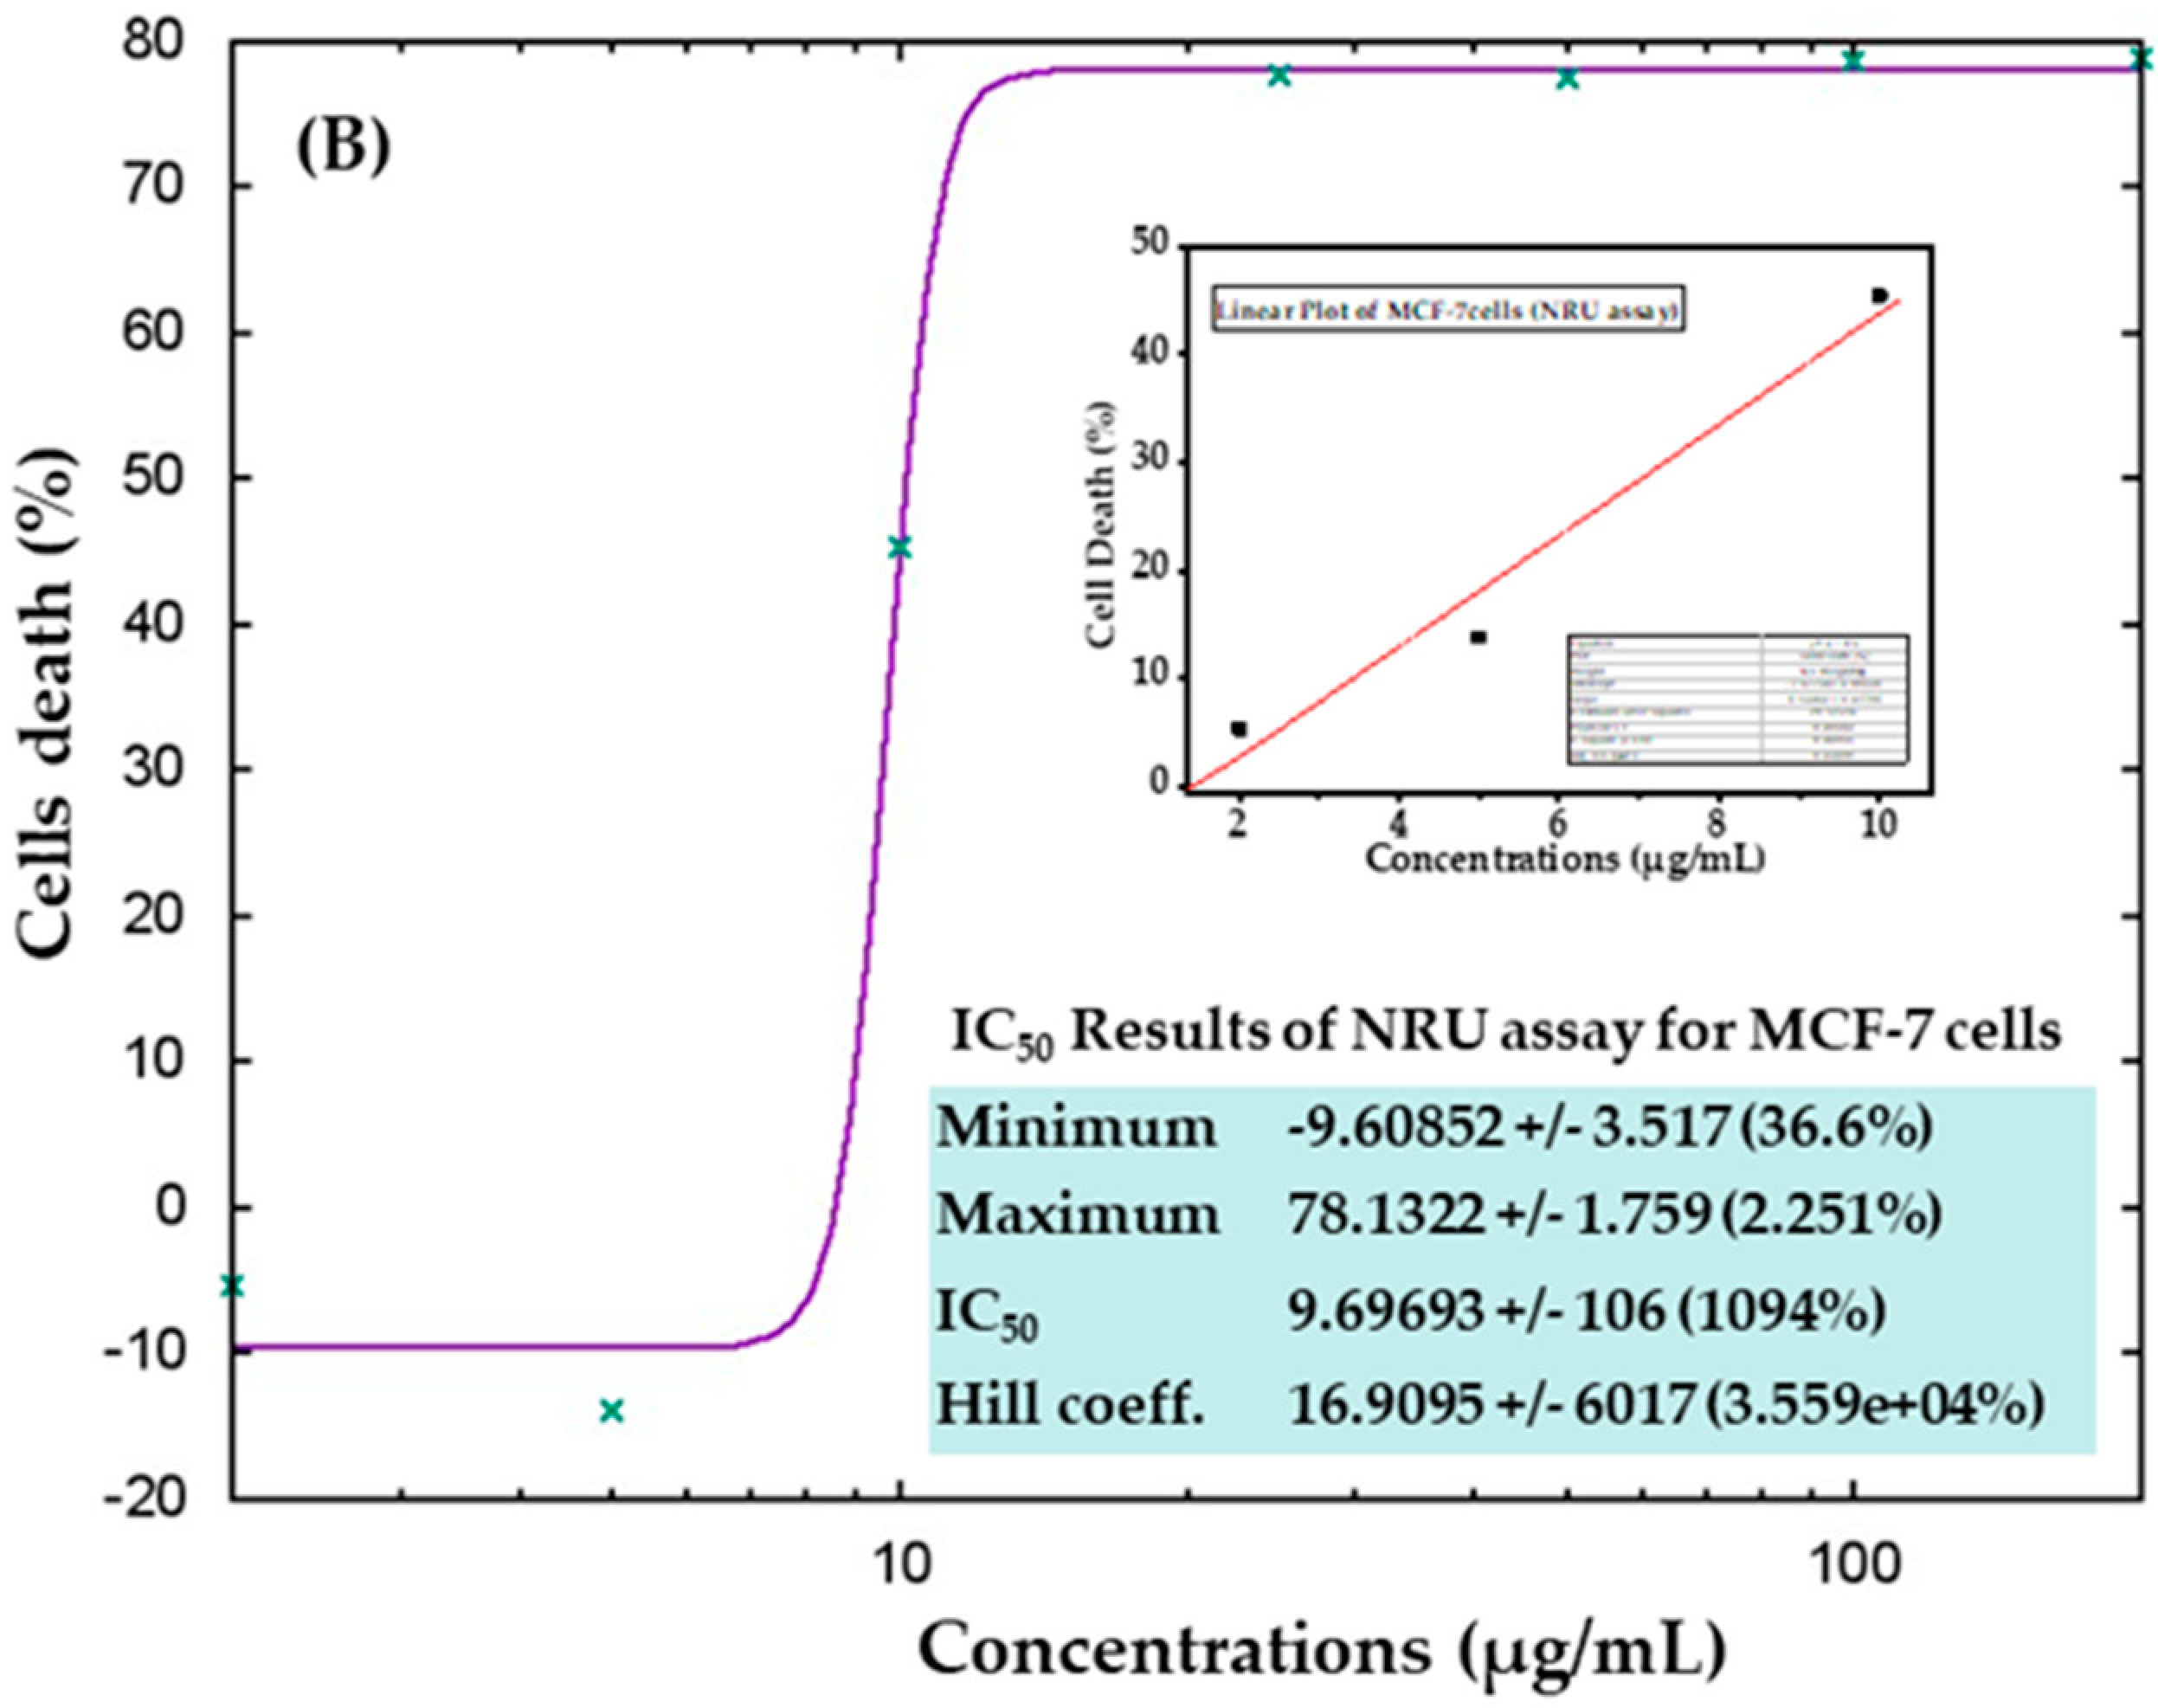
2.4. NRU Assay
2.5. Reactive Oxygen Species (ROS)
2.6. RNA Isolation and Quantitative Polymerase Chain Reaction (qPCR)
2.7. Statistical Analysis
3. Results
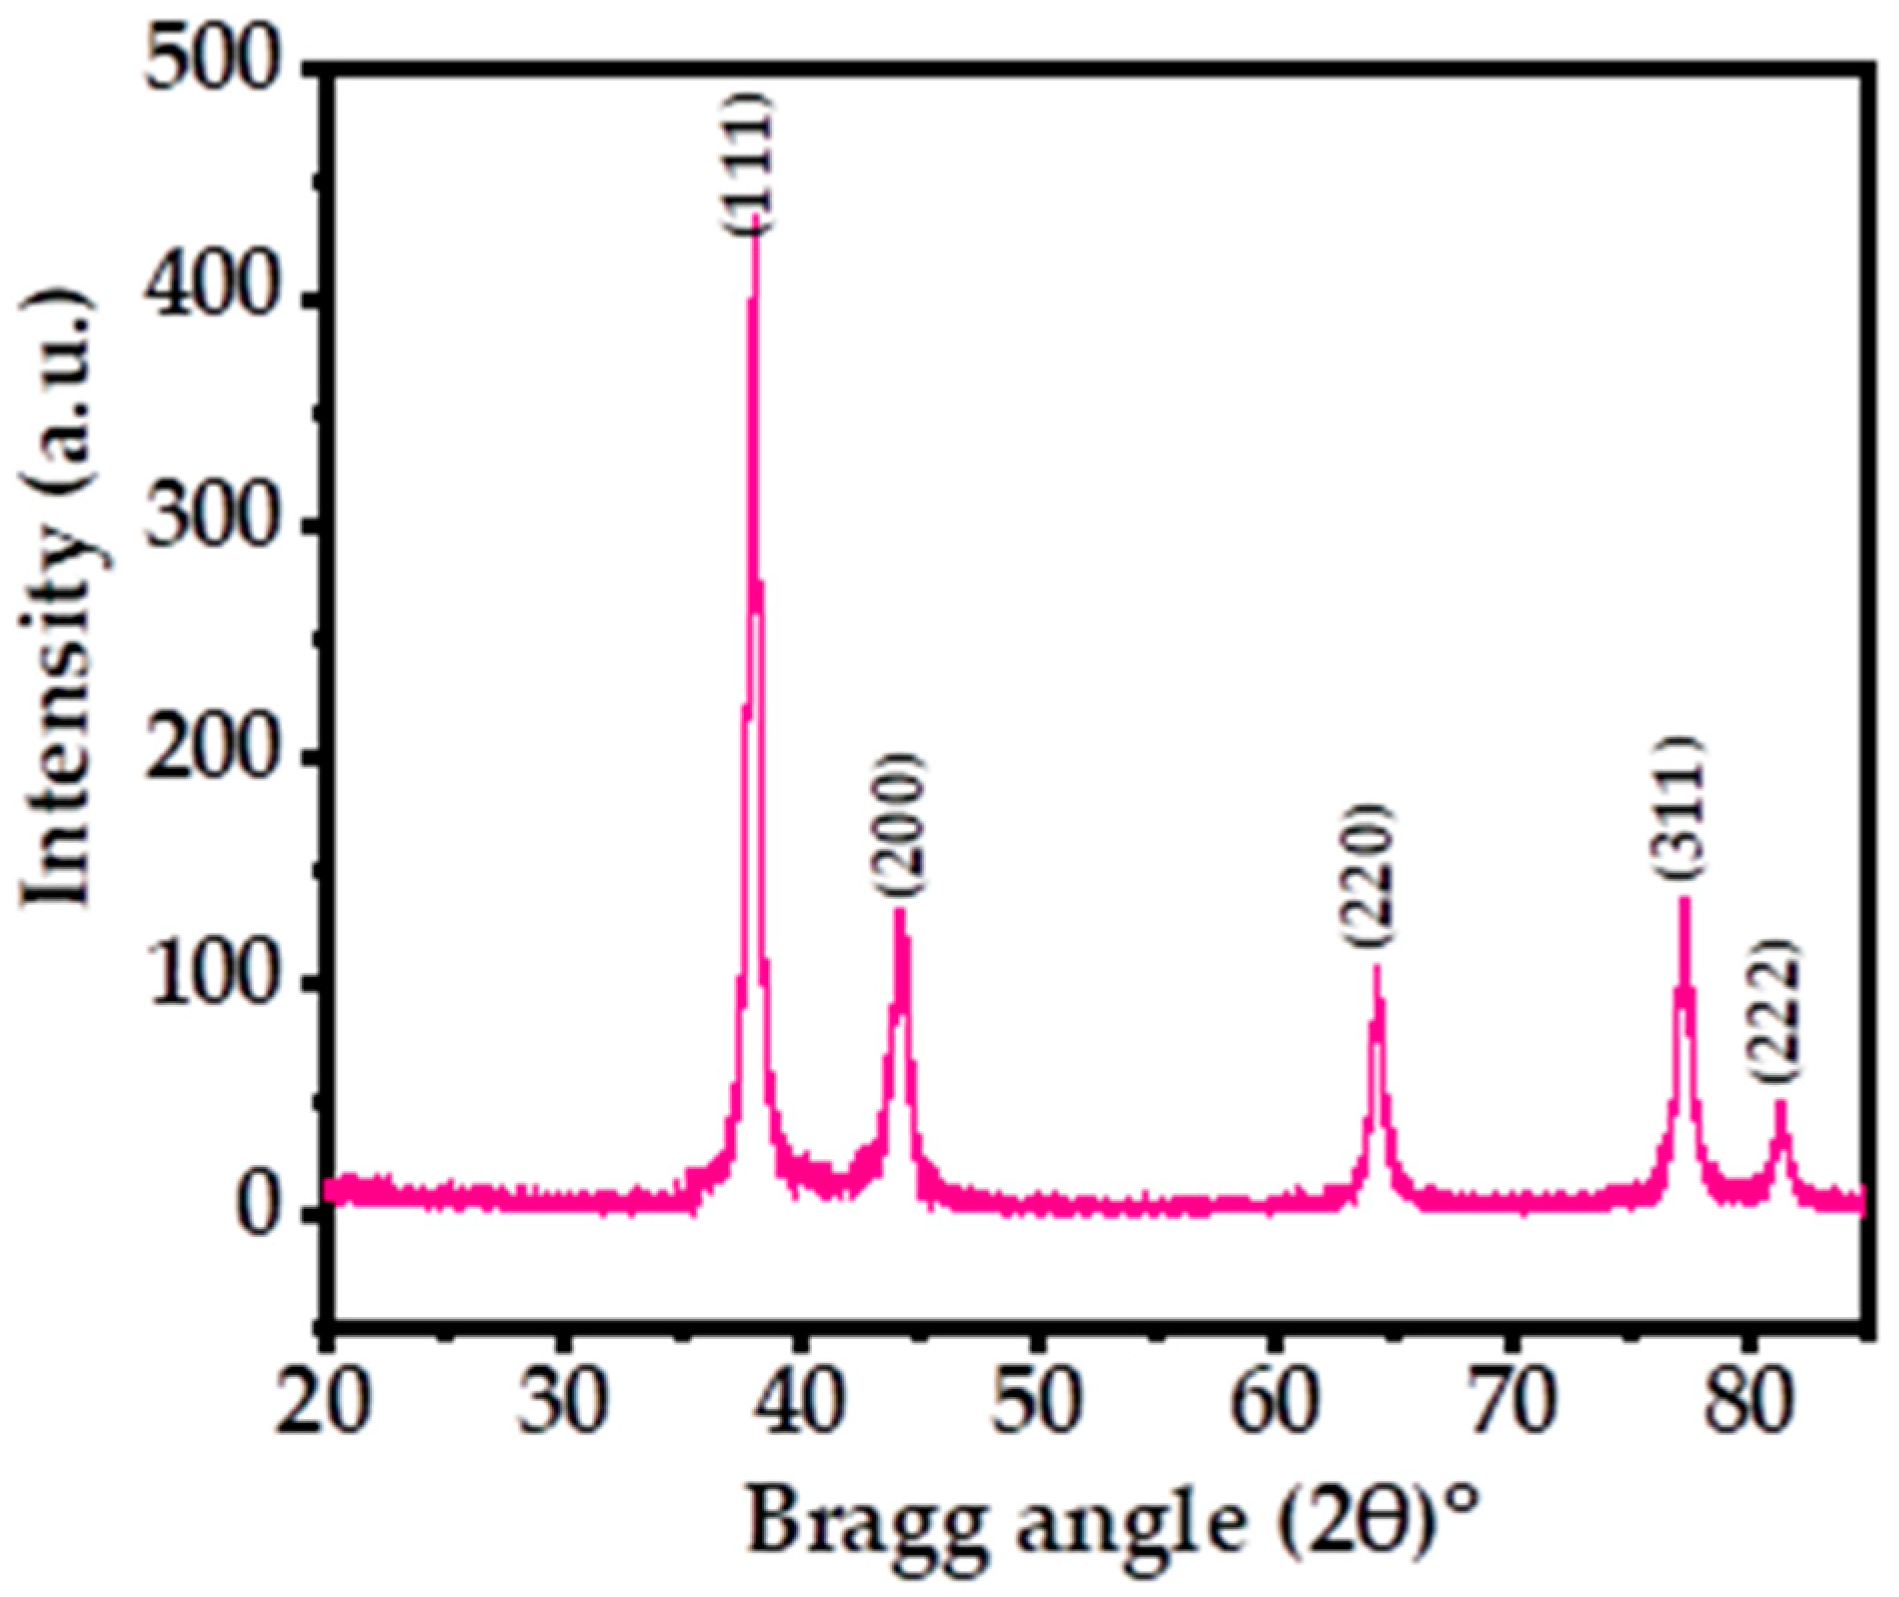
3.1. X-ray Diffraction Pattern (XRD)
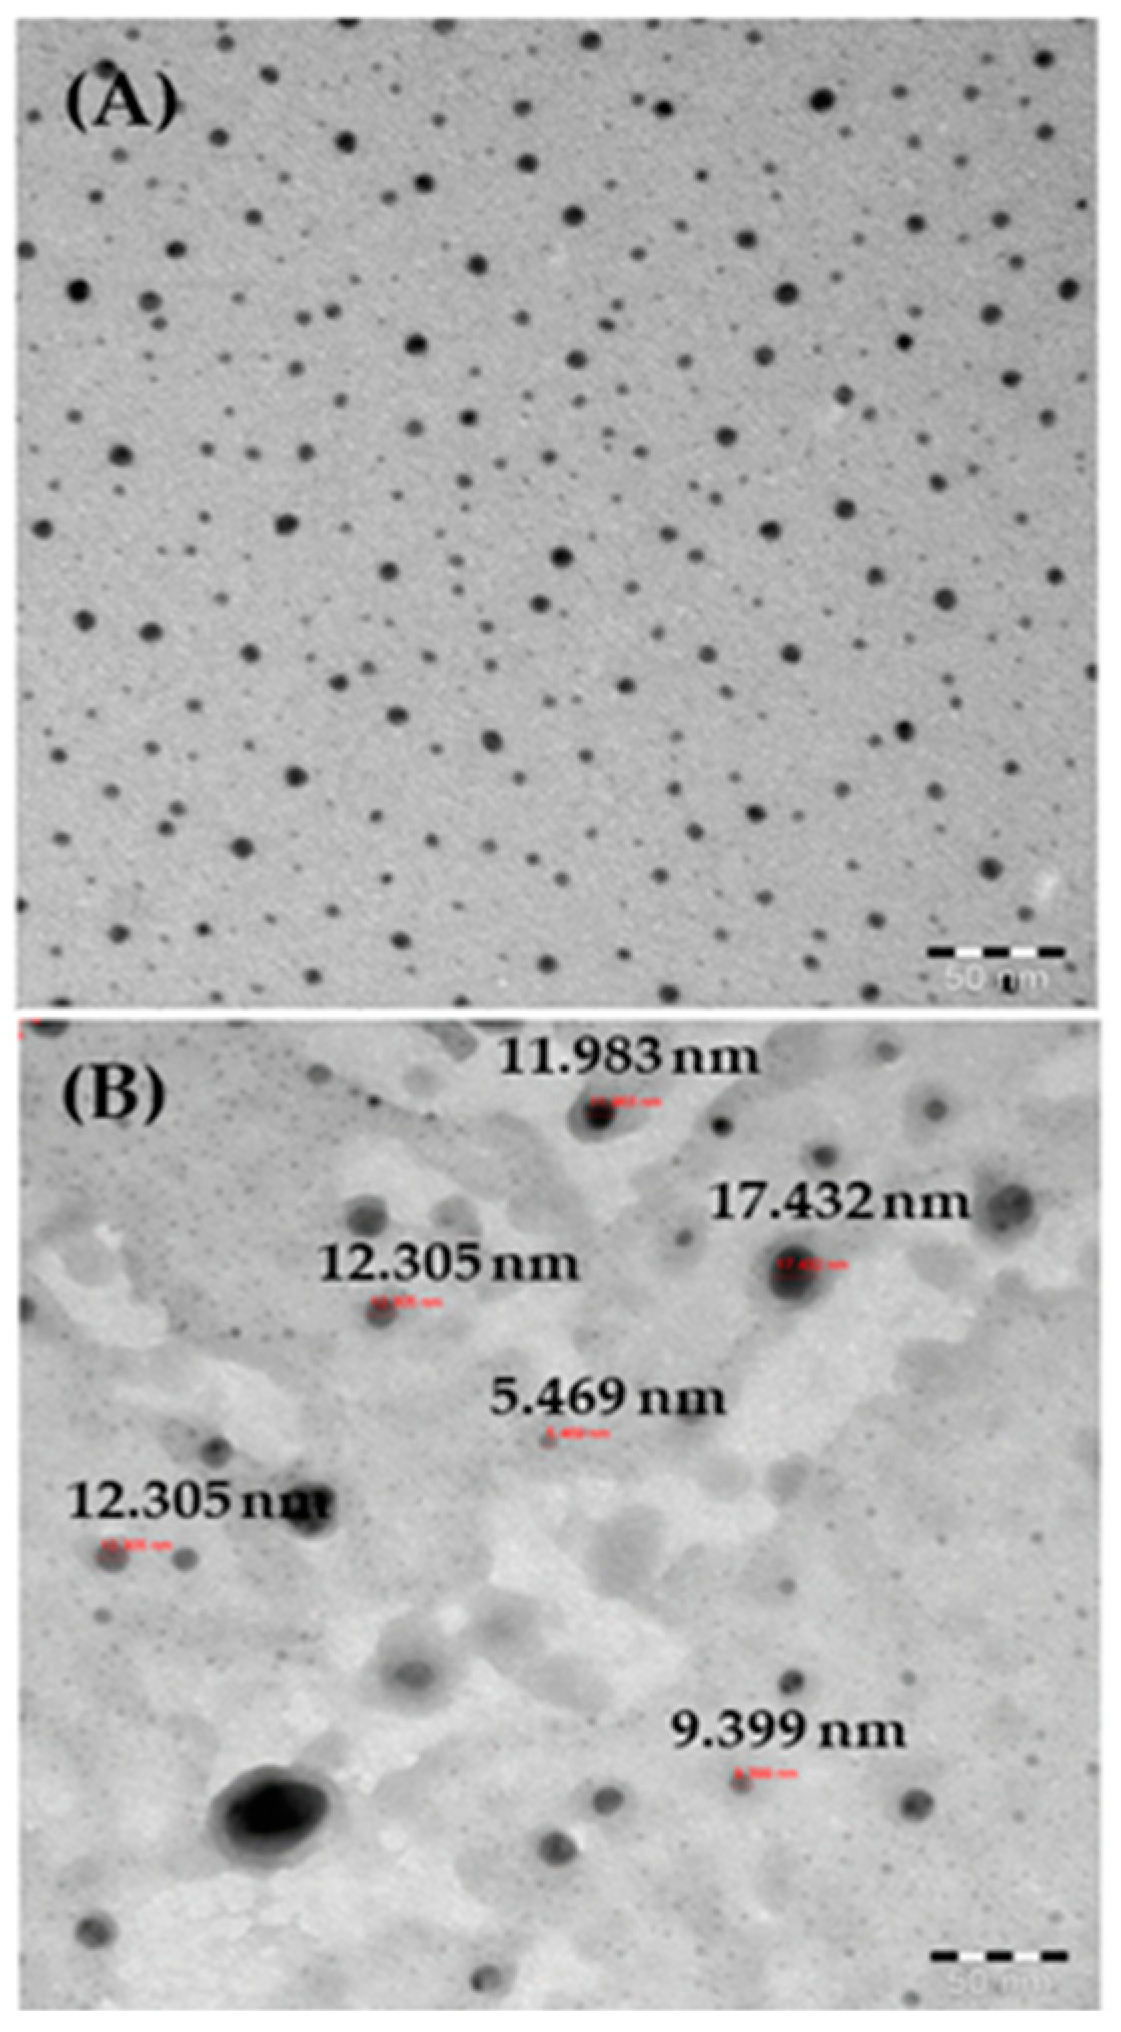
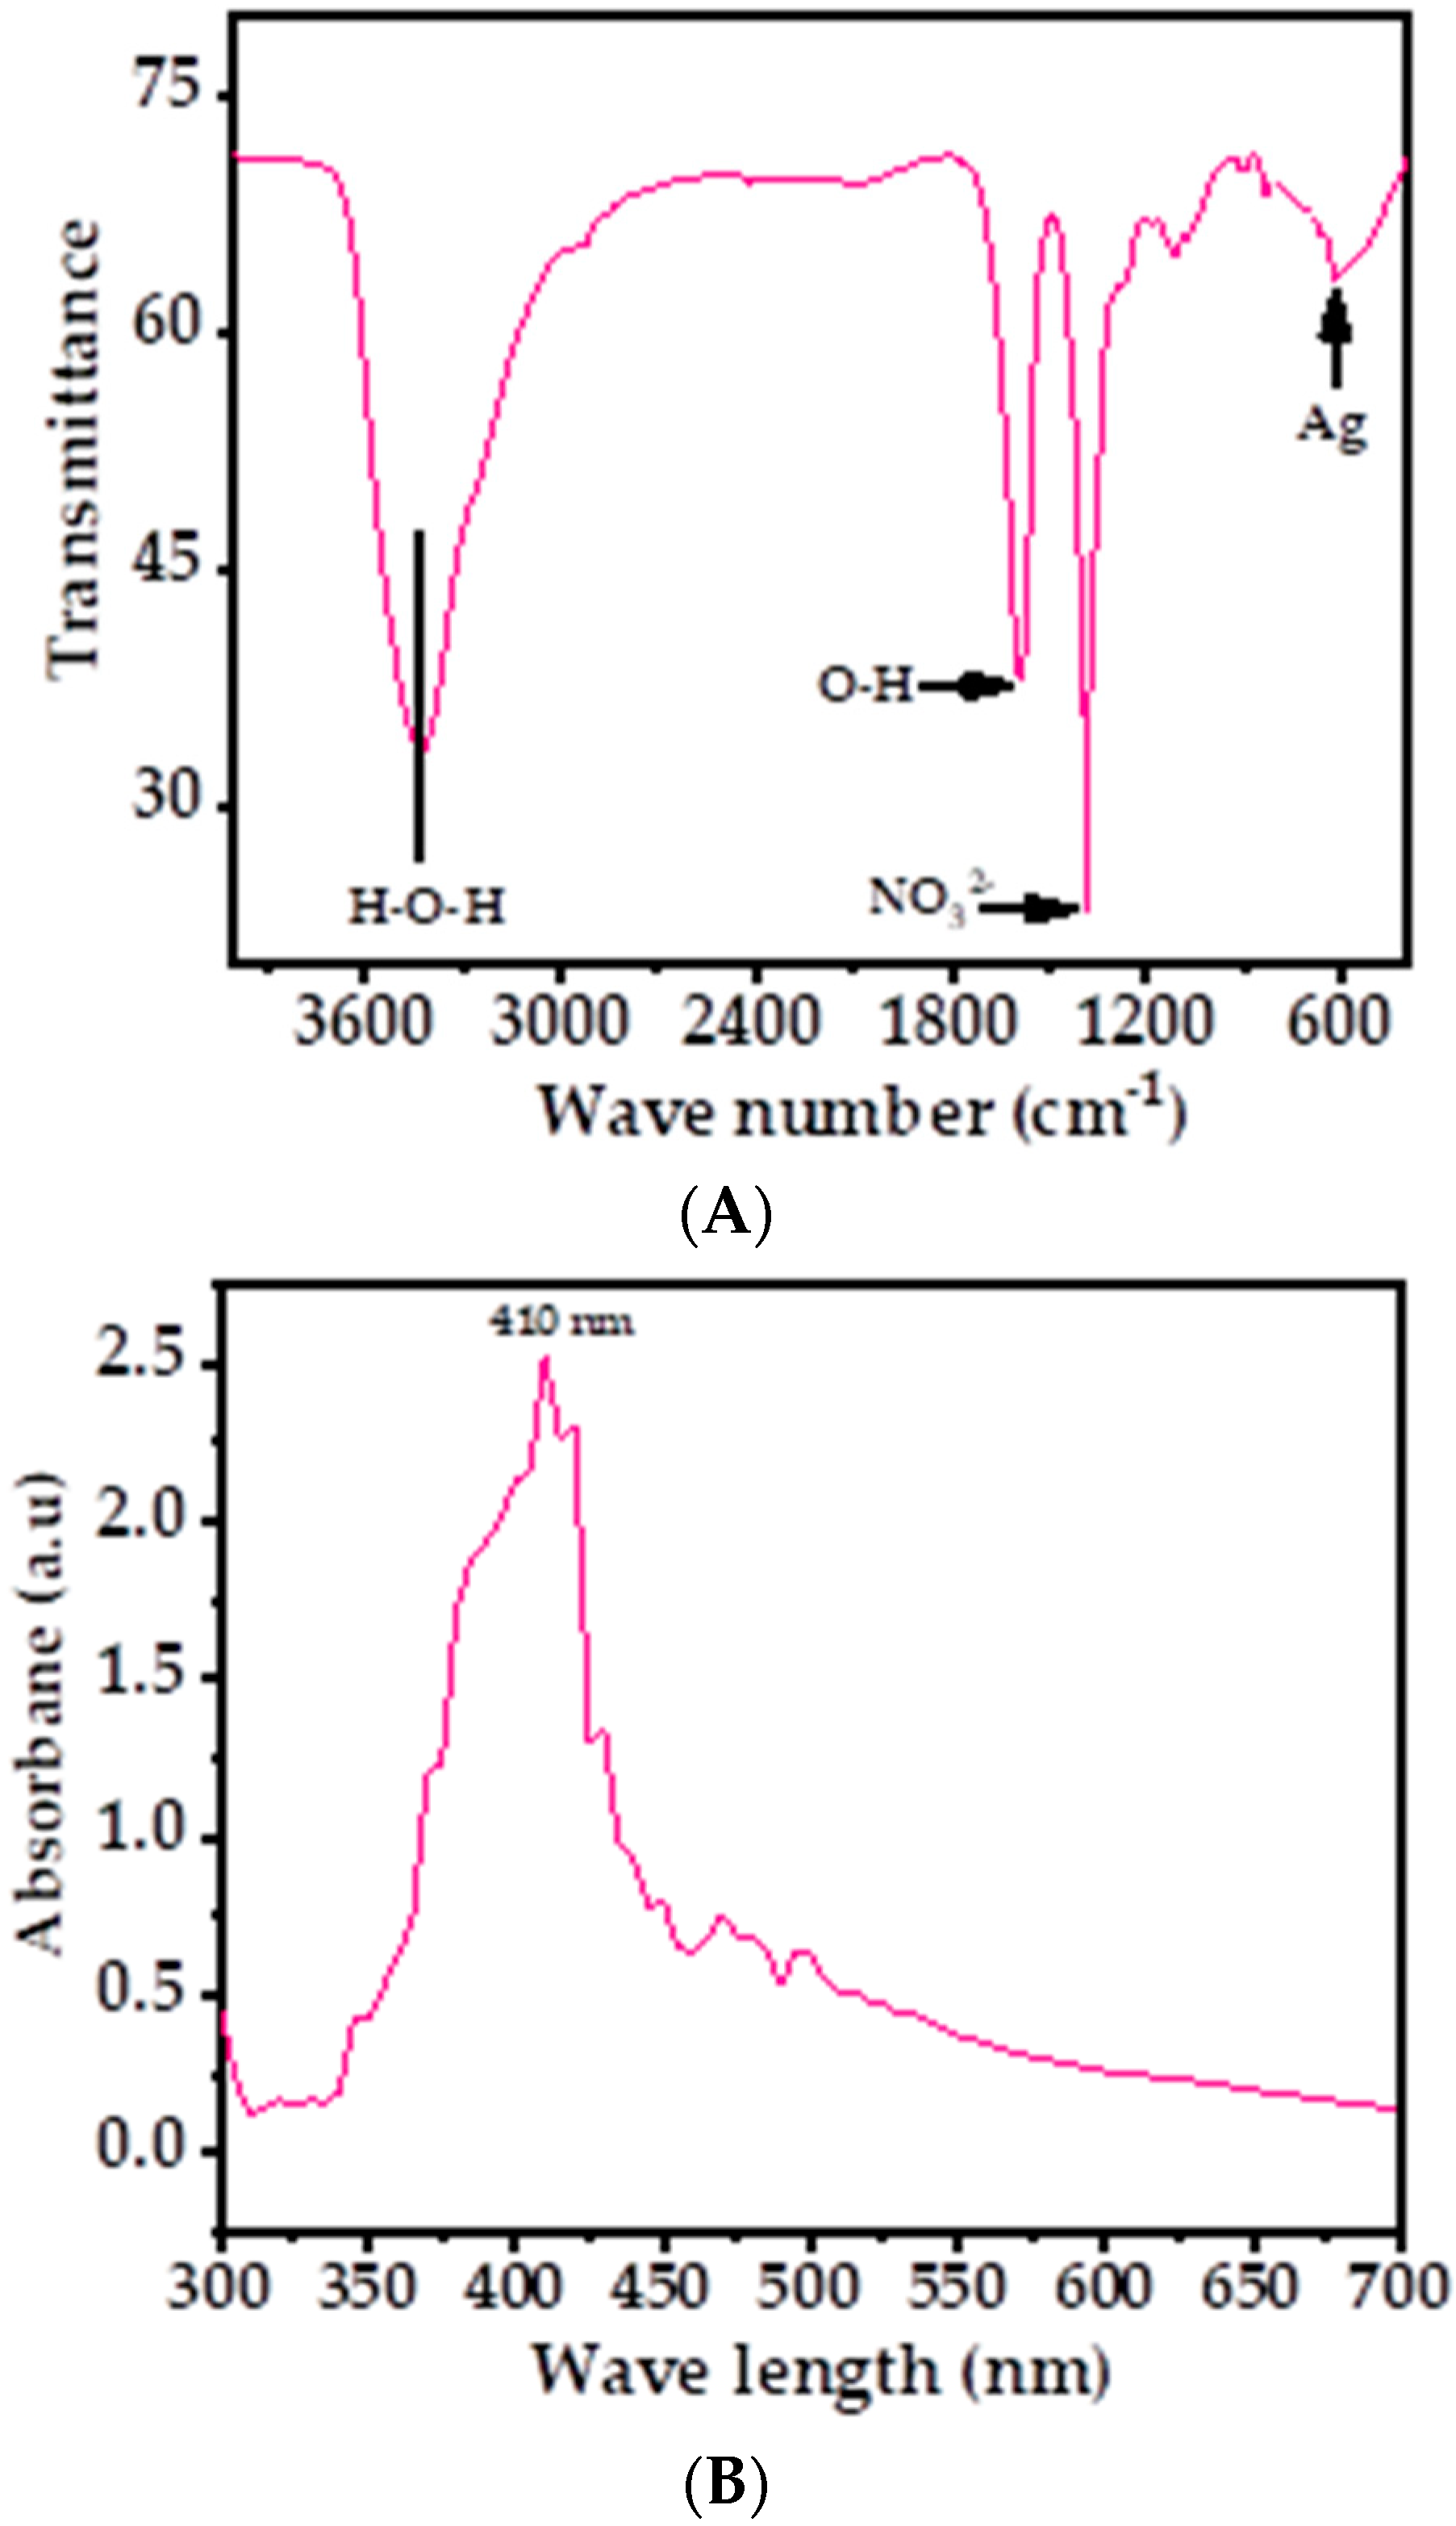
3.2. Morphological, Chemical, and Optical Analysis of AgNPs
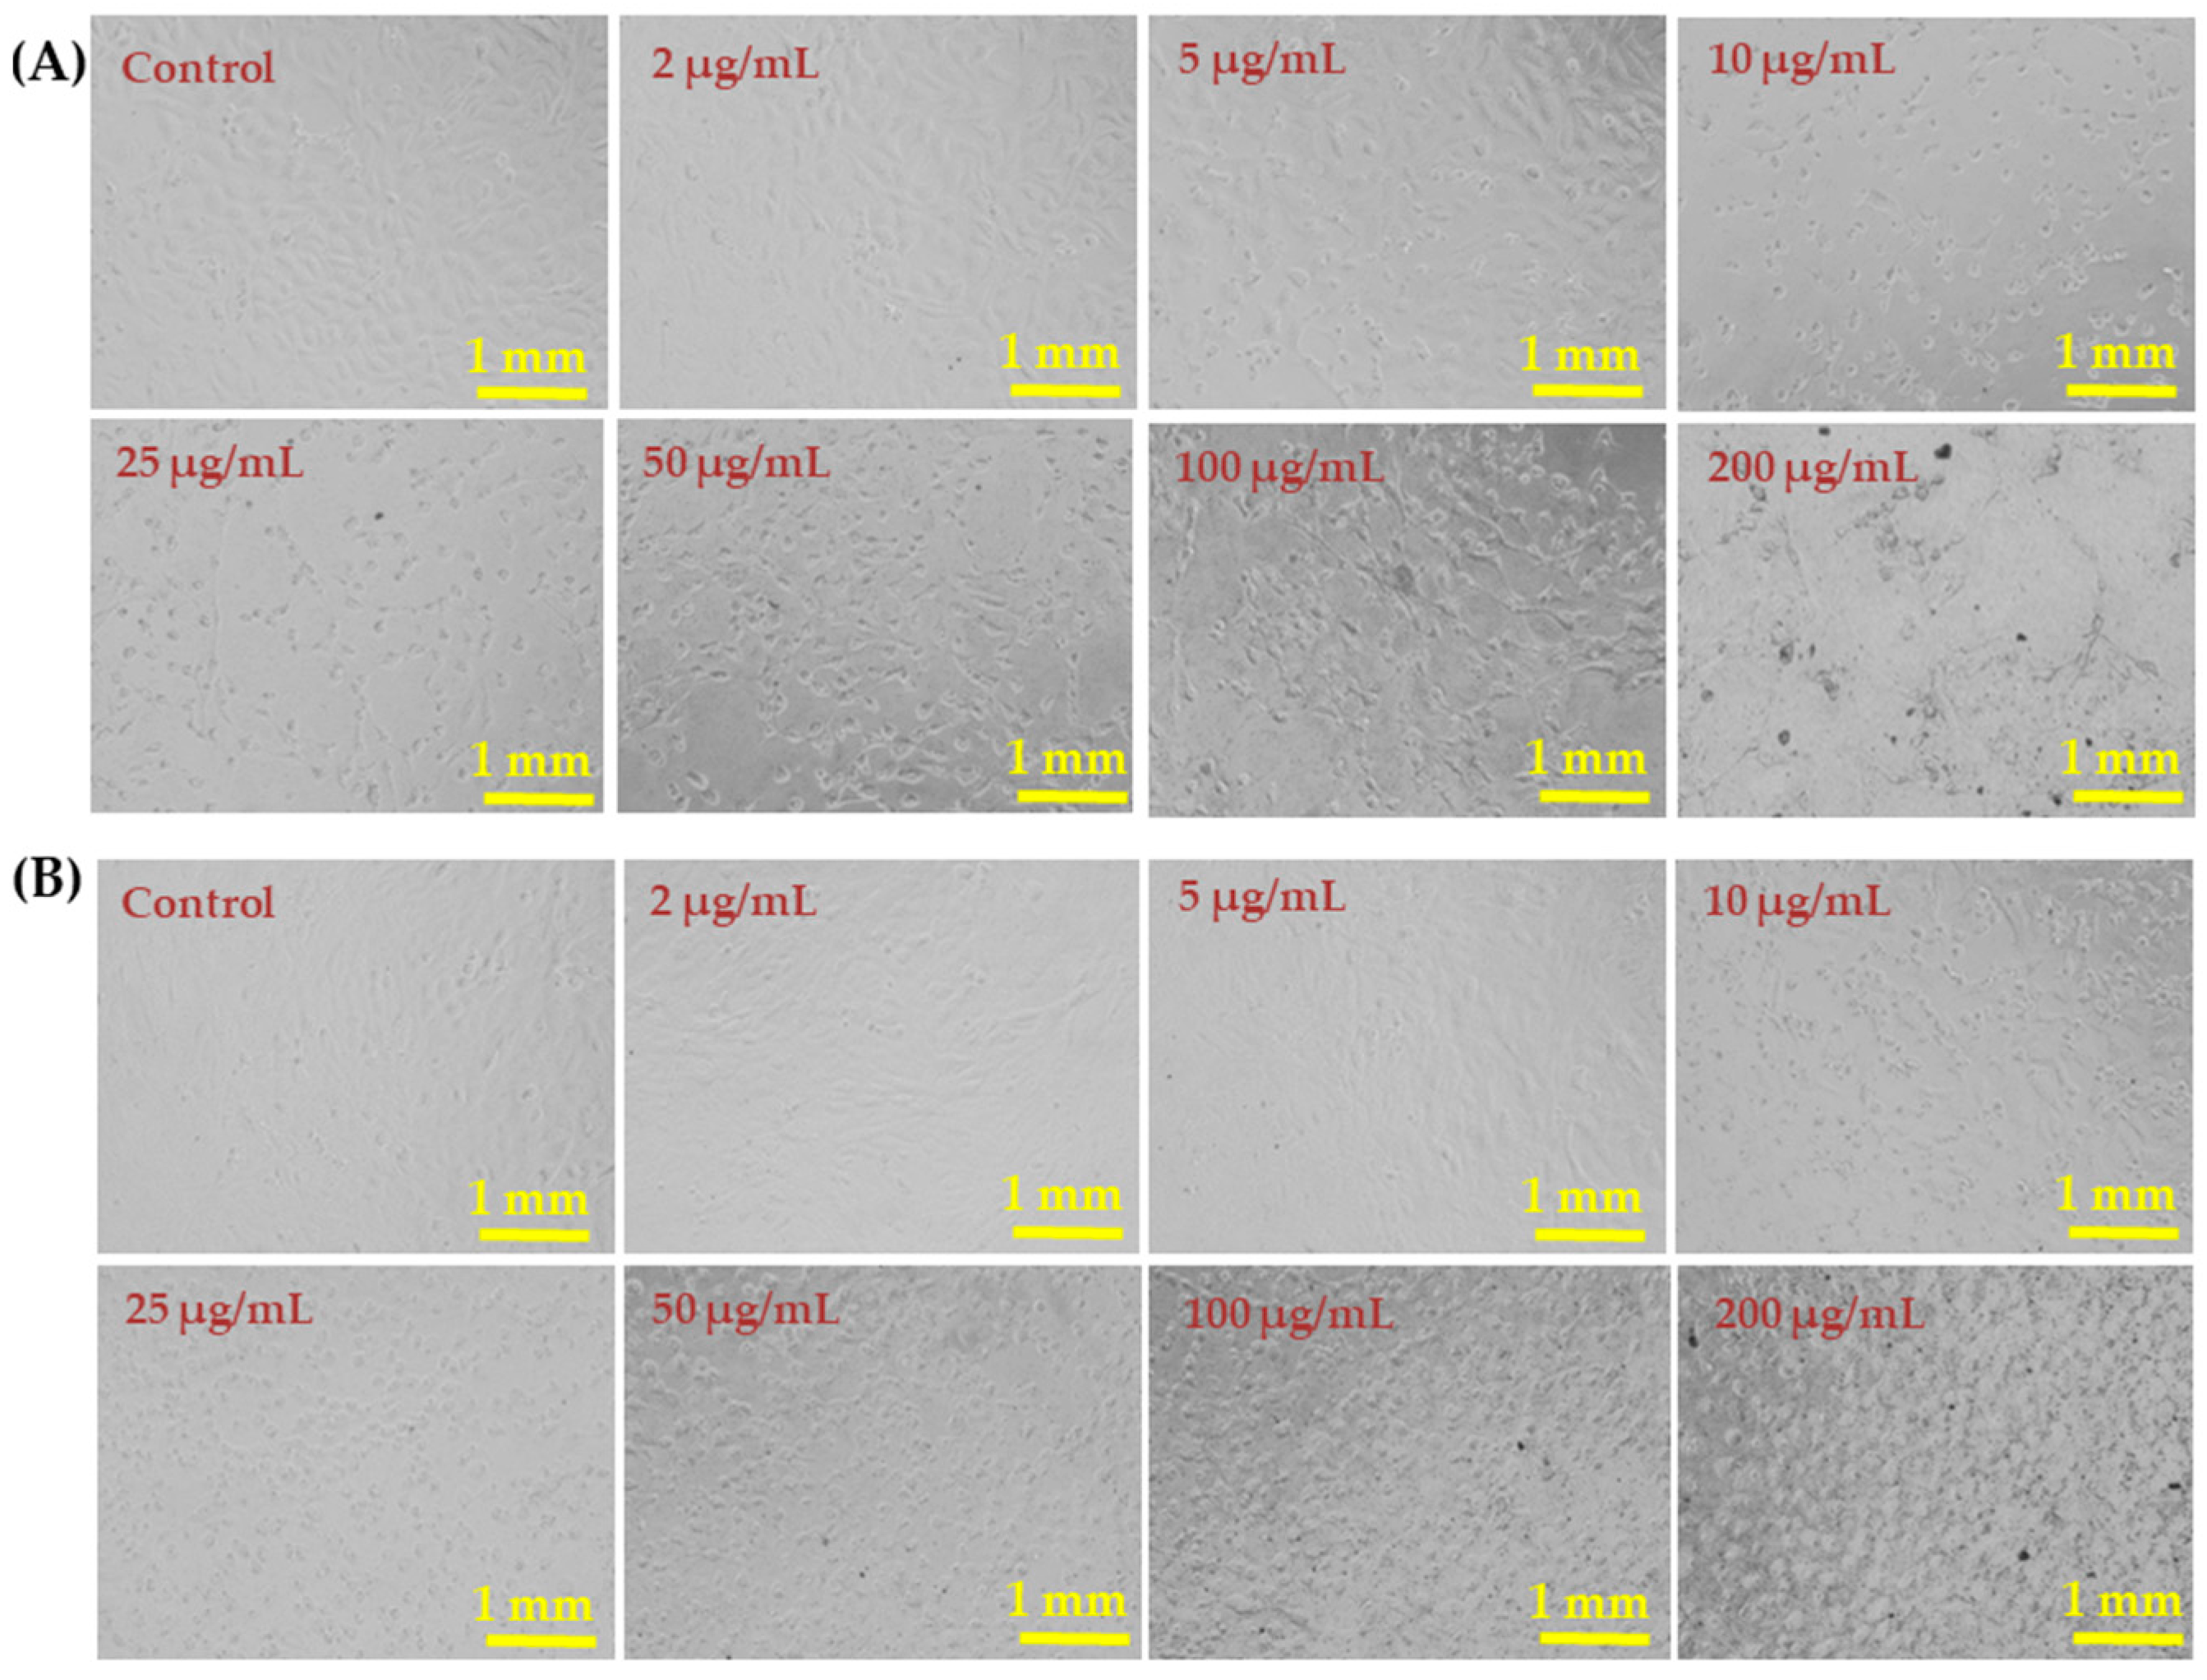
3.3. Morphological Changes in HepG2 and MCF-7 Cells after AgNPs Exposure
3.4. Cytotoxicity Induced by AgNPs
3.5. Cytotoxicity Study via NRU Assay in HepG2 and MCF-7 Cells after Exposure to AgNPs
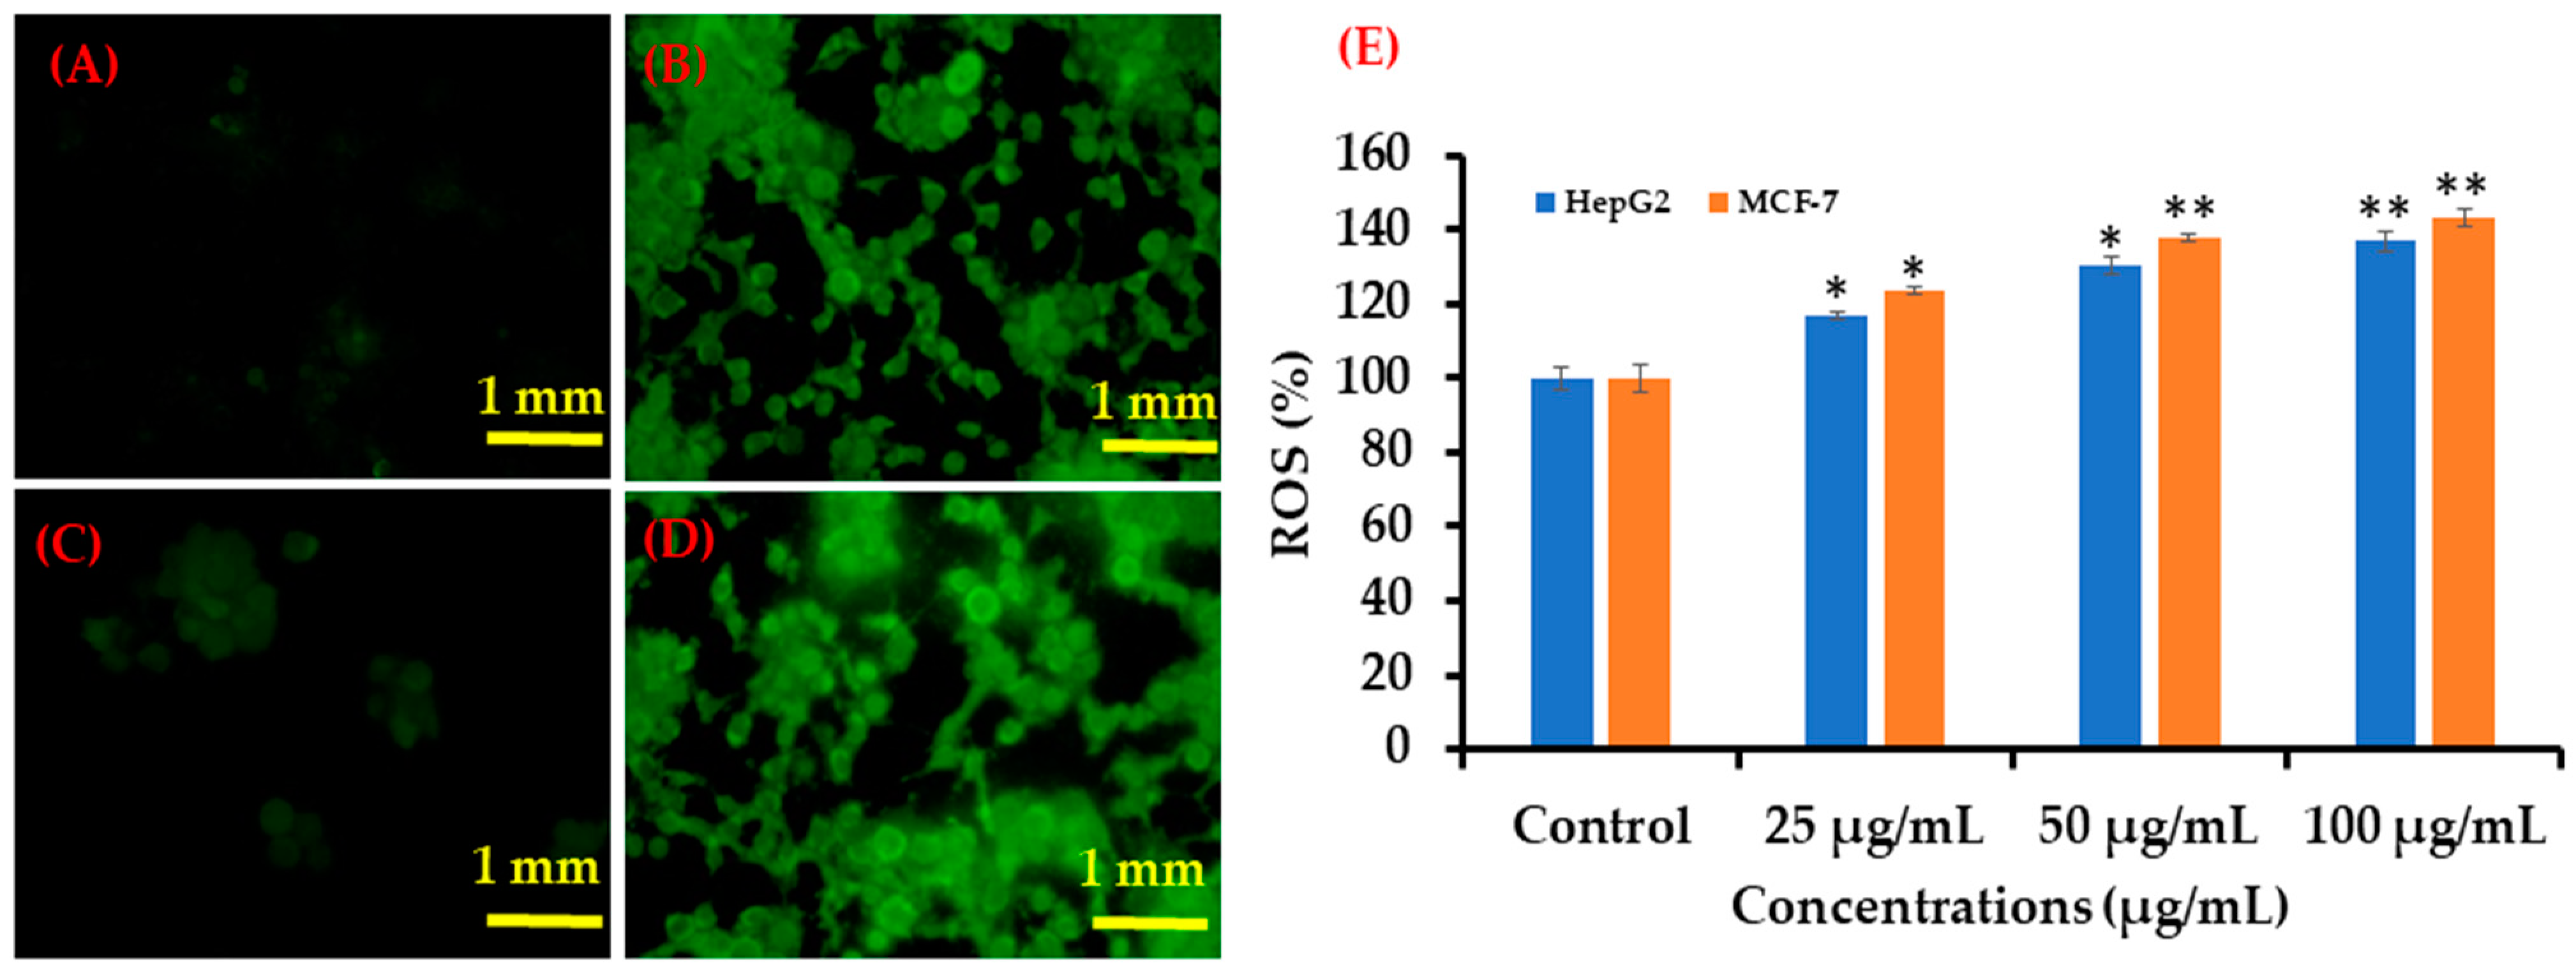
3.6. ROS Generation in HepG2 and MCF-7 Cells after Exposure to AgNPs
3.7. mRNA Expression
3.8. Discussion
4. Conclusions
Author Contributions
Funding
Data Availability Statement
Acknowledgments
Conflicts of Interest
References
- Bray, F.; Jemal, A.; Grey, N.; Ferlay, J.; Forman, D. Global cancer transitions according to the Human Development Index (2008–2030): A population-based study. Lancet Oncol. 2012, 13, 790–801. [Google Scholar] [CrossRef]
- Elenbaas, B.; Spirio, L.; Koerner, F.; Fleming, M.D.; Zimonjic, D.B.; Donaher, J.L.; Popescu, N.C.; Hahn, W.C.; Weinberg, R.A. Human breast cancer cells generated by oncogenic transformation of primary mammary epithelial cells. Genes Dev. 2001, 15, 50–65. [Google Scholar] [CrossRef] [PubMed] [Green Version]
- Vahrmeijer, A.L.; Hutteman, M.; van der Vorst, J.R.; van de Velde, C.J.H.; Frangioni, J.V. Image-guided cancer surgery using near-infrared fluorescence. Nat. Rev. Clin. Oncol. 2013, 10, 507–518. [Google Scholar] [CrossRef] [PubMed] [Green Version]
- Nardin, S.; Mora, E.; Varughese, F.M.; Avanzo, F.D.; Vachanaram, A.R.; Rossi, V.; Saggia, C.; Rubinelli, S.; Gennari, A. Breast Cancer Survivorship, Quality of Life, and Late Toxicities. Front. Oncol. 2020, 10, 864. [Google Scholar] [CrossRef]
- Sadikovic, B.; Al-Romaih, K.; Squire, J.A.; Zielenska, M. Cause and consequences of genetic and epigenetic alterations in human cancer. Curr. Genom. 2008, 9, 394–408. [Google Scholar] [CrossRef] [Green Version]
- Khan, M.I.; Mohammad, A.; Patil, G.; Naqvi, S.A.H.; Chauhan, L.K.S.; Ahmad, I. Induction of ROS, mitochondrial damage and autophagy in lung epithelial cancer cells by iron oxide nanoparticles. Biomaterials 2012, 33, 1477–1488. [Google Scholar] [CrossRef] [PubMed]
- Ahamed, M.; Akhtar, M.J.; Raja, M.; Ahmad, I.; Kaleem, M.; Siddiqui, J.; AlSalhi, M.S.; Alrokayan, S.A. ZnO nanorod-induced apoptosis in human alveolaradeno carcinoma cells via p53, survivin and bax/bcl-2 pathways: Role of oxidative stress. Nanomed. Nanotechnol. Biol. Med. 2011, 7, 904–913. [Google Scholar] [CrossRef]
- Chen, N.; He, Y.; Su, Y.; Li, X.; Huang, Q.; Wang, H.; Zhang, X.; Tai, R.; Fan, C. The cytotoxicity of cadmium based quantum dots. Biomaterials 2012, 33, 1238–1244. [Google Scholar] [CrossRef]
- Reddy, K.M.; Feris, K.; Bell, J.; Wingett, D.G.; Hanley, C.; Punnoose, A. Selective toxicity of zinc oxide nanoparticles to prokaryotic and eukaryotic systems. Appl. Phys. Lett. 2007, 90, 213902–2139023. [Google Scholar] [CrossRef] [Green Version]
- Wahab, R.; Kaushik, N.K.; Kaushik, N.; Choi, E.H.; Umar, A.; Dwivedi, S.; Musarrat, J.; Al-Khedhairy, A.A. ZnO nanoparticles induces cell death in malignant human T98G gliomas, KB and non-malignant HEK cells. J. Biomed. Nanotech. 2013, 9, 1181–1189. [Google Scholar] [CrossRef] [Green Version]
- Wahab, R.; Yang, Y.B.; Umar, A.; Singh, S.; Hwang, I.H.; Shin, H.S.; Kim, Y.S. Platinum quantum dots and their cytotoxic effect towards myoblast cancer cells (C2C12). J. Biomed. Nanotech. 2012, 8, 424–431. [Google Scholar] [CrossRef]
- Cancer Incidence Report 2010. Saudi Arabia. Available online: www.scr.org.sa (accessed on 5 December 2021).
- Galicia-Moreno, M.; Silva-Gomez, J.A.; Lucano-Landeros, S.; Santos, A.; Monroy-Ramirez, H.C.; Armendariz-Borunda, J. Liver Cancer: Therapeutic Challenges and the Importance of Experimental Models. Can. J. Gastroenterol. Hepatol. 2021, 202, 8837811. [Google Scholar] [CrossRef] [PubMed]
- Sherman, M. Surveillance for hepatocellular carcinoma. Semin. Oncol. 2001, 28, 450–459. [Google Scholar] [CrossRef]
- Ye, Q.H.; Qin, L.X.; Forgues, M.; He, P.; Kim, J.W.; Peng, A.C.; Simon, R.; Li, Y.; Robles, A.I.; Chen, Y.; et al. Predicting hepatitis B virus–positive metastatic hepatocellular carcinomas using gene expression profiling and supervised machine learning. Nat. Med. 2003, 9, 416–423. [Google Scholar] [CrossRef] [PubMed]
- WHO. International Agency for Research in Cancer (IARC) Saudi Arabia. Source: Globocan. 2018. Available online: https://gco.iarc.fr/today/data/factsheets/populations/682-saudi-arabia-fact-sheets.pdf (accessed on 10 December 2018).
- Saudi Arabia-Global Cancer Observatory. Available online: https://gco.iarc.fr/today/data/factsheets/populations/682-saudi-arabia-fact-sheets.pdf (accessed on 10 March 2021).
- Pecorelli, S.; Favalli, G.; Zigliani, L.; Odicino, F. Cancer in women. Int. J. Gynecol. Obstet. 2003, 82, 369–379. [Google Scholar] [CrossRef]
- Ferlay, J.; Parkin, D.M.; Steliarova-Foucher, E. Estimates of cancer incidence and mortality in Europe in 2008. Eur. J. Cancer 2010, 46, 765–781. [Google Scholar] [CrossRef] [PubMed]
- Parkin, D.M.; Coleman, M.P. Changes in diet and changes in cancer risk: Observational studies. IARC Sci. Publ. 1990, 103, 93–111. [Google Scholar]
- Sung, H.; Ferlay, J.; Siegel, R.L.; Laversanne, M.; Soerjomataram, I.; Jemal, A.; Bray, F. Global cancer statistics 2020: GLOBOCAN estimtes of incidence and mortality worldwide for 36 cancers in 185 countries. CA A Cancer J. Clin. 2021, 71, 209–249. [Google Scholar] [CrossRef]
- Nalwa, H.S.; Webster, T. (Eds.) Cancer Nanotechnology-Nanomaterials for Cancer Diagnosis and Therapy; American Scientific Publishers: Valencia, CA, USA, 2007. [Google Scholar]
- White, M.G.; Schulte, J.J.; Xue, L.; Berger, Y.; Schuitevoerder, D.; Vining, C.C.; Kindler, H.L.; Husain, A.; Turaga, K.K.; Eng, O.S. Heterogeneity in PD-L1 expression in malignant peritoneal mesothelioma with systemic or intraperitoneal chemo therapy. Br. J. Cancer 2021, 124, 564–566. [Google Scholar] [CrossRef]
- Boing, L.; Vieira, M.D.C.S.; Moratelli, J.; Bergmann, A.; Guimarães, A.C.D.A. Effects of exercise on physical outcomes of breas cancer survivors receiving hormone therapy—A systematic review and meta-analysis. Maturitas 2020, 141, 71–81. [Google Scholar] [CrossRef]
- Chen, K.; Wei1, J.; Ge, C.; Xia, W.; Shi, Y.; Wang, H.; Jiang, X. Application of auto-planning in radiotherapy for breast cancer after breast-conserving surger. Sci. Rep. 2020, 10, 10927. [Google Scholar] [CrossRef] [PubMed]
- Feng, B.; Niu, Z.; Hou, B.; Zhou, L.; Li, Y.; Yu, H. Enhancing Triple Negative Breast Cancer Immunotherapy by ICG-Templated Self-Assembly of Paclitaxel Nanoparticles. Adv. Funct. Mater. 2020, 30, 1906605. [Google Scholar] [CrossRef]
- Sugidono, M.; Lo, M.; Young, R.; Rosario, K.; Jung, Y.; Huang, C.Y.; Sheng, Y.; Huang, L.W.; Olin, R.L. Impact of Polypharmacy Prior to Allogeneic Hematopoietic Stem Cell Transplantation in Older Adults. Transplant. Cell. Ther. 2021, 27, 344.e1–344.e5. [Google Scholar] [CrossRef] [PubMed]
- Cammarata, F.P.; Forte, G.I.; Broggi, G.; Bravatà, V.; Minafra, L.; Pisciotta, P.; Calvaruso, M.; Tringali, R.; Tomasello, B.; Torrisi, F.; et al. Molecular Investigation on a Triple Negative BreastCancer Xenograft Model Exposed to Proton Beams. Int. J. Mol. Sci. 2020, 21, 6337. [Google Scholar] [CrossRef] [PubMed]
- Rahmani, J.; Manzari, N.; Thompson, J.; Gudi, S.K.; Chhabra, M.; Naik, G.; Mousavi, S.M.; Varkaneh, H.K.; Clark, C.; Zhang, Y. The effect of metformin on biomarkers associated with breast cancer outcomes: A systematic review, meta-analysis, and dose–response of randomized clinical trials. Clin. Transl. Oncol. 2020, 22, 37–49. [Google Scholar] [CrossRef]
- Snyder, K.K.; Buskirk, R.G.V.; Baust, J.G.; Baust, J.M. Breast Cancer Cryoablation: Assessment of the Impact of Fundamental Procedural Variables in an In Vitro Human Breast Cancer Model. Breast Cancer Basic Clin. Res. 2020, 14, 1–9. [Google Scholar] [CrossRef]
- Wahab, R.; Dwivedi, S.; Umar, A.; Singh, S.; Hwang, I.H.; Shin, H.S.; Musarrat, J.; Al-Khedhairy, A.A.; Kim, Y.S. ZnO Nanoparticles Induce Oxidative Stress in Cloudman S91 Melanoma Cancer Cells. J. Biomed. Nanotech. 2013, 9, 441–449. [Google Scholar] [CrossRef]
- Nguyen, L.N.; Kaushik, N.; Lamichhane, P.; Mumtaz, S.; Paneru, R.; Bhartiya, P.; Kwon, J.S.; Mishra, Y.K.; Nguyen, L.Q.; Kaushik, N.K.; et al. In situ plasma-assisted synthesis of polydopamine-functionalized gold nanoparticles for biomedical applications. Green Chem. 2020, 22, 6588–6599. [Google Scholar] [CrossRef]
- Bendale, Y.; Bendale, V.; Paul, S. Evaluation of cytotoxic activity of platinum nanoparticles against normal and cancer cells and its anticancer potential through induction of apoptosis. Integr. Med. Res 2017, 6, 141–148. [Google Scholar] [CrossRef]
- Khorshid, F.A.; Raouf, G.A.; El-Hamidy, S.M.; Al-amri, G.S.; Alotaibi, N.A.; Kumosani, T.A. PMF, Cesium & Rubidium Nanoparticles Induce Apoptosis in A549 Cells. Life Sci. J. 2011, 8, 534–542. [Google Scholar]
- Nayak, V.; Singh, K.R.B.; Singh, A.K.; Singh, R.P. Potentialities of selenium nanoparticles in biomedical science. New J. Chem. 2021, 45, 2849–2878. [Google Scholar] [CrossRef]
- Mavaei, M.; Chahardoli, A.; Shokoohinia, Y.; Khoshroo, A.; Fattahi, A. One-step Synthesized Silver Nanoparticles Using Isoimperatorin: Evaluation of Photocatalytic, and Electrochemical Activities. Sci. Rep. 2020, 10, 1762. [Google Scholar] [CrossRef] [PubMed] [Green Version]
- Kolya, H.; Kuila, T.; Kim, N.H.; Lee, J.H. Bioinspired silver nanoparticles/reduced graphene oxide nanocomposites for catalytic reduction of 4-nitrophenol, organic dyes and act as energy storage electrode material. Compos. Part B Eng. 2019, 173, 106924. [Google Scholar] [CrossRef]
- Molina, G.; Murcia, S.; Molera, J.; Roldan, C.; Crespo, D.; Pradell, T. Color and dichroism of silver-stained glasses. J. Nanoparticle Res. 2013, 15, 1932. [Google Scholar] [CrossRef]
- Lv, Y.; Liu, H.; Wang, Z.; Liu, S.; Hao, L.; Sang, Y.; Liu, D.; Wang, J.; Boughton, R.I. Silver nanoparticle-decorated porous ceramic composite for water treatment. J. Membr. Sci. 2009, 331, 50–56. [Google Scholar] [CrossRef]
- Guo, H.; Zhang, Z.; Xing, B.; Mukherjee, A.; Musante, C.; White, J.C.; He, L. Analysis of Silver Nanoparticles in Antimicrobial Products Using Surface-Enhanced Raman Spectroscopy (SERS). Environ. Sci. Technol. 2015, 49, 4317–4324. [Google Scholar] [CrossRef]
- Austin, L.A.; Mackey, M.A.; Dreaden, E.C.; El-Sayed, M.A. The optical, photothermal, and facile surface chemical properties of gold and silver nanoparticles in biodiagnostics, therapy, and drug delivery. Arch. Toxicol. 2014, 88, 1391–1417. [Google Scholar] [CrossRef] [Green Version]
- Austin, L.A.; Kang, B.; Yen, C.W.; El-Sayed, M.A. Plasmonic Imaging of Human Oral Cancer Cell Communities during Programmed Cell Death by Nuclear-Targeting Silver Nanoparticles. J. Am. Chem. Soc. 2011, 133, 17594–17597. [Google Scholar] [CrossRef] [PubMed] [Green Version]
- Gopinath, P.; Gogoi, S.K.; Chattopadhyay, A.; Ghosh, S.S. Implications of silver nanoparticle induced cell apoptosis for in vitro gene therapy. Nanotechnology 2008, 19, 075104. [Google Scholar] [CrossRef]
- Kalpana, D.; Han, J.H.; Park, W.S.; Lee, S.M.; Wahab, R.; Lee, Y.S. Green biosynthesis of silver nanoparticles using Torreya nucifera and their antibacterial activity. Arab. J. Chem. 2019, 12, 1722–1732. [Google Scholar] [CrossRef] [Green Version]
- Rai, M.; Yadav, A.; Gade, A. Silver nanoparticles as a new generation of anti microbials. Biotechnol. Adv. 2009, 27, 76–83. [Google Scholar] [CrossRef] [PubMed]
- Dakal, T.C.; Kumar, A.; Majumdar, R.S.; Yadav, V. Mechanistic basis of antimicrobial actions of silver nanoparticles. Front. Microbiol. 2016, 16, 1831. [Google Scholar] [CrossRef] [Green Version]
- Buttacavoli, M.; Albanese, N.N.; Di, C.G.; Alduina, R.; Faleri, C.; Gallo, M.; Pizzolanti, G.; Gallo, G.; Feo, S.; Baldi, F.; et al. Anticancer activity of biogenerated silver nanoparticles: Anintegrated proteomic investigation. Oncotarget 2018, 9, 9685–9705. [Google Scholar] [CrossRef] [PubMed] [Green Version]
- Bastús, G.N.; Merkoçi, F.; Piella, J.; Puntes, V. Synthesis of Highly Monodisperse Citrate-Stabilized Silver Nanoparticles of up to 200 nm: Kinetic Control and Catalytic Properties. Chem. Mater. 2014, 26, 2836–2846. [Google Scholar] [CrossRef]
- Alshehri, A.H.; Jakubowska, M.; Młożniak, A.; Horaczek, M.; Rudka, D.; Free, C.; Carey, J.D. Enhanced Electrical Conductivity of Silver Nanoparticles for High Frequency Electronic Applications. ACS Appl. Mater. Interfaces 2012, 4, 7007–7010. [Google Scholar] [CrossRef] [Green Version]
- Ahamed, M.; Akhtar, M.J.; Khan, M.A.; Alhadlaq, H.A. Novel Green Preparation of Ag/RGO Nanocomposites with Highly Effective Anticancer Performance. Polymers 2021, 13, 3350. [Google Scholar] [CrossRef]
- Ahamed, M.; Akhtar, M.J.; Khan, M.M.; Alhadlaq, H.A. SnO2-Doped ZnO/Reduced Graphene Oxide Nanocomposites: Synthesis, Characterization, and Improved Anticancer Activity via Oxidative Stress Pathway. Int. J. Nanomed. 2021, 16, 89–104. [Google Scholar] [CrossRef]
- Jebril, S.; Jenana, R.K.B.; Dridi, C. Green synthesis of silver nanoparticles using Melia azedarach leaf extract and their antifungal activities: In vitro and in vivo. Mater. Chem. Phys. 2020, 248, 122898. [Google Scholar] [CrossRef]
- Skiba, M.I.; Vorobyova, V.I.; Pivovarov, A.; Makarshenko, N.P. Green Synthesis of Silver Nanoparticles in the Presence of Polysaccharide: Optimization and Characterization. J. Nanomater. 2020, 2020, 3051308. [Google Scholar] [CrossRef]
- Hamida, R.S.; Albasher, G.; Bin-Meferij, M.M. Oxidative Stress and Apoptotic Responses Elicited by Nostoc-Synthesized Silver Nanoparticles against Different Cancer Cell Lines. Cancers 2020, 12, 2099. [Google Scholar] [CrossRef]
- Priya, K.; Vijayakumar, M.; Janani, B. Chitosan-mediated synthesis of biogenic silver nanoparticles (AgNPs), nanoparticle characterisation and in vitro assessment of anticancer activity in human hepatocellular carcinoma HepG2 cells. Inter. J. Biol. Macromol. 2020, 149, 844–852. [Google Scholar] [CrossRef]
- Siddiqui, M.A.; Singh, G.; Kashyap, M.P.; Khanna, V.K.; Yadav, S.; Chandra, D.; Pant, A.B. Influence of cytotoxic doses of 4-hydroxynonenal on selected neuro transmitter receptors in PC-12 cells. Toxicol. In Vitro 2008, 22, 1681–1688. [Google Scholar] [CrossRef]
- Wahab, R.; Siddiqui, M.A.; Saquib, Q.; Dwivedi, S.; Ahmad, J.; Musarrat, J.; Al-Khedhairy, A.A.; Shin, H.S. ZnO nanoparticles induced oxidative stress and apop-tosis in HepG2 and MCF-7 cancer cells and their antibacterial activity. Colloids Surf. B Biointerfaces 2014, 117, 267–276. [Google Scholar] [CrossRef]
- Alkhudhayri, A.A.; Wahab, R.; Siddiqui, M.A.; Ahmad, J. Selenium nanoparticles in-duce cytotoxicity and apoptosis in human breast cancer (MCF-7) and liver (HEPG2) cell lines. Nanosci. Nanotechnol. Lett. 2020, 12, 324–330. [Google Scholar] [CrossRef]
- Mosmann, T. Rapid colorimetric assay for cellular growth and survival: Application to proliferation and cytotoxicity assays. J. Immunol. Methods 1983, 65, 55–63. [Google Scholar] [CrossRef]
- Borenfreund, E.; Puerner, J.A. Toxicity determined in vitro by morphological alterations and neutral red absorption. Toxicol. Lett. 1985, 24, 119–124. [Google Scholar] [CrossRef]
- Siddiqui, M.A.; Kashyap, M.P.; Kumar, V.; Al-Khedhairy, A.A.; Musarrat, J.; Pant, A.B. Protective potential of trans-resveratrol against 4-hydroxynonenal induced damage in PC12 cells. Toxicol. Vitr. 2010, 24, 1592–1598. [Google Scholar] [CrossRef] [PubMed]
- Zhao, J.; Riediker, M. Detecting the oxidative reactivity of nanoparticles: A new protocol for reducing artifacts. J. Nanopart. Res. 2014, 16, 2493. [Google Scholar] [CrossRef] [PubMed] [Green Version]
- Davis, K.; Yarbrough, R.; Froeschle, M.; White, J.; Rathnayake, H. Band gap engineered zinc oxide nanostructures via a sol–gel synthesis of solvent driven shape controlled crystal growth. RSC Adv. 2019, 9, 14638–14648. [Google Scholar] [CrossRef] [Green Version]
- Steinmetz, L.; Geers, C.; Balog, S.; Bonmarin, M.; Rodriguez-Lorenzo, L.; Taladriz-Blanco, P.; Rothen-Rutishauser, B.; Petri-Fink, A. A comparative study of silver nanoparticle dissolution under physiological conditions. Nanoscale Adv. 2020, 2, 5760–5768. [Google Scholar] [CrossRef]
- Khan, I.; Saeed, K.; Khan, I. Nanoparticles: Properties, applications andtoxicities. Arab. J. Chem. 2019, 12, 908–931. [Google Scholar] [CrossRef]
- Vismara, E.; Valerio, A.; Coletti, A.; Torri, G.; Bertini, S.; Eisele, G.; Gornati, R.; Bernardini, G. Non-Covalent Synthesis of Metal Oxide Nanoparticle–Heparin Hybrid Systems: A New Approach to Bioactive Nanoparticles. Int. J. Mol. Sci. 2013, 14, 13463–13481. [Google Scholar] [CrossRef] [Green Version]
- Kumari, M.; Mukherjee, A.; Chandrasekaran, N. Genotoxicity of silver nanoparticles in Allium cepa. Sci. Total Environ. 2009, 407, 5243–5246. [Google Scholar] [CrossRef]
- Wahab, R.; Dwivedi, S.; Khan, F.; Mishra, Y.K.; Hwang, I.H.; Shin, H.S.; Musarrat, J.; Al-Khedhairy, A.A. Statistical analysis of gold nanoparticle-induced oxidative stress and apoptosis in myoblast (C2C12) cells. Colloids Surf. B Biointerfaces 2014, 123, 664–672. [Google Scholar] [CrossRef] [PubMed]
- Bahadar, H.; Maqbool, F.; Niaz, K.; Abdollahi, M. Toxicity of nanoparticles and an overview of current experimental models. Iran. Biomed. J. 2016, 20, 1–11. [Google Scholar] [PubMed]
- Sohaebuddin, S.K.; Thevenot, P.T.; Baker, D.; Eaton, J.W.; Tang, L. Nanomaterial cytotoxicity is composition, size, and cell type dependent. Part. Fibre Toxicol. 2010, 7, 22. [Google Scholar] [CrossRef] [Green Version]
- Pujalté, I.; Passagne, I.; Brouillaud, B.; Tréguer, M.; Durand, E.; Courtès, C.O.; L’Azou, B. Cytotoxicity and oxidative stress induced by different metallic nanoparticles on human kidney cells. Part. Fibre Toxicol. 2011, 8, 10. [Google Scholar] [CrossRef] [Green Version]
- Ahmed, K.B.R.; Nagy, A.M.; Brown, R.P.; Zhang, Q.; Malghan, S.G.; Goering, P.L. Silver nanoparticles: Significance of physicochemical properties and assay interference on the interpretation of in vitro cytotoxicity studies. Toxicol. Vitr. 2017, 38, 179–192. [Google Scholar] [CrossRef]
- Pablo, F.P.; Guy, S.S. The protein structures that shape caspase activity, specificity, activation and inhibition. Biochem. J. 2004, 384, 201–232. [Google Scholar]
- Youle, R.J.; Strasser, A. The BCL-2 protein family: Opposing activities that mediate cell death. Nat. Rev. Mol. Cell Biol. 2008, 9, 47–59. [Google Scholar] [CrossRef]
- Limbach, L.K.; Li, Y.; Grass, R.N.; Brunner, T.J.; Hintermann, M.A.; Muller, M.; Gunther, D.; Stark, W.J. Oxide Nanoparticle Uptake in Human Lung Fibroblasts: Effects of Particle Size, Agglomeration, and Diffusion at Low Concentrations. Environ. Sci. Technol. 2005, 39, 9370. [Google Scholar] [CrossRef] [PubMed]
- Jeng, H.A.; Swanson, J. Toxicity of Metal Oxide Nanoparticles in Mammalian Cells. J. Environ. Sci. Health Part A 2006, 41, 2699–2711. [Google Scholar] [CrossRef] [PubMed]


| S.N. | Phases | Peak Positions | FWHM | Crystallite Size D (nm) | D nm (Average Size) | Final Particle Size (nm) |
|---|---|---|---|---|---|---|
| 1. | 111 | 38.038 | 0.661 | 12.712 | 12.267 | 13.166 nm |
| 2. | 200 | 44.173 | 1.020 | 8.398 | 12.156 | - |
| 3. | 220 | 64.296 | 0.713 | 13.163 | 13.408 | - |
| 4. | 311 | 77.196 | 0.809 | 12.564 | 13.531 | - |
| 5. | 222 | 81.308 | 0.722 | 14.498 | 14.498 | - |
Publisher’s Note: MDPI stays neutral with regard to jurisdictional claims in published maps and institutional affiliations. |
© 2022 by the authors. Licensee MDPI, Basel, Switzerland. This article is an open access article distributed under the terms and conditions of the Creative Commons Attribution (CC BY) license (https://creativecommons.org/licenses/by/4.0/).
Share and Cite
Al-Khedhairy, A.A.; Wahab, R. Silver Nanoparticles: An Instantaneous Solution for Anticancer Activity against Human Liver (HepG2) and Breast (MCF-7) Cancer Cells. Metals 2022, 12, 148. https://doi.org/10.3390/met12010148
Al-Khedhairy AA, Wahab R. Silver Nanoparticles: An Instantaneous Solution for Anticancer Activity against Human Liver (HepG2) and Breast (MCF-7) Cancer Cells. Metals. 2022; 12(1):148. https://doi.org/10.3390/met12010148
Chicago/Turabian StyleAl-Khedhairy, Abdulaziz A., and Rizwan Wahab. 2022. "Silver Nanoparticles: An Instantaneous Solution for Anticancer Activity against Human Liver (HepG2) and Breast (MCF-7) Cancer Cells" Metals 12, no. 1: 148. https://doi.org/10.3390/met12010148
APA StyleAl-Khedhairy, A. A., & Wahab, R. (2022). Silver Nanoparticles: An Instantaneous Solution for Anticancer Activity against Human Liver (HepG2) and Breast (MCF-7) Cancer Cells. Metals, 12(1), 148. https://doi.org/10.3390/met12010148