Article

Kinetic Study of Oxide Growth at High Temperature in Low Carbon Steel

by
Sixtos Antonio Arreola-Villa
1,*,†,
Héctor Javier Vergara-Hernández
2,†,
Gildardo Solorio-Diáz
3,†,
Alejandro Pérez-Alvarado
1,†,
Octavio Vázquez-Gómez
2,4,† and
Gerardo Marx Chávez-Campos
2,†
1
Facultad de Ingeniería Mecánica y Eléctrica, Barranquilla S/N, Col. Guadalupe, Monclova 25280, Mexico
2
Tecnológico Nacional de México/I.T. Morelia, Av. Tecnológico 1500, Col. Lomas de Santiaguito, Morelia 58120, Mexico
3
Facultad de Ingeniería Mecánica, Universidad Michoacana de San Nicólas de Hidalgo, Av. Francisco J. Múgica S/N, Morelia 58030, Mexico
4
Consejo Nacional de Ciencia y Tecnología, Av. Insurgentes 1582, Crédito Constructor, Ciudad de Mexico 03940, Mexico
*
Author to whom correspondence should be addressed.
These authors contributed equally to this work.
Metals 2022, 12(1), 147; https://doi.org/10.3390/met12010147
Submission received: 7 December 2021 / Revised: 7 January 2022 / Accepted: 10 January 2022 / Published: 13 January 2022

Abstract

:
High-temperature surface oxidation kinetics were determined for low-carbon steel using a Joule heating device on hollow cylindrical specimens. The growth of the oxide layer was measured in situ between 800 and 1050 C under isothermal oxidation conditions and in an air laboratory atmosphere ( O 2 = 20.3% and humidity = 42%). Through a laser and infrared measuring system, the expansion and temperature were measured continuously. From the data acquired, the oxidation kinetic parameters were obtained at different temperatures with a parabolic-type growth model to estimate the rate of oxide layer generation. The convergence degree of the data fitted with the oxidation model was acceptable and appropriately correlated with the experimental data. Finally, comparisons were made between the estimated kinetic parameters and those reported in the literature, observing that the activation energy values obtained are in the range of the reported values.

1. Introduction

Steel continues to be the most widely used material in the different fields of engineering due to its mechanical properties and unique/irreplaceable characteristics. Despite technological advances in steel-making processes, surface oxidation at high temperature continues to be one of the study problems, since it generates a significant loss of material during the reheating of semi-finished products, billets, or slabs before and during the rolling process. In these processes, surface oxidation occurs severely without being able to avoid; therefore, the industries seek to quantify and reduce material loss based on the study of oxidation kinetic processes [1,2,3]. Studies show that the iron oxide layer generated during hot rolling, quenching, tempering, and other heat treatments of steel generates losses of 7 to 10% of the total steel, causing an enormous waste of resources and a loss of economic benefits [4,5]. Some research to reduce the growth of the oxide layer in the hot rolling process and improve the oxidation resistance of steel focused on heating systems, the rolling process, and modifying the chemical composition of alloying elements [6,7,8]. In the hot-rolling process, the growth of the oxide layer occurs in three stages. The first stage begins during the reheating of the steel inside the natural gas combustion furnace. At this stage, the oxide layer reaches a thickness of a few millimeters at a temperature above 1250 C [9]. The oxide layer is removed by high-pressure water jets before entering the rolling mills [1]. The second stage occurs during the rolling process between temperatures of 1250 C at the beginning and 800 C in the last steps; the oxide layer in this stage reaches a thickness of 20 and 30 mm, which is also removed by water jets before entering the last mill, where the layer grows between 1.2 and 12 mm. The third stage is after the various stages of rolling and forming, the steel is coiled, and oxidation may continue to a lesser extent if the oxygen content favors the process in the annealing heat treatment. The surface oxidation of steel is complex because it depends on many factors such as oxidation time, temperature, alloying elements, and oxidizing atmosphere [10]. It should be clarified that the removal of the oxide layer between stages with high-pressure water could generate imperfections on the surface of the rolled steel, causing cracking problems [11,12]. In general, the oxidation of steel at high temperature is similar to that of pure iron Fe composed by the sequence of oxide layers growth ( FeO / Fe 3 O 4 / Fe 2 O 3 / O 2 ) : (1) wustite ( FeO ) , a thick inner layer formed by ionic reaction between metallic iron Fe and oxygen in the atmosphere, (2) magnetite ( Fe 3 O 4 ) [13], a thin intermediate layer formed by the reaction between wustite and oxygen ions whose growth is based on the formation of the outer layer, and (3) hematite ( Fe 2 O 3 ) , which is a thin layer that is characterized by containing the highest amount of oxygen and serving as the supply of Fe cations for the formation of magnetite [9]; that is, a cooperative growth occurs, where the cations for the growth of hematite come from the magnetic one, while the anions come from the hematite, which has been corroborated by theoretical calculations by Schwenk and Rahmelt [13]. Oxide growth reactions are exothermic and cause overheating of the steel as a function of the component [3] and predominantly involve the transfer of ions, electrons, and vacancies [13]. On the other hand, the diffusion of oxygen anions and iron cations is controlled by the oxidation temperature and the type of oxide; for example, iron has a higher diffusion coefficient in magnetite than in hematite; hence, the thickness of hematite is extremely thin [14]. Likewise, diffusion is also affected by factors such as the porosity of the oxide or the cracks produced by mechanical and thermal stress [15].
The oxidation kinetics could be approximated from the growth of the oxide layer using a linear, logarithmic, cubic, or parabolic model. The oxide growth models for metallic materials could match the parabolic model, which under ideal conditions is very accurate, especially in unalloyed steels. However, depending on the alloy and its elements, there may be deviations in the behavior. Some alloying elements such as aluminium, chromium, silicon, nickel, molybdenum, and magnesium promote the formation of protective layers, which are elements that decrease the rate of oxidation in different forms and temperature range [16]. For example, silicon inhibits the growth of oxide layers at temperatures below 1000 C [17]. However, at higher temperatures, different authors have reported the formation of a compound (Fayalite ( Fe 2 + ) 2 SiO 4 ) with a melting point of 1173 C, a temperature lower than the melting point of steel, promoting diffusion and increasing the oxidation rate, which is a characteristic process in steels with high silicon [18]. The oxidation kinetic models present a parameter that is determined experimentally. Two experimental methods are reported in the literature. (1) The first is the gravimetric method that measures the weight gain as a function of the residence time and the temperature, where the specimens are heated inside a furnace or gravimetric balance and are removed at different times to evaluate the weight gain [9]. The results obtained by this method are approximated by a parabolic model through the Pilling–Bedworth equation [19],
W 2 = k p t + W o 2
where W is the weight gained by oxidation, t is the residence time, W o is the initial weight, and k p is the oxidation kinetic parameter. (2) The second method is based on the measurement of the thickness of the oxide layer in the cross-section. In this method, the samples are heated at different temperatures and times, evaluating the oxide layer thickness by optical or scanning electron microscopy. The results, as in the gravimetric method, are fitted with a parabolic model proposed by Tammann [20],
X 2 = k x t + X o 2
where X is the oxidation thickness, t is the residence time, X o is the initial thickness, and k x is the oxidation kinetic parameter. In different works, conversion factors are presented that relate the kinetic parameters k p and k x as a function of the density of the oxide layer [9,21].
It has been shown that the constants k p and k x depend on the oxidation temperature, and its behavior is generally approximated from an Arrhenius-type equation,
l o g k i = l o g k o Q R T
where k i is the oxidation kinetic parameter for k x or k p , k o is the pre-exponential factor of the rate of oxidation independent of temperature, Q is the oxidation activation energy, R is the universal gas constant, and T is the oxidation temperature in Kelvin. The activation energy and the pre-exponential factor could be determined by plotting the l o g k i and the inverse of the temperature 1 / T , whose slope is the value of Q / R .
The weight or thickness measurements of the oxidized layer are performed when the specimen is at room temperature. In some studies, the specimen was coupled to an induction furnace to make weight measurements in real time [22,23,24] with commercial thermos-balances, and then, the scale thickness was estimated indirectly using correlations. An error is associated with this method, and it could be large depending on the geometry. In some cases, the oxide layer growth during the heating is important, and a direct measurement in situ is necessary for accuracy. There is not evidence of experimental equipment or procedure that performs oxide layer measurement in situ. The closest device was used by Hu Xian-jun et al. [25] in a Gleeble thermomechanical simulator, using a heating rate above 50 C · s 1 , to reduce the effect of oxidation during the heating cycle.
The present work aims to propose an experimental procedure to measure the oxide layer at high temperature under isothermal condition in low-carbon steel using a Joule heating device. Unlike other methods to measure the oxide layer, this work shows in situ measurements in an isothermal condition, with a high sampling rate, to obtain measurements as a function of time with the heating of a single specimen.

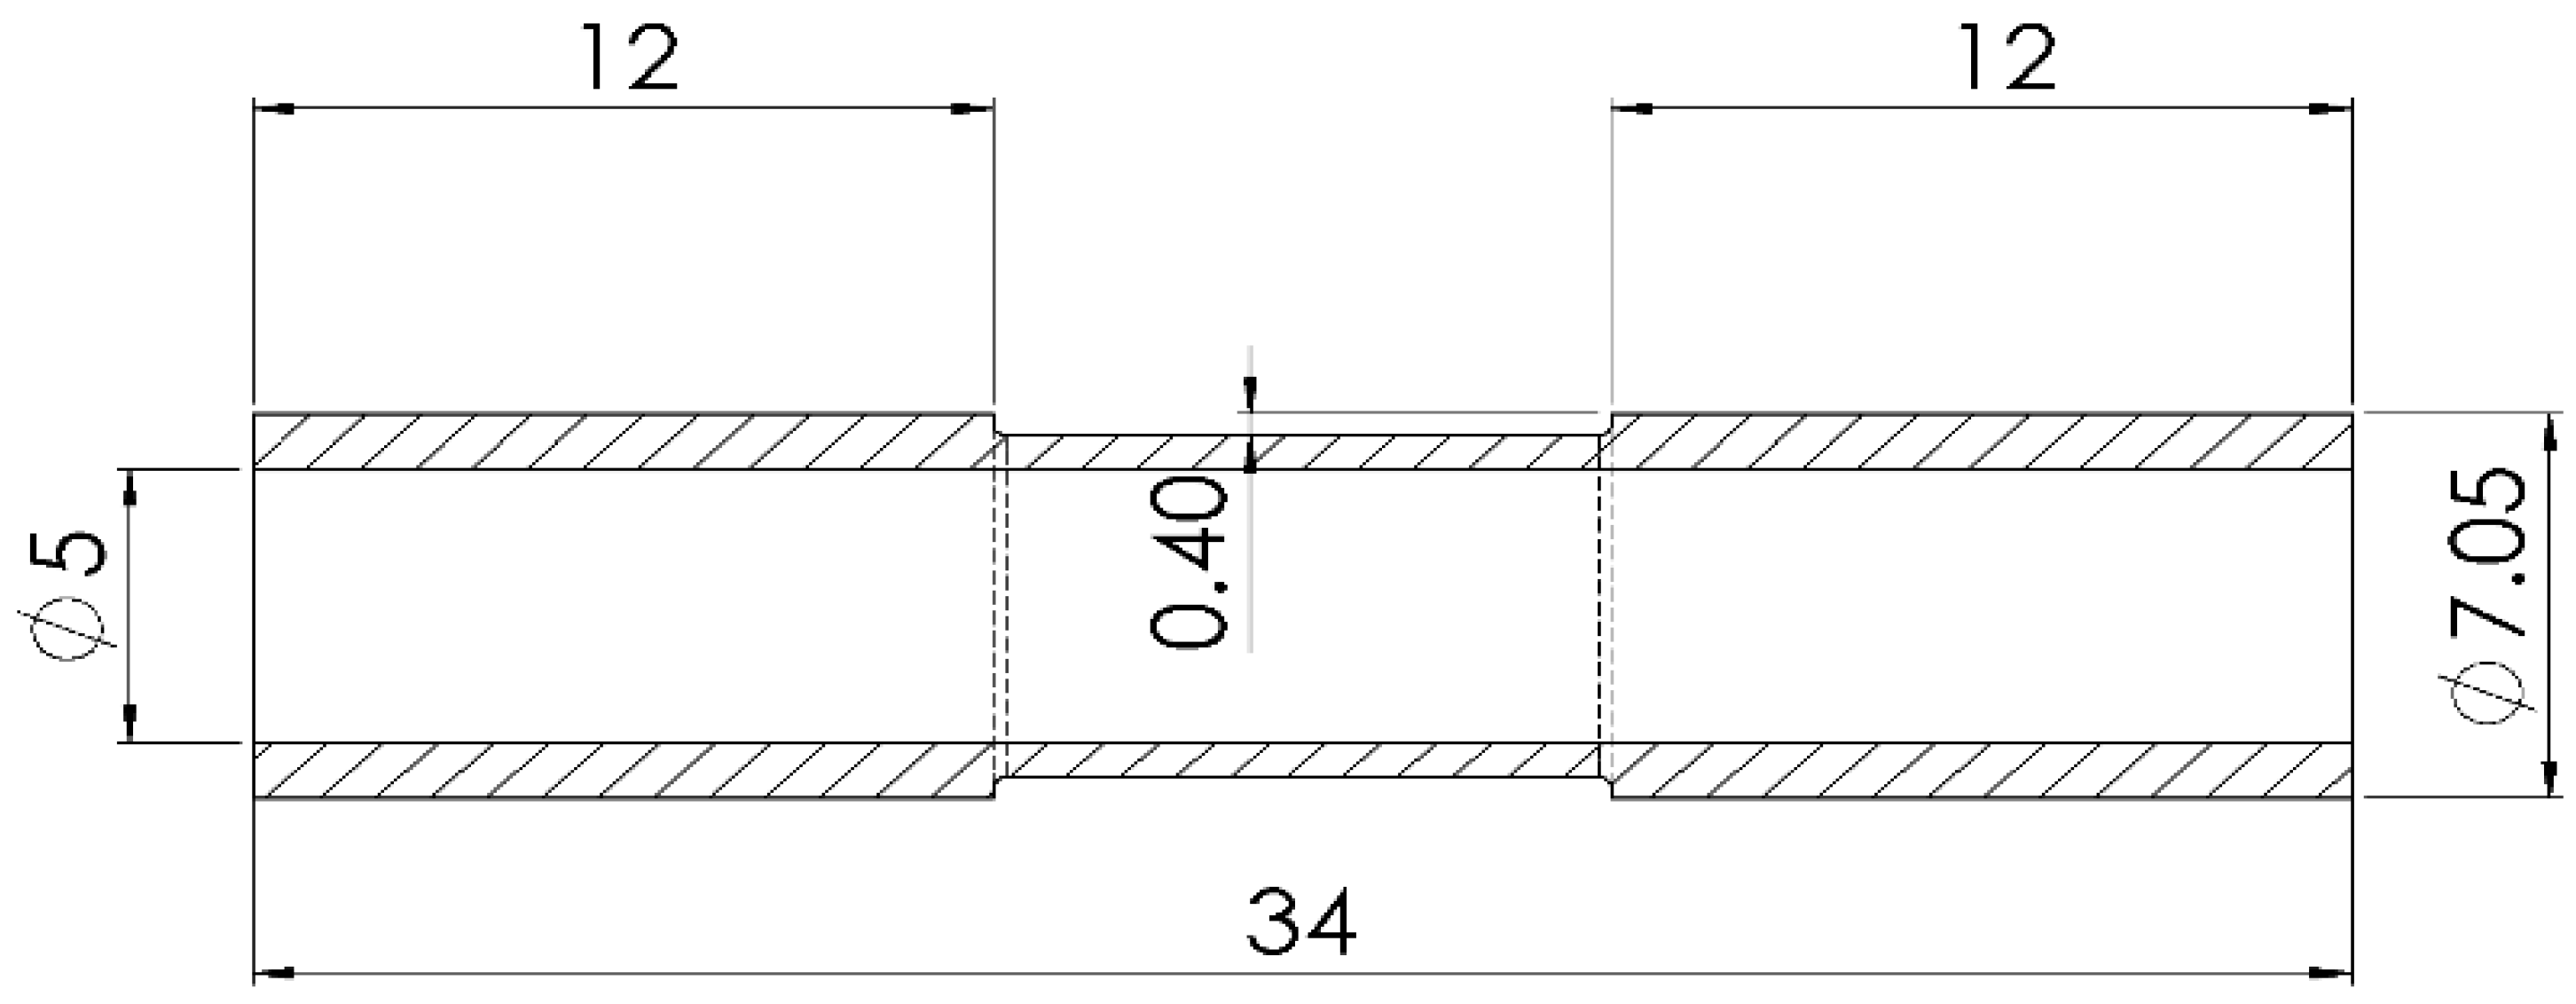
2. Materials and Methods
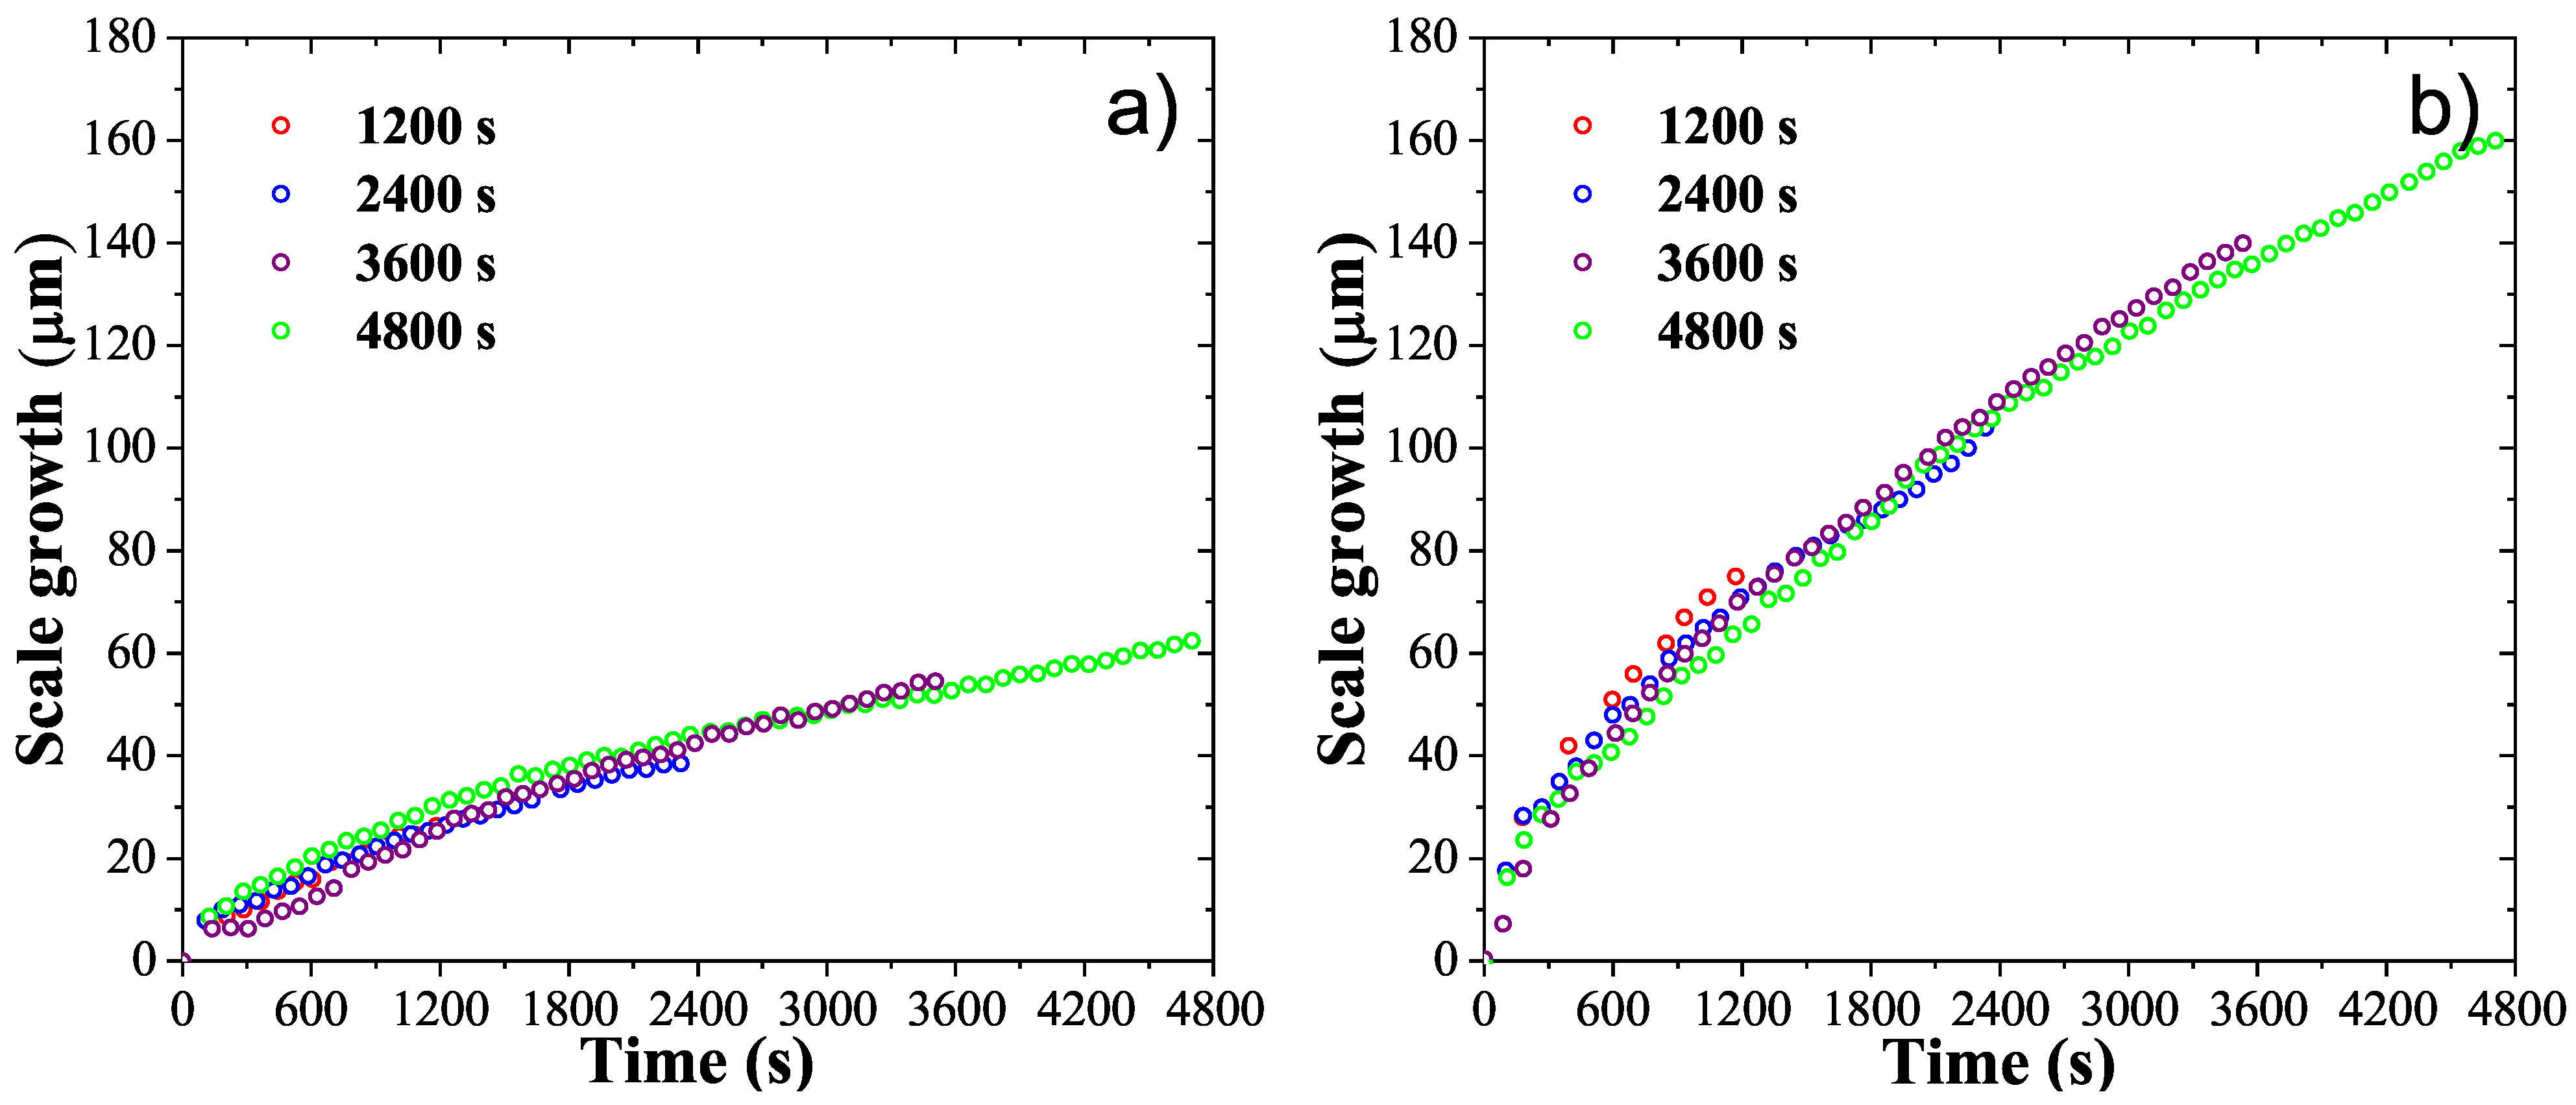
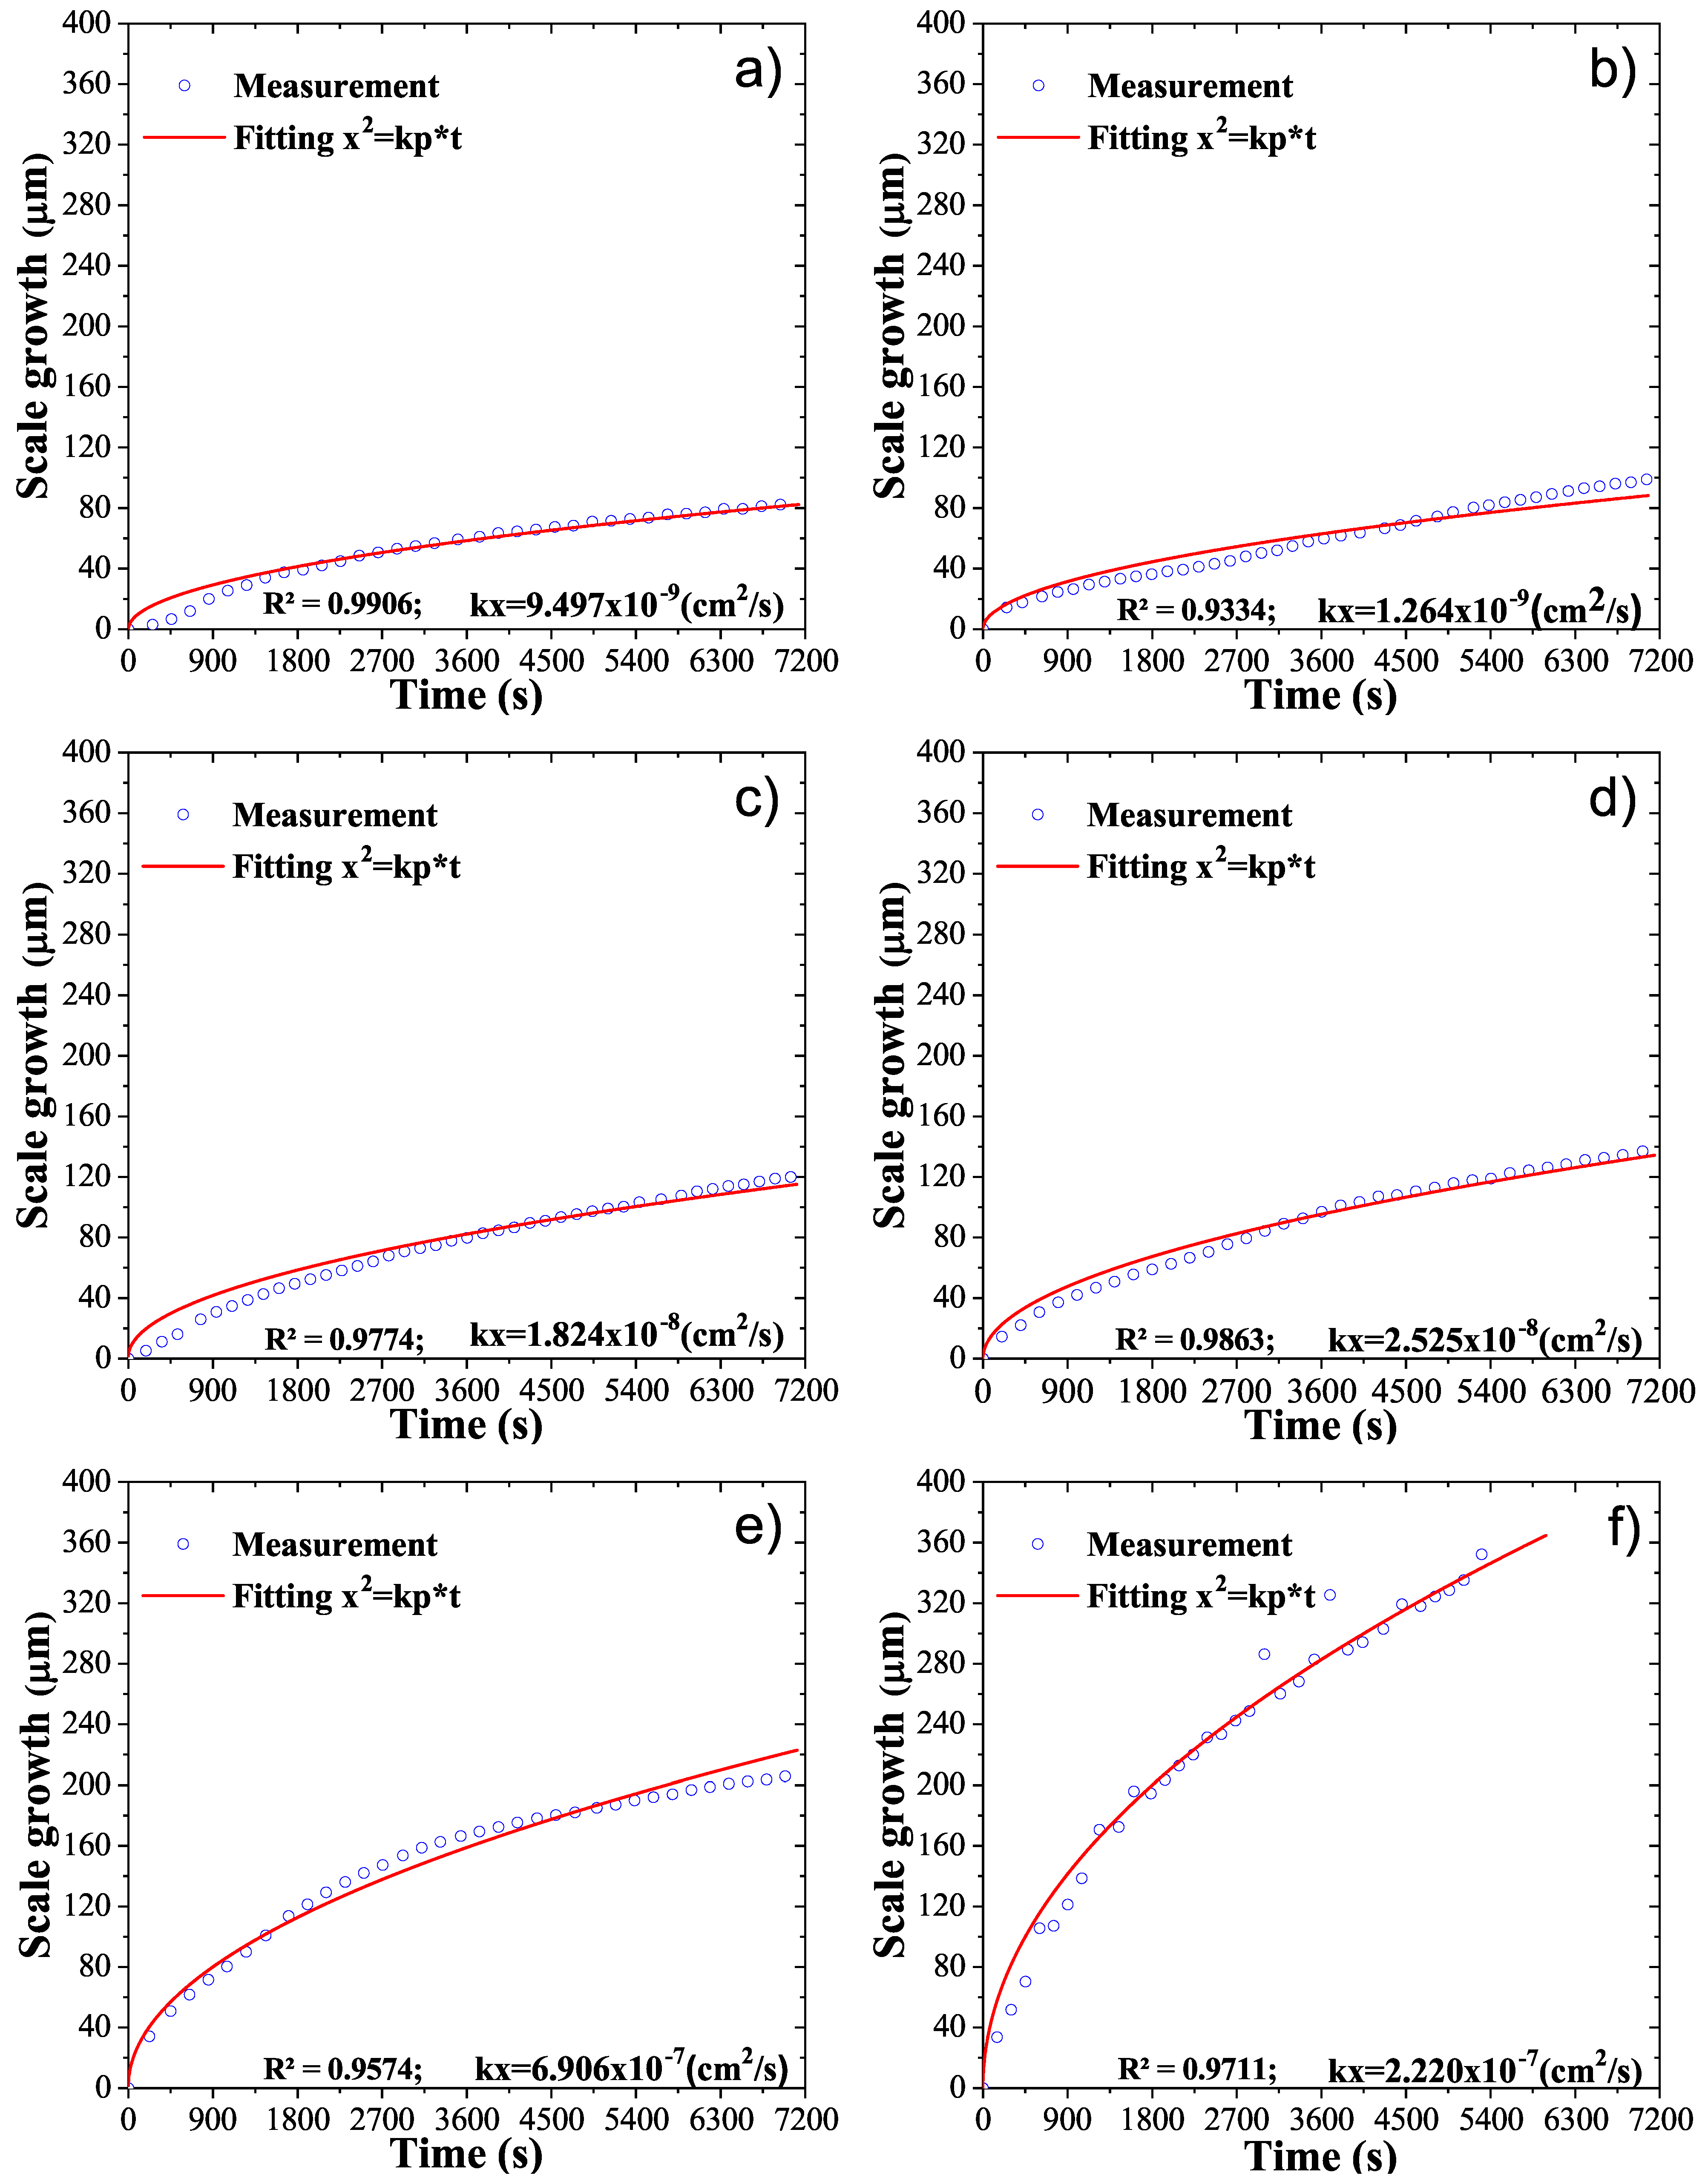
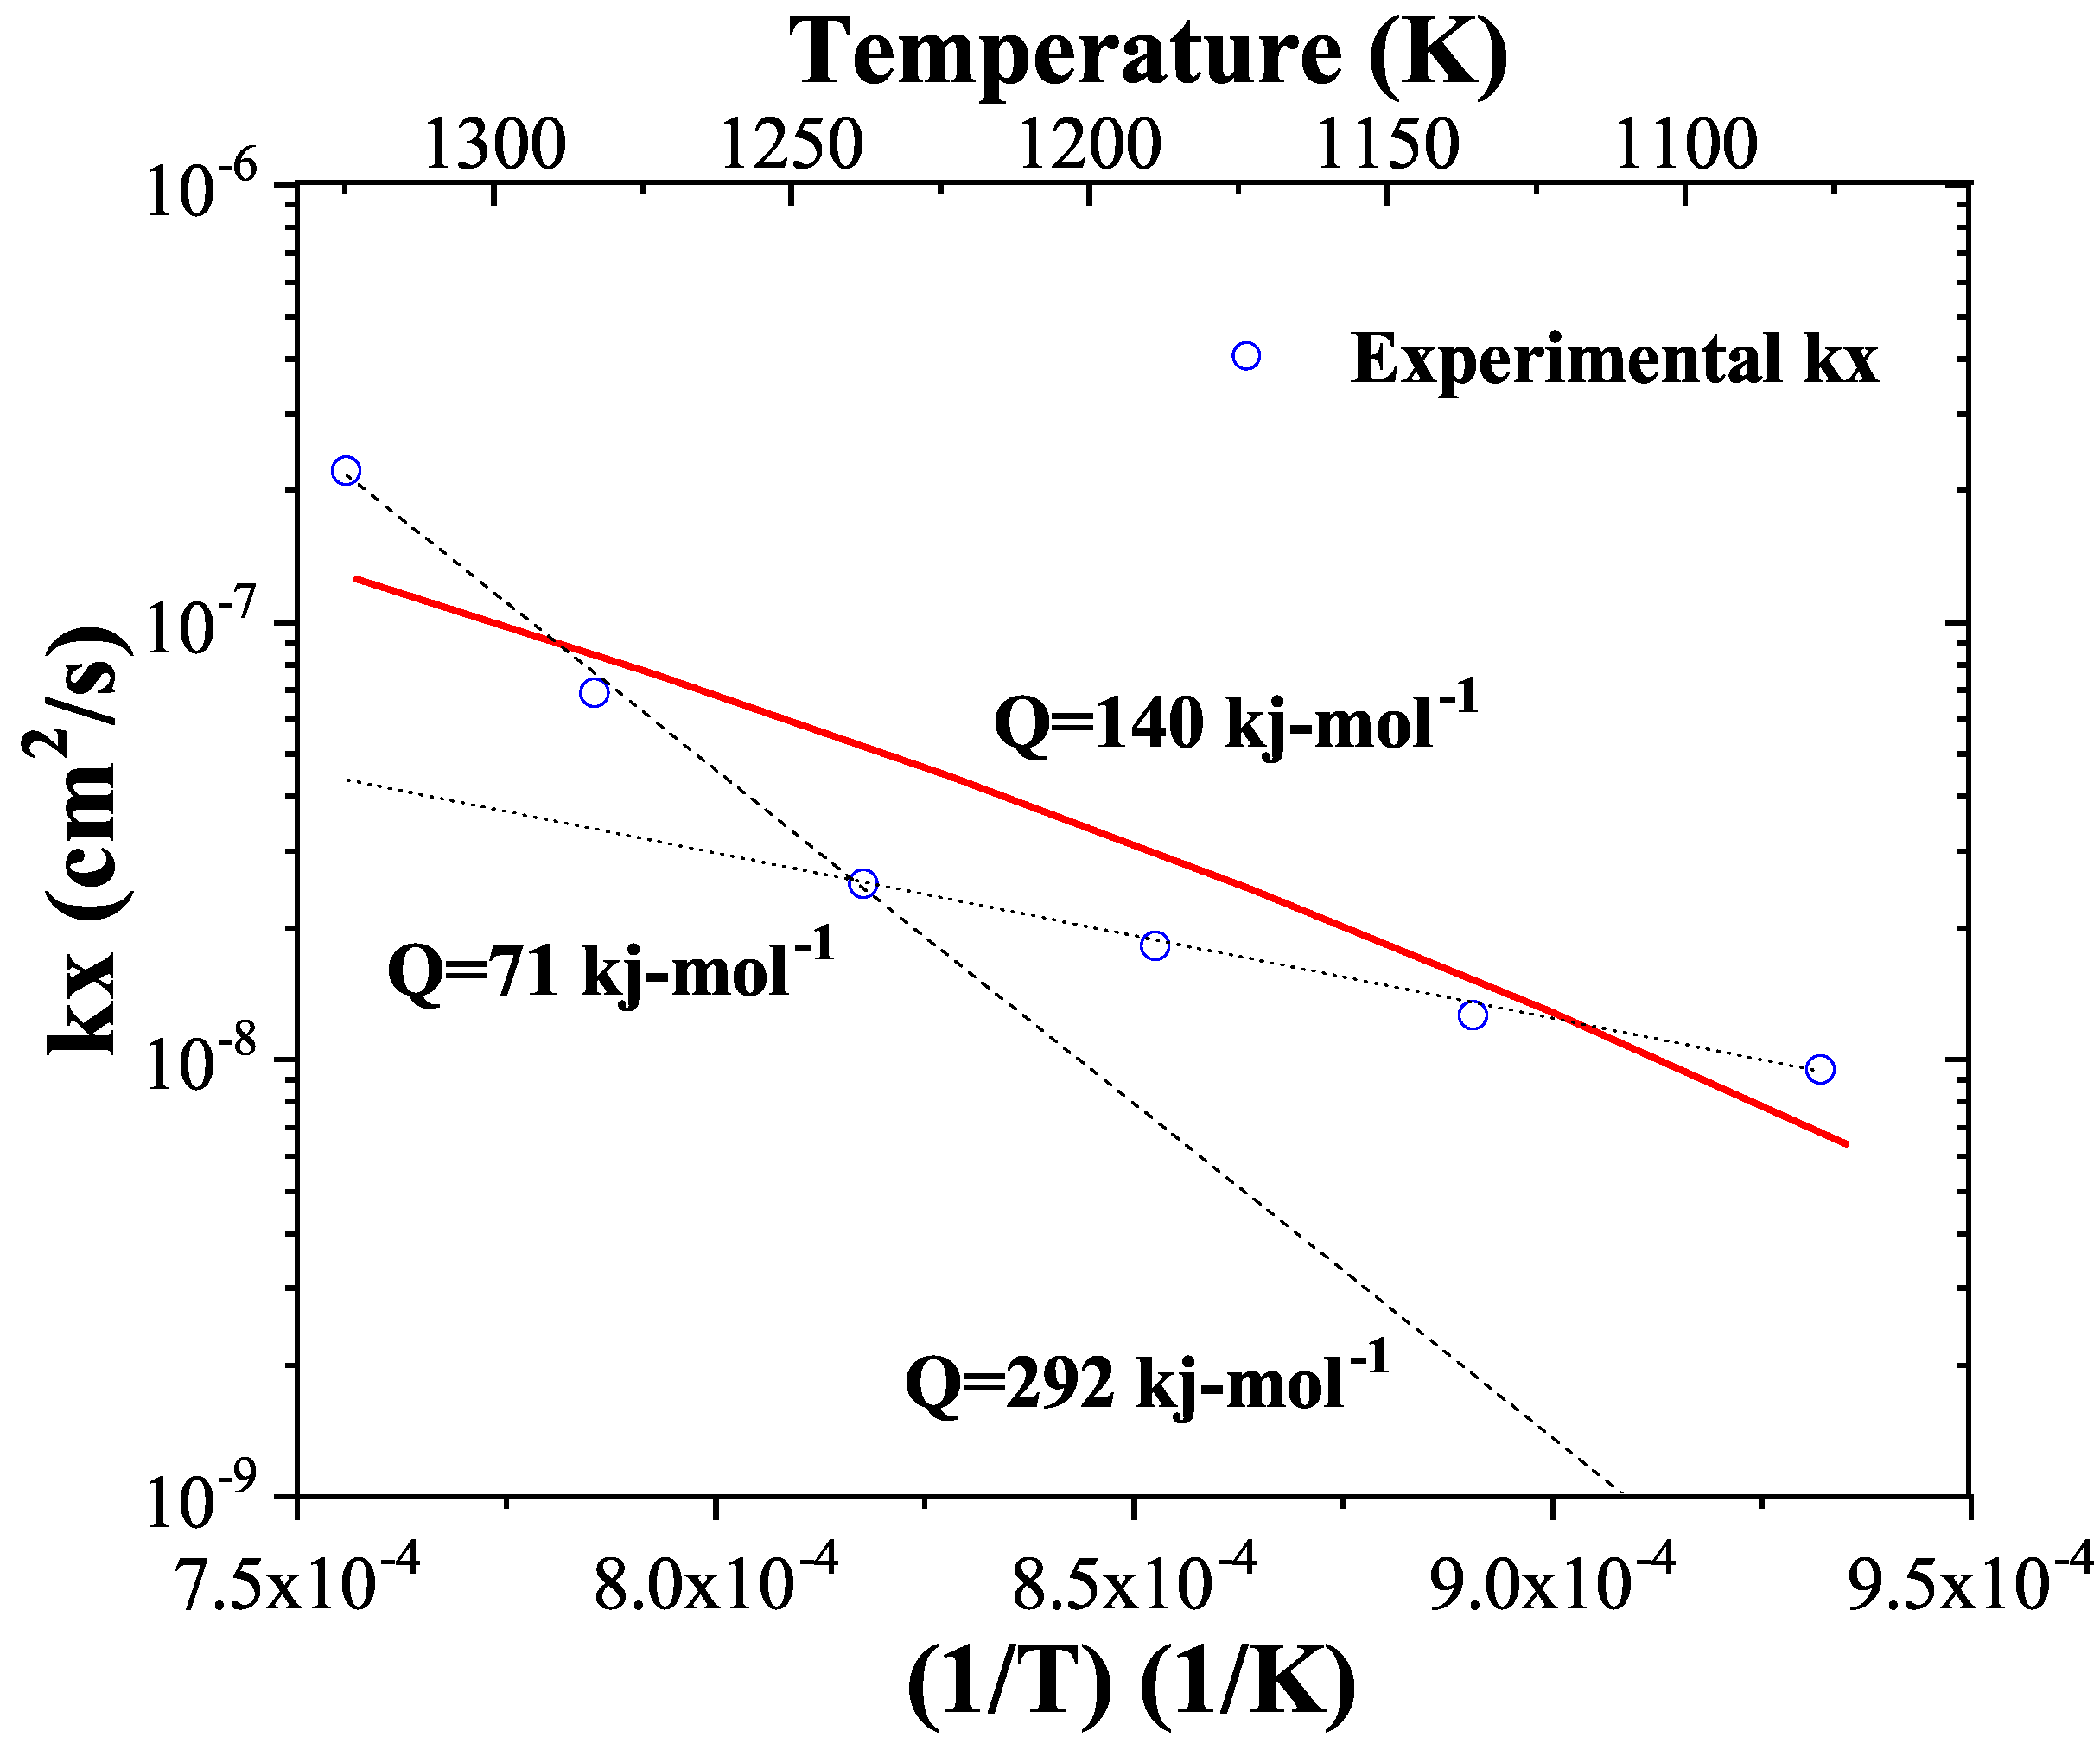
To determine the oxidation kinetics, 34 mm long hollow cylindrical specimens of 7.05 and 5 mm in external and internal diameter, respectively, were used with a notch in the middle section, as indicated in Figure 1. The specimens were manufactured with low-carbon steel; the chemical composition is indicated in Table 1. The dimensions and material composition of the speciment were selected to avoid oxide blistering. Two types of mechanisms have been reported for the blister formation: (i) gas generation from steel at the interface with scale and (ii) the growth stress due to scale formation. The stresses are minimized in the present experiments due to the small geometry of the specimen and the process being isothermal (avoiding thermal gradients). The gas generation is minimized because it is a low-carbon steel (the oxide blistering is known to affect high-carbon steel). Furthermore, the alloying elements increase the scale adherence, specifically, it is known that Mn increases the adherence of the scale as shown in [26].
The oxidation experiments were performed in still laboratory air ( O 2 = 20.3% and humidity = 42%). Two types of tests were carried out to determine the oxidation kinetics; (1) reproducibility test at constant temperature (850 and 1000 C) during 1200 s, 2400 s, 3600 s and 4800 s; (2) oxidation tests at 800, 850, 900, 950, 1000, and 1050 C with a duration of 7200 s. The sampling rate was maintained at one data per second in both cases with a heating rate of 50 C · s 1 to avoid the oxide layer growth during heating.
During the oxidation tests an experimental Joule heating device able to measure the oxide layer growth at high temperature in situ was employed. The device consists of a power supply, a cooling system and, measurement and data control system. The power supply of 2.8 kW is coupled to a copper jaws system that acts as electrodes to transfer electrical current to the specimen. The cooling system recirculates water by means of a peristaltic pump at constant flow (2 L · min 1 ) through the jaws.
The cooling of the jaws causes a heat sink at the specimen ends and together with the heat loss by convection and radiation to the environment, generate a parabolic and symmetrical thermal profile, where the highest temperature is present in the middle section of the specimen; in this point the oxide layer growth and temperature are measured using a laser micrometer and an infrared pyrometer, respectively. The schematic of the experimental device is shown in Figure 2.
The oxide layer measurement and control system is comprised of the laser micrometer and the infrared pyrometer, with a temperature range between 250 and 1800 C and spatial resolution of 0.2 μ m . The measurement system is embedded in a National Instrument® NI cRIO 9076 Compact RIO data acquisition system and controlled by LabVIEW® 2018. On the other hand, the geometry of the specimen (notch section) causes a decrease in the power required during heating, inducing a temperature concentration zone called the hot zone, which is characterized by being fully isothermal in the radial direction due to the thickness of the specimen. The laser micrometer measurements are used to calculate the oxide layer thickness generated by the interaction between the specimen surface and oxidizing medium at high temperature. The measurements could change as a function of the time during heating to the test temperature due to three factors: (1) thermal expansion (dilation), (2) phase transformation, and (3) previous surface oxidation; therefore, the heating was not considered for the oxidation analysis. Only the data after the specimen reached the test temperature were considered.
During oxidation, the thermal properties of the material are modified when other phases or oxides are present, as mentioned by Torres et al. [27]. Therefore, to control the amount of current supplied to the specimen as a function of the temperature, a PID controller integrated into the embedded system was used.

3. Results

Figure 3 shows the thickness measurement at each temperature and time for the reproducibility test. In Figure 3a at temperature of 850 C, the curves do not overlap at the beginning, but the growth rate is preserved with the same behavior, while at 1000 C, a similar behavior is observed, as shown in Figure 3b. The measurements in both cases maintain the trend in the growth rate of the oxide layer. The results in Figure 3 show that the oxide layer measurement is reproducible with minimal variations in the oxide layer growth trend.
During the oxidation tests, the heating rate was kept constant at 50 C · s 1 until the isothermal test temperature was reached. The cooling also occurs fast; in the moment of suspending the current, the generation of heat by the Joule effect stops, and the cooling is controlled by the heat conduction of the specimen toward the jaws and the convection with the environment. Figure 4 shows the Joule heating of the specimens at different temperatures. The specimens are kept for two hours under isothermal conditions, except for the test at 1050 C, with a shorter duration because the oxide layer growth consumes the specimen in the notch area, and the specimen melts due to the increase in the electrical current density.
Figure 5 shows oxide layer growth at temperatures from 800 to 1050 C. First, for Figure 5a–d, in a temperature range between 800 and 950 C, an inflexion point is observed where the growth rate of the oxide layer changes. Liu et al. have identified this change in oxidation rate behavior as the fracture of the protective layer produced by alloying elements such as silicon [18]. The change in the behavior of the oxide layer occurs at different times depending on the temperature. For example, at 850 C, the change occurs at 2250 s, observing that as the temperature increases, the time for the inflection point decreases. For temperatures of 1000 and 1050 C, there is no change in the behavior of the oxide layer, which results in a parabolic behavior from the beginning of the test because the oxidation process accelerates as the temperature increases; the oxidation becomes more severe, and the protective layer does not appear. The results obtained show that the growth of the oxide layer conforms to the parabolic model, and the rate of oxide generation increases as a function of temperature; at the temperature of 1000 C, an oxide layer 200 μ m thick is generated, as can be seen in Figure 5e. For the case of 1050 C shown in Figure 5f, the specimen does not finish the test, and the experiment ends at 5800 s, since the cross-section of the specimen through which the electric current circulates decreases due to oxidation, causing the local temperature to increase markedly (increase in current density) until the specimen melts in the middle of the notch, obtaining a final thickness of 360 μ m .
In order to determine the kinetic parameter k x as a function of temperature, the experimental data were fitted with the parabolic model of oxide layer growth shown in Equations (2) and (3), considering that the initial thickness of the oxide layer equals zero x 0 2 = 0 . The values obtained are shown in Figure 6, where the change in the growth rate of the oxide layer is observed at 950 C, with an activation energy of 71 kJ · mol 1 for temperatures below 950 C and 292 kJ · mol 1 for temperatures above 950 to 1050 C. In addition, two slopes associated with each stage are observed. The two slopes indicate a change in the oxidation mechanism when the temperature increases above 950 C due to changes in the oxidation product, type of iron oxide formed, or oxides associated with alloying elements. Wustite is the predominant phase at temperatures below 1000 C; at higher temperatures, the percentages of hematite and magnetite increase [28]. This change in the composition of the oxide contributes to the observation of the two stages in Figure 6.
The kinetic parameters that describe the growth rate of the oxide layer in the different temperature ranges are shown in Equations (4) and (5), for temperature ranges of 800–950 and 950–1050 C, respectively.
k x = 3 · 10 5 e x p 71 R T
k x = 72 · 10 3 e x p 292 R T
The average activation energy in the range from 800 to 1050 C is shown by the red line in Figure 6, obtaining Equation (6). This average value does not represent the oxidation in two stages as a function of temperature.
k x = 0.0421 e x p 140 R T
It should be noted that the average activation energy for oxidation is 140 kJ · mol 1 and was compared with other reported energies, whose values are between 73 and 180 kJ · mol 1 under different conditions [29,30,31,32,33,34,35,36]. The value obtained is very similar to those previously reported and is in the range of energies, especially the value found by Suárez et al. [37] of 134.8 kJ · mol 1 for temperatures lower than 950 C and 128 kJ · mol 1 between 950 and 1150 C. The activation energy obtained for a temperature below 950 C is within the range, while the activation energy from 950 to 1050 C in this study is higher than the reported values. The change in the slope of Figure 6 (around 950 C) can be explained as a result of melting of Fe 2 SiO 4 , as described in Suarez et al. [38]. In the work of Suarez et al., there is an abrupt increase in K x around 1177 C attributed to the melting of Fe 2 SiO 4 . The change at 950 C in the present investigation can be attributed to the presence of phosphorus. The melting point of Fe 2 SiO 4 decreases to 954 C in the presence of phosphorus (0.115 wt %) in a low-carbon steel as reported by Yuan et al. [39].

4. Conclusions

In the present work, an alternative method is presented to estimate the kinetic oxidation parameters k x in low-carbon steel. The experimental method to obtain the oxidation kinetics is based on the measurement of the oxide layer thickness, identifying a parabolic scale growth at different temperatures, a result of the measurement in situ at high frequency. The measurements showed good reproducibility, and the results are in agreement with previous studies. The results obtained show a change in the oxidation mechanism with increasing temperature because the activation energies in certain intervals change in magnitude possibly due to the melting of Fe 2 SiO 4 . This observation is consistent with previous investigations. The results show an activation energy of 71 kJ · mol 1 for temperatures between 800 and 950 C and of 292 kJ · mol 1 for the range between 950 and 1050 C. The average activation energy was 140 kJ · mol 1 for a range from 800 to 1050 C.

Author Contributions

Conceptualization, S.A.A.-V., H.J.V.-H., G.S.-D. and O.V.-G.; methodology, S.A.A.-V., H.J.V.-H. and O.V.-G.; validation, S.A.A.-V., H.J.V.-H. and O.V.-G.; formal analysis, G.M.C.-C., S.A.A.-V., A.P.-A. and O.V.-G.; investigation, S.A.A.-V., A.P.-A., G.M.C.-C. and O.V.-G.; resources, H.J.V.-H.; data curation, G.M.C.-C., S.A.A.-V. and O.V.-G.; writing—original draft preparation, S.A.A.-V. and A.P.-A.; writing—review and editing, S.A.A.-V., A.P.-A. and O.V.-G.; visualization, G.M.C.-C., H.J.V.-H., G.S.-D. and O.V.-G.; supervision, H.J.V.-H. and G.S.-D.; project administration, H.J.V.-H.; funding acquisition, H.J.V.-H. All authors have read and agreed to the published version of the manuscript.

Funding

This research received no external funding.

Institutional Review Board Statement

Not applicable.

Informed Consent Statement

Not applicable.

Data Availability Statement

Not applicable.

Acknowledgments

The authors thank CoNaCyT and PRODEP for their continuous support to the Mechanical Engineering Department of UAdeC. The authors thank the National Laboratory SEDEAM-CONACYT for the use of the equipment acquired with the projects 235780, 271878, and 282357.

Conflicts of Interest

The authors declare no conflict of interest.

References

  1. Ormerod IV, R.; Becker, H.; Grandmaison, E.; Pollard, A.; Sobiesiak, A. Effect of process variables on scale formation in steel reheating. J. Chem. Eng 1997, 75, 402–413. [Google Scholar] [CrossRef]
  2. WOLF, M.M. Scale formation and descaling in continuous casting and hot rolling. Ironmak. Steelmak. 2000, 27, 67–68. [Google Scholar]
  3. Rdcis, S.; Sail, B. A review on: Efficient energy optimization in reheating furnaces. In Proceedings of the 16th IRF International Conference, Pune, India, 14 December 2014. [Google Scholar]
  4. Liu, X.; Sun, B.; Wang, J.; Cao, G. Research progress of high temperature iron oxide scale of steel and iron material during hot rolling. Hot Work Technol. 2018, 47, 10–19. [Google Scholar]
  5. Cheng, L.; Sun, B.; Du, C.; Gao, W.; Cao, G. High-Temperature Oxidation Behavior of Fe–10Cr Steel under Different Atmospheres. Materials 2021, 14, 3453. [Google Scholar] [CrossRef] [PubMed]
  6. Ding, M.; Ding, B.; Guan, J. Effect of heating temperature on scale pf W470 high-silicon steel continuous casting billet. Heat. Treat. Met. 2014, 39, 45–48. [Google Scholar]
  7. Tanei, H.; Kondo, Y. Strain development in oxide scale during phase transformation of FeO. ISIJ Int. 2017, 57, 506–510. [Google Scholar] [CrossRef] [Green Version]
  8. Shizukawa, Y.; Hayashi, S.; Yoneda, S.; Kondo, Y.; Tanei, H.; Ukai, S. Mechanism of magnetite seam formation and its role for FeO scale transformation. Oxid. Met. 2016, 86, 315–326. [Google Scholar] [CrossRef]
  9. Chen, R.; Yeun, W. Review of the high-temperature oxidation of iron and carbon steels in air or oxygen. Oxid. Met. 2003, 59, 433–468. [Google Scholar] [CrossRef]
  10. Blazevic, D.T. Rolled in Scale–the Consistent Problem. In Proceedings of the 4 th International Steel Rolling Conference–the Science and Technology of Flat Rolling, Deauville, France, 1–3 June 1987; Volume 1. [Google Scholar]
  11. Suarez, L.; Houbaert, Y.; Eynde, X.V.; Colás, R. High temperature deformation of oxide scale. Corros. Sci 2009, 51, 309–315. [Google Scholar] [CrossRef]
  12. Qiu, H.X.; Hu, X.J.; Chen, S.H.; Fang, F. Study on Growth of Oxide Scale on High Carbon Steel at High Temperature. Appl. Mech. Mater. 2012, 148, 34–37. [Google Scholar] [CrossRef]
  13. Schwenk, W.; Rahmel, A. Theoretical considerations on phase boundary reactions and mass transfer during the oxidation of iron. Oxid. Met. 1986, 25, 293–303. [Google Scholar] [CrossRef]
  14. Cramer, S.D.; Covino, B.S., Jr. Corrosion: Fundamentals, Testing, and Protection; ASM International: Novelty, OH, USA, 2003; pp. 122–123. ISBN 978-1-62708-182-5. [Google Scholar]
  15. Hrabovskỳ, J.; Dobeš, F.; Horskỳ, J. Small Punch Tests at Oxide Scales Surface of Structural Steel and Low Silicon Steel. Oxid. Met. 2014, 82, 297–310. [Google Scholar] [CrossRef]
  16. Meetham, G. High-temperature materials—A general review. J. Mater. Sci. 1991, 26, 853–860. [Google Scholar] [CrossRef]
  17. Evans, H.; Hilton, D.; Holm, R.; Webster, S. Influence of silicon additions on the oxidation resistance of a stainless steel. Oxid. Met. 1983, 19, 1–18. [Google Scholar] [CrossRef]
  18. Liu, X.j.; He, Y.Q.; Cao, G.M.; Jia, T.; Wu, T.Z.; Liu, Z.Y. Effect of Si content and temperature on oxidation resistance of Fe-Si alloys. J. Iron Steel Res. Int. 2015, 22, 238–244. [Google Scholar] [CrossRef]
  19. Bedworth, R.; Pilling, N. The oxidation of metals at high temperatures. J. Inst. Met. 1923, 29, 529–582. [Google Scholar]
  20. Tammann, G. Über Anlauffarben von metallen. Z. Anorg. Und Allg. Chem. 1920, 111, 78–89. [Google Scholar] [CrossRef]
  21. Sheasby, J.; Boggs, W.; Turkdogan, E. Scale growth on steels at 1200 C: Rationale of rate and morphology. Met. Sci. J. 1984, 18, 127–136. [Google Scholar] [CrossRef]
  22. Cheng, X.; Jiang, Z.; Wei, D.; Hao, L.; Zhao, J.; Jiang, L. Oxide scale characterization of ferritic stainless steel and its deformation and friction in hot rolling. Tribol. Int. 2015, 84, 61–70. [Google Scholar] [CrossRef] [Green Version]
  23. Cheng, X.; Jiang, Z.; Wei, D.; Zhao, J.; Monaghan, B.J.; Longbottom, R.J.; Jiang, L. Characteristics of oxide scale formed on ferritic stainless steels in simulated reheating atmosphere. Surf. Coat. Technol. 2014, 258, 257–267. [Google Scholar] [CrossRef] [Green Version]
  24. Abuluwefa, H.; Guthrie, R.; Ajersch, F. The effect of oxygen concentration on the oxidation of low-carbon steel in the temperature range 1000 to 1250 C. Oxid. Met. 1996, 46, 423–440. [Google Scholar] [CrossRef]
  25. Hu, X.j.; Zhang, B.m.; Chen, S.h.; Fang, F.; Jiang, J.q. Oxide scale growth on high carbon steel at high temperatures. J. Iron Steel Res. Int. 2013, 20, 47–52. [Google Scholar] [CrossRef]
  26. Krzyzanowski, M.; Beynon, J.H.; Farrugia, D.C. Oxide Scale Behavior in High Temperature Metal Processing; John Wiley & Sons: Hoboken, NJ, USA, 2010. [Google Scholar]
  27. Torres, M.; Colas, R. A model for heat conduction through the oxide layer of steel during hot rolling. J. Mater. Process. Technol. 2000, 105, 258–263. [Google Scholar] [CrossRef]
  28. Basabe, V.V.; Szpunar, J.A. Growth rate and phase composition of oxide scales during hot rolling of low carbon steel. ISIJ Int. 2004, 44, 1554–1559. [Google Scholar] [CrossRef] [Green Version]
  29. Abuluwefa, H.; Guthrie, R.; Ajersch, F. Oxidation of low carbon steel in multicomponent gases: Part I. Reaction mechanisms during isothermal oxidation. Metall. Mater. Trans. 1997, 28, 1633–1641. [Google Scholar] [CrossRef]
  30. Birks, N.; Nicholson, A. The Journal of the Iron and Steel Institute; Iron and Steel Institute: London, UK, 1970; p. 219. [Google Scholar]
  31. Browne, K.W.; Dryden, J.; Assefpour, M. Modelling Scaling and Descaling in Hot Strip Mills. Recent advances in heat transfer and micro-structure modelling for metal processing. In Proceedings of the 1995 ASME International Mechanical Engineering Congress and Exposition, San Francisco, CA, USA, 12–17 November 1995; Volume 67, pp. 187–198. [Google Scholar]
  32. Kubaschewski, O.; Hopkins, B.E. Oxidation of Metals and Alloys; Butterworths: London, UK, 1967. [Google Scholar]
  33. Paidassi, J. Oxidation of iron in air between 700C and 1250C. Mem. Sci. Rev. Met. 1957, 54, 569585. [Google Scholar]
  34. Stanley, J.; Vonhoene, J.; Huntoon, R. The oxidation of pure iron. Trans. ASM 1951, 43, 426–453. [Google Scholar]
  35. Munther, P.A.; Lenard, J.G. The effect of scaling on interfacial friction in hot rolling of steels. J. Mater. Process. Technol. 1999, 88, 105–113. [Google Scholar] [CrossRef]
  36. Samsonov, G. The Oxide Handbook; Springer Science & Business Media: Cham, Switzerland, 2013. [Google Scholar]
  37. Suárez, L.; Houbaert, Y.; Eynde, X.V.; Colás, R. Development of an experimental device to study high temperature oxidation. Oxid. Met. 2008, 70, 1–13. [Google Scholar] [CrossRef]
  38. Suárez, L.; Rodríguez-Calvillo, P.; Houbaert, Y.; Colás, R. Oxidation of ultra low carbon and silicon bearing steels. Corros. Sci. 2010, 52, 2044–2049. [Google Scholar] [CrossRef]
  39. Yuan, Q.; Xu, G.; Zhou, M.; He, B.; Hu, H. The effect of p on the microstructure and melting temperature of Fe2SiO4 in silicon-containing steels investigated by in situ observation. Metals 2017, 7, 37. [Google Scholar] [CrossRef] [Green Version]
Figure 1. Schematic of the specimen used to determined the oxidation kinetics, in mm.
Metals 12 00147 g001
Figure 2. Schematic of the experimetal device employed to measure the oxide layer.
Metals 12 00147 g002
Figure 3. Oxide layer growth for reproducibility testing at: (a) 850 and (b) 1000 C, during 1200, 2400, 3600, and 4800 s.
Metals 12 00147 g003
Figure 4. Thermal history measured in the middle of the notch for different oxidation tests.
Metals 12 00147 g004
Figure 5. Oxide layer growth at different temperatures (a) 800 C, (b) 850 C, (c) 900 C, (d) 950 C, (e) 1000 C, and (f) 1050 C.
Metals 12 00147 g005
Figure 6. Activation energies by the Arrhenius equation and the kinetic parameters k x at different temperatures.
Metals 12 00147 g006
Table 1. Chemical composition of low carbon steel in wt %.
CMnPSSiCuNiCrSnMoAlV
0.071.430.250.250.830.080.080.080.010.010.010.015
Publisher’s Note: MDPI stays neutral with regard to jurisdictional claims in published maps and institutional affiliations.

