Article

Effect of Preheating on Martensitic Transformation in the Laser Beam Welded AH36 Steel Joint: A Numerical Study

1
School of Materials Science and Engineering, Nanjing University of Science and Technology, Nanjing 210094, China
2
Key Laboratory of Controlled Arc Intelligent Additive Manufacturing, Nanjing 210094, China
3
Jiangsu Jingning Intelligent Manufacturing Co., Ltd., Jingjiang 225300, China
*
Author to whom correspondence should be addressed.
Metals 2022, 12(1), 127; https://doi.org/10.3390/met12010127
Submission received: 14 December 2021 / Revised: 4 January 2022 / Accepted: 6 January 2022 / Published: 9 January 2022

Abstract

:
In this work, the effects of preheating temperatures on martensitic transformations in a laser beam-welded AH36 steel joint were observed using a numerical study. In the same weld, the martensitic contents increased slightly from the upper area, the middle area to the lower area, and simulated martensite contents in the fusion zone were slightly lower than that in the HAZ (Heat Affected Zone). Under different preheating temperatures, simulated martensitic contents decrease with the increase of the preheating temperature. According to the simulated results, the average cooling rate and the CCT (Continuous Cooling Transformation) diagram were drawn to analyze the relationships between preheating temperatures and martensitic transformations. Simulated martensitic contents agreed well with the experimental metallographic microstructures. Moreover, the measured microhardness was reduced with the increasing preheating temperature, and measured microhardness in HAZ was higher than that in the fusion zone. The accuracy of the simulation results was further confirmed. The main significance of this work is to provide a numerical model to design martensitic contents in order to control the performances of the weld, avoiding many tests.

1. Introduction

AH36 steels are widely used in marine structural parts due to their excellent performances and weldability [1]. As one of the most widely used joining methods, welding has been rapidly developed and widely applied in the marine industry [2,3]. Compared with traditional welding, LBW (Laser Beam Welding) owns a higher efficiency, a better welding formation, and a smaller heat input; thus, LBW has become a potential and promising jointing method for marine steel structures [4,5]. Due to the extremely fast cooling rate during LBW, martensitic transformations often occur, resulting in the appearance of a lot of martensitic phases in the weld. Martensitic transformations not only affect the residual stress [6], but also have a great influence on the performance [7]. Therefore, understanding the mechanism of martensitic transformations, and regulating the martensitic content during LBW is the research focus of many scholars.
With the development of the phase transformation model, martensitic transformations are currently studied using the numerical simulation, and the mechanism of martensitic transformation has been revealed in detail. Marques et al. [8] indicated that the finite element method had unparalleled advantages in the simulation process during welding. Mi et al. [9,10] developed a thermal–metallurgical model to simulate the temperature field, and spatial distributions of the volume fraction of martensitic phases during LBW of steels and TC4 alloys. Subsequently, Mi et al. [11] improved the thermal–metallurgical model, a mechanical model was coupled, and temperature fields, martensitic fractions, and stresses during the LBW of steels were predicted successfully. Rong et al. [12] integrated a martensitic transformation model into a finite element model to predict residual stresses using a new biconical heat source model in the laser-penetration welded EH36 steel joint. Cheon et al. [13,14] developed a finite element-austenite temperature model to calculate temperature distributions, martensitic contents and hardness in the gas metal arc welding of AH36 steels. Zhang et al. [15] used the commercial software SYSWELD to investigate residual stresses in the hybrid laser arc-welded AH36 joint, and indicated that the phase transformation had a great influence on residual stresses. Based on the Johnson–Mehl–Avrami–Kolmogorov (JMAK) equations, Siwek [16] successfully investigated martensitic transformations during the cooling of the laser beam welding of low-carbon steels.
In this work, a thermal–metallurgical model was developed to investigate the effects of preheating temperatures on martensitic transformations during LBW of AH36 steels using the software Simufact Welding. Firstly, a heat source model composed of a surface heat source and a volume heat source was used to simulate heat transfers during welding. Then, a metallurgical model was developed to simulate martensitic transformations during cooling. According to the simulated results, the average cooling rate and the CCT diagram were drawn to analyze the relationships between the preheating temperatures and martensitic transformations. Finally, welding experiments were carried out to verify the simulation results.

2. Models and Experiments

2.1. Models

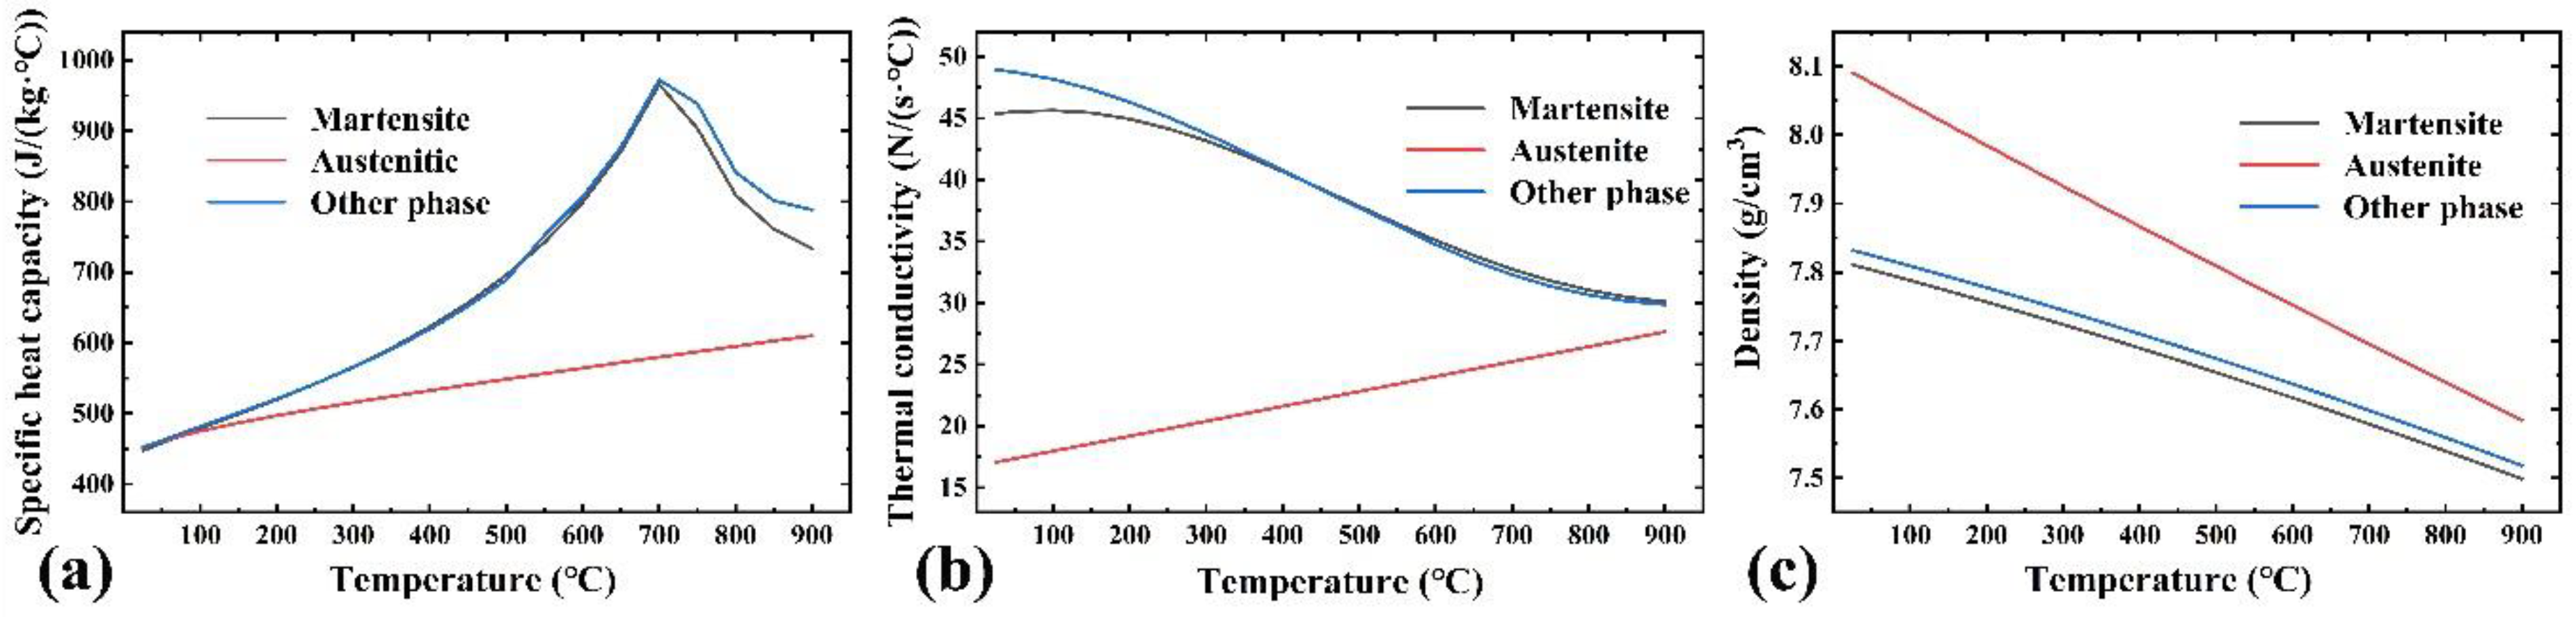
2.1.1. Thermal Model

The governing equations of heat transfers are described according to the reference manual of Simufact Welding [17]. Heat transfers follow the Fourier heat conduction differential equation [18], and the equation is given by
ρ C p ( T ) T t = x [ λ ( T ) T x ] + y [ λ ( T ) T y ] + z [ λ ( T ) T z ] + q ( x , y , z , t ) + H ( T )
where ρ is the density, λ is the thermal conductivity, C p is the specific heat capacity, [ λ ( T ) T / x ] / x , [ λ ( T ) T / y ] / y , [ λ ( T ) T / z ] / z are the heat inputs in the x ,   y ,   z directions, T is the temperature, t is the time, q ( x , y , z , t ) is the effective heat input, H is the latent heat, which includes the latent heat of solid and solid–liquid phase transformations.
The latent heat caused by solid–liquid phase transformations is generally much greater than that of solid phase transformation, so the change of H ( T ) is mainly caused by the solid–liquid transformation. In this assumed situation, H ( T ) is expressed by
H ( T ) = {                 0 i f       T < T m             H m i f       T T m
where H m is the melting latent heat and T m is the melting temperature.
During the heat transfers, the heat loss is mainly caused by emission, contact, and convection. According to the reference manual [17], the emission loss Q r * , the contact loss Q b * and the convection loss Q c * are given by
Q r * A = ϵ σ ( T W 4 T 0 4 )
Q b * A = α ( T W T 0 )
Q c * A = h ( T W T 0 )
where A is the calculated area, T W is the workpiece temperature, T 0 is the environment temperature, σ is the Stefan–Boltzmann constant, ϵ is the emission coefficient, α is the contact coefficient, and h is the convective coefficient.
According to the size of the experimental substrate, the finite element model used in simulation is established, as shown in Figure 1. The overall model is divided by hexahedral meshes. The size of the finite element mesh has a critical influence on the accuracy of the calculation results [19]. Near the weld, a smaller 0.25 mm mesh is used in the weld area to ensure the accuracy of the calculation, while a larger 4 mm mesh is used in the area away from the weld to increase the efficiency of the calculation. The numbers of elements and nodes in the model are 340,800 and 371,475, respectively. Slightly different from the heat source model commonly used at present [20,21,22], the heat source model composed of a surface heat source (Gaussian surface heat source model) and a volume heat source (Gaussian cone heat source model) [17] is used here to calculate the heat transfer during the LBW, as shown in Figure 1b. The Gaussian cone heat source model can well reflect the characteristic that the energy density during the LBW decreases with the increases of the depth; therefore, it can reflect the shape change of the keyhole better [23]. By coupling with the Gaussian surface heat source, the heat source model can more realistically reflect the welding process with a high concentration of the laser heat source [24]. The heat input q s of the surface heat source can be defined as [17]
q s = λ s π r 1 2 p T · η · k exp   ( λ s x 2 + y 2 r 1 2 )
where r 1 is the effective radius, λ s is the concentrated coefficient of the surface heat source, p T is the laser power, η is the effective coefficient of the whole heat source, and k is the percentage of the surface heat source to the whole heat source model. In addition, h 1 is the depth of the surface heat source affected. The heat input q v of the volume heat source can be defined as [17]
q v = λ b 9 η · ( 1 k ) · p T π ( 1 e 3 ) · 1 ( z 2 z 1 ) ( r 2 2 + r 2 r 3 + r 3 2 ) · e x p ( 3 r r   c 2 2 )
r c = f ( z ) = r 3 + ( r 2 r 3 ) ( z z 1 ) ( z 2 z 1 )
h 2 = z 2 z 1
where λ b is the concentrated coefficient of the volume heat source, r 2 is the upper surface radius of the cone, r 3 is lower surface radius of the cone, r c is the heat distribution coefficient as a function of the z direction, and h 2 is the depth of the volume heat source.
The simulation results would be affected by the parameters of the heat source [25], through several modifying factors; the parameters are displayed in Table 1. During the calculations, the initial temperatures of AH36 steel plates are set to 28 °C (without preheating), 78 °C, 128 °C, 180 °C and 250 °C considering preheating.

2.1.2. Metallurgical Model

The phase transformation can be divided into the austenitic transformation process during heating, and the martensitic transformation during cooling. In the Simufact Welding, the austenitizing process depends on a linear model, the linear austenitizing model assumes that austenite is 0% at the A C 1 temperature, and is 100% at the A C 3 temperature. Linear interpolation is applied to calculate the austenite content, and the relative equations are given by [17,26,27]
P A = 0   ;   i f   T ( t ) < A C 1
P A = 1   ;   i f   T ( t ) > A C 3
P A = T ( t ) A C 1 A C 3 A C 1   ; i f   A C 1 T ( t ) A C 3
where P A is the austenitic content, and T is the temperature.
According to the Koistinen–Marburger model [28], the martensitic transformation during cooling can be defined as [17]
P M = P A ( 1 e K M · ( M S T ( t ) ) )
where the starting temperature of the martensitic transformation M S can be found in ref. [29]. The higher the K M , the faster the transformation. According to the software, dynamic thermophysical properties including density, specific heat capacity and thermal conductivity are shown in Figure 2. During calculation, α , ϵ , σ and K M are given by 1000 W/(m3 · K), 0.6, 5.67 × 10⁻⁸ W/(m2∙K4), and 0.011, respectively [13]. A C 1 and A C 3 of the AH36 steel are given by 737 °C and 935 °C [29].
During simulation using the software Simufact Welding, bainitic transformations and ferrite transformations are also considered. However, the equations of bainitic and ferrite transformations are not explained in the reference of Simufact Welding. The focus of this work is to simulate the martensitic transformations during welding; thus, bainitic and ferrite transformations are not described in detail. Figure 3 shows the simulation process of martensitic transformations during welding. The thermal model is used to simulate the temperature field T. According to the value of dT/dt, heating and cooling processes are confirmed. During heating, Equations (6)–(8) are used to simulate the austenitic transformations. During cooling, martensitic transformations are simulated using Equation (9) when the peak temperature Tp > A C 1 , the cooling rate CR > CRfast (critical cooling rate).
Due to commercial interests, some details of the metallurgical model in Simufact Welding are not shown in this work. For more details, please contact Simufact Welding.

2.2. Experiments

The laser device YLS-10000 and the Precitec laser head are used to provide a laser heat source to melt the base metal (BM); its laser focal length is 300 mm, its laser wave-length is 1.064 μm, and the laser spot diameter is about 0.4 mm. The laser head is fixed to the KUKA robot to move synchronously. The size of AH36 steel plates is 150 mm × 400 mm × 6 mm. The plates are joined by butt welding without filler materials, and the gap is 0 mm. The preheating temperatures are 28 °C (without preheating), 78 °C, 128 °C, 180 °C and 250 °C respectively. In order to investigate the effects of preheating temperatures on martensitic transformations, other welding parameters remain unchanged. During experiments, the laser beam is perpendicular to BM, and the laser power is 5.5 kW, welding velocity is 1.8 m/min, and defocusing is 0 mm. The shielding gas is pure Ar, which is used to protect the molten pool, and the flow rate is 15 L/min. Before welding, BM is preheated by heated ceramic sheets by the electric power. After welding, the samples are cut by the wire cut electric discharge machine, and a series of waterproof paper-based sandpaper is used to grind the samples. The meshes of sandpaper are 240#, 400#, 600#, 800#, 1200#, and 1500#. Finally, the cross section is etched with the corrosive liquid (4%HNO3 + 96%alcohol solution) for metallographic observations, the corrosion time is about 8 s. Morphologies and microstructures of the weld are observed using an Olympus-GX41 metallographic microscope. The microhardness is measured by a Vickers hardness tester (HVS-1000Z), (CSOIF, Shanghai and China) and the force is 10 kgf (HV10), the residence time is 10 s.

3. Results and Discussion
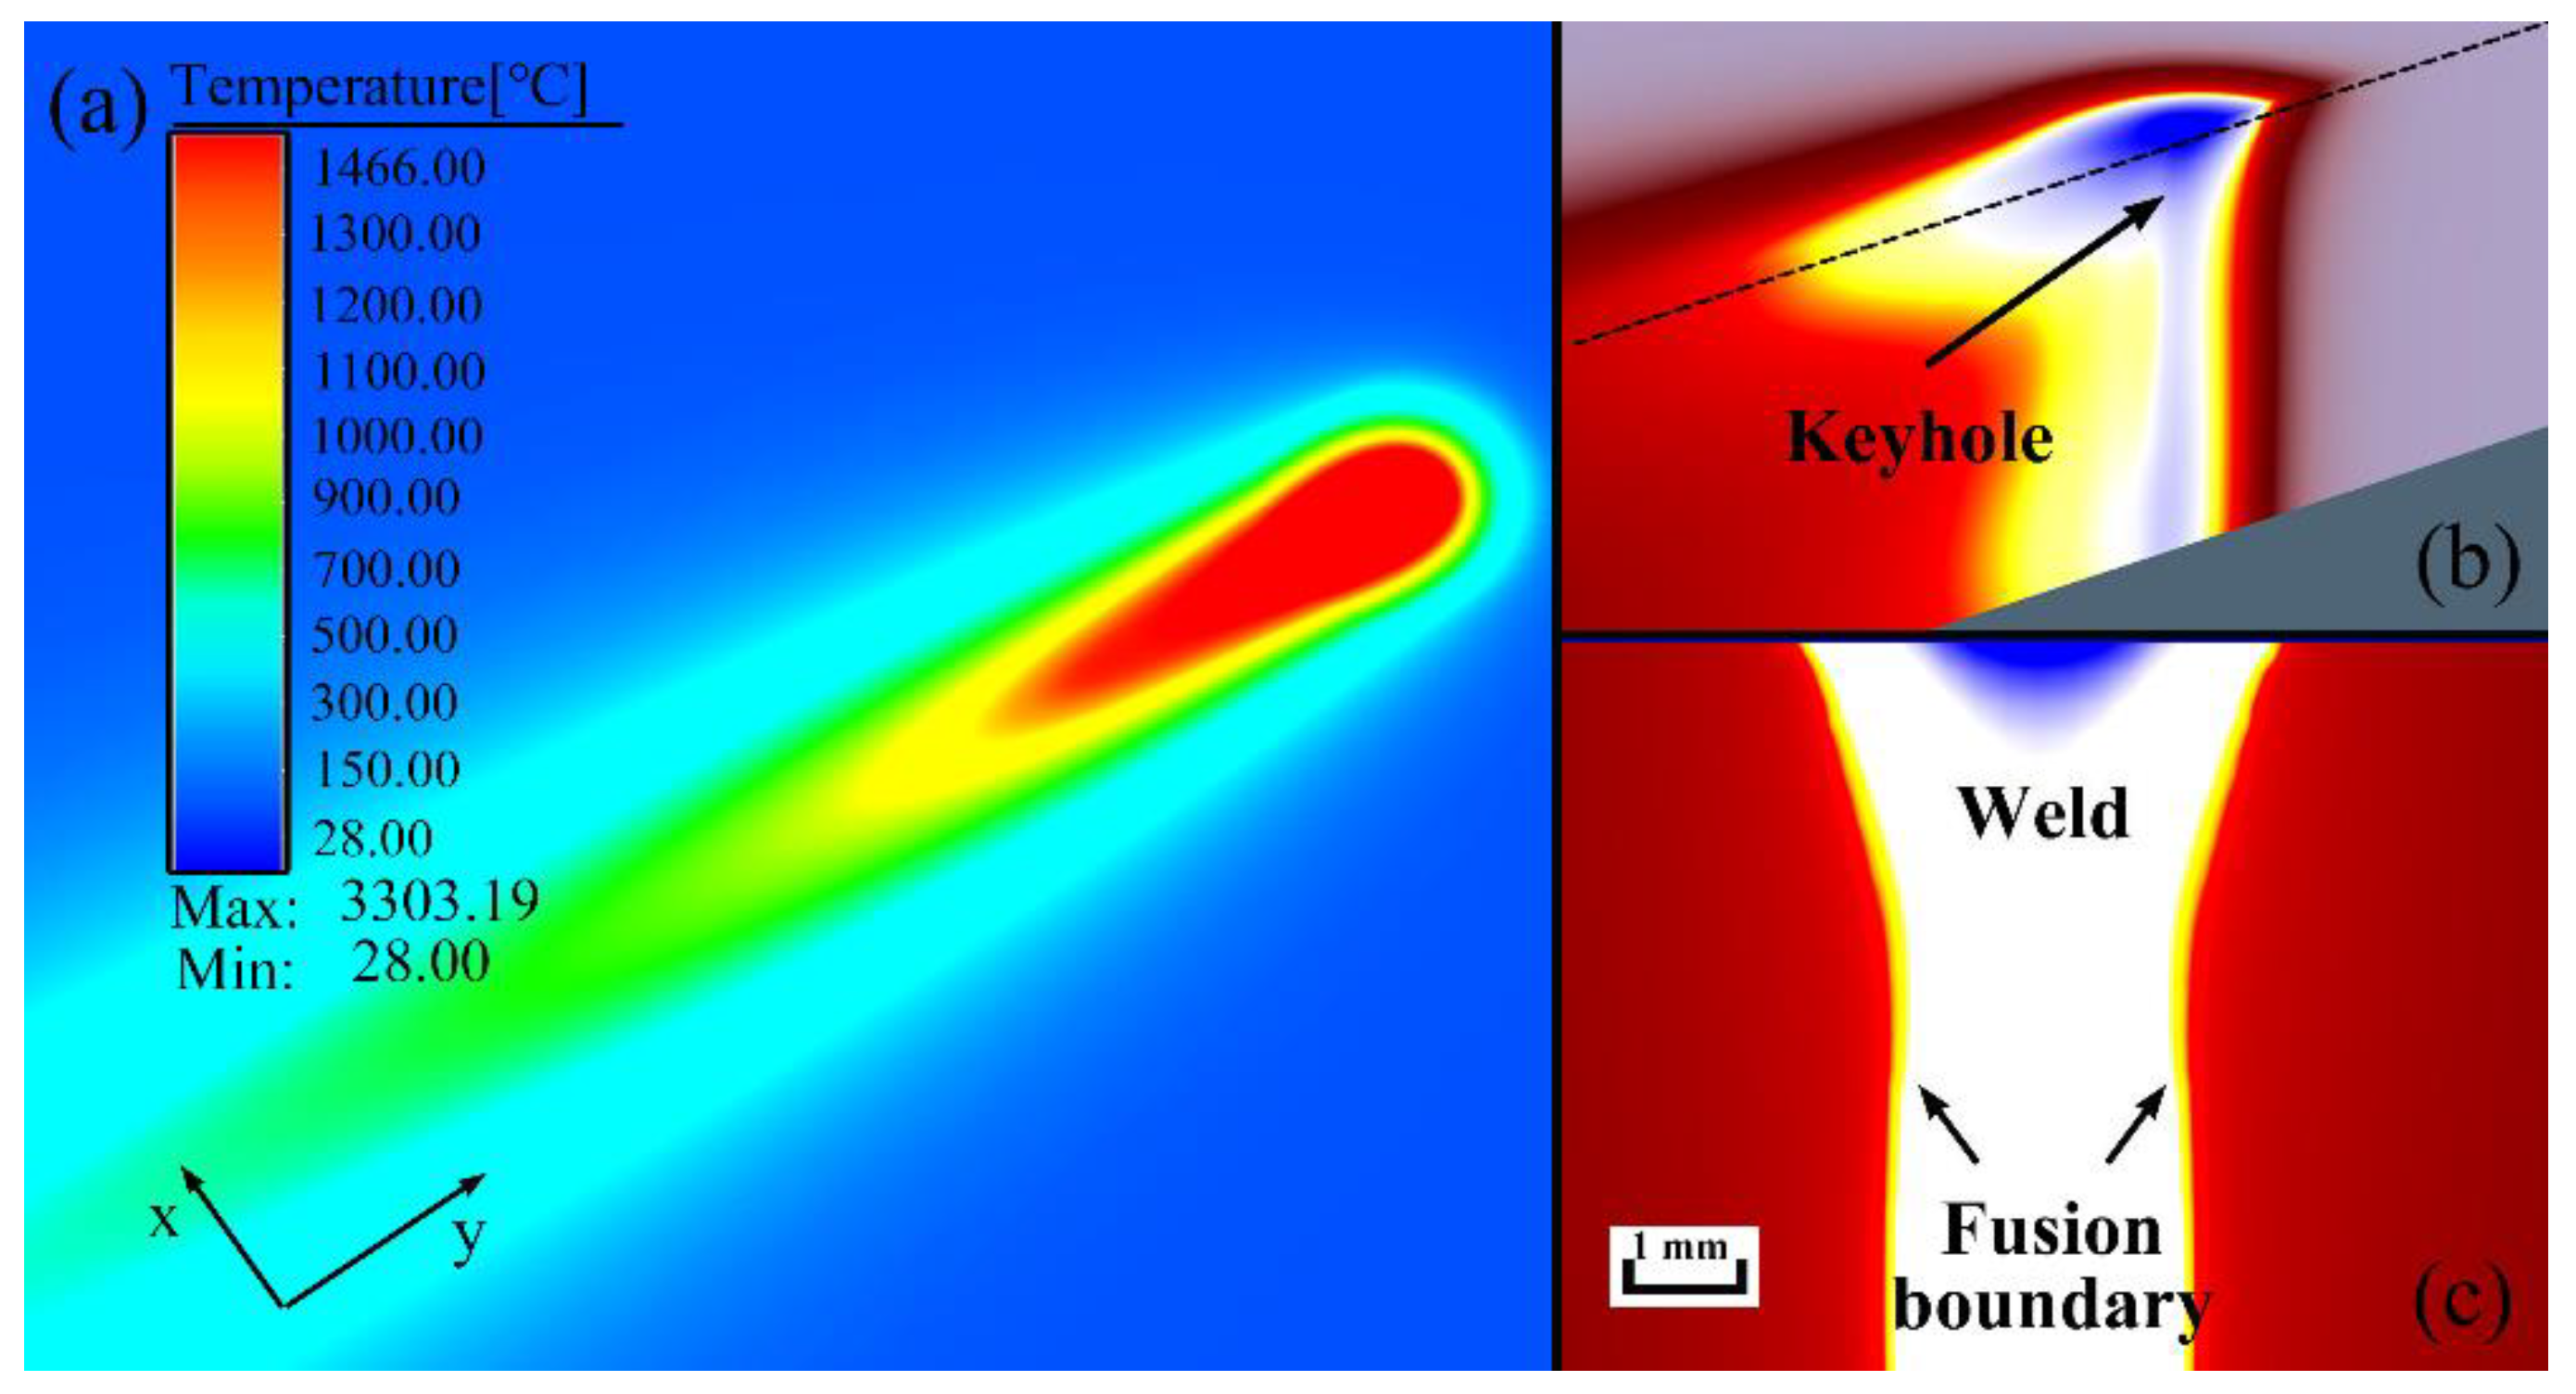
3.1. Heat Transfer

Figure 4 displays simulated heat transfers at the preheating temperature of 78 °C during LBW. Figure 4a shows temperature distributions at the upper surface; the peak temperature Tp reaches 3303 °C. Figure 4b shows the longitudinal section, the areas with a temperature higher than 2750 °C are marked in blue. The blue area is approximately considered as the keyhole because the gasification temperature of Fe is about 2750 °C. It can be clearly found that the keyhole penetrates the entire weld. Figure 4c displays the cross section. The largest weld width occurs when the keyhole has just passed, so the blue area does not penetrate the entire weld, but appears at the upper surface. Figure 5 shows comparisons of simulated and experimental welding profiles at different preheating temperatures. The cross-sectional area increases with the increasing preheating temperature. In order to quantitatively compare the simulated results with experiments, the weld widths at the upper, middle and lower positions are recorded in Figure 6. Though the simulation results are slightly different from the experimental results, the simulated weld profiles are in good agreement with the experimental measurements.

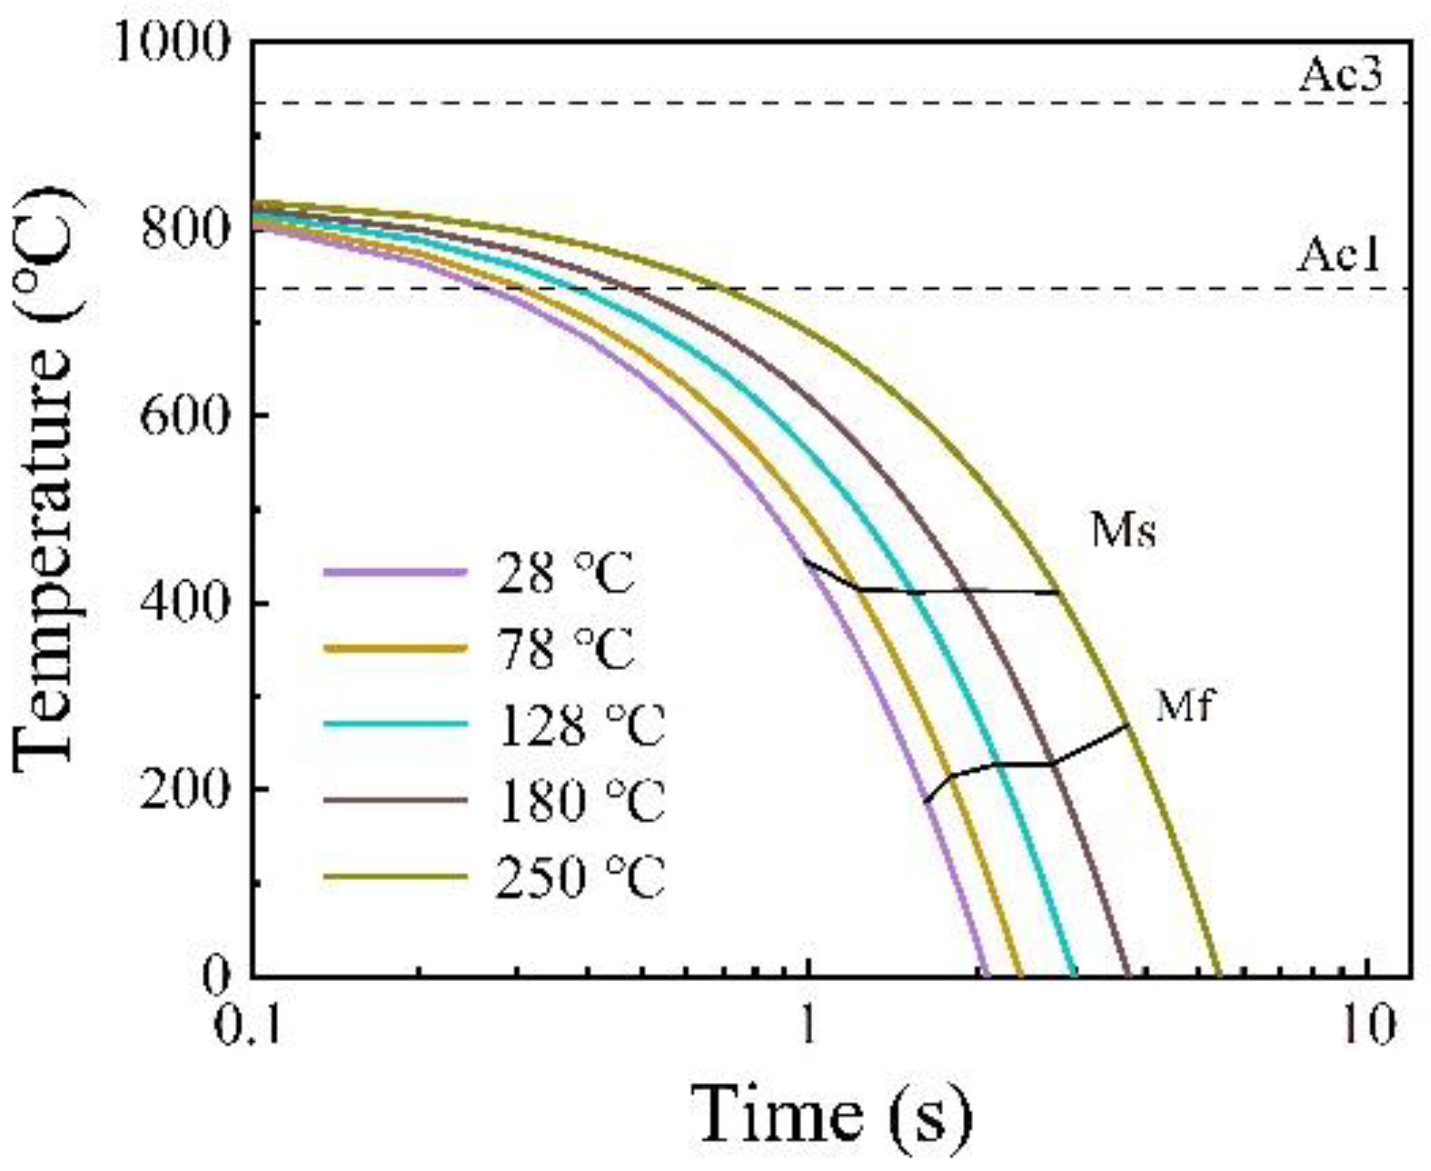
3.2. Martensitic Transformation

As shown in the Figure 7, martensitic contents at different preheating temperatures are simulated using the metallurgical model. The depth of the color in the picture represents the martensitic content. The feature points of the fusion zone (A, B, C) and the HAZ (D, E, F) are selected to track the history of martensitic contents with the time as shown in Figure 7a. Figure 8 shows the histories of martensitic contents at the feature points under different preheating temperatures. Martensitic transformations mainly depend on the cooling rate [16]. According to simulated heat transfers, the cooling rate from 800 °C to 500 °C can be calculated by
R 8 / 5 = 800 ° C 500 ° C t 8 / 5
where R 8 / 5 is considered the average cooling rate during cooling, and t 8 / 5 is the cooling time in the 800–500 °C temperature range. Figure 9 shows calculated R 8 / 5 at the feature points under different preheating temperatures. The values of R8/5 increase from points A, B to C in the same weld, as shown in Figure 9. As a result, martensitic contents also increase slightly from points A, B to C, as shown in Figure 8. Moreover, the values of R8/5 at points D, E, and F of HAZ are higher than that at the points A, B, and C of the fusion zone. Consequently, martensitic contents at points D, E, and F of HAZ are slightly larger than those at points A, B, and C of the fusion zone. The values of R8/5 at the all points decreases substantially with the increasing preheating temperature, as shown in Figure 9. Accordingly, martensitic contents at the all points also decrease obviously with the increase of the preheating temperature, as shown in Figure 8. The feature point B is selected to investigate and discuss the change in martensitic contents, with the increasing preheating temperature, in detail. As shown in Figure 8b, the calculated martensitic content at the feature point B decreases from 79.9% to 40% with the increase of the preheating temperature from 28 °C to 250 °C. According to the simulation results at the feature point B, the CCT diagram of AH36 and the cooling curves are drawn as shown in Figure 10. M S and M f are the start temperature and end temperature of the martensitic transformations, respectively. It is obvious that the temperature range of martensitic transformations decreases with the increase in the preheating temperature. As a result, the martensitic content is lower in the case of the higher preheating temperature.

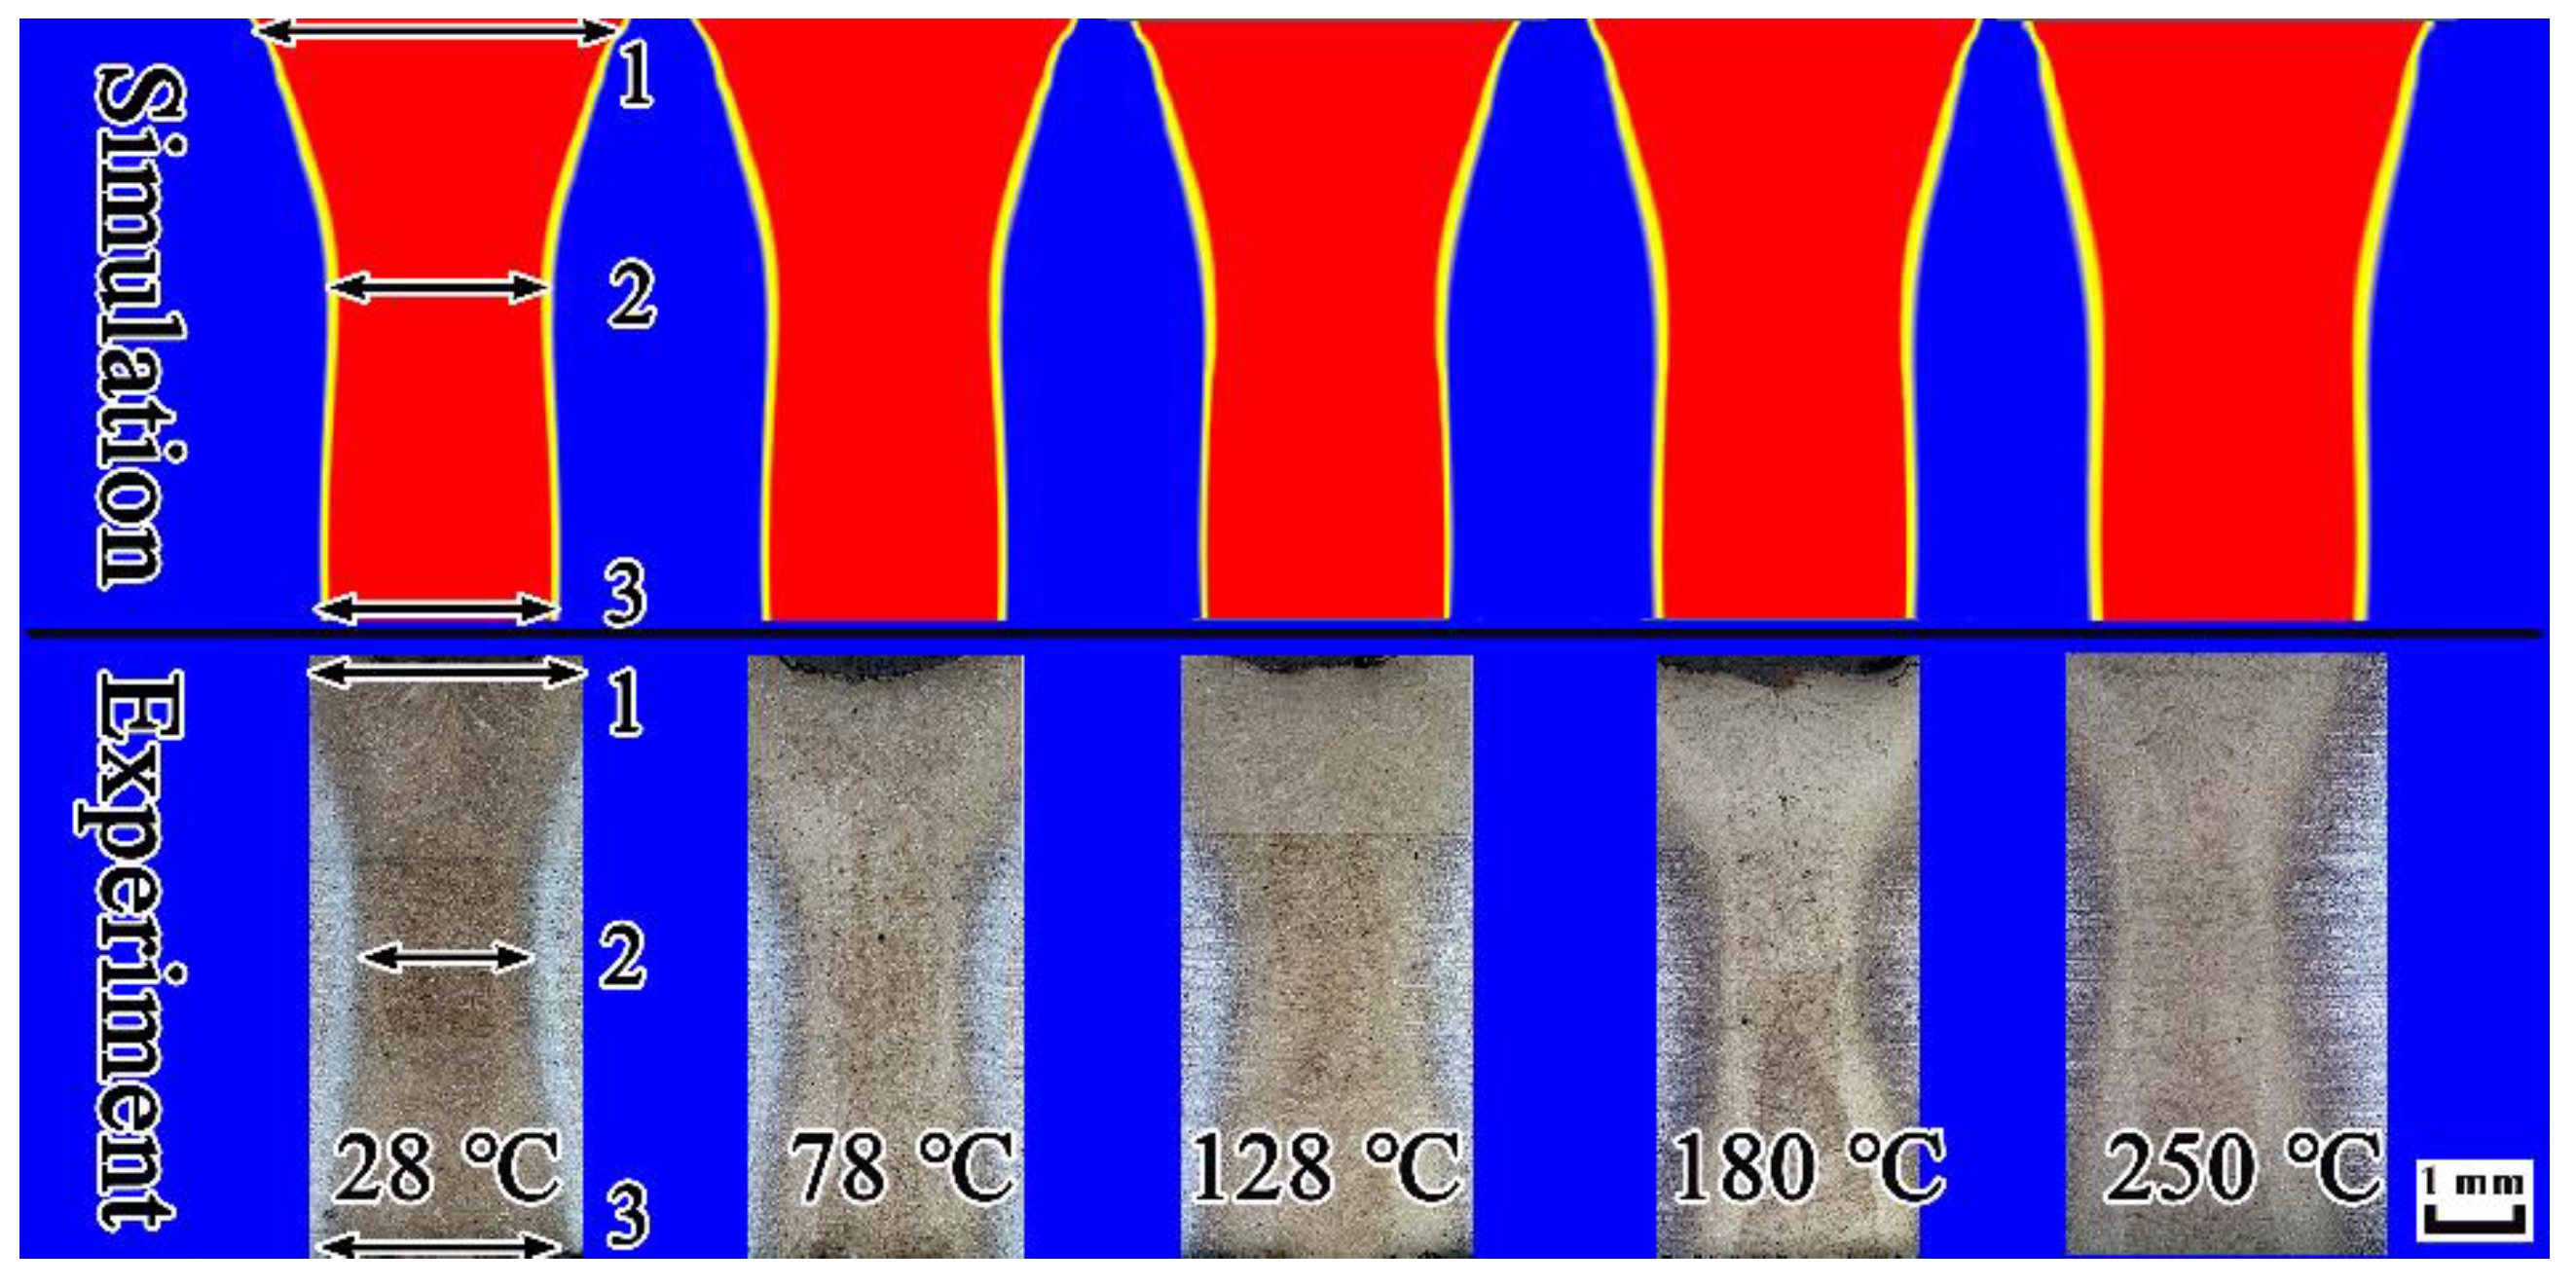
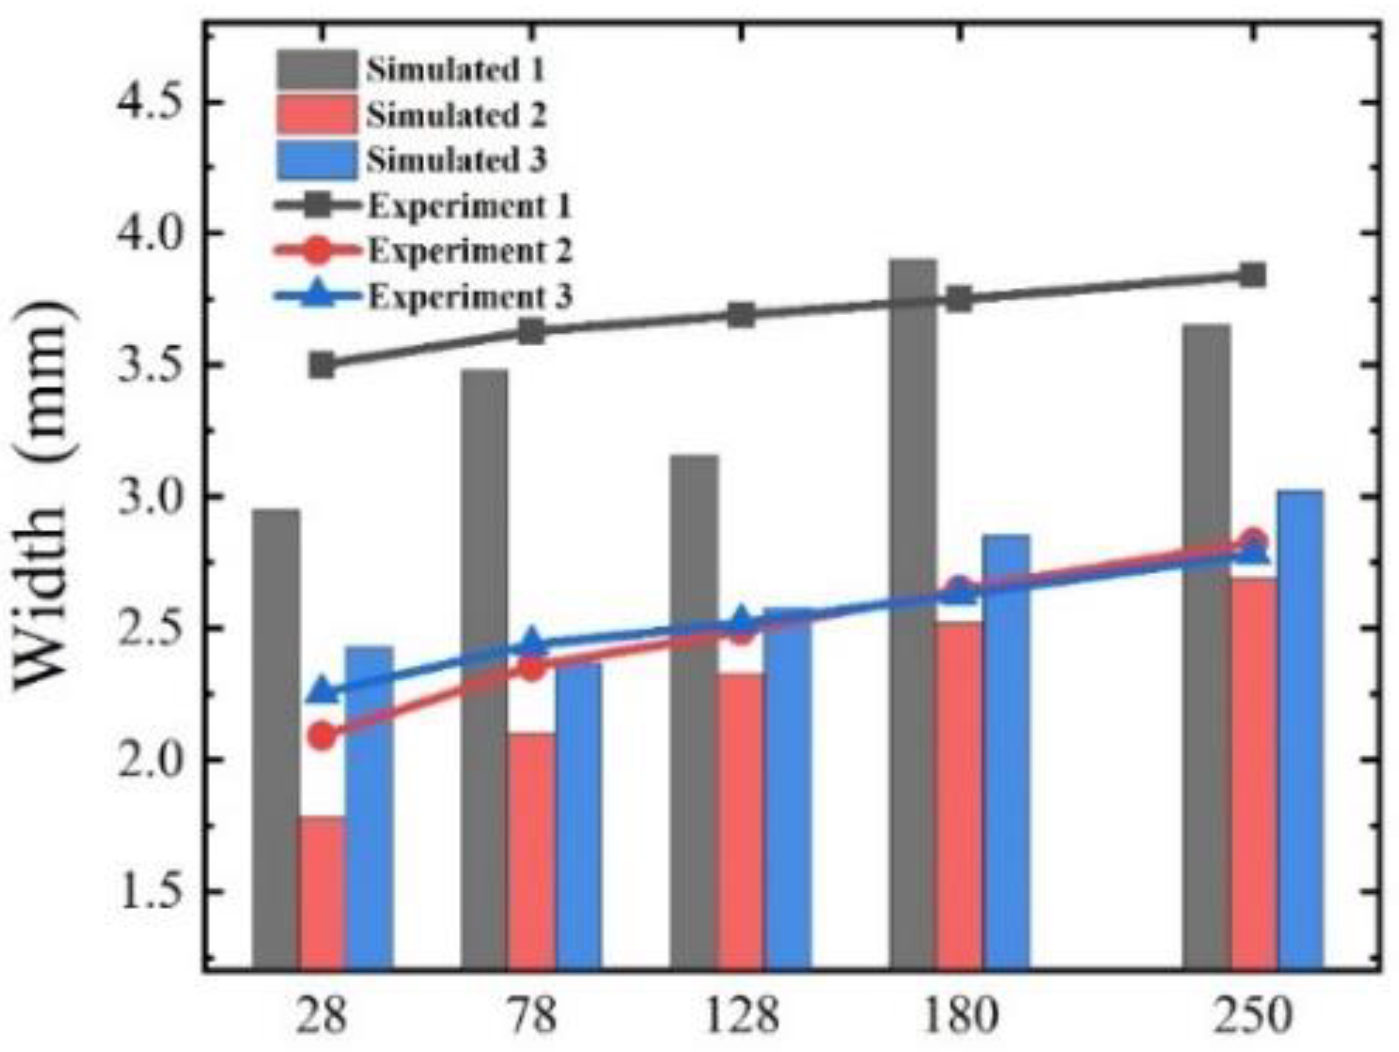
3.3. Experimental Verification

Metallographic microstructures at the feature point B under different preheating temperatures are shown in Figure 11. Microstructures without preheating are mainly composed of a large amount of lath martensite and a small amount of bainite, as shown in Figure 11a. With the increase in the preheating temperature, the martensitic content decreases gradually, while the bainite content increases continuously. The increase of the preheating temperature will cause the heat accumulation, which leads to the decrease in the cooling speed in the cooling stage [30], and the temperature stays above Ms for a longer time; the austenite is therefore more easily transformed into the bainite [31], resulting in the reduction of the martensite contents. In order to verify the reliability of the simulation results, the analysis of images [32,33] is performed on the microscopic metallographic diagram at the location of the feature point B, as shown in Figure 11. the contrast difference between different microstructures is increased by manually limiting the threshold value, and the martensite is distinguished from the other phases. The martensite contents are obtained by comparing the area ratio occupied by the black pixels. Unfortunately, the slight error of this image analysis method is inevitable, while its overall level is credible, and it can clearly reflect the changing trend of martensite contents. Both experimental and simulated martensitic contents decrease with the increasing preheating temperature. Figure 12 shows the comparisons of simulated and experimental martensitic contents at different preheating temperatures.
The decrease in martensitic contents with the increasing preheating temperatures will lead to significant changes in the properties of the welded joint. According to the work conducted by Cheon et al. [14,15], the relationship between martensite and microhardness can be given by [15]
H a r d n e s s = i = 0 4 ( α i P M i ) + β
where P M is the martensite content. α , β are fitting coefficients. According to the relationship, the microhardness is higher when the martensite content is larger. Figure 13 shows the measured microhardness at the feature point B and E. As shown in Figure 8, martensitic contents at point B decrease with the increasing preheating temperature. As a result, the microhardness is higher at the higher preheating temperature, as shown in Figure 13. Furthermore, martensitic contents at the point E of HAZ are higher than that at point B of the fusion zone. Thus, the microhardness at point E is higher than that at point B, as shown in Figure 13. The trends of microhardness with the increasing preheating temperature also prove that the trend of simulated martensite contents is correct. Although the trend of martensitic contents and hardness with the increasing preheating temperature between simulations and experiments are consistent, the error between simulations and experiments is larger at the higher preheating temperature. The error is mainly caused by the simplifications during simulations. Firstly, the coefficients ϵ, α and h are constant during simulations, while these coefficients will change at the high temperature. Secondly, the latent heat caused by the solid–solid phase transformation is ignored because it is much smaller than the latent heat during the solid–liquid transformation. Finally, the weldment will lose some heat between preheating and welding, and the higher the preheating temperature, the more serious the heat loss.

4. Conclusions

In this work, a thermal–metallurgical model is developed to investigate the effects of preheating temperatures on martensitic transformations during LBW of AH36 steels, using the software Simufact Welding. Heat transfers during welding are simulated using the thermal model and simulated welding profiles are in good agreement with experimental measurements. Based on the simulated results of heat transfers, martensitic transformations during welding are simulated using the metallurgical model. In the same weld, simulated martensitic contents increase slightly from the upper area and from the middle area to the lower area. Under different preheating temperatures, simulated martensitic contents decrease with the increase of the preheating temperature. According to the simulated results, the average cooling rate R 8 / 5   and the CCT diagram are drawn to analyze relationships between preheating temperatures and martensitic transformations.
Welding experiments under different preheating temperatures are carried out, and metallographic microstructures are observed. Experimental microstructures agree well with simulated martensitic contents. Moreover, the microhardness of the weld is also measured, and the microhardness reduces with the increasing preheating temperature. Based on the law H a r d n e s s = i = 0 4 ( α i P M i ) + β between microhardness and martensitic contents, the accuracy of the simulation results is further confirmed.
The main significance of this work is to provide a numerical model to predict the effects of different pre-heating conditions on microstructures during welding. Furthermore, the hardness of the weld can also be roughly predicted. The numerical model is also applicable to other martensitic steels during welding, and some new physical property parameters, such as the thermal conductivity, density, CCT curve, etc., need to be input.

Author Contributions

L.W.: methodology, formal analysis, data curation, writing—original draft preparation, writing—review and editing, visualization, funding acquisition.; H.L.: simulation, data curation, visualization.; Y.H.: formal analysis, writing—review and editing, funding acquisition.; K.W.: conceptualization, project administration.; M.Z.: experiment, formal analysis. All authors have read and agreed to the published version of the manuscript.

Funding

This research is supported by National Natural Science Foundation of China (Grant No. 51905273), Natural Science Foundation of Jiangsu Province (Grant No. BK20190472, BK20200497).

Institutional Review Board Statement

Not applicable.

Informed Consent Statement

Not applicable.

Data Availability Statement

The data presented in this study are available on request from the corresponding author. The data are not publicly available due to an ongoing study.

Conflicts of Interest

The authors declare no conflict of interest.

References

  1. Crupi, V.; Guglielmino, E.; Maestro, M.; Marino, A. Fatigue analysis of butt welded AH36 steel joints: Thermographic method and design S-N curve. Mar. Struct. 2009, 22, 373–386. [Google Scholar] [CrossRef]
  2. Shiga, C.; Murakawa, H.; Hiraoka, K.; Osawa, N.; Yajima, H.; Tanino, T.; Tsutsumi, S.; Fukui, T.; Sawato, H.; Kamita, K.; et al. Elongated bead weld method for improvement of fatigue properties in welded joints of ship hull structures using low transformation temperature welding materials. Weld. World 2017, 61, 769–788. [Google Scholar] [CrossRef]
  3. Zhang, K.; Chen, Y.; Gui, H.; Li, D.; Li, Z. Identification of the deviation of seam tracking and weld cross type for the derusting of ship hulls using a wall-climbing robot based on three-line laser structural light. J. Manuf. Processes 2018, 35, 295–306. [Google Scholar] [CrossRef]
  4. Shi, L.; Li, X.; Jiang, L.; Gao, M. Numerical study of keyhole-induced porosity suppression mechanism in laser welding with beam oscillation. Sci. Technol. Weld. Join. 2021, 26, 349–355. [Google Scholar] [CrossRef]
  5. Acherjee, B. Laser transmission welding of polymers—A review on welding parameters, quality attributes, process monitoring, and applications. J. Manuf. Processes 2021, 64, 421–443. [Google Scholar] [CrossRef]
  6. Wang, X.; Hu, L.; Xu, Q.; Chen, D.; Sun, S. Influence of martensitic transformation on welding residual stress in plates and pipes. Sci. Technol. Weld. Join. 2017, 22, 505–511. [Google Scholar] [CrossRef]
  7. Shi, Y.; Wu, S.; Liao, H.; Wang, X. Microstructure and mechanical properties of CLF-1/316 L steel dissimilar joints welded with fiber laser welding. J. Manuf. Processes 2020, 54, 318–327. [Google Scholar] [CrossRef]
  8. Marques, E.S.V.; Silva, F.J.G.; Pereira, A.B. Comparison of finite element methods in fusion welding processes—A review. Metals 2020, 10, 75. [Google Scholar] [CrossRef] [Green Version]
  9. Mi, G.; Zhan, X.; Wei, Y.; Ou, W.; Gu, C.; Yu, F. A thermal-metallurgical model of laser beam welding simulation for carbon steels. Model. Simul. Mater. Sci. Eng. 2015, 23, 035010. [Google Scholar] [CrossRef]
  10. Mi, G.; Wei, Y.; Zhan, X.; Gu, C.; Yu, F. A coupled thermal and metallurgical model for welding simulation of Ti-6Al-4V alloy. J. Mater. Process. Technol. 2014, 214, 2434–2443. [Google Scholar] [CrossRef]
  11. Mi, G.; Xiong, L.; Wang, C.; Hu, X.; Wei, Y. A thermal-metallurgical-mechanical model for laser welding Q235 Steel. J. Mater. Process. Technol. 2016, 238, 39–48. [Google Scholar] [CrossRef]
  12. Rong, Y.; Mi, G.; Xu, J.; Huang, Y.; Wang, C. Laser penetration welding of ship steel EH36: A new heat source and application to predict residual stress considering martensite phase transformation. Mar. Struct. 2018, 61, 256–267. [Google Scholar] [CrossRef]
  13. Cheon, J.; Kiran, D.V.; Na, S.-J. Thermal metallurgical analysis of GMA welded AH36 steel using CFD-FEM framework. Mater. Des. 2016, 91, 230–241. [Google Scholar] [CrossRef]
  14. Cheon, J.; Na, S.-J. Influence of simulation methods of temperature distribution on thermal and metallurgical characteristics in GMA welding. Mater. Des. 2016, 108, 183–194. [Google Scholar] [CrossRef]
  15. Zhang, H.; Wang, Y.; Han, T.; Bao, L.; Wu, Q.; Gu, S. Numerical and experimental investigation of the formation mechanism and the distribution of the welding residual stress induced by the hybrid laser arc welding of AH36 Steel in a butt joint configuration. J. Manuf. Processes 2020, 51, 95–108. [Google Scholar] [CrossRef]
  16. Siwek, A. Publisher Correction: CFD-based modelling of phase transformation in laser welded low-carbon steel. Weld. World 2021, 65, 1857. [Google Scholar] [CrossRef]
  17. Simufact. Welding Reference infosheet, Hexagon MSC. Software, 2020. Available online: www.simufact.com (accessed on 9 January 2022).
  18. Zhang, X.; Li, L.; Chen, Y.; Zhu, X.; Ji, S. Numerical simulation analysis of dual-beam laser welding of tailored blanks with different thicknesses. Metals 2019, 9, 135. [Google Scholar] [CrossRef] [Green Version]
  19. Sepe, R.; Giannella, V.; Greco, A.; De Luca, A. FEM simulation and experimental tests on the SMAW welding of a dissimilar T-joint. Metals 2021, 11, 1016. [Google Scholar] [CrossRef]
  20. He, S.; Chen, S.; Zhao, Y.; Qi, N.; Zhan, X. Study on the intelligent model database modeling the laser welding for aerospace aluminum alloy. J. Manuf. Processes 2021, 63, 121–129. [Google Scholar] [CrossRef]
  21. D’Ostuni, S.; Leo, P.; Casalino, G. FEM simulation of dissimilar aluminum titanium fiber laser welding using 2D and 3D gaussian heat sources. Metals 2017, 7, 307. [Google Scholar] [CrossRef] [Green Version]
  22. Wu, J.; Zhang, H.; Feng, Y.; Luo, B. 3D multiphysical modelling of fluid dynamics and mass transfer in laser welding of dissimilar materials. Metals 2018, 8, 443. [Google Scholar] [CrossRef] [Green Version]
  23. Lankalapalli, K.N.; Tu, J.F.; Gartner, M. A model for estimating penetration depth of laser welding processes. J. Phys. D Appl. Phys. 1996, 29, 1831–1841. [Google Scholar] [CrossRef]
  24. Marmolowski, A.; Kielczynski, W. Modelling of the heat flux density distribution for laser beam welding. In Proceedings of the Environmental Degradation of Engineering & Materials Engineering and Technologies; Labanowski, J., Zielinski, A., Eds.; Trans Tech Publications Ltd.: Durnten-Zurich, Switzerland, 2012; Volume 183, pp. 241–248. [Google Scholar]
  25. Jiang, P.; Wang, C.; Zhou, Q.; Shao, X.; Shu, L.; Li, X. Optimization of laser welding process parameters of stainless steel 316L using FEM, Kriging and NSGA-II. Adv. Eng. Softw. 2016, 99, 147–160. [Google Scholar] [CrossRef]
  26. Fortunier, R.; Leblond, J.B.; Bergheau, J.M. A numerical model for multiple phase transformations in steels during thermal processes. J. Shanghai Jiaotong Univ. 2000, 1, 213–220. [Google Scholar]
  27. Leblond, J.B.; Devaux, J. A new kinetic model for anisothermal metallurgical transformations in steels including effect of austenite grain size. Acta Met. 1984, 32, 137–146. [Google Scholar] [CrossRef]
  28. Villa, M.; Christiansen, T.L.; Hansen, M.F.; Somers, M.A. Martensitbildung in Fe-basierten Legierungen während der Erwärmung von Stickstoff- Siedetemperatur* Investigation of martensite formation in Fe based alloys during heating from boiling nitrogen temperature. HTM J. Heat Treat. Mater. 2016, 71, 12–19. [Google Scholar] [CrossRef]
  29. Tsirkas, S.A.; Papanikos, P.; Kermanidis, T. Numerical simulation of the laser welding process in butt-joint specimens. J. Mater. Process. Technol. 2003, 134, 59–69. [Google Scholar] [CrossRef]
  30. Khan, A.R.; Shengfu, Y.; Wang, H. Influence of heat input and preheating on microstructure and mechanical properties of coarse grain heat-affected zone of metal arc gas-welded pearlitic rail steel. J. Mater. Eng. Perform. 2019, 28, 7676–7686. [Google Scholar] [CrossRef]
  31. Speer, J.; Matlock, D.K.; Cooman, B.; Schroth, J.G. Carbon partitioning into austenite after martensite transformation. Acta Mater. 2003, 51, 2611–2622. [Google Scholar] [CrossRef]
  32. Stevens, E.L.; Toman, J.; To, A.C.; Chmielus, M. Variation of hardness, microstructure, and laves phase distribution in direct laser deposited alloy 718 cuboids. Mater. Des. 2017, 119, 188–198. [Google Scholar] [CrossRef] [Green Version]
  33. Schneider, C.A.; Rasband, W.S.; Eliceiri, K.W. NIH Image to ImageJ: 25 Years of image analysis. Nat. Methods 2012, 9, 671–675. [Google Scholar] [CrossRef] [PubMed]
Figure 1. Finite element model: (a) Geometric model; (b) Heat source model.
Metals 12 00127 g001
Figure 2. Thermophysical properties of AH36. (a) Specific heat capacity; (b) Thermal conductivity; (c) Density.
Metals 12 00127 g002
Figure 3. Simulation process.
Metals 12 00127 g003
Figure 4. Simulated heat transfers at the preheating temperature of 78 °C. (a) Upper surface; (b) Longitudinal section; (c) Cross section.
Metals 12 00127 g004
Figure 5. Comparisons of simulated and experimental welding profiles.
Metals 12 00127 g005
Figure 6. Comparisons of simulated and experimental weld widths.
Metals 12 00127 g006
Figure 7. Simulated martensitic contents at different preheating temperatures. (a) 28 °C; (b) 78 °C; (c) 128 °C; (d) 180 °C; (e) 250 °C.
Metals 12 00127 g007
Figure 8. Simulated evolutions of martensitic contents at the feature points under different preheating temperatures. (a) Point A; (b) Point B; (c) Point C; (d) Point D; (e) Point E; (f) Point F.
Metals 12 00127 g008
Figure 9. Calculated R 8 / 5 at the feature points under different preheating temperatures.
Metals 12 00127 g009
Figure 10. CCT diagram of AH36.
Metals 12 00127 g010
Figure 11. Metallographic microstructures with their processed images. (a) 28 °C; (b) 78 °C; (c) 128 °C; (d) 180 °C; (e) 250 °C.
Metals 12 00127 g011
Figure 12. Comparisons of simulated and experimental martensitic contents.
Metals 12 00127 g012
Figure 13. Microhardness at feature points B and E.
Metals 12 00127 g013
Table 1. Parameters of the heat source model.
Parameters r 1 r 2 r 3 h 1 h 2 η k
Values (mm)30.91.15360.80.17
Publisher’s Note: MDPI stays neutral with regard to jurisdictional claims in published maps and institutional affiliations.

