Article

Effect of the Thermomechanical Treatment on the Corrosion of UNSM Processed Inconel 718: An Electrochemical Study

National Center for Education and Research on Corrosion and Materials Performance, NCERCAMP-UA, Department of Chemical, Biomolecular, and Corrosion Engineering, The University of Akron, 302 E Buchtel Ave, Akron, OH 44325-3906, USA
*
Author to whom correspondence should be addressed.
Metals 2021, 11(9), 1488; https://doi.org/10.3390/met11091488
Submission received: 21 August 2021 / Revised: 14 September 2021 / Accepted: 16 September 2021 / Published: 18 September 2021
(This article belongs to the Special Issue Corrosion and Inhibition Processes)

Abstract

:
In this work, the influence of thermal (TT), mechanical, and thermomechanical (TMT) treatments using the ultrasonic nanocrystal surface modification (UNSM) on the corrosion protection properties of Inconel 718 was studied, correlating the changes in the electrochemical properties with the promoted microstructure. The UNSM treatment had a grain refinement effect on the top surface, reducing the grain size from 11.5 to 7.4 µm for the first 10 µm in depth. The high grain boundary density, due to the grain refinement, enabled a faster growth of the passive film. The impedance showed a decrease in the charge transfer resistance by three orders of magnitude, from 106 to 103 Ω cm2 for as-received to 1000 °C, as the TT temperature crossed the solvus of the γ′/γ″ and approached the solvus of the δ-phase. The UNSM treatment lowered the pitting corrosion susceptibility, increasing the charge transfer resistance and decreasing the effective capacitance of the double layer, leading to the thickest passive film with 6.8 nm.

1. Introduction

Inconel 718 is a Ni-based superalloy widely used for aerospace and nuclear applications due to its outstanding strength, creep, fatigue, and wear resistance at elevated temperatures, close to 700 °C [1,2,3,4]. Inconel 718, besides keeping its mechanical and corrosive properties under highly aggressive environments, possesses good weldability [5,6,7]. The strength and durability of its properties come from the single-phase austenite (γ) matrix microstructure, thanks to the high Ni equivalent content promoting a stable γ-phase, based on the Schaeffler diagram [8]. Inconel 718 presents other secondary phases and precipitates, which influence the mechanical and electrochemical properties, among the most common of which are: gamma prime (γ′), a Ni3(Al,Ti) phase with face centered cubic (fcc) crystal structure; gamma double-prime (γ″), a Nb3(Al,Ti) with body centered tetragonal (bct) unit cell; and delta (δ), a Ni3Nb phase with an orthorhombic crystal structure [9,10,11]. The γ″-phase is an unstable phase that grants most of the hardness to Inconel 718; however, given a thermal stimulus it transforms into the δ-phase, a more stable form of the Ni3Nb. While the δ-phase does not provide enhanced mechanical properties and it depletes the γ″-phase density in small quantities, it is beneficial for corrosion protection [12].
In recent years, and with the aim of further enhancing the mechanical and corrosion protection properties of Inconel 718, a combination of thermomechanical treatments (TMTs) has been used. Among the most common mechanical treatments, laser shock peening, shot peening, and ultrasonic nanocrystal surface modification (UNSM) can be found [13,14,15]. The combination of UNSM and thermal treatments (TTs) have improved the wear, fatigue, and friction properties, giving a rougher surface with a top layer with enough plastic deformation to increase the hardness of the material. However, the microstructure was conditioned by the TT used to release part of the residual stress [13,16,17]. The UNSM promoted a high twin and dislocation density region on Inconel 718, preventing the fatigue crack to nucleate by creating barriers for the dislocation to move forward, delaying the failure of the samples [16]. Concerning the corrosion performance, the UNSM treatment has also positively influenced the corrosion behavior; among the techniques used to test it, electrochemical impedance spectroscopy (EIS) is one of the most common [12,17,18]. The combination of UNSM and nitriding enhanced the impedance by five times compared to the control sample, improving the pitting corrosion protection [19]. In addition, both the corrosion potential (Ecorr) and the corrosion current density (icorr) became 100 mV more noble and decreased below 3 µA/cm2, respectively. In other studies, the UNSM treatment was able to improve the corrosion performance even when the sample was aged for 5 h at 650 °C, increasing the pitting potential and decreasing the icorr [20]. This effect was attributed to the carbon segregation reduction that the UNSM promotes on the top surface. However, for further sensitization, the UNSM treatment reversed the trend and was detrimental for the alloy, thus reducing the effectiveness of the passive film due to the formation of deformation twins and planar defects, which had high energy and were preferential sites for the pitting corrosion nucleation.
Even with the knowledge so far on Inconel and their TTs and TMTs, there is a lack of literature on correlating the phases promoted by the processing with their influence on the corrosion behavior. For that reason, the aim of this work was to focus on the influence on the corrosion performance of Inconel 718 due to the phase transformation by thermal and/or mechanical treatments. The mechanical treatment focuses on surface modification by UNSM processing, which improves the mechanical and corrosion properties. Electrochemical monitoring combined with in depth microstructure characterization allowed for the relation of the promoted phase, based on the TTT diagram, with pitting corrosion susceptibility in 3.5 wt.% NaCl solution. Pit morphology and density were elucidated using infinite focus microscopy and correlated with the impedance and current density monitored.

2. Materials and Methods

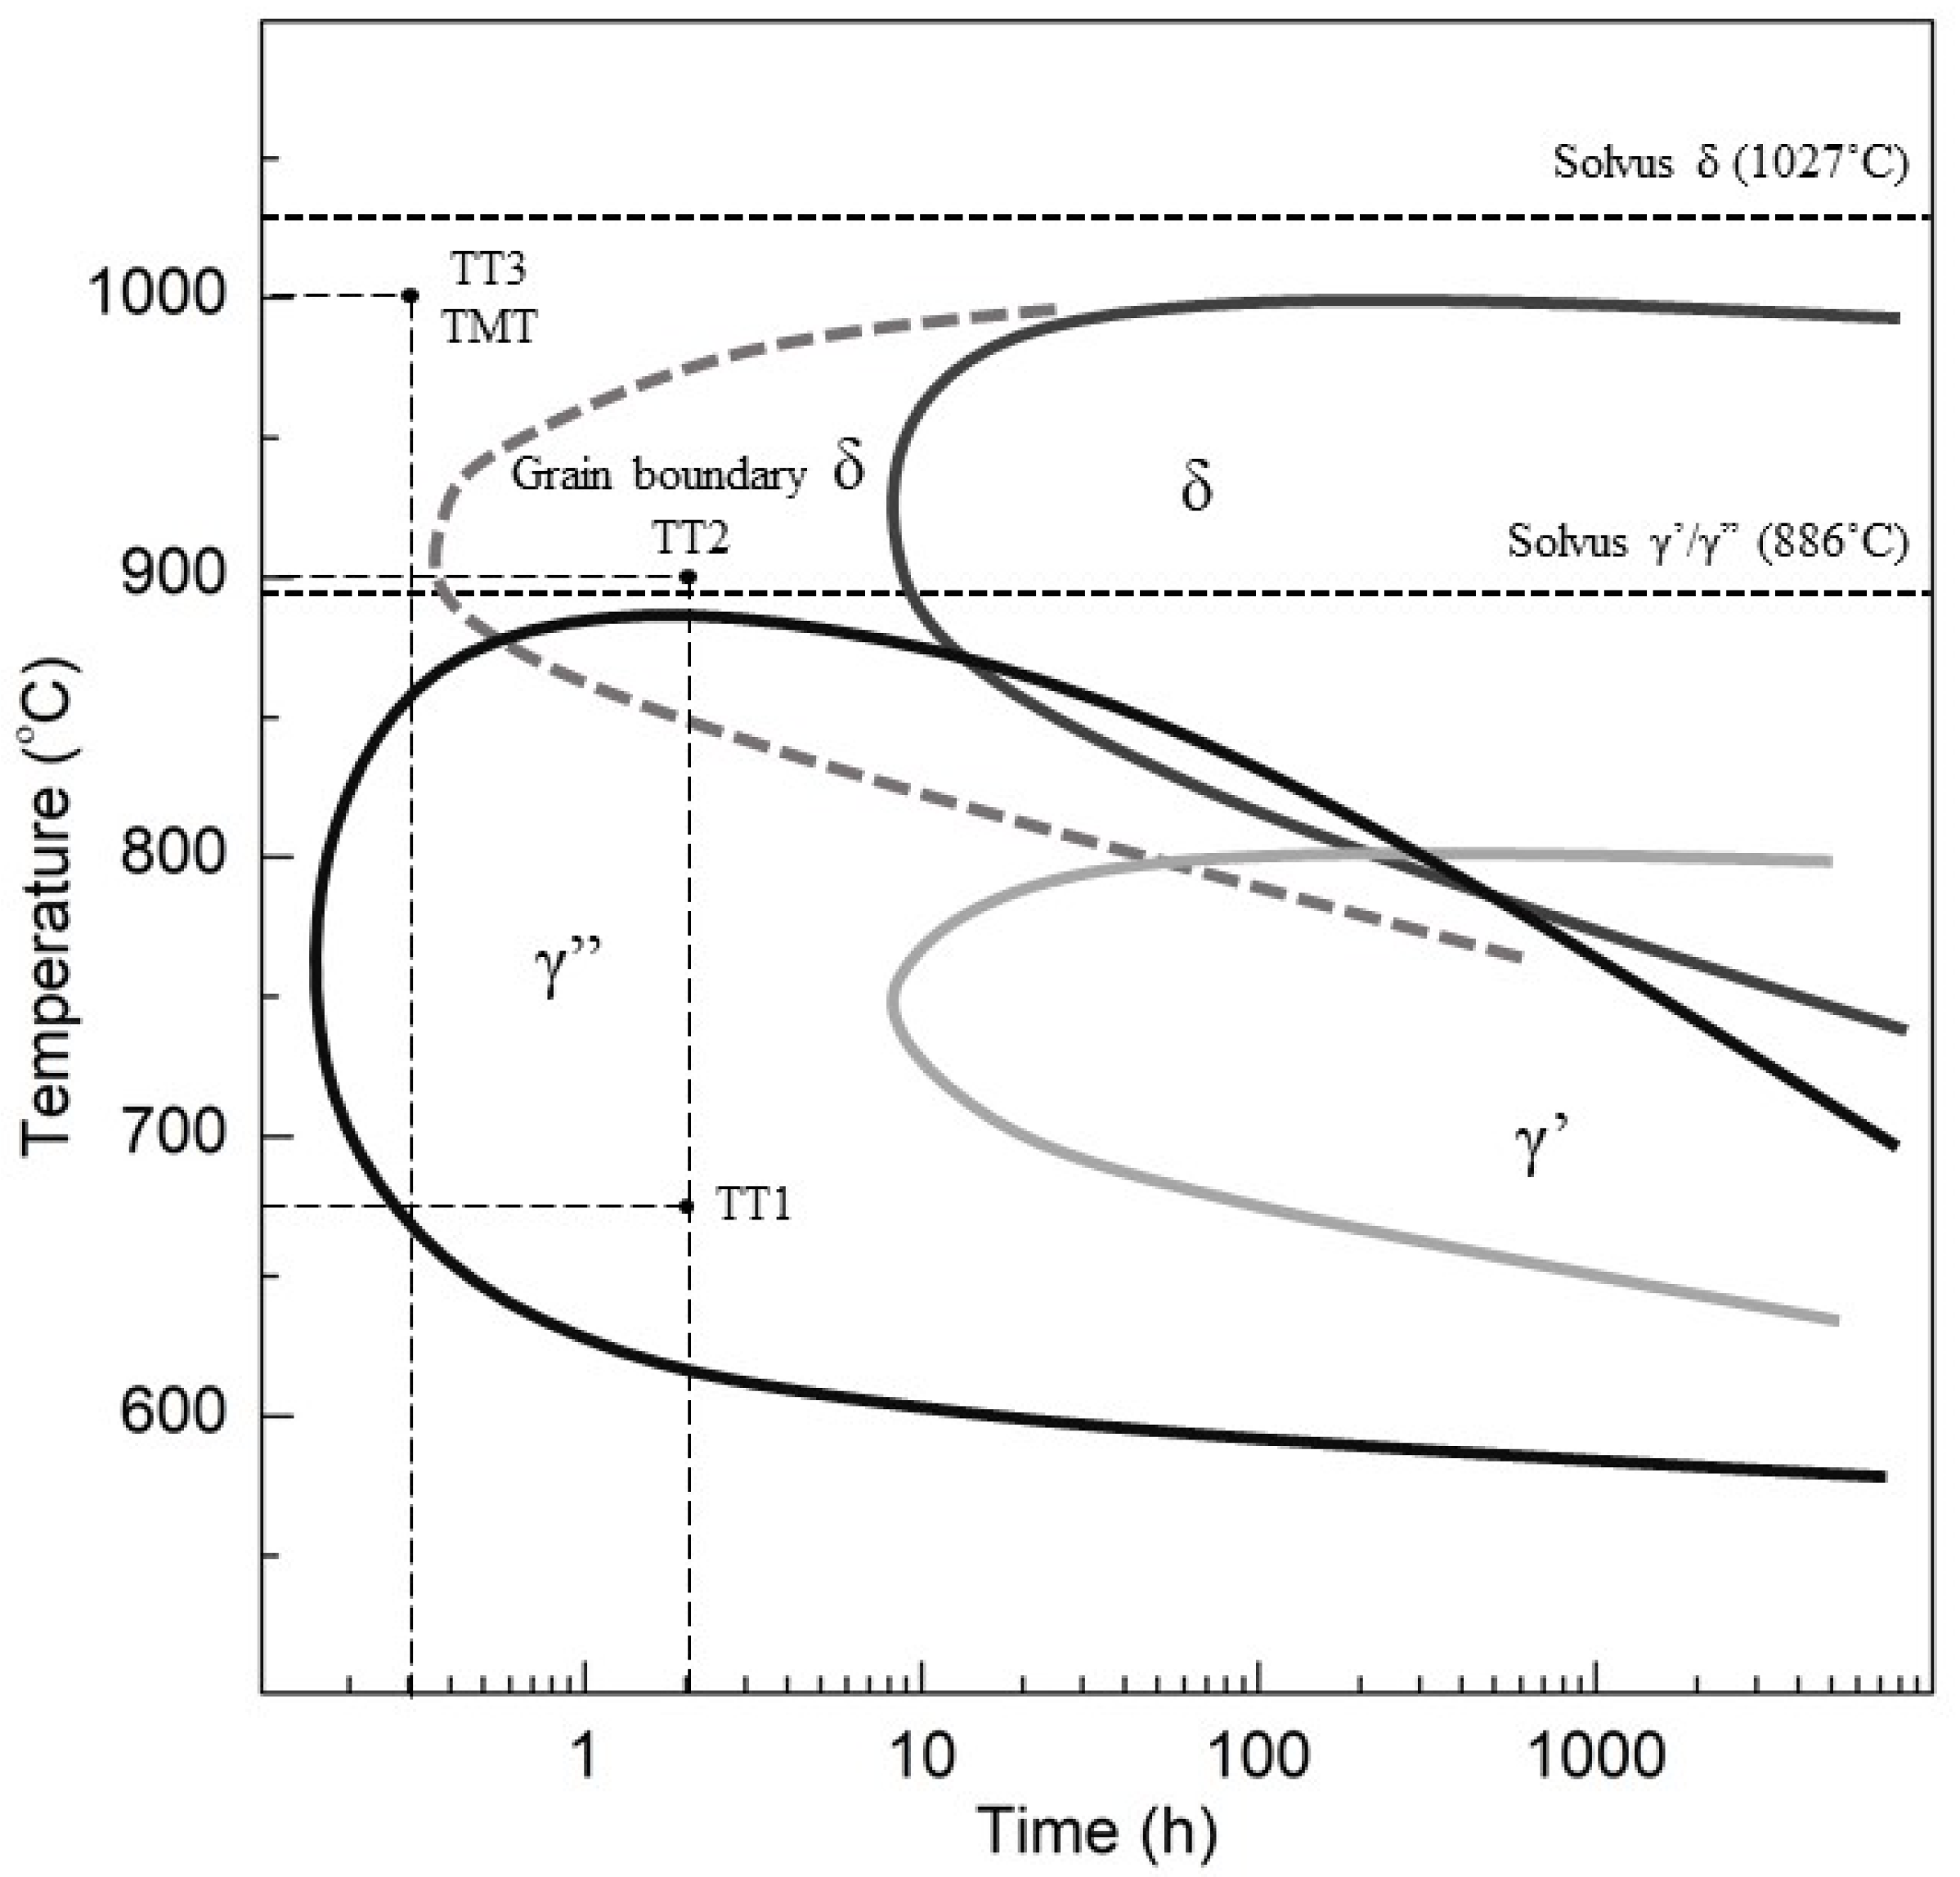
2.1. Materials and Thermomechanical Processing

Inconel 718 was used for this study, and its elemental composition is shown in Table 1, per the specifications of the manufacturer. Samples were cut from a 3 mm thick sheet with a square shape of 15 × 15 mm2. The samples, before the TMT, were first degreased with ethanol, rinsed with deionized (DI) water, and air-dried before being polished up to grade 1200 with SiC sandpapers and finished with diamond powder of 1 µm size. The different samples studied are identified in Table 2, where each sample is given a code corresponding with its thermal and/or mechanical treatment. Six different samples were studied: As-received sample (AR); annealed at 675 °C for 2 h and then water quenched sample (TT1); annealed at 900 °C for 2 h and then water quenched sample (TT2); thermally treated sample at 1000 °C for 10 min and then water quenched sample, this process was repeated three times (TT3); UNSM treated sample, this process was repeated three times (UNSM); and UNSM treated, thermally treated at 1000 °C for 10 min, and then water quenched, this thermomechanical process was repeated three times (TMT). The UNSM treatment was performed with the following parameters: a tungsten carbide ball with 2.4 mm tip diameter, a static load of 20 N, a scanning speed of 1000 mm/min, an amplitude of 16 µm and a spacing of 10 µm [19,20].
The different TT and TMT samples and their respective phases are labeled in the time–temperature–transformation (TTT) diagram of Inconel 718 from Figure 1 [21]. The AR and UNSM samples are expected to mainly contain a pure γ-phase matrix, as no thermal treatment was performed on them; TT1 exists well in the γ″-phase region, while TT2 is just outside the γ″/grain boundary δ-phase region and in the pure grain boundary δ-phase region. Finally TT3 and TMT are outside all secondary phase regions; however, they are close to the solvus for δ-phase (1027 °C) (see Figure 1) [22].

2.2. Electrochemical Techniques

All the electrochemical tests were performed in a three-electrode configuration cell setup with a 3.5 wt.% NaCl electrolyte solution at room temperature (25 °C). The electrochemical measurements were carried out in triplicate to ensure reproducibility. A saturated calomel electrode (SCE) was used as reference electrode (RE), a graphite rod was used as counter electrode (CE), and the Inconel 718 samples were used as the working electrode (WE). The exposed area each of the samples was 1 cm2. First, open circuit potential (OCP) was monitored for 1 h to stabilize the Ecorr, then LPR with an applied potential scan range of ±15 mV versus OCP at a scan rate of 0.167 mV s−1 was performed, according to ASTM G3-14 [23]. EIS measurements were carried out at an open circuit potential with a frequency range of 105 to 10−2 Hz, with an applied excitation signal of 10 mV rms and with a scan rate of 5 steps per decade of frequency.

2.3. Characterization Techniques

Vickers hardness tests were conducted to study the effect of the UNSM and thermomechanical treatment on the hardness of Inconel 718 with Wilson hardness Tukon 1202 equipment using a HV/10 cone indenter. The microstructure was studied by optical images taken with a Nikon eclipse MA 100 metallographic microscope, and a Tescan Lyra 3 XMU SEM, as well as EDX to analyze the elemental composition. IFM was used to analyze the surface after exposure to the electrochemical tests using an Alicona Infinite Focus G5 microscope. To reveal the microstructure, the samples were mounted in resin and polished with diamond powder, then immersed in an etchant solution containing HCl and H2O2 at a volume ratio of 17:1 for 15–20 s. To calculate the grain size, ×100 magnification optical microscopy images were used following ASTM E112-13 [24].

3. Results

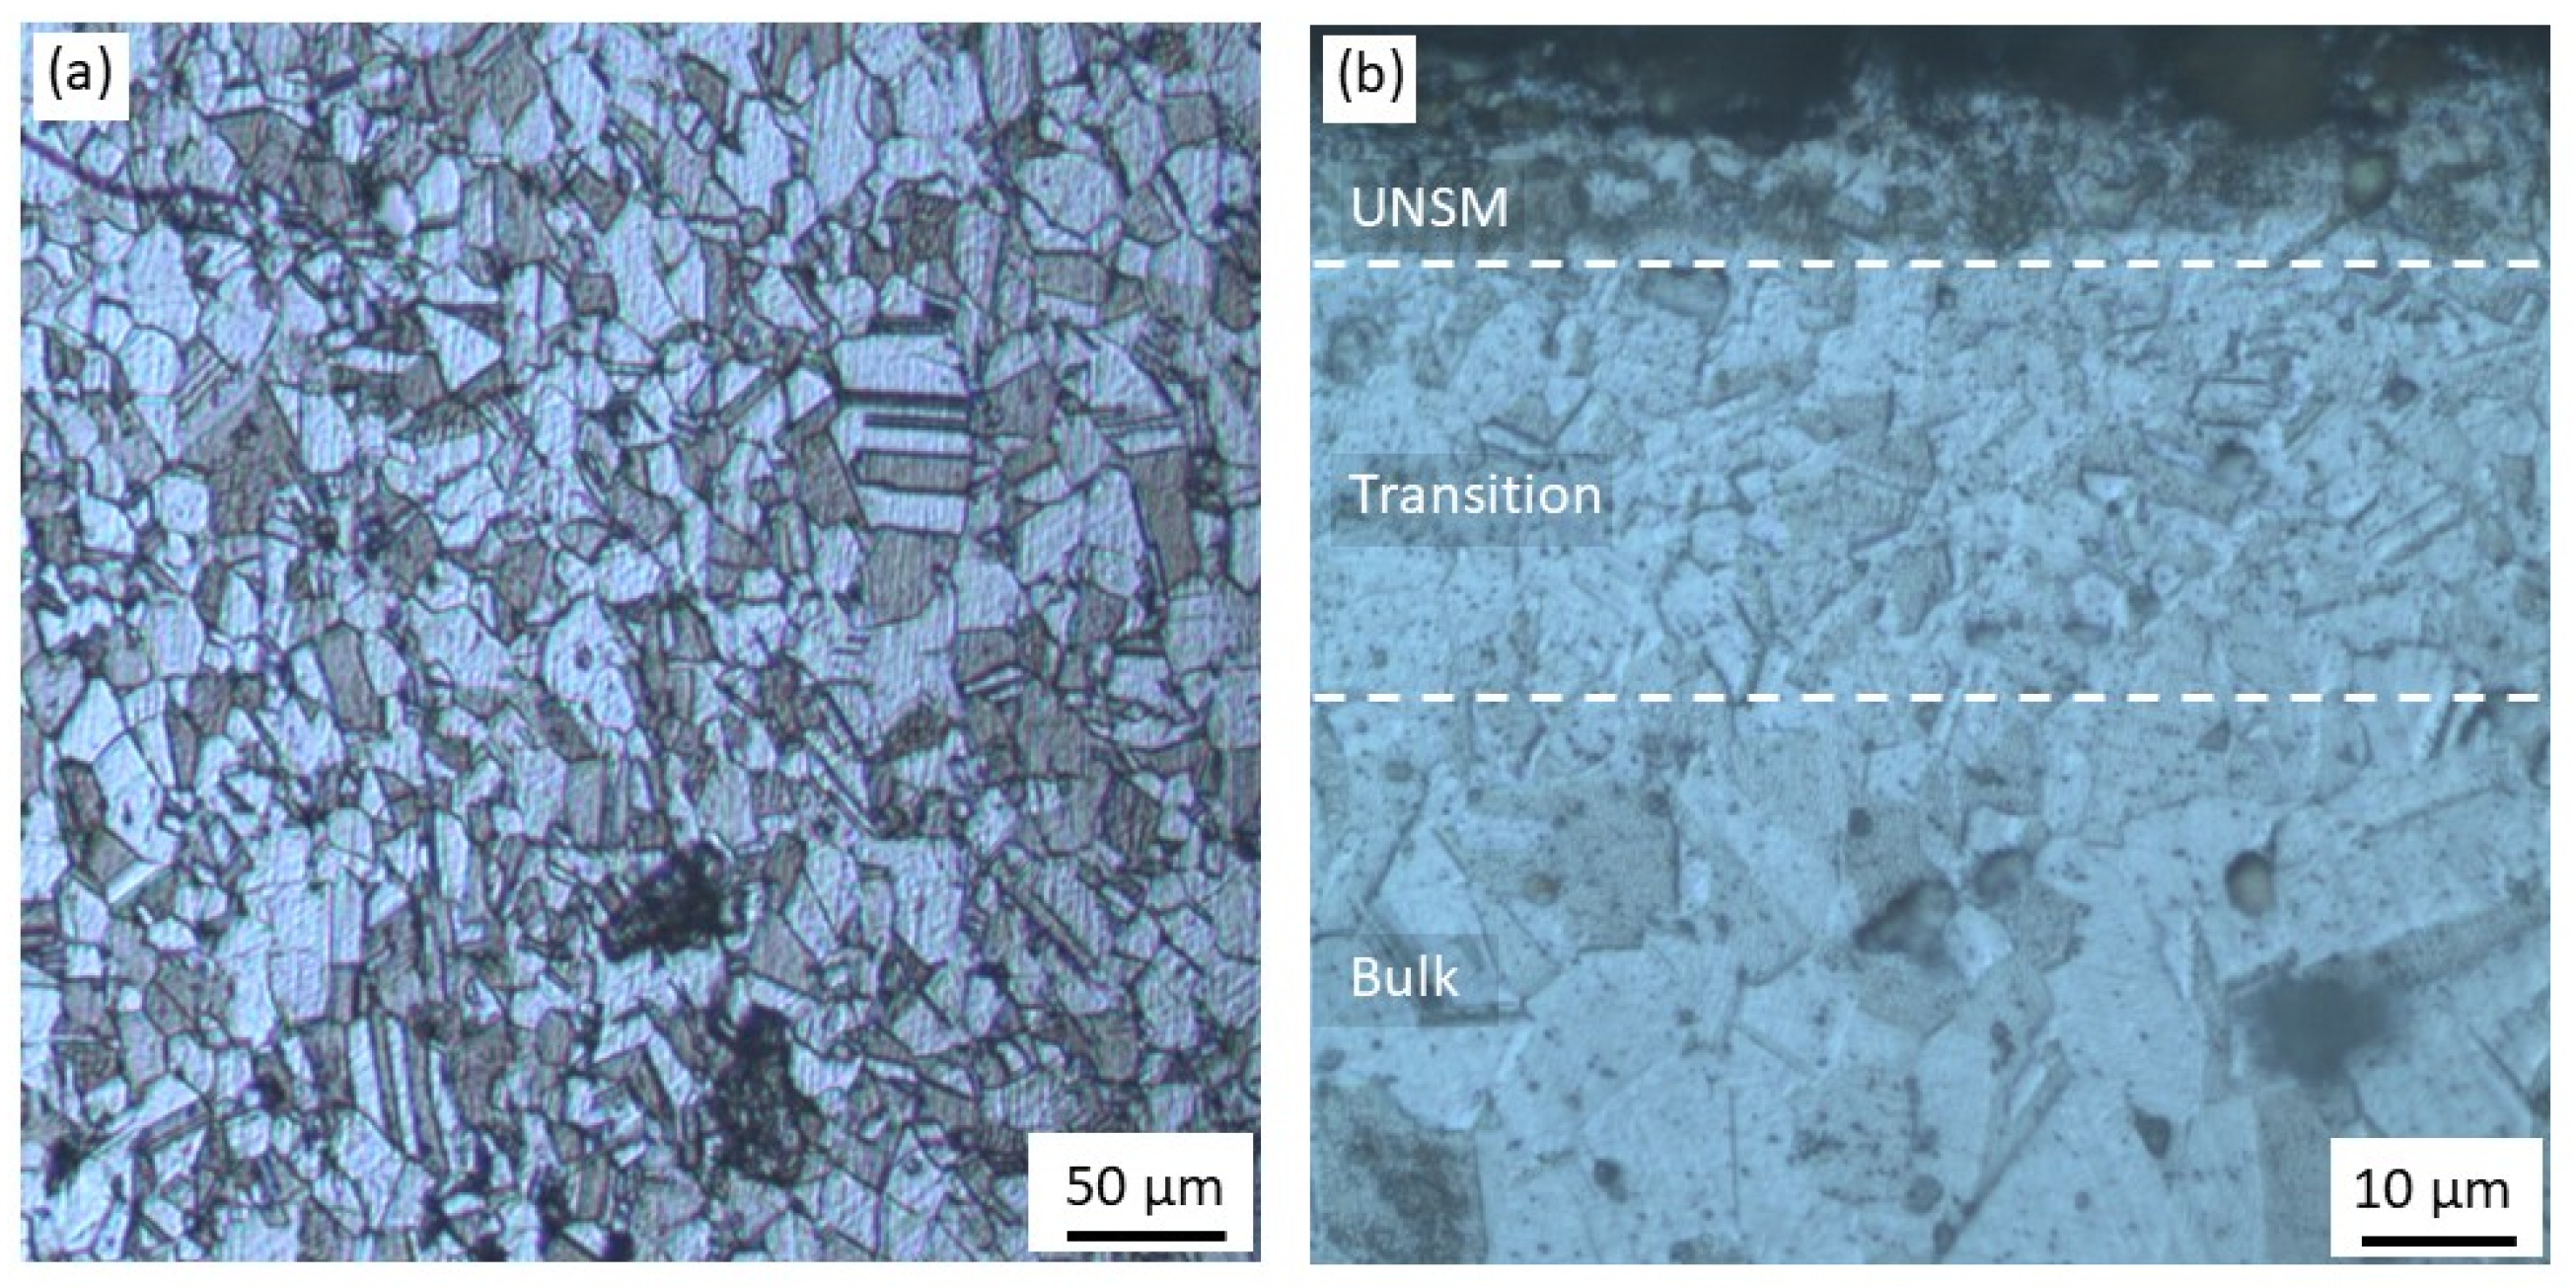
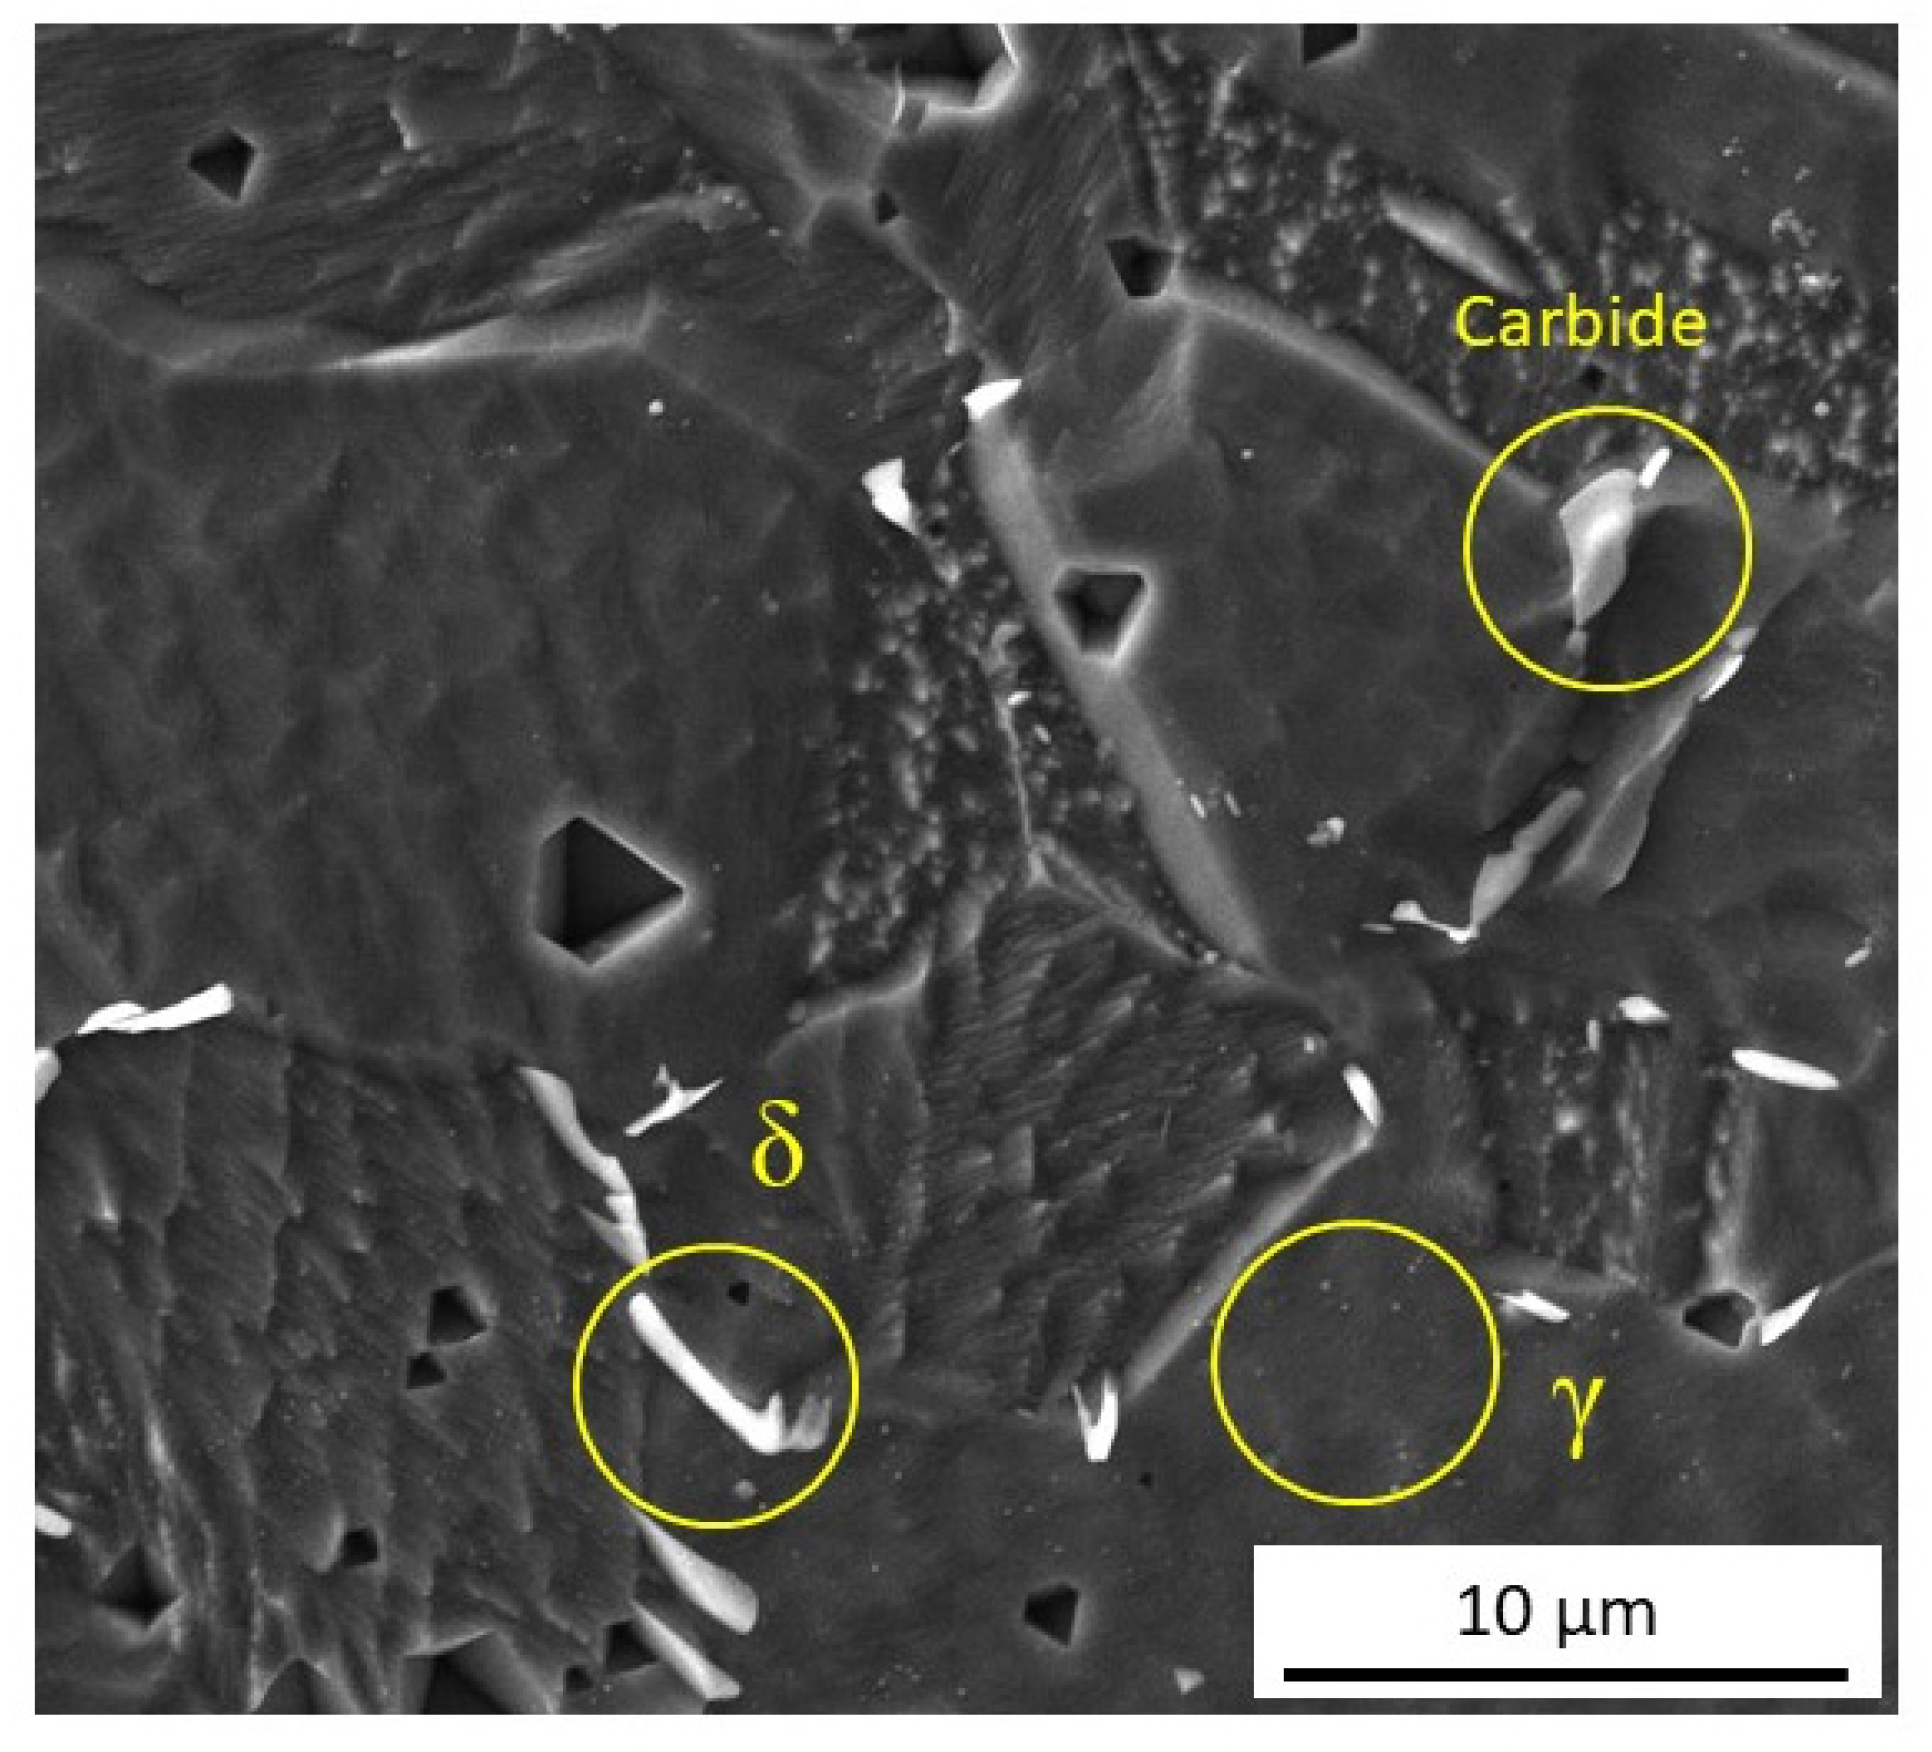
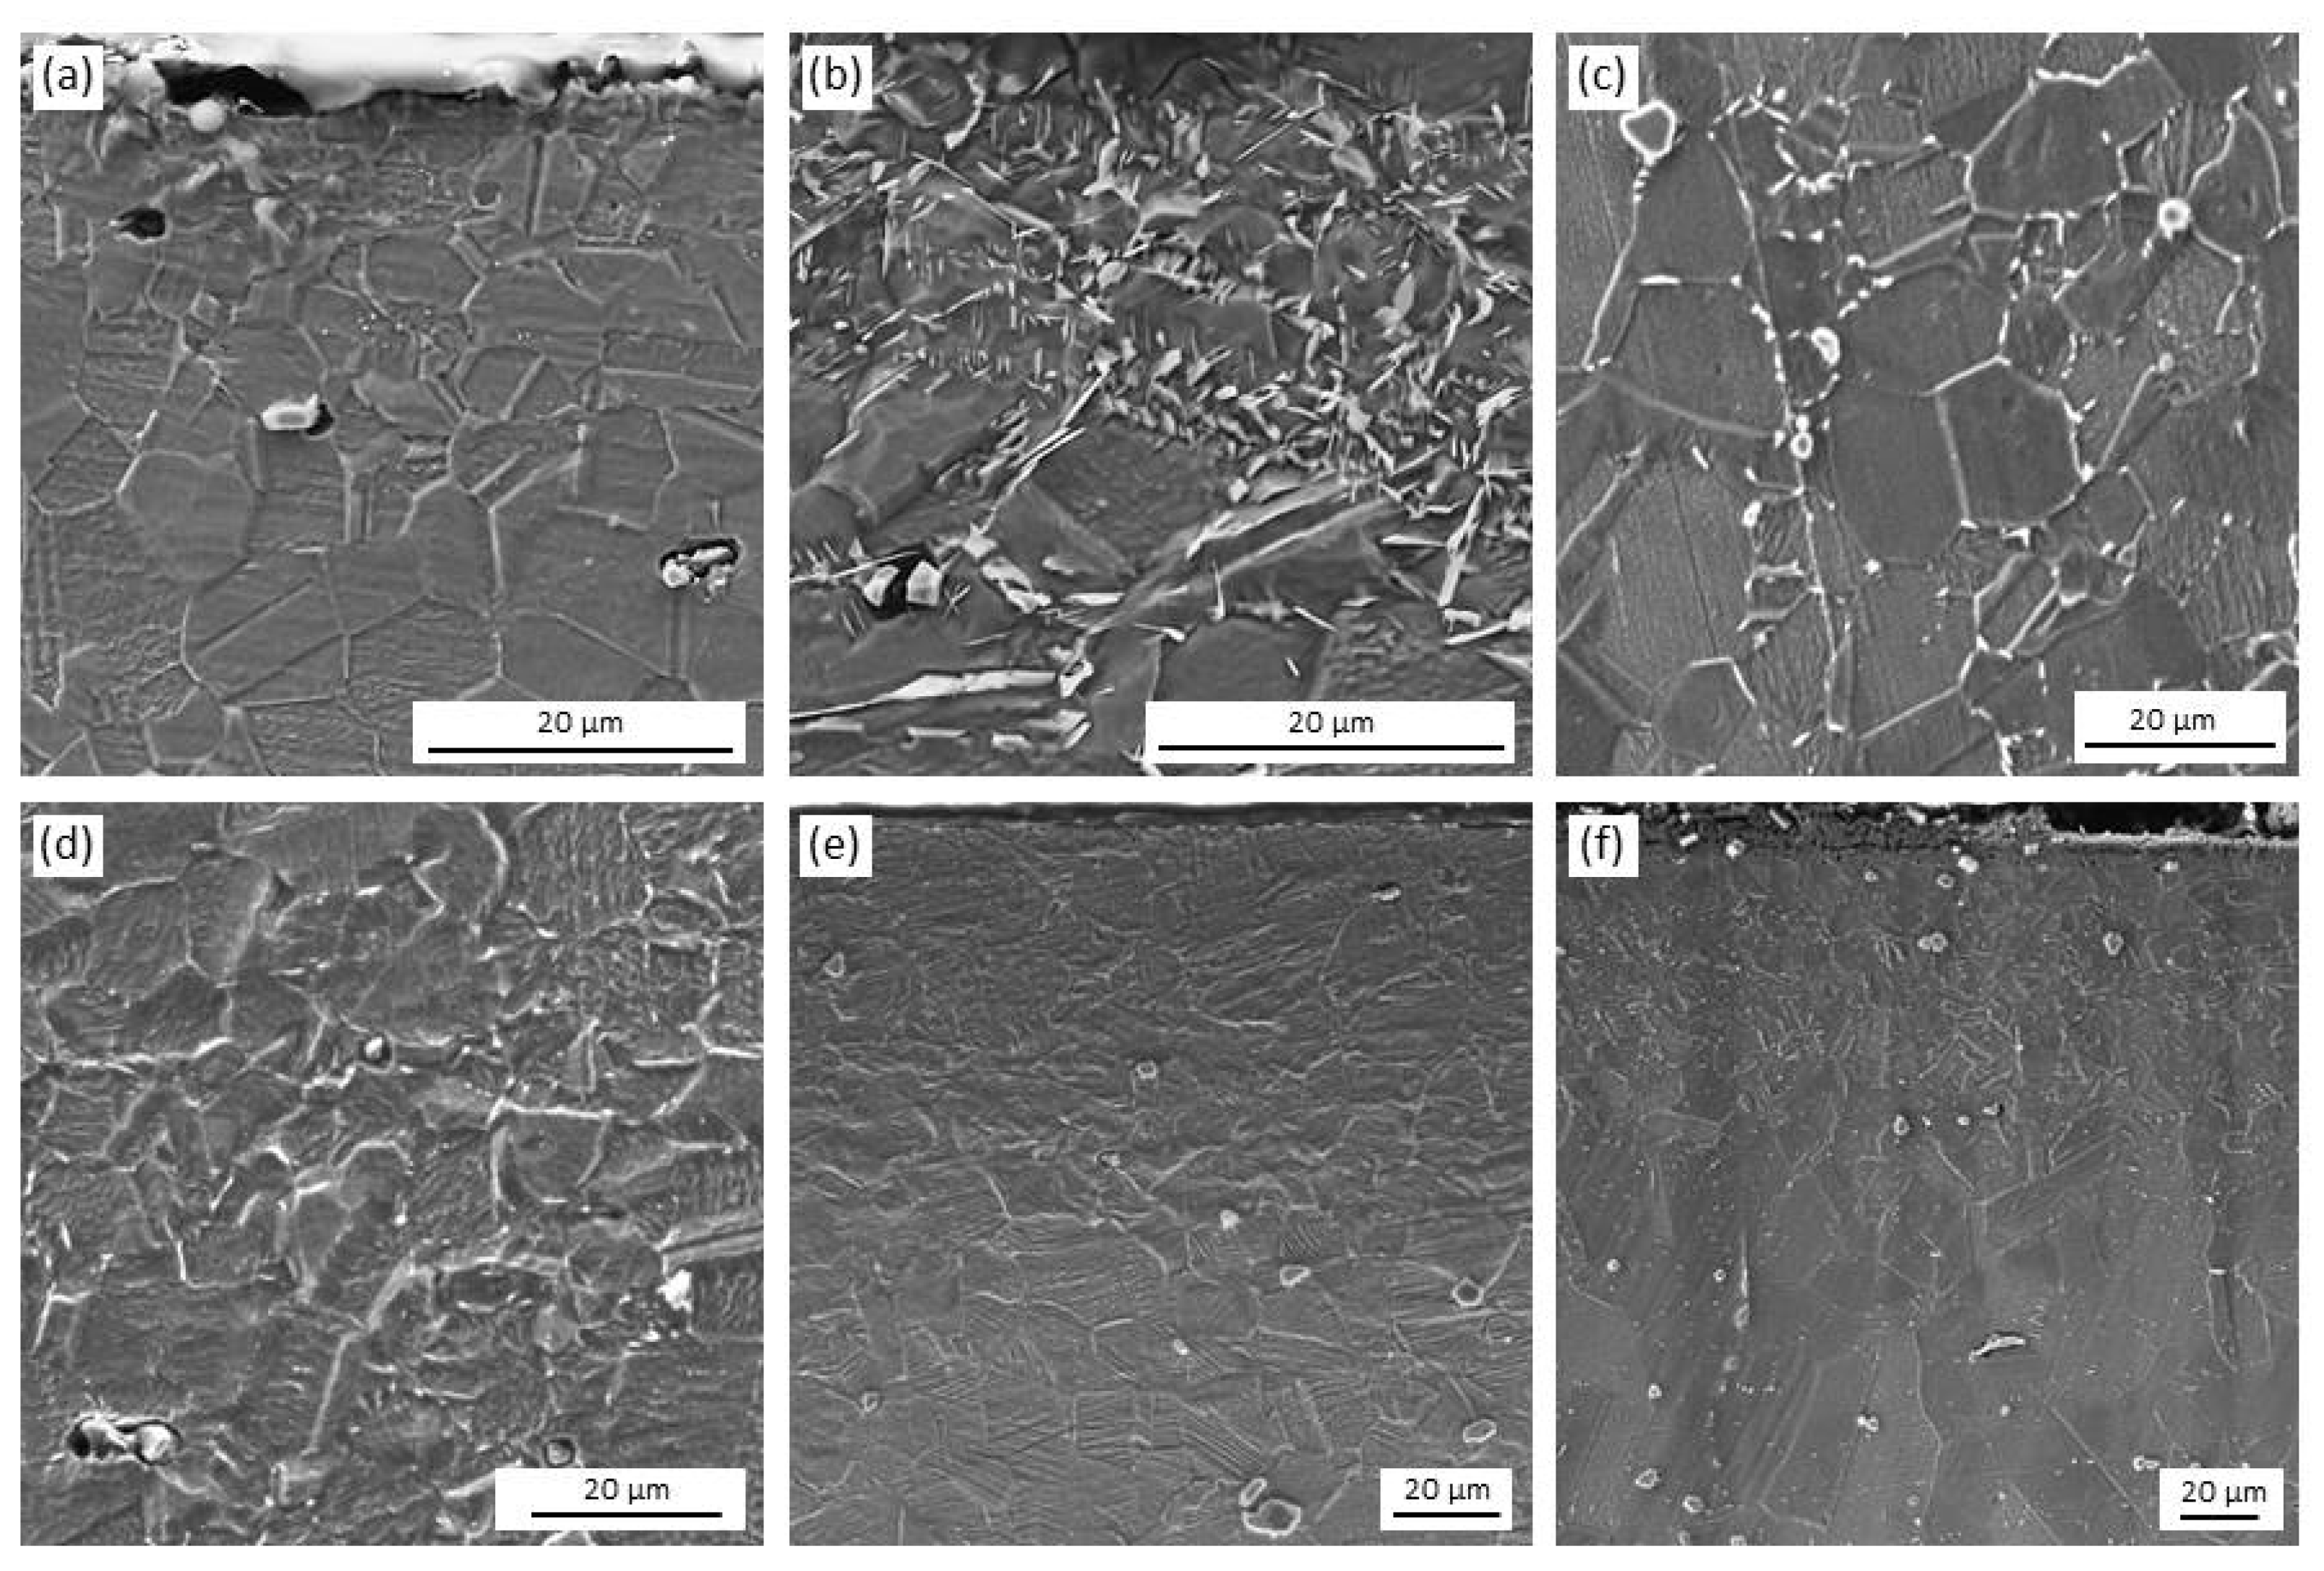
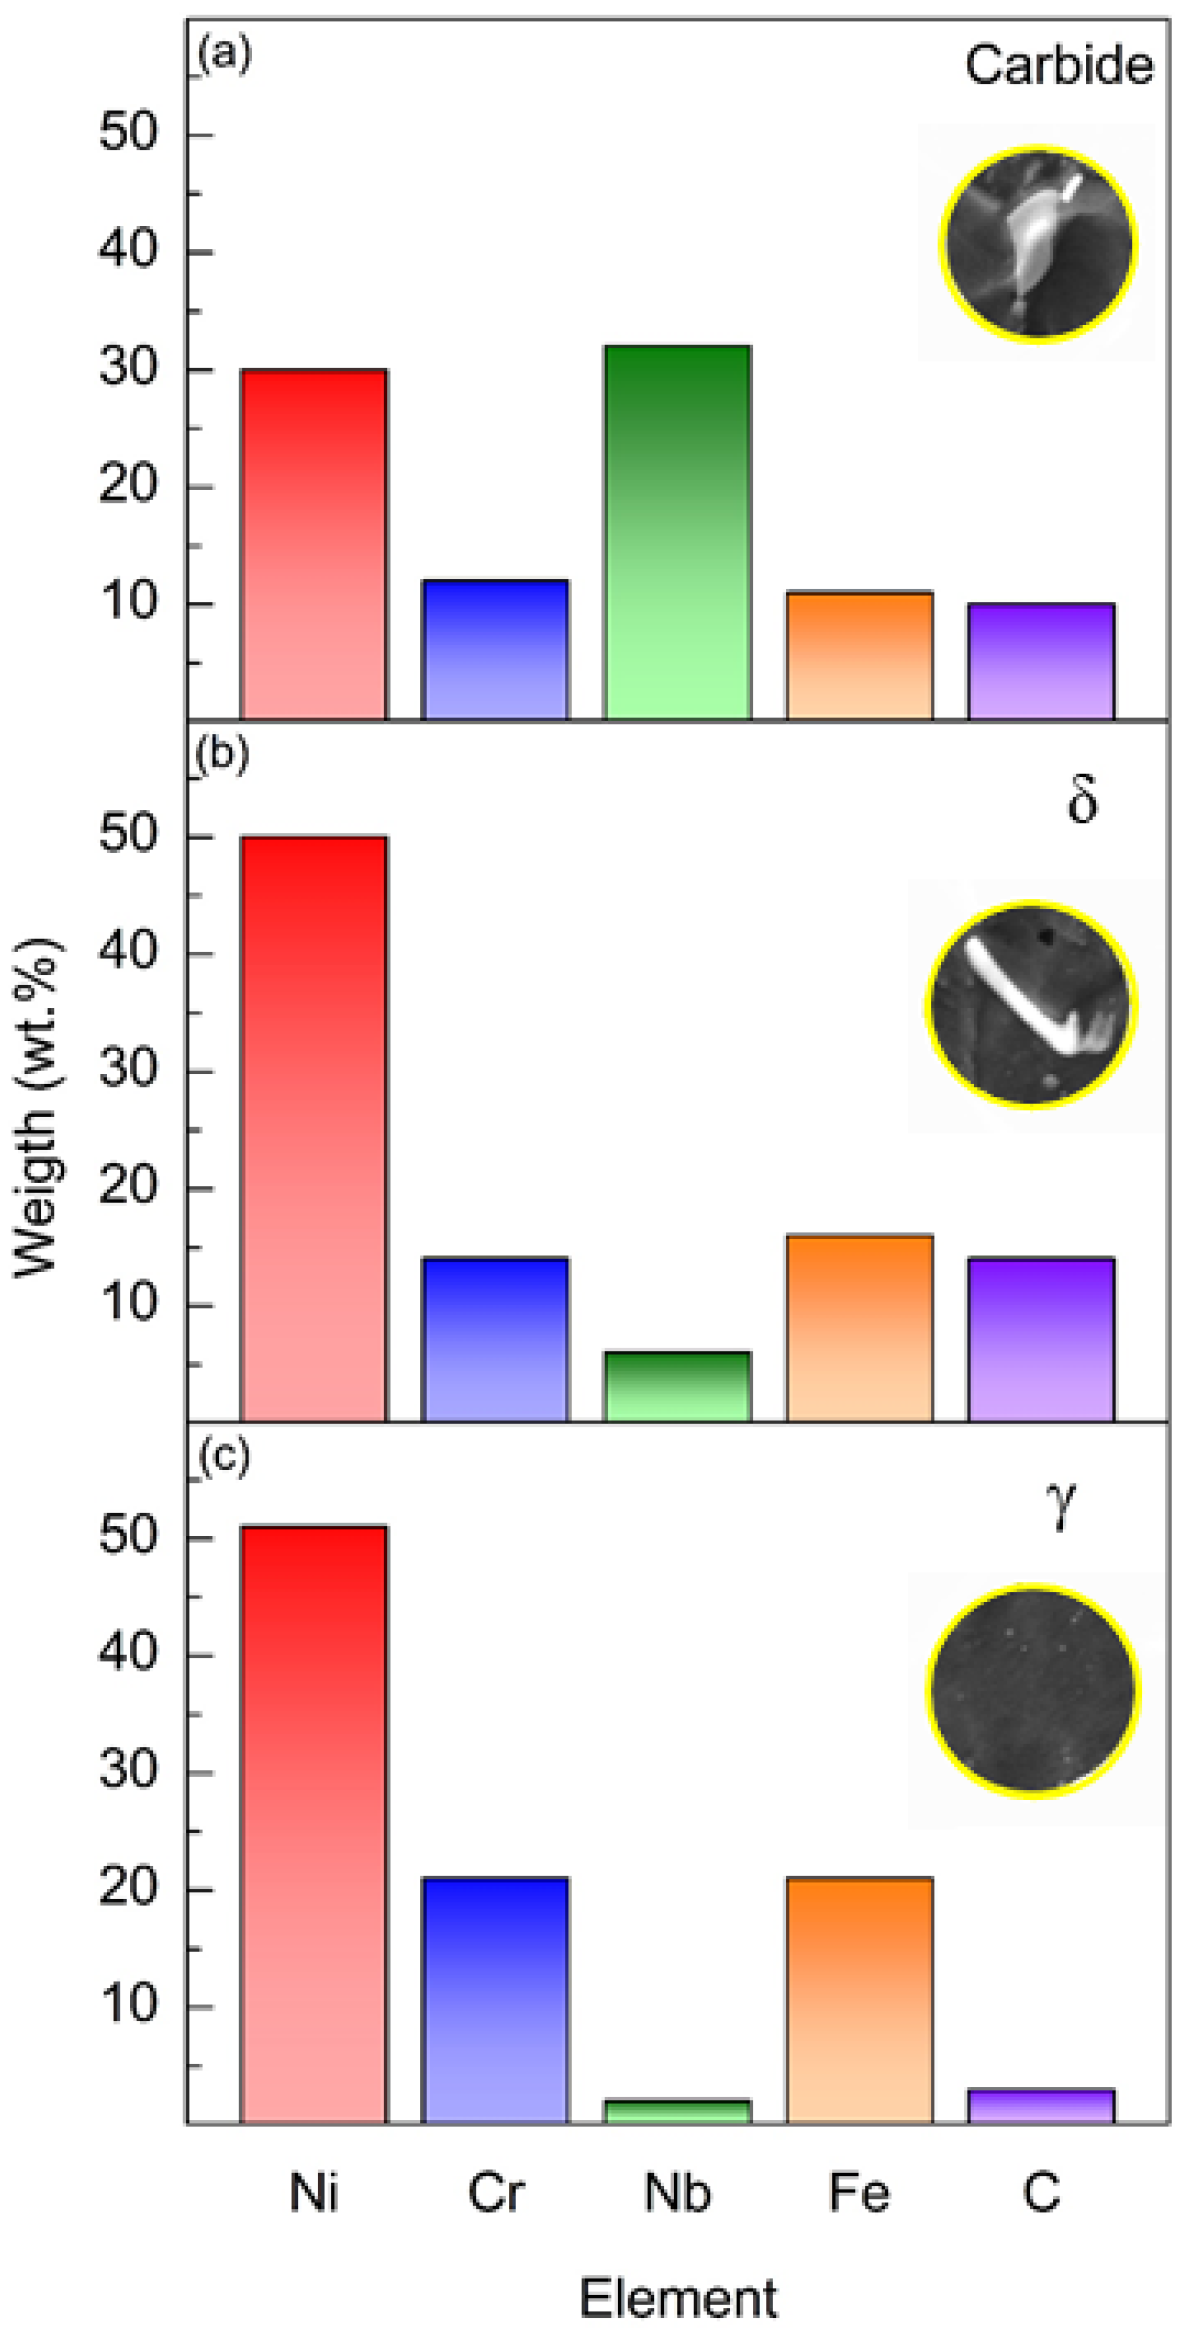
3.1. Microstructure Characterization

The optical images of the cross-section of Inconel 718, with and without the UNSM treatment, can be seen in Figure 2. The microstructure seen in both images resembles those found in the literature, mainly γ-phase matrix with some deformation twins scattered around the microstructure [20,25].
The γ-phase grains have polygonal equiaxed morphology, having an average grain size of 11.5 µm, while the UNSM treatment reduced the grain size 36%, showing an average size of 7.4 µm (see Figure 2). The UNSM region has an average depth after the triple processing of 10 µm and a transition region of approximately 30 µm for both the UNSM and TMT samples (see Figure 2b).

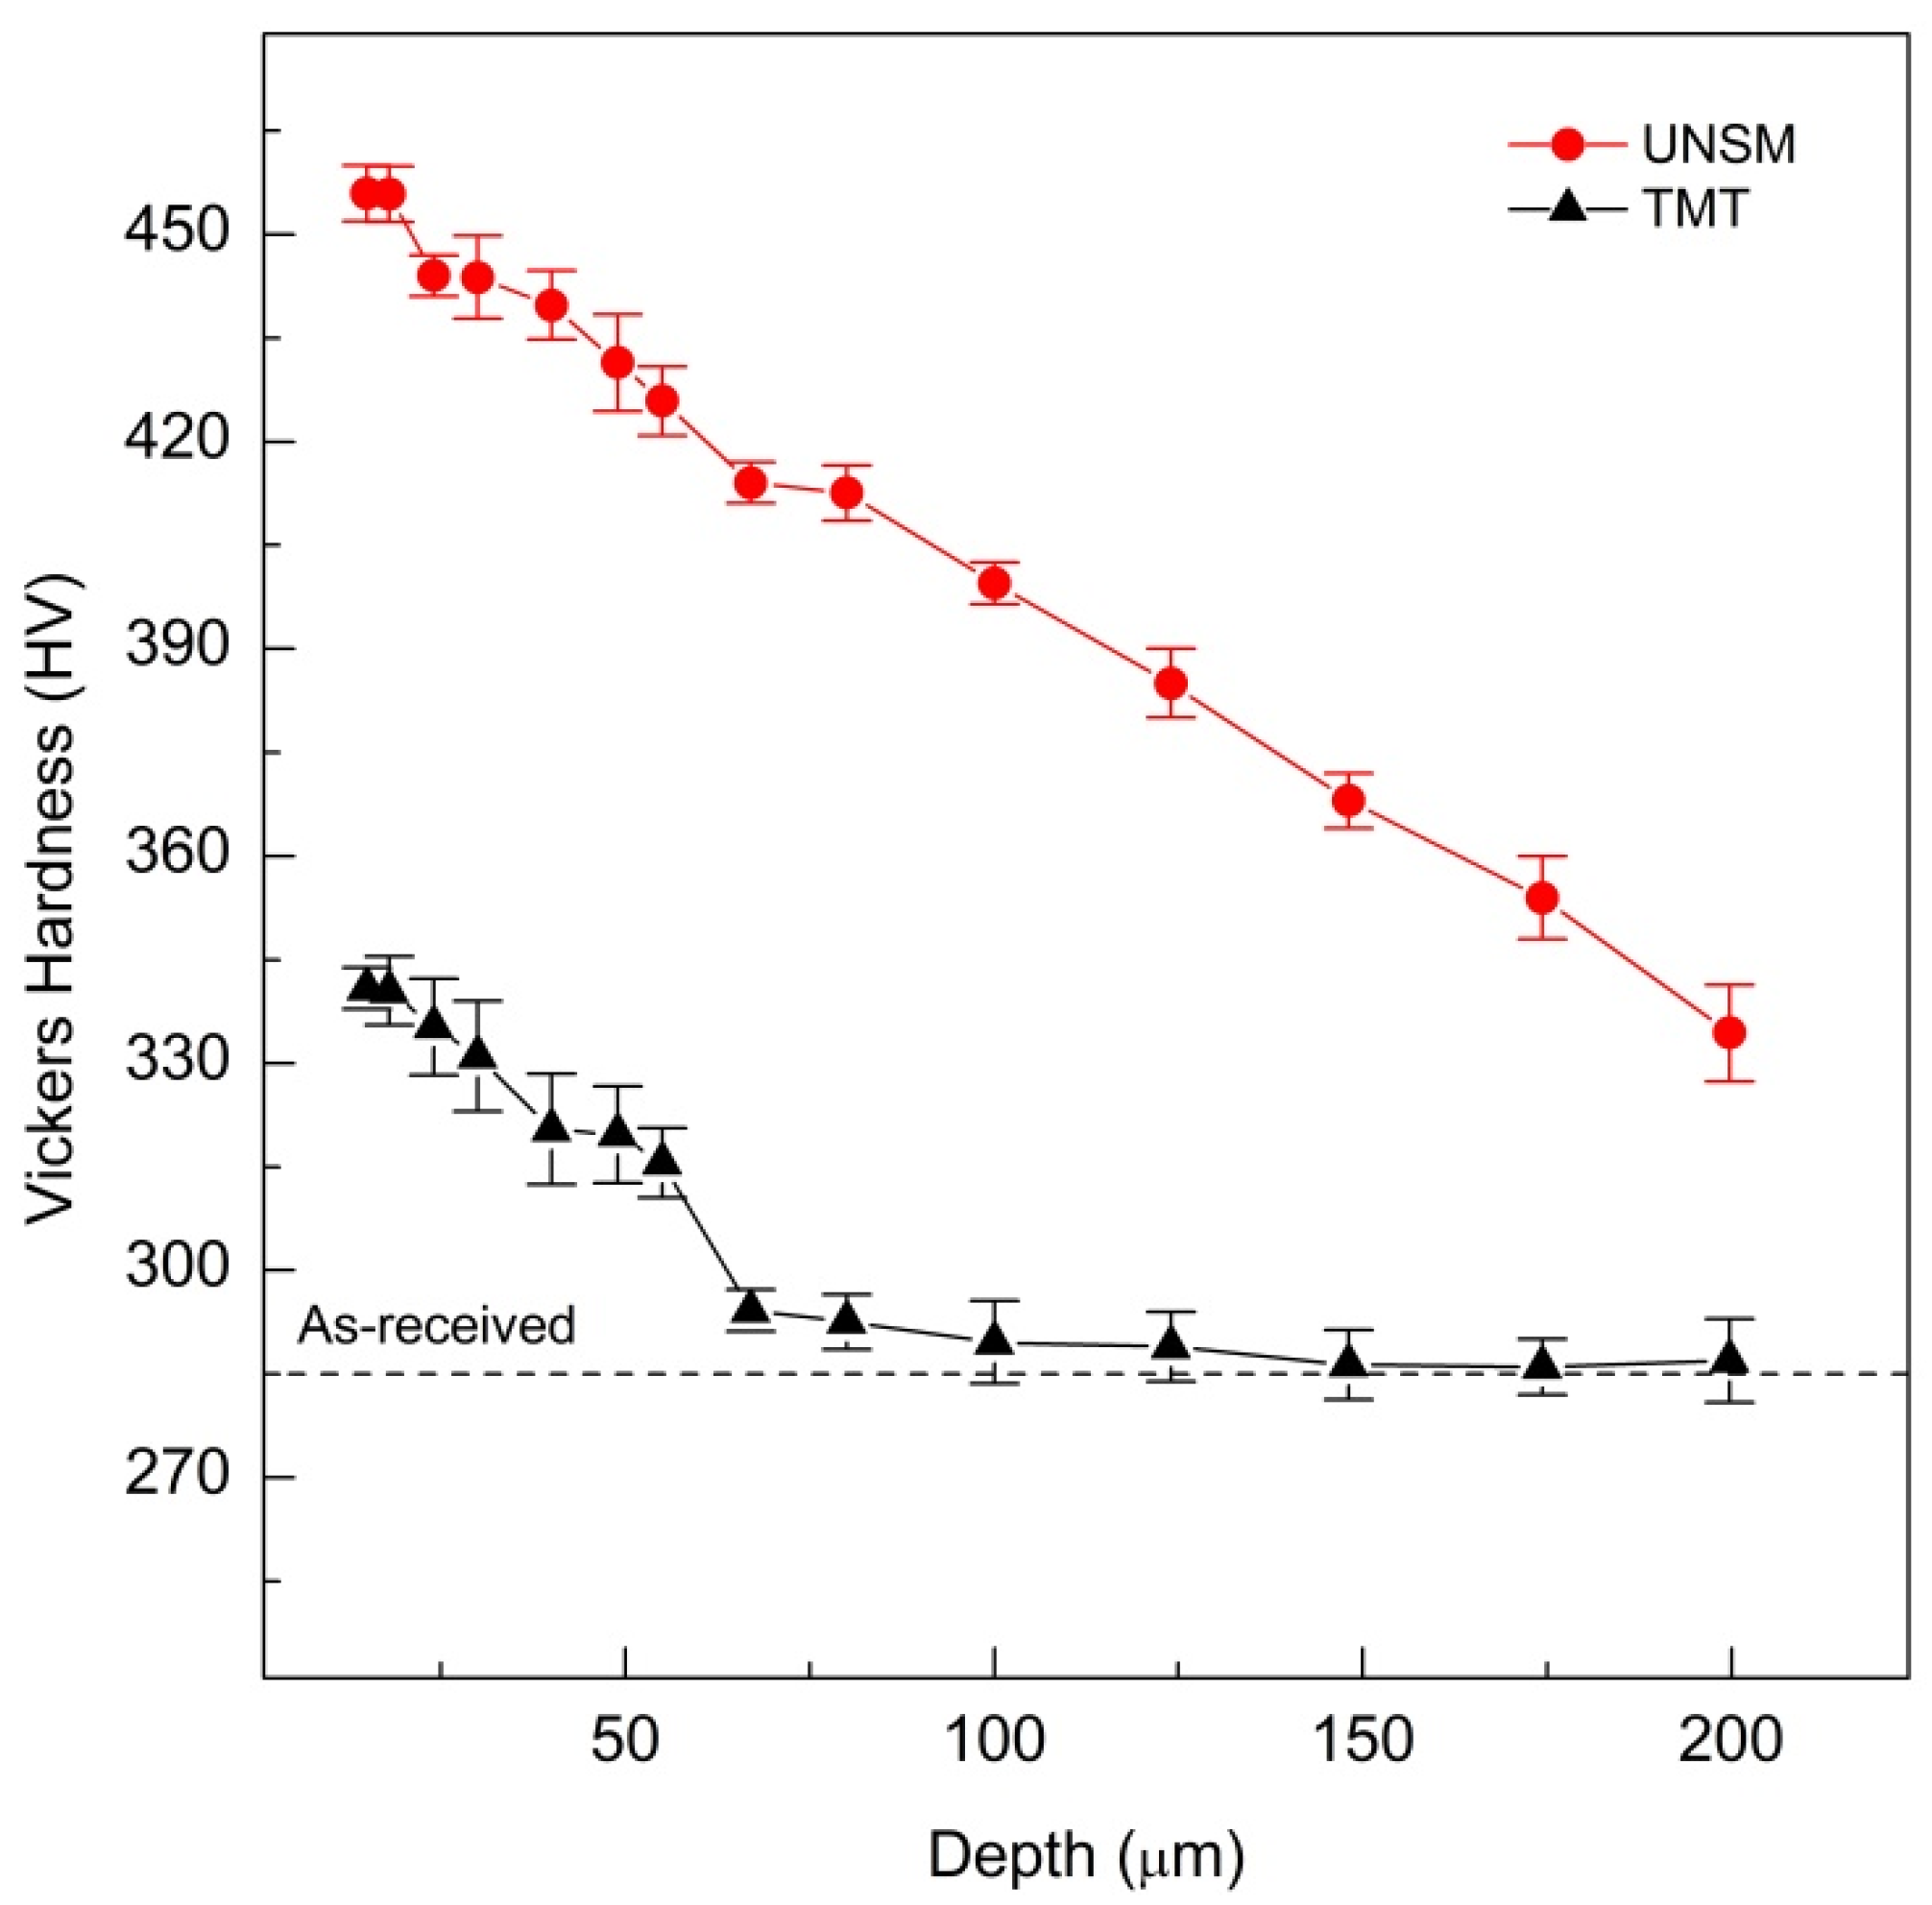
3.2. Vickers Hardness

Vickers hardness testing was performed on the AR, UNSM, and TMT samples to test the differences caused by surface modification processing. First, the AR sample was measured to have an average hardness of 285 HV throughout the entire section (see Figure 3). Then, the UNSM sample was tested and gave the highest improvement with a hardness value of 454 HV, close to the outermost surface. However, after the first couple of µm in depth, there was a hardness gradient, decreasing as depth increases. The high plastic deformation was concentrated at the top surface, where the density of deformation twins and grain refinement was more relevant, indicating that the further away from the treated surface the less influence of the retained plastic deformation. Nevertheless, even with the decrease in hardness, the UNSM sample had a higher hardness than the AR after 200 µm in depth (334 HV). The TMT sample also increased its hardness compared to the AR, increasing to 340 HV. Despite this increase, it was below the UNSM sample and returned to the initial hardness after approximately 50 µm. The annealing temperature of 1000 °C after each UNSM process reduced the effect of the UNSM treatments as the refined grains were recrystallized.

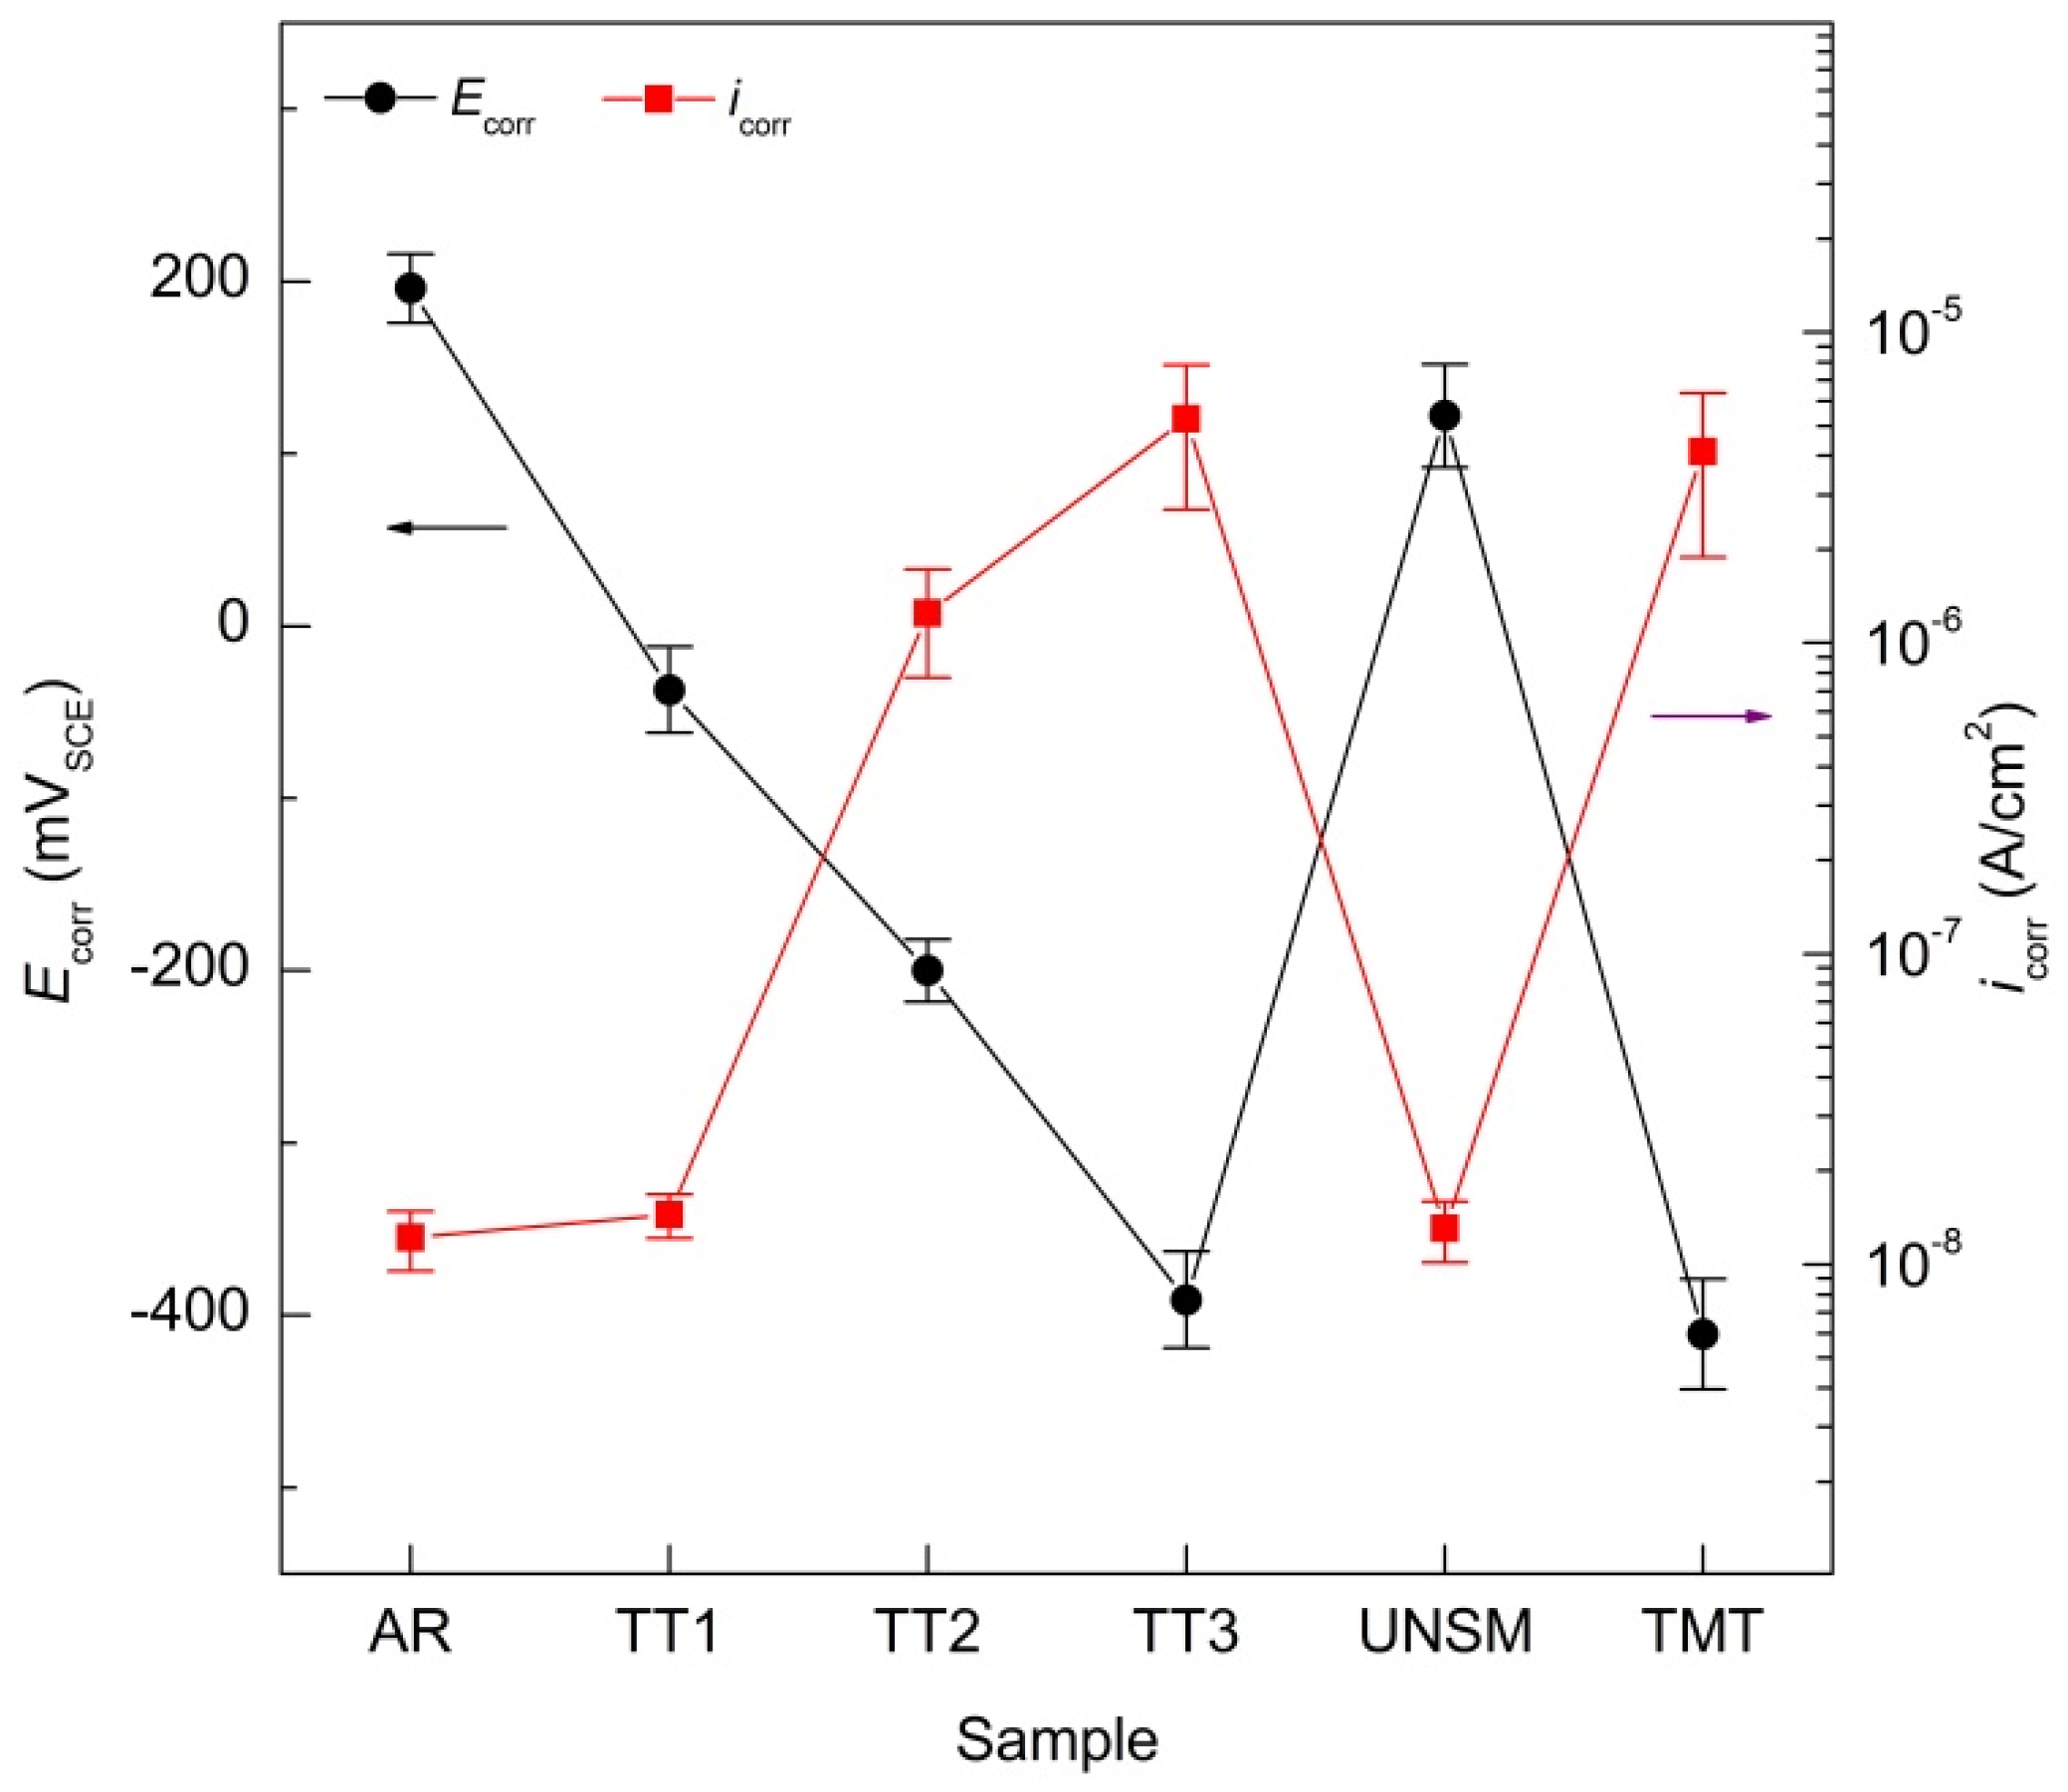
3.3. Linear Polarization Resistance (LPR)

LPR was used to monitor Ecorr and icorr, which was calculated using the Stern–Geary relationship, icorr = B/Rp, where Rp is the polarization resistance and B is the Stern–Geary constant, which had a value of 71 mV for Inconel 718 in 3.5 wt.% NaCl [20]. However, the icorr values had to be compensated due to the ohmic drop effect of the electrolyte, as the measured Rp from the LPR also included them [26]. Figure 4 shows the combined monitoring of the Ecorr and the icorr for all six samples in 3.5 wt.% NaCl. The Ecorr had a decreasing trend with increasing temperature of the TT, starting at +200 mV versus SCE with the AR sample and becoming less noble with TT1, TT2, and TT3 with −37, −200, and −390 mV versus SCE respectively.
Likewise, icorr changed accordingly with the Ecorr, increasing as the temperature increased and decreasing once the UNSM was applied. Interestingly, the icorr also went back to the highest values for the TMT sample, showing the detrimental effect of the treatment temperature being close to the temperature of solvus for δ-phase.

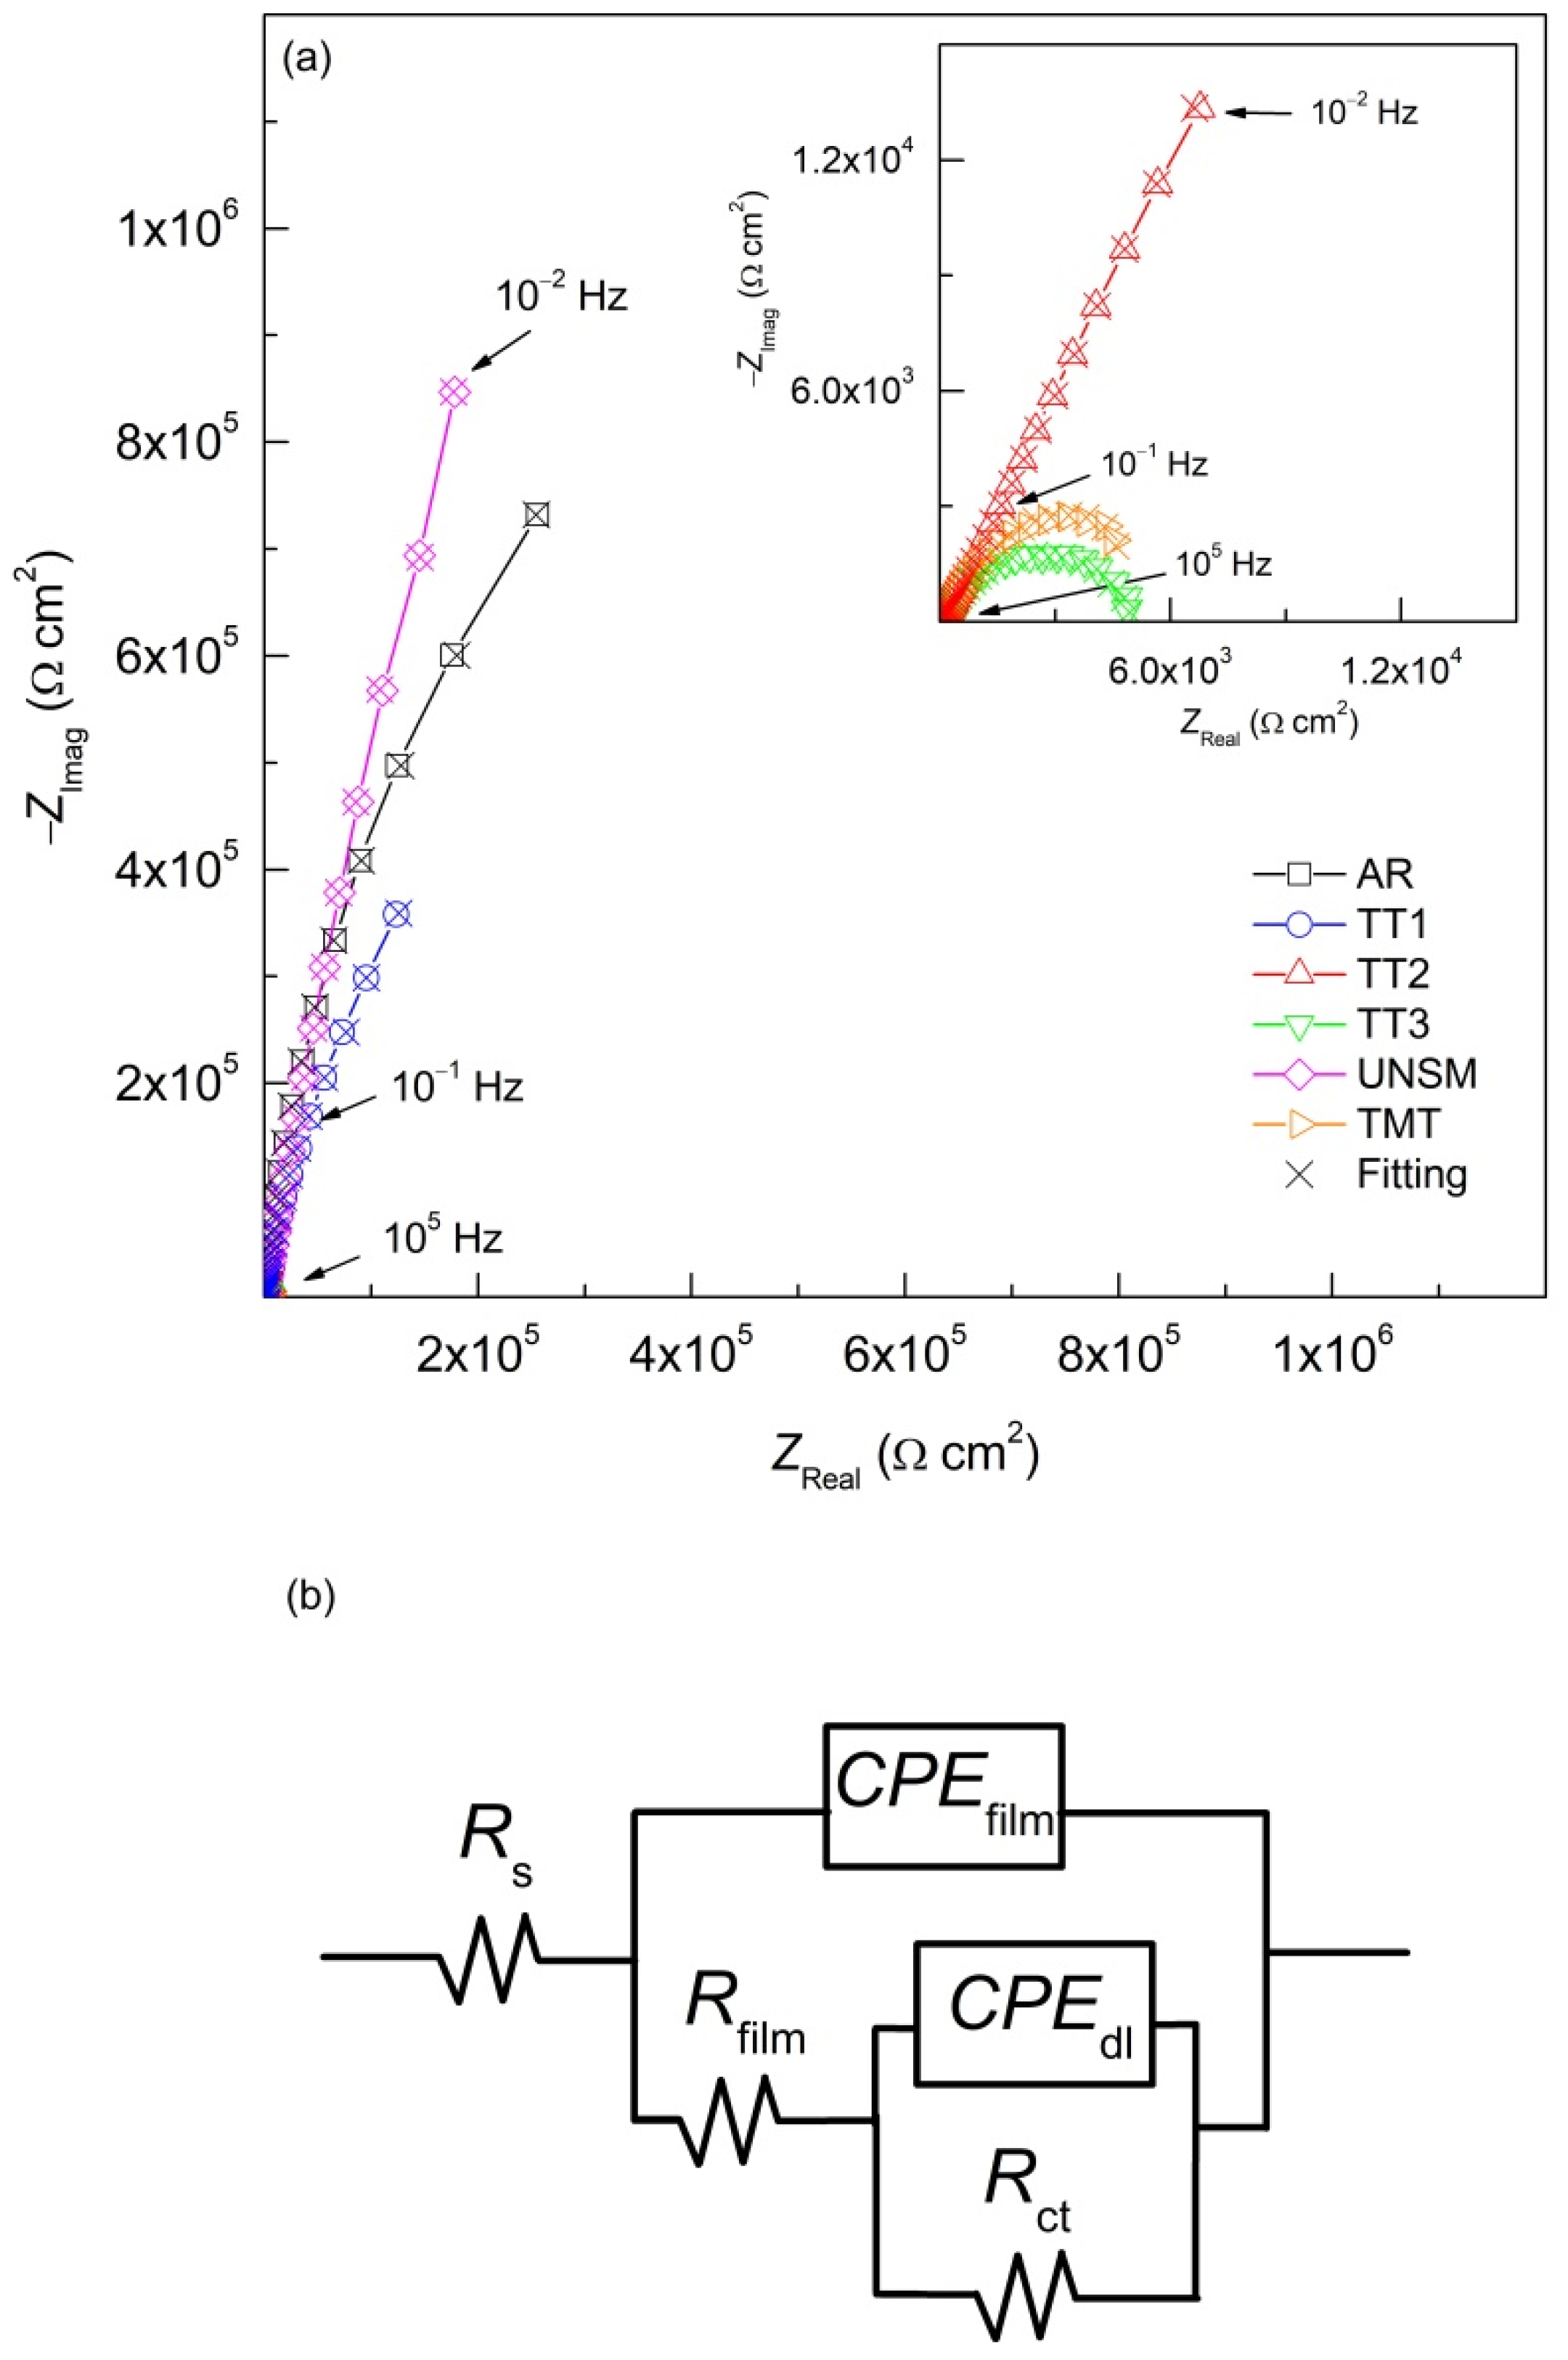
3.4. Electrochemical Impedance Spectroscopy (EIS)

EIS analysis was performed for the six different treatments to study the changes over the temperature and mechanical process of the passive film/steel interfaces, where the Nyquist plots for Inconel 718 in 3.5 wt.% NaCl can be seen in Figure 5a. The Nyquist plots show a decreasing impedance trend with increasing thermal treatment temperature, coinciding with the behavior seen in the LPR section, with the exception of the UNSM treatment, which enhanced the corrosion performance compared to the AR sample (see Figure 5a). In order to obtain data from the passive film/steel interfaces, the impedance data were fitted to a hierarchically distributed electric equivalent circuit (EEC) with two time constants (see Figure 5b) [27,28]. The elements of the EEC include: Rs, the resistance of the electrolyte solution, which is in series with a parallel time constant; Rfilm//CPEfilm, representing the passive film on the Inconel surface, attributed to high frequency process; and finally, in series with the passive film, a second time constant, Rct//CPEdl, defining the corrosion process and attributed to low frequency processes. Rfilm and CPEfilm are the parameters defining the passive film, while Rct and CPEdl define the charge transfer resistance and the double-layer capacitance, where the Rct is inversely related to the icorr by Stern–Geary [12,29]. The fitting parameters of the proposed EEC for each of the treatments are seen in Table 3, where an average chi-square (χ2) of 10−3 and an error for each element less than 10% were obtained.
Before the impedance data were further analyzed, Kramers–Kronig transformations were performed, using Equations (1) and (2), to test the robustness [30]:
Z Real ( ω ) = Z Real ( ) 2 π 0 x   Z Imag ( x ) ω   Z Imag ( ω ) x 2 ω 2 d x  
Z Imag ( ω ) = 2 ω π 0 x   Z Real ( x ) Z Real ( ω ) x 2 ω 2 d x  
where ZReal(ω) and ZImag(ω) are the real and imaginary portions of the impedance, respectively. x is an integration variable, the value of which is between 0 and , and ω is the angular frequency [31]. From the imaginary component, the real component can be calculated with Equation (1), and vice versa with Equation (2). From this fitting, the data were proved to be robust.

4. Discussion

4.1. Microstructure Characterization

In addition to the OM characterization, secondary electron SEM images of all cross-section samples were performed to reveal the microstructure and the secondary phases (see Figure 6). The AR sample shows similar microstructure morphology to the one seen in the OM images (see Figure 6a). It shows a purely γ-phase matrix with some minor NbC formation, preferentially inside the twins and the triple junctions, sites with higher energy for carbides and secondary phase segregations [32]. These NbCs are attributed to the TT during the manufacturing process, hence their low population density. The TT1 sample, as seen and previously discussed in the TTT diagram (see Figure 1), shows a high density of γ″-phase at the grain boundaries and some nucleation inside the grains (see Figure 6b). The treatment at 675 °C for 2 h shifts the sample inside the γ″-phase region, hence the great difference between the AR and TT1 microstructure. In addition to the precipitation of γ″-phase, which depletes the γ-phase and migrates Cr from the grain to the grain boundary, some NbCs are seen, similar to the AR sample. Once the temperature rises over the solvus of the γ′/γ″ phase (886 °C), part of the γ″-phase is dissolved from the grain boundaries and diffused into the grain, reducing the population of γ″-phase (see Figure 6c). Furthermore, due to the temperature of 900 °C, there is also a transformation of γ″ to δ-phase as seen in the TTT diagram in Figure 1, further decreasing the population of γ″-phase at the grain boundaries. The annealing treatment of 1000 °C for 10 min, sample TT3, promotes a scarce formation of equiaxed elongated δ-phase without forming the unstable γ″-phase, evidenced by the small quantity of secondary phases at the grain boundaries (see Figure 6d). Because of the lower exposure time, the density of δ-phase is not as prevalent as the TT2 sample for the γ″-phase. The UNSM sample shows the same morphology and regions as the ones in the microstructure from Figure 2b (see Figure 6e). The top surface, where the effect of the UNSM processing is concentrated, displays a high plastic deformation, making nearly indistinguishable fine grains. This UNSM region is also populated by deformation twins, increasing the hardness of Inconel 718, as seen by the Vickers hardness testing (see Figure 3). Nevertheless, there is no equivalent increase in the nucleation of NbCs or secondary phases due to the UNSM processing. Finally, the TMT sample presents the regions previously seen in the UNSM sample with the addition of a higher density of NbCs and δ-phase formation (see Figure 6f). The grain refinement at the top surface increases the grain boundary density, promoting more sites for the nucleation of secondary phases and NbCs once the TT is applied. Moreover, the UNSM processing in addition to the annealing treatment allowed the formation of an oxide scale at the top surface.
In addition to the SEM study, EDX analysis was carried out for sample TT3 to reveal the chemical composition of the promoted δ-phase as well as the niobium carbides (NbCs) (see Figure 7 and Figure 8). The micrograph of sample TT3 shows the previously seen polygonal equiaxed γ-phase matrix, with the addition of the needle shape δ-phase, promoted by the 1000 °C for 10 min treatment as seen in the TTT diagram, and the NbCs formed at the grain boundaries (see Figure 7). The observed amorphous carbide is located at a triple joint, which is a preferential Cr depletion site originating from the Cr diffusion process due to the TT [10].
Its elemental composition reveals that the main elements forming it are Nb and Ni, with 32 and 31 wt.% respectively, followed by a similar amount of Cr, Fe, and C with 12, 11, and 10 wt.%, respectively (see Figure 8a). As previously seen in the SEM analysis, the stable δ-phase is concentrated at the grain boundaries, depleting the γ matrix chromium content and increasing the Nb and C content (see Figure 8b). Its elemental composition slightly changes from the original (see Figure 8c).

4.2. Vickers Hardness

The change in hardness can be related to the corrosion resistance of the sample by the grain size and the microstructure of the sample [33]. Inconel 718 is a super-nickel alloy that promotes a stable γ-phase matrix thanks to its elemental composition (see Table 1). Based on this composition the stacking fault energy (SFE) can be calculated, giving information of possible microstructure transformation upon a mechanical stimulus, like the one from the UNSM processing [34]. Using Equation (3) the SFE can be calculated:
SFE (mJ/m2) = 25.7 + (2 × Ni) + (410 × C) − (0.9 × Cr) − (77 × N) − (13 × Si) − (1.2 × Mn)
The obtained value of 127.89 mJ/m2 lies in the dislocation glide region (SFE > 40 mJ/m2), indicating that no strain-induced martensite is promoted by the UNSM processing [35]. As no phase transformation happens due to the processing, all the changes are promoted only by the TT. Hence, the TT is the responsible for the difference in the corrosion behavior between the UNSM and the TMT. The greater grain size, due to the recrystallization of the annealing process, and the formation of carbides by the high temperature of 1000 °C above the solvus γ′/γ″ increased the corrosion susceptibility, as seen by previous authors [36]. The higher density of carbides (NbCs) and of more active phases, like the γ″ and δ-phase compared to the γ-phase, enhanced the susceptibility of Inconel 718 to the chlorides in the solution.

4.3. Linear Polarization Resistance (LPR)

The TT1 sample had a lower Ecorr compared to the AR sample due to the γ′/γ″ phase transformation from the γ-phase matrix, in which the γ-phase is more stable, thus exhibiting a more noble potential. This transformation was mainly promoted at the grain boundaries due to the temperature range of 675 °C, as seen in Figure 6b. The γ″-phase is an unstable phase, decreasing the corrosion protection as well as producing micro galvanic coupling with the more stable γ-phase matrix [37]. TT2 is above the solvus for the γ′/γ″ (886 °C), reducing the amount of γ″-phase in the grain boundaries but increasing it inside the grain, further depleting the corrosion properties [38]. Finally, TT3 decreases its corrosion protection properties as the annealing temperature of 1000 °C promotes the formation of NbCs at the grain boundaries. Accordingly, the icorr increased with increasing temperature, rising over two orders of magnitude from the AR at 1.22 × 10⁻⁸ A/cm2 to the TT3 at 5.27 × 10⁻⁶ A/cm2. Nevertheless, the UNSM treatment, with its grain refinement and higher dislocations on the top surface, only degraded its Ecorr by 70 mV; however, it lowered its icorr to 1.30 × 10⁻⁸ A/cm2, a sign of its enhanced pitting corrosion protection [14]. The more active surface, once it is in contact with the pH near-neutral solution, is able to form a passive film rich in Cr oxides, which serves as a protective barrier against the Cl in the solution [37]. In addition, the low chloride content of 3.5 wt.% NaCl for Inconel 718 is not enough to dissolve the passive film and produce pitting. Nonetheless, the TMT sample decreased its Ecorr to values similar to the TT3, reaching the −410 mV versus SCE and having an icorr of 4.12 × 10⁻⁶ A/cm2. The increased density of grain boundaries of the TMT sample combined with the 1000 °C enhances the pitting corrosion susceptibility by the formation of NbCs shown in Figure 6f.

4.4. Electrochemical Impedance Spectroscopy (EIS)

The Rs for all samples was between 3.48 and 4.93 Ω cm2. The Rfilm of the AR started with 7.46 × 10⁵ Ω cm2 followed by the TT1 with 1.13 × 10⁵ Ω cm2. TT2 and TT3 show a decrease of two and three orders of magnitude, reaching 1.53 × 10³ and 4.38 × 10² Ω cm2, respectively. As it was seen with the icorr trend, the increasing temperature decreases the impedance response, which is related to the corrosion protection behavior against the chlorides of the sample, promoting NbCs and secondary phases that are more active than the γ-phase. The UNSM processing, with its grain refinement, increases the Rfilm to values close to the AR, with 4.52 × 10⁵ Ω cm2. Nevertheless, the TMT reduced its value to a 1.27 × 10³ Ω cm2 intermediate value between the TT2 and TT3, coinciding with the LPR behavior seen for the icorr. The CPEfilm, with its Yfilm, pseudo-capacitance shows an increasing trend with the rising temperature, suggesting a thinning of the passive film, as the thickness is inversely related to the capacitance, with values ranging from 1.85 to 124 µS/cm2. The nfilm factor indicating the ideality of the capacitor remains largely unchanged for all samples at approximately 0.780 [39]. AR shows one of the highest Rct values with 8.12 × 10⁵ Ω cm2, due to the unmodified γ-phase matrix. After the thermal treatments, the Rct decreases as previously seen with the LPR test, and the TT1 does not decrease considerably reaching 2.02 × 10⁵ Ω cm2. However, TT2 and TT3 specimens rapidly drop as the solvus for γ′/γ″ is passed, with 2.15 × 10⁴ and 5.81 × 10³ Ω cm2, respectively. The phase transformation from the TTT diagram from the γ-phase to the γ″ and δ-phase and the nucleation of NbCs at the grain boundaries reduce the corrosion resistance of the passive film (see Figure 1). The UNSM increases the Rct over the AR showing a value of 1.61 × 10⁶ Ω cm2, as seen in Figure 5a, enhancing the corrosion protection of the sample against the chlorides in the solution. Finally, the TMT sample reaches a similar value to the TT3, which has the same thermal treatment, despite having the UNSM process (see Table 3). The recrystallization of the grains plus the formation of NbCs is more detrimental to the corrosion properties than the bust from the grain refinement from the UNSM processing. The Ydl of the CPEdl, related to the corrosion properties of the double layer, is mainly in the tens of µS/cm2 range, similar to the Yfilm, with the exception of the TT3 and TMT, which lie above the solvus of γ′/γ″, increasing their values to 1.98 × 10⁻⁴ and 8.10 × 10⁻⁵ S/cm2, respectively. To further check the robustness of the results, the Rct values were compared between the LPR (DC method) and the EIS tests (AC method), plotted together in Figure 9, where the Rct values of the LPR were corrected from the ohmic drop effect, as described in the LPR section. Both sets of Rct values are close to each other, being in the same order of magnitude for all the samples. The obtained results using different methods, DC and AC, are in good agreement and are consistent with each other.
The CPE elements present in the EEC represent a branched ladder RC network, hence a non-ideal capacitor, indicating that the capacitance cannot be measured directly from its value [40]. In order to correct the pseudo-capacitance value of the CPEdl and find its effective capacitance (Ceff,dl), Brug et al. proposed taking into account not only the Ydl and ndl but also the resistance of the electrolyte and the charge transfer resistance, Rs and Rct, respectively (see Equation (4)) [39,41]:
C eff , dl = [ Y dl ( 1 R s + 1 R ct ) ( n dl 1 ) ] 1 n dl
The corrected Ceff,dl values are plotted in Figure 10, where the estimated thickness is also added using the inverse relationship seen in Equation (5):
C eff , dl = ε o   ε film   A d
where εo is the dielectric constant of the permittivity of the vacuum (8.84 × 10⁻¹⁴), εfilm is the dielectric constant of the oxide film (a value of 15 was used for the passive film formed in stainless steel), A is the exposed surface area, and d is the thickness of the passive film [42,43]. The Ceff,dl values are all in the tens of µF/cm2, ranging from 8.13 to 26.41 µF/cm2. The corresponding thickness of the double layer is also constant in the nm range, with a minimum of 0.52 nm for TT2 and a maximum of 1.70 nm for the UNSM. The thickest passive film observed for the UNSM treated sample is in good agreement with the previous results, as the UNSM treatment concentrates more energy and activates the top surface growth reaction kinetics, enabling a faster formation and growth of the passive film in the near-neutral pH of the 3.5 wt.% NaCl solution.

4.5. Infinite Focus Microscopy (IFM)

Figure 11 shows the IFM images at ×100 magnification of all Inconel 718 samples after the electrochemical testing in 3.5 wt.% NaCl. The AR showed the most uniform top surface, where only some minor dissolution was observed (see Figure 11a). Overall, the AR did not show any sign of pitting. The TT1 sample started degrading from the AR condition as more areas with deeper grooves were seen (see Figure 11b). The TT2 sample continued with the increasing depth in the dissolution, reaching 600 nm (see Figure 11c). The TT above the γ′/γ″ solvus temperature showed a significant effect, as previously seen in the EIS testing, degrading the corrosion protection of the passive film (see Figure 3 and Figure 6). Once the 1000 °C treatment was applied to the Inconel 718 sample, the majority of the top surface seemed to have some dissolution within the 100 to 300 nm depth (see Figure 11d). The UNSM sample did not show much corrosion, only some minor areas with some dissolution (see Figure 11e). For the remainder of the surface area, the UNSM sample showed a homogeneous surface, coinciding with the enhanced corrosion protection seen in the previous electrochemical section. Finally, the TMT sample showed that, even with UNSM processing, the TT of 1000 °C was detrimental for corrosion protection, showing considerable areas where the depth of the dissolution reached an average of 400 to 600 nm (see Figure 11f). This dissolution was not as concentrated as the TT3 sample, but it was still covering a great area of the top surface.

5. Conclusions

In this work, the influence of the TT and TMT on Inconel 718 using the UNSM treatment on the corrosion behavior was studied. The main conclusions can be drawn as follows:
The UNSM process increased the pitting corrosion protection of Inconel 718 in 3.5 wt.% NaCl compared to the AR and the other TT samples, due to the active surface that the UNSM formed, enabling a faster growth of the passive film.
The phase transformation of the γ-phase to γ′ by the TT diagram γ″ and δ-phases implied a reduction of the corrosion protection, seen in the lower Rct values from the EIS and LPR. Even with the grain refinement of the UNSM process, which enhanced the corrosion protection, the TMT had low impedance values due to the dense formation of NbCs.
Temperatures above the solvus of the γ′/γ″ and close to the solvus of the δ-phase, shifted the Ecorr towards more active potentials, and the icorr towards higher values, leading to a higher pitting corrosion susceptibility due to the precipitation of NbCs, γ″ and δ-phases.
The hardness increased with the UNSM treatment up to 450 HV, while the TMT only increased to 340 HV due to the addition of the annealing process recrystallizing the grains and reducing the dislocations. Nevertheless, both treatments had higher hardness than the 285 HV of the AR.
The pit density and pit depth increased with the increasing temperature, coinciding with the higher icorr values obtained by the LPR. While the USNM process only promoted some scarce pits, the TMT obtained greater areas with deeper pits due to the abundant NbCs.

Author Contributions

Conceptualization, D.M.B.; Methodology, U.M., J.R. and D.M.B.; Experimental design, U.M., J.R. and D.M.B.; Data analysis, U.M., J.R. and D.M.B.; Resources, D.M.B.; Writing—original draft preparation, U.M., J.R. and D.M.B.; Writing—review and editing, U.M., J.R. and D.M.B.; Visualization, D.M.B.; Supervision, D.M.B.; Project administration, D.M.B.; Funding acquisition, D.M.B. All authors have read and agreed to the published version of the manuscript.

Funding

This research was funded by Firestone Research, grant number 639430, and The University of Akron Fellowship FRC-207160.

Institutional Review Board Statement

Not applicable.

Informed Consent Statement

Not applicable.

Data Availability Statement

The raw/processed data required to reproduce these findings cannot be shared at this time as the data also form part of an ongoing study.

Acknowledgments

The authors acknowledge the technical support and facilities from The National Center for Education and Research on Corrosion and Materials Performance (NCERCAMP-UA), The College of Engineering and Polymer Science and The University of Akron.

Conflicts of Interest

The authors declare no conflict of interest.

References

  1. Azadian, S.; Wei, L.Y.; Warren, R. Delta phase precipitation in Inconel 718. Mater. Charact. 2004, 53, 7–16. [Google Scholar] [CrossRef]
  2. Hosseini, E.; Popovich, V.A. A review of mechanical properties of additively manufactured Inconel 718. Addit. Manuf. 2019, 30, 100877. [Google Scholar] [CrossRef]
  3. Zhang, H.; Li, C.; Guo, Q.; Ma, Z.; Huang, Y.; Li, H.; Liu, Y. Hot tensile behavior of cold-rolled Inconel 718 alloy at 650 °C: The role of δ phase. Mater. Sci. Eng. A 2018, 722, 136–146. [Google Scholar] [CrossRef]
  4. Kang, Y.J.; Yang, S.; Kim, Y.K.; AlMangour, B.; Lee, K.A. Effect of post-treatment on the microstructure and high-temperature oxidation behaviour of additively manufactured Inconel 718 alloy. Corros. Sci. 2019, 158, 108082. [Google Scholar] [CrossRef]
  5. Campos-Silva, I.; Contla-Pacheco, A.D.; Figueroa-López, U.; Martínez-Trinidad, J.; Garduño-Alva, A.; Ortega-Avilés, M. Sliding wear resistance of nickel boride layers on an Inconel 718 superalloy. Surf. Coat. Technol. 2019, 124862. [Google Scholar] [CrossRef]
  6. Zhang, H.; Li, C.; Liu, Y.; Guo, Q.; Huang, Y.; Li, H.; Yu, J. Effect of hot deformation on γ″ and δ phase precipitation of Inconel 718 alloy during deformation&isothermal treatment. J. Alloys Compd. 2017, 716, 65–72. [Google Scholar] [CrossRef]
  7. Jelvani, S.; Shoja Razavi, R.; Barekat, M.; Dehnavi, M.R.; Erfanmanesh, M. Evaluation of solidification and microstructure in laser cladding Inconel 718 superalloy. Opt. Laser Technol. 2019, 120, 105761. [Google Scholar] [CrossRef]
  8. Kulkarni, A.; Dwivedi, D.K.; Vasudevan, M. Dissimilar metal welding of P91 steel-AISI 316L SS with Incoloy 800 and Inconel 600 interlayers by using activated TIG welding process and its effect on the microstructure and mechanical properties. J. Mater. Process. Technol. 2019, 274, 116280. [Google Scholar] [CrossRef]
  9. Kañetas, P.P.; Osorio, L.R.; Mata, M.G.; De La Garza, M.; López, V.P. Influence of the delta phase in the microstructure of the Inconel 718 subjected to “Delta-processing” heat treatment and hot deformed. Procedia Mater. Sci. 2015, 8, 1160–1165. [Google Scholar] [CrossRef] [Green Version]
  10. Rafiei, M.; Mirzadeh, H.; Malekan, M. Micro-mechanisms and precipitation kinetics of delta (δ) phase in Inconel 718 superalloy during aging. J. Alloys Compd. 2019, 795, 207–212. [Google Scholar] [CrossRef]
  11. Anderson, M.; Thielin, A.L.; Bridier, F.; Bocher, P.; Savoie, J. δ Phase precipitation in Inconel 718 and associated mechanical properties. Mater. Sci. Eng. A 2017, 679, 48–55. [Google Scholar] [CrossRef]
  12. Luo, S.; Huang, W.; Yang, H.; Yang, J.; Wang, Z.; Zeng, X. Microstructural evolution and corrosion behaviors of Inconel 718 alloy produced by selective laser melting following different heat treatments. Addit. Manuf. 2019, 30, 100875. [Google Scholar] [CrossRef]
  13. Gill, A.; Telang, A.; Mannava, S.R.; Qian, D.; Pyoun, Y.S.; Soyama, H.; Vasudevan, V.K. Comparison of mechanisms of advanced mechanical surface treatments in nickel-based superalloy. Mater. Sci. Eng. A 2013, 576, 346–355. [Google Scholar] [CrossRef]
  14. Bazarbayev, Y.; Kattoura, M.; Mao, K.S.; Song, J.; Vasudevan, V.K.; Wharry, J.P. Effects of corrosion-inhibiting surface treatments on irradiated microstructure development in Ni-base alloy 718. J. Nucl. Mater. 2018, 512, 276–287. [Google Scholar] [CrossRef]
  15. Amanov, A.; Pyun, Y.S. Local heat treatment with and without ultrasonic nanocrystal surface modification of Ti-6Al-4V alloy: Mechanical and tribological properties. Surf. Coat. Technol. 2017, 326, 343–354. [Google Scholar] [CrossRef]
  16. Kattoura, M.; Mannava, S.R.; Qian, D.; Vasudevan, V.K. Effect of ultrasonic nanocrystal surface modification on elevated temperature residual stress, microstructure, and fatigue behavior of ATI 718Plus alloy. Int. J. Fatigue 2018, 110, 186–196. [Google Scholar] [CrossRef]
  17. Amanov, A.; Umarov, R. The effects of ultrasonic nanocrystal surface modification temperature on the mechanical properties and fretting wear resistance of Inconel 690 alloy. Appl. Surf. Sci. 2018, 441, 515–529. [Google Scholar] [CrossRef]
  18. Martin, U.; Ress, J.; Bosch, J.; Bastidas, D.M. Evaluation of the DOS by DL−EPR of UNSM processed Inconel 718. Metals 2020, 10, 204. [Google Scholar] [CrossRef] [Green Version]
  19. Zhao, W.; Liu, D.; Qin, H.; Zhang, X.; Zhang, H.; Zhang, R.; Ren, Z.; Ma, C.; Amanov, A.; Pyun, Y.-S.; et al. The effect of ultrasonic nanocrystal surface modification on low temperature nitriding of ultra-high strength steel. Surf. Coat. Technol. 2019, 375, 205–214. [Google Scholar] [CrossRef]
  20. Kim, K.-T.; Lee, J.-H.; Kim, Y.-S. Effect of ultrasonic nano-crystal surface modification (UNSM) on the passivation behavior of aged 316L stainless steel. Materials 2017, 10, 713. [Google Scholar] [CrossRef] [PubMed]
  21. Li, X.; Shi, J.J.; Cao, G.H.; Russell, A.M.; Zhou, Z.J.; Li, C.P.; Chen, G.F. Improved plasticity of Inconel 718 superalloy fabricated by selective laser melting through a novel heat treatment process. Mater. Des. 2019, 180, 107915. [Google Scholar] [CrossRef]
  22. Chandrasekar, R.; Lo, C.C.H.; Frishman, A.M.; Larson, B.F.; Nakagawa, N. Quantification of precipitates and their effects on the response of nickel-base superalloy to shot peening. AIP Conf. Proc. 2012, 1430, 1437–1444. [Google Scholar]
  23. ASTM G3-14. Standard Practice for Conventions Applicable to Electrochemical Measurements in Corrosion Testing; ASTM International: West Conshohocken, PA, USA, 2019. [Google Scholar] [CrossRef]
  24. ASTM E112-13. Standard Test Methods for Determining Average Grain Size; ASTM International: West Conshohocken, PA, USA, 2013. [Google Scholar] [CrossRef]
  25. Kattoura, M.; Telang, A.; Mannava, S.R.; Qian, D.; Vasudevan, V.K. Effect of Ultrasonic Nanocrystal Surface Modification on residual stress, microstructure and fatigue behavior of ATI 718Plus alloy. Mater. Sci. Eng. A 2018, 711, 364–377. [Google Scholar] [CrossRef]
  26. Babu, U.R.; Kondraivendhan, B. Effect of IR drop on reinforced concrete corrosion measurements. IOP Conf. Ser. Mater. Sci. Eng. 2020, 829, 012015. [Google Scholar] [CrossRef]
  27. Cui, Z.; Wang, L.; Ni, H.; Hao, W.; Man, C.; Chen, S.; Wang, X.; Liu, Z.; Li, X. Influence of temperature on the electrochemical and passivation behavior of 2507 super duplex stainless steel in simulated desulfurized flue gas condensates. Corros. Sci. 2017, 118, 31–48. [Google Scholar] [CrossRef]
  28. Bastidas, D.M.; Fernández-Jiménez, A.; Palomo, A.; González, J.A. A study on the passive state stability of steel embedded in activated fly ash mortars. Corros. Sci. 2008, 50, 1058–1065. [Google Scholar] [CrossRef]
  29. Bautista, A.; Paredes, E.C.; Velasco, F.; Alvarez, S.M. Corrugated stainless steels embedded in mortar for 9 years: Corrosion results of non-carbonated, chloride-contaminated samples. Constr. Build. Mater. 2015, 93, 350–359. [Google Scholar] [CrossRef] [Green Version]
  30. Ohta, K.; Ishida, H. Comparison among several numerical integration methods for Kramers-Kronig transformation. Appl. Spectrosc. 1988, 42, 952–957. [Google Scholar] [CrossRef]
  31. Ress, J.; Martin, U.; Bosch, J.; Bastidas, D.M. pH-Triggered release of NaNO2 corrosion inhibitors from novel colophony microcapsules in simulated concrete pore solution. ACS Appl. Mater. Interfaces 2020, 12, 46686–46700. [Google Scholar] [CrossRef]
  32. Nabavi, B.; Goodarzi, M.; Khan, A.K. Metallurgical effects of nitrogen on the microstructure and hot corrosion behavior of alloy 718 weldment. Mater. Charact. 2019, 157, 109916. [Google Scholar] [CrossRef]
  33. Alizadeh, M.; Bordbar, S. The influence of microstructure on the protective properties of the corrosion product layer generated on the welded API X70 steel in chloride solution. Corros. Sci. 2013, 70, 170–179. [Google Scholar] [CrossRef]
  34. Pierce, D.T.T.; Jiménez, J.A.A.; Bentley, J.; Raabe, D.; Wittig, J.E.E. The influence of stacking fault energy on the microstructural and strain-hardening evolution of Fe–Mn–Al–Si steels during tensile deformation. Acta Mater. 2015, 100, 178–190. [Google Scholar] [CrossRef]
  35. Meric de Bellefon, G.; van Duysen, J.C.; Sridharan, K. Composition-dependence of stacking fault energy in austenitic stainless steels through linear regression with random intercepts. J. Nucl. Mater. 2017, 492, 227–230. [Google Scholar] [CrossRef]
  36. Weng, S.; Huang, Y.H.; Xuan, F.Z.; Luo, L.H. Correlation between microstructure, hardness and corrosion of welded joints of disc rotors. Procedia Eng. 2015, 130, 1761–1769. [Google Scholar] [CrossRef] [Green Version]
  37. Zhang, B.; Xiu, M.; Tan, Y.T.; Wei, J.; Wang, P. Pitting corrosion of SLM Inconel 718 sample under surface and heat treatments. Appl. Surf. Sci. 2019, 490, 556–567. [Google Scholar] [CrossRef]
  38. Huang, G.; Liu, G.Q.; Feng, M.; Zhang, M.; Hu, B.; Wang, H. The effect of cooling rates from temperatures above the γ′ solvus on the microstructure of a new nickel-based powder metallurgy superalloy. J. Alloys Compd. 2018, 747, 1062–1072. [Google Scholar] [CrossRef]
  39. Hirschorn, B.; Orazem, M.E.; Tribollet, B.; Vivier, V.; Frateur, I.; Musiani, M. Determination of effective capacitance and film thickness from constant-phase-element parameters. Electrochim. Acta 2010, 55, 6218–6227. [Google Scholar] [CrossRef]
  40. Bastidas, D.M. Interpretation of impedance data for porous electrodes and diffusion processes. Corrosion 2007, 63, 515–521. [Google Scholar] [CrossRef]
  41. Huang, V.M.W.; Vivier, V.; Orazem, M.E.; Pébère, N.; Tribollet, B. The apparent constant-phase-element behavior of a disk electrode with faradaic reactions a global and local impedance analysis. J. Electrochem. Soc. 2007, 154, C99–C107. [Google Scholar] [CrossRef] [Green Version]
  42. Hakiki, N.B.; Boudin, S.; Rondot, B.; Da Cunha Belo, M. The electronic structure of passive films formed on stainless steels. Corros. Sci. 1995, 37, 1809–1822. [Google Scholar] [CrossRef]
  43. Fajardo, S.; Bastidas, D.M.; Criado, M.; Bastidas, J.M. Electrochemical study on the corrosion behaviour of a new low-nickel stainless steel in carbonated alkaline solution in the presence of chlorides. Electrochim. Acta 2014, 129, 160–170. [Google Scholar] [CrossRef] [Green Version]
Figure 1. Time–temperature–transformation (TTT) diagram of Inconel 718 [21].
Metals 11 01488 g001
Figure 2. Optical microscopy images showing the cross-section microstructure of Inconel 718: (a) bulk of the AR ×10, and (b) UNSM sample showing the three regions ×50.
Metals 11 01488 g002
Figure 3. Vickers hardness as a function of the depth for UNSM and TMT samples.
Metals 11 01488 g003
Figure 4. Ecorr and icorr monitoring for the different treatments of Inconel 718 in 3.5 wt.% NaCl.
Metals 11 01488 g004
Figure 5. EIS analysis of Inconel 718 in 3.5 wt.% NaCl: (a) Nyquist plots for the different treatments, with an inset at higher magnification for the lower frequency data values, and (b) EEC with two time constants.
Metals 11 01488 g005
Figure 6. SEM images showing the cross-section microstructure of Inconel 718 × 600: (a) AR sample, (b) TT1 sample, (c) TT2 sample, (d) TT3 sample, (e) UNSM sample, and (f) TMT sample.
Metals 11 01488 g006
Figure 7. SEM micrograph for the EDX analysis of TT3 sample with the selected areas for the elemental analysis ×10,000.
Metals 11 01488 g007
Figure 8. EDX analysis of TT3 sample: (a) elemental composition of the NbC, (b) elemental composition of the δ-phase, and (c) elemental composition of the γ-phase.
Metals 11 01488 g008
Figure 9. Rct comparison between LPR and EIS techniques of Inconel 718 samples in 3.5 wt.% NaCl.
Metals 11 01488 g009
Figure 10. Ceff,dl and thickness of the passive film (d) of Inconel 718 samples in 3.5 wt.% NaCl.
Metals 11 01488 g010
Figure 11. IFM images of the top surface of Inconel 718 after the exposure to the 3.5 wt.% NaCl ×100: (a) AR sample, (b) TT1 sample, (c) TT2 sample, (d) TT3 sample, (e) UNSM sample, and (f) TMT sample.
Metals 11 01488 g011
Table 1. Elemental composition of Inconel 718 (wt.%).
ElementAlCCrFeMoNbNiTi
Content (wt.%)0.460.0317.9218.803.055.0553.710.97
Table 2. Sample abbreviations for each of the thermal treatment (TT) and thermomechanical treatment (TMT).
SampleTreatment
ARAs-received
TT1Annealed at 675 °C for 2 h + water quenched
TT2Annealed at 900 °C for 2 h + water quenched
TT3(Annealed at 1000 °C 10 min + water quenched) × 3
UNSMUNSM treated × 3
TMT(UNSM treated + annealed at 1000 °C for 10 min + water quenched) × 3
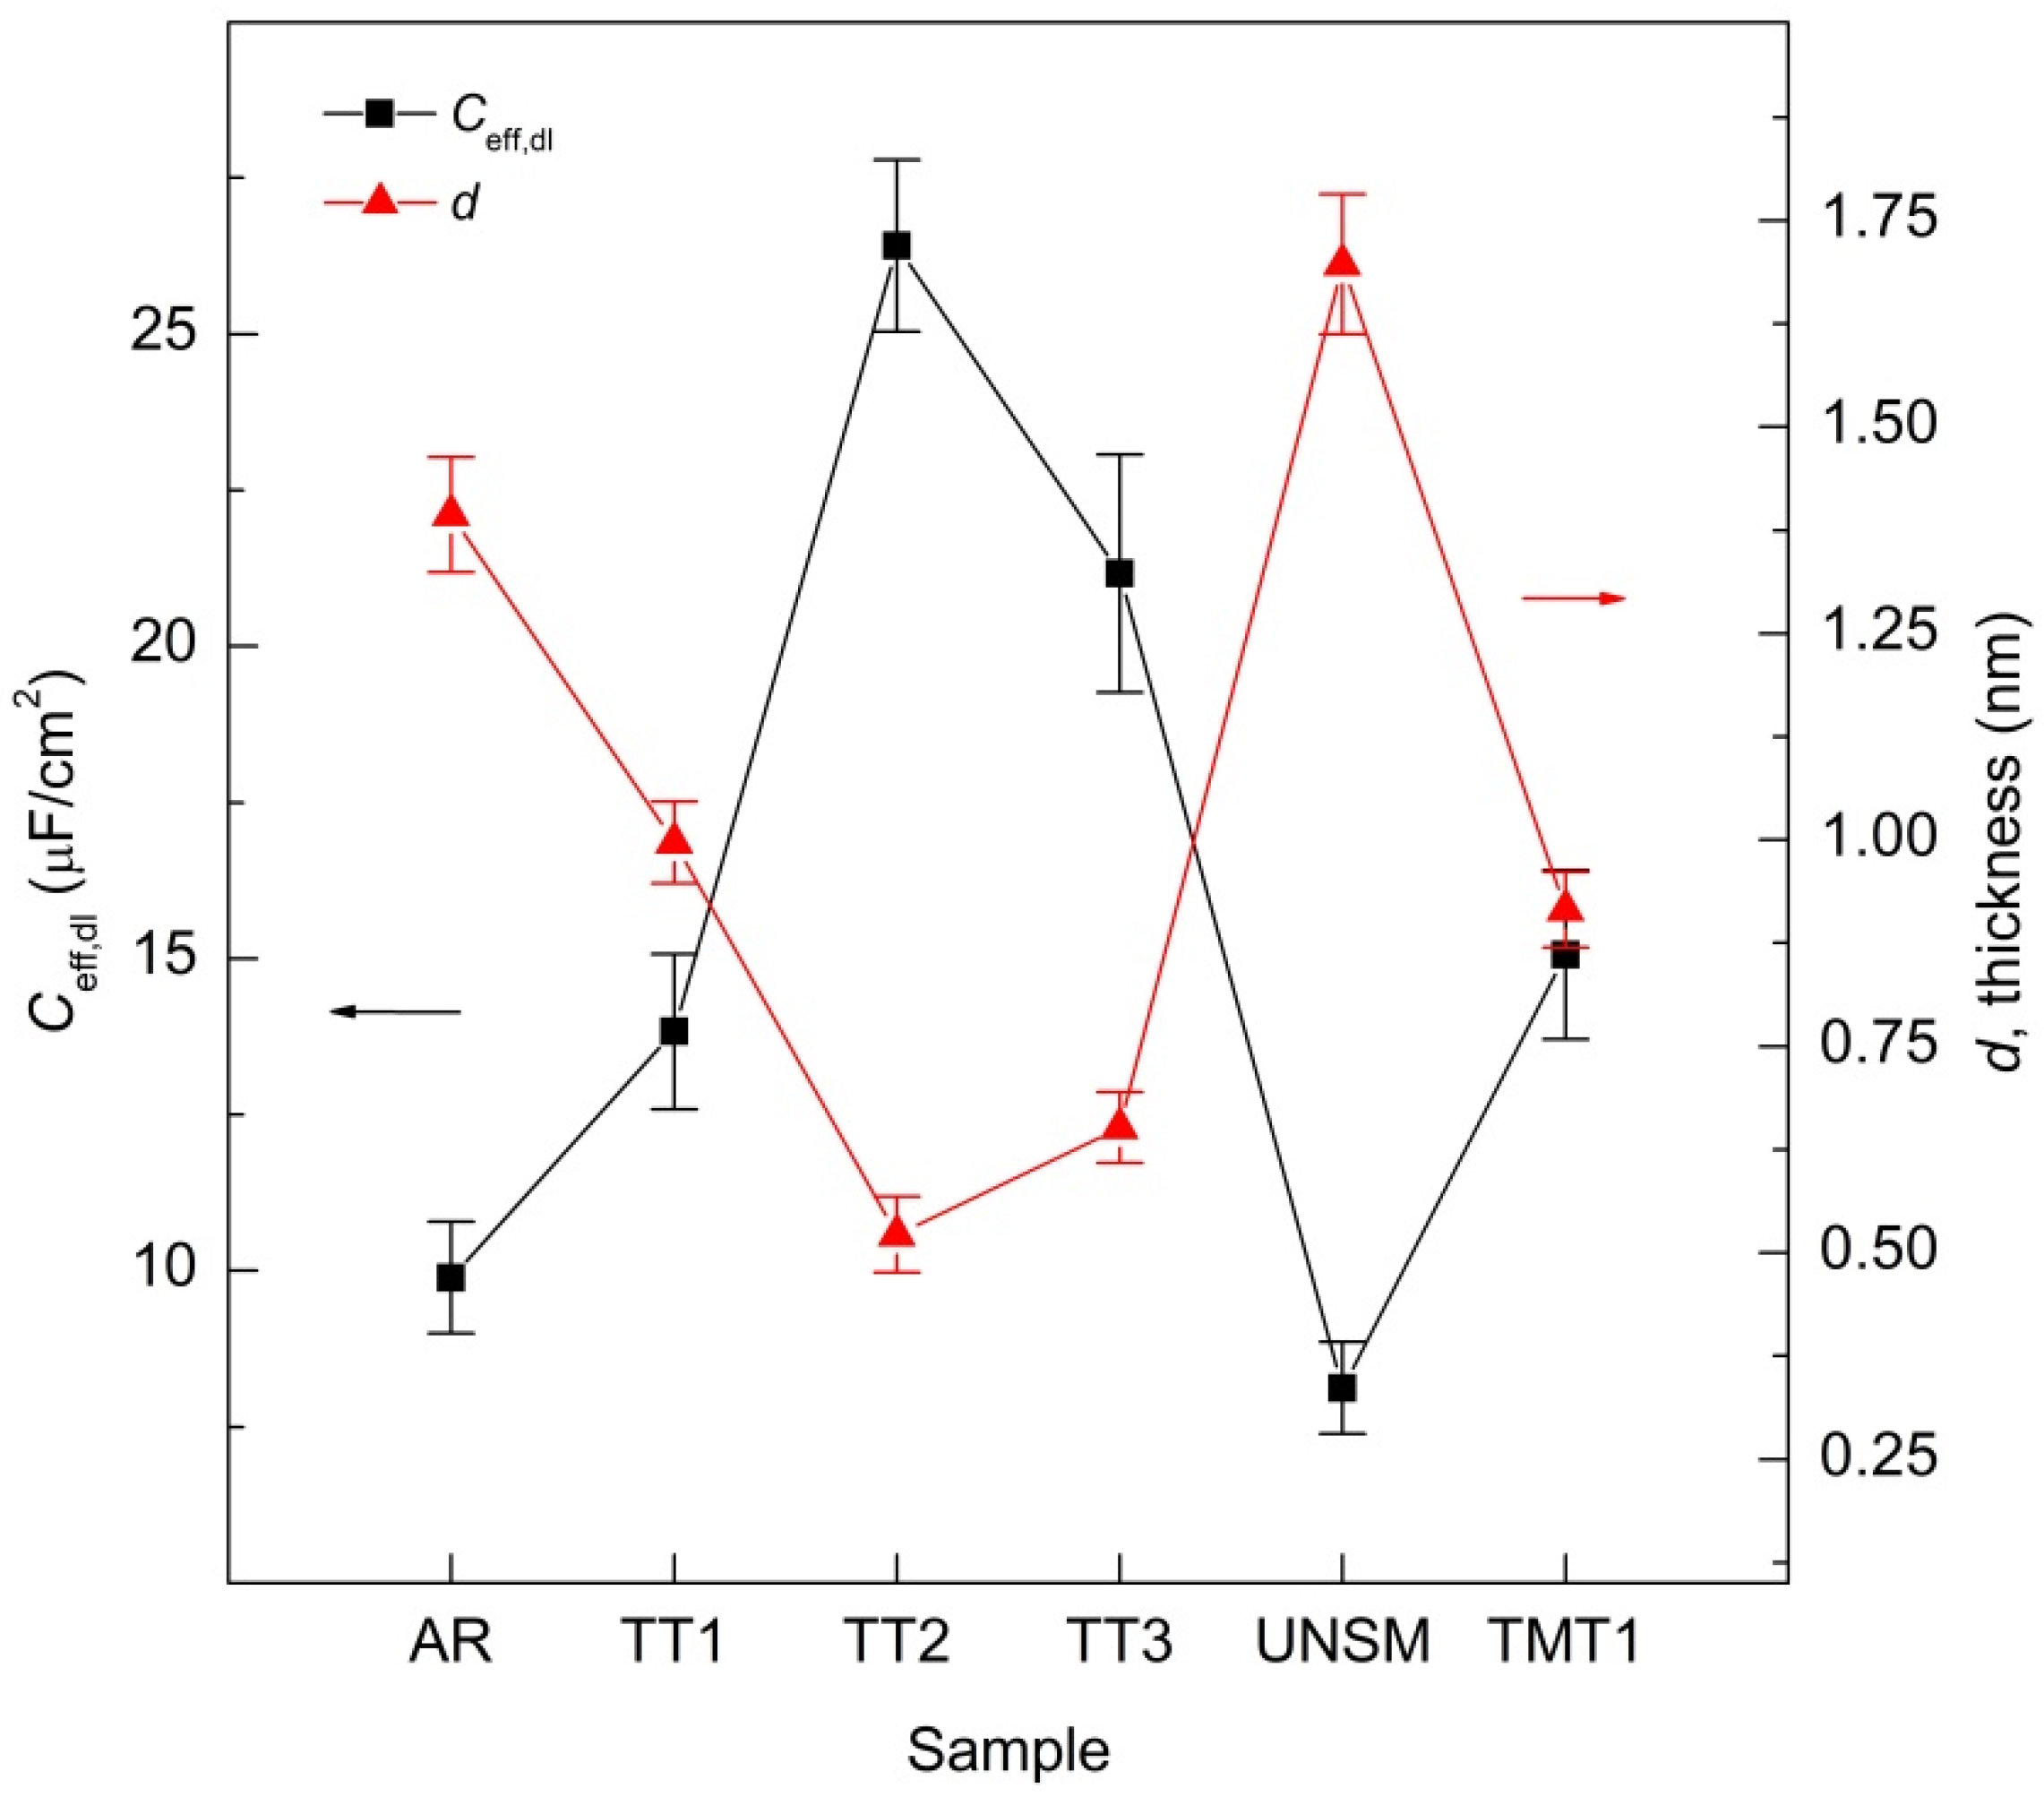
Table 3. Fitting EIS parameters for Inconel 718 with the different thermal, mechanical, and thermomechanical treatments.
SampleRsRfilmYfilmnfilmRctYdlndlCeff,dlχ2 (*)
Ω cm2Ω cm2S/cm2 s film Ω cm2S/cm2 sndl µF/cm2
AR3.787.46 × 1052.47 × 10−50.788.12 × 1051.66 × 10−50.959.891.40 × 10−3
TT14.061.13 × 1059.94 × 10−60.782.02 × 1052.97 × 10−50.9213.814.93 × 10−3
TT23.881.53 × 1031.94 × 10−50.742.15 × 1045.85 × 10−50.9126.442.96 × 10−3
TT34.934.38 × 1023.66 × 10−50.785.81 × 1031.98 × 10−40.8521.231.32 × 10−3
UNSM3.944.52 × 1051.85 × 10−60.791.61 × 1061.24 × 10−50.968.131.61 × 10−3
TMT3.481.27 × 1031.24 × 10−40.787.13 × 1038.10 × 10−50.8315.121.14 × 10−3
* Error < 10% for all values.
Publisher’s Note: MDPI stays neutral with regard to jurisdictional claims in published maps and institutional affiliations.

