Next Article in Journal
Microstructure and Mechanical Properties of the ((CoCrFeNi)95Nb5)100−xMox High-Entropy Alloy Coating Fabricated under Different Laser Power
Next Article in Special Issue
Influence of Bio-Coal Properties on Carbonization and Bio-Coke Reactivity
Previous Article in Journal
Thermoelectric Power in Ce Systems with Unstable Valence
Previous Article in Special Issue
Dephosphorization in Double Slag Converter Steelmaking Process at Different Temperatures by Industrial Experiments
 
 
Correction published on 10 January 2022, see Metals 2022, 12(1), 130.
Article

A Comparison of Laboratory Coal Testing with the Blast Furnace Process and Coal Injection

1
Cardiff School of Engineering, Cardiff University, Queen’s Buildings, The Parade, Cardiff CF24 3AA, UK
2
Tata Steel UK, Port Talbot SA13 2NG, UK
*
Author to whom correspondence should be addressed.
Metals 2021, 11(9), 1476; https://doi.org/10.3390/met11091476
Submission received: 19 July 2021 / Revised: 13 September 2021 / Accepted: 15 September 2021 / Published: 17 September 2021 / Corrected: 10 January 2022
(This article belongs to the Special Issue Advances in Ironmaking and Steelmaking Processes)

Abstract

:
The injection of coal through tuyeres into a blast furnace is widely adopted throughout the industry to reduce the amount of coke used and to improve the efficiency of the iron making process. Coals are selected depending on their availability, cost, and the physical and chemical properties determined by tests, such as the volatile matter content, fixed carbon, and ash content. This paper describes research comparing the laboratory measured properties of injection coals that were used over a two-month production period compared to the process variables and measurements of the blast furnace during that study period. In addition to the standard tests, a drop tube furnace (DTF) was used to compare the burnout of coals and the char properties against the production data using a range of statistical techniques. Linear regression modelling indicated that the coal type was the most important predictor of the coal rate but that the properties measured using laboratory tests of those coals were a minor feature in the model. However, comparisons of the Spearman’s correlations between different variables indicated that the reverse Boudouard reactivity of the chars, prepared in the DTF from the coals, did appear to be related to some extent to the coal and coke rates on production. It appears that the constant process adjustments made by the process control systems on the furnace make it difficult to identify strong correlations with the laboratory data and that the frequency of coal sampling and the coal blend variability are likely to contribute to this difficulty.

1. Introduction

Coal injection into a blast furnace is a very well-established technique used as a means to improve the efficiency of the iron-making process and to reduce the amount of coke charged to the furnace, which in turn reduces particulate and environmental emissions [1,2,3]. Coal is milled to either a pulverised or granulated particle size and carried pneumatically through a lance into the tuyeres [4]. These water-cooled nozzles direct the hot blast of air into the furnace, forming a balloon-like void known as the raceway, dependent on the blast pressure, material consumption, and injectants [5]. Although coke is necessary to support the raw material burden and provide a porous network for gas to ascend the furnace, the furnace operators try to maximise the injection of coal [6].
Many furnaces achieve coal injection rates of 200 kg/tHM (kg/tonne of hot metal) [7]; however, the scale and nature of this process can result in variations in characteristics such as temperature and pressure [8]. The impact of this can be localised hot/cold spots, which can cause damage to the furnace lining or result in variations in the rate of raw material consumption. Alternatively, it can result in erratic burden descent, causing sudden changes resulting in “hanging or slipping” of the burden [9]. Variations in these properties describe the blast furnace stability and are very important for consistent, predictable, and efficient iron production that does not cause furnace damage and prolongs its lifespan.
How much coke can be replaced by coal depends on the role it has as a structural support for the raw material burden and depending on the coke replacement ratio [7,10]. The latter is calculated using an equation based on the carbon, hydrogen, ash, and moisture content necessary to achieve a replacement of coke with an equivalent carbon content of 87.5% [4]. In addition, the volatile matter content, which is a measure of the coal thermal pyrolysis products, is known to have an important effect on the blast furnace stability by influencing the gas/char combustion and consumption of oxygen in the raceway region [11,12]. The choice of coals injected in the furnace depend on their availability, cost, and properties and are often used as blends, variations of which can impact the stability [13].
The proximate analyses (volatile matter content, ash, moisture, and fixed carbon) are used as important information for selecting coal [14,15]; however, it is not the only way to assess the suitability of injectant coals [11]. The raceway region of the furnace is likely to show much variation in dimensions and is characterised by short residence times [16] and rapidly diminishing availability of oxygen for combustion [12]. For this reason, partially burnt coal chars ascend the shaft, and their properties and reactivity play a role in the suitability of injectants. To assess this, coal samples have also been run through a drop tube furnace to measure the coal burnout and to prepare and collect partially burnt chars for further reactivity characterisation.
This paper compares the properties of coal injectant samples measured in the laboratory with blast furnace process information from runs over a study period of production at TATA Steel Port Talbot. The aim of this work was to compare any correlations between laboratory testing and production variables, using the SPSS® statistical package, by examining and modelling the information to determine relationships that could be applied in the future to help maximise coal injection rates.

2. Materials and Methods

Two separate study periods were chosen for the coal sampling and testing. The first period consisted of 24 days sampling/measurement, and the second consisted of 33 days sampling/measurement. Samples were taken directly from the production coal injection line twice daily and were tested in the laboratory for comparison with the process information (PI) of the blast furnace during the corresponding time period.
The laboratory tests for a specific coal or coal blend would correspond to the composite sample taken during a specific 12 h production period for comparison with the production variability over that period.
This study used data and analyses from three sources to understand the laboratory testing of injection coals as a potential predictor for blast furnace performance. A statistical package was used to analyse the data and investigate the relationships between these:
  • Proximate and thermo gravimetric analysis (TGA) measured the ash content, volatile matter content, fixed carbon, and reverse Boudouard gasification.
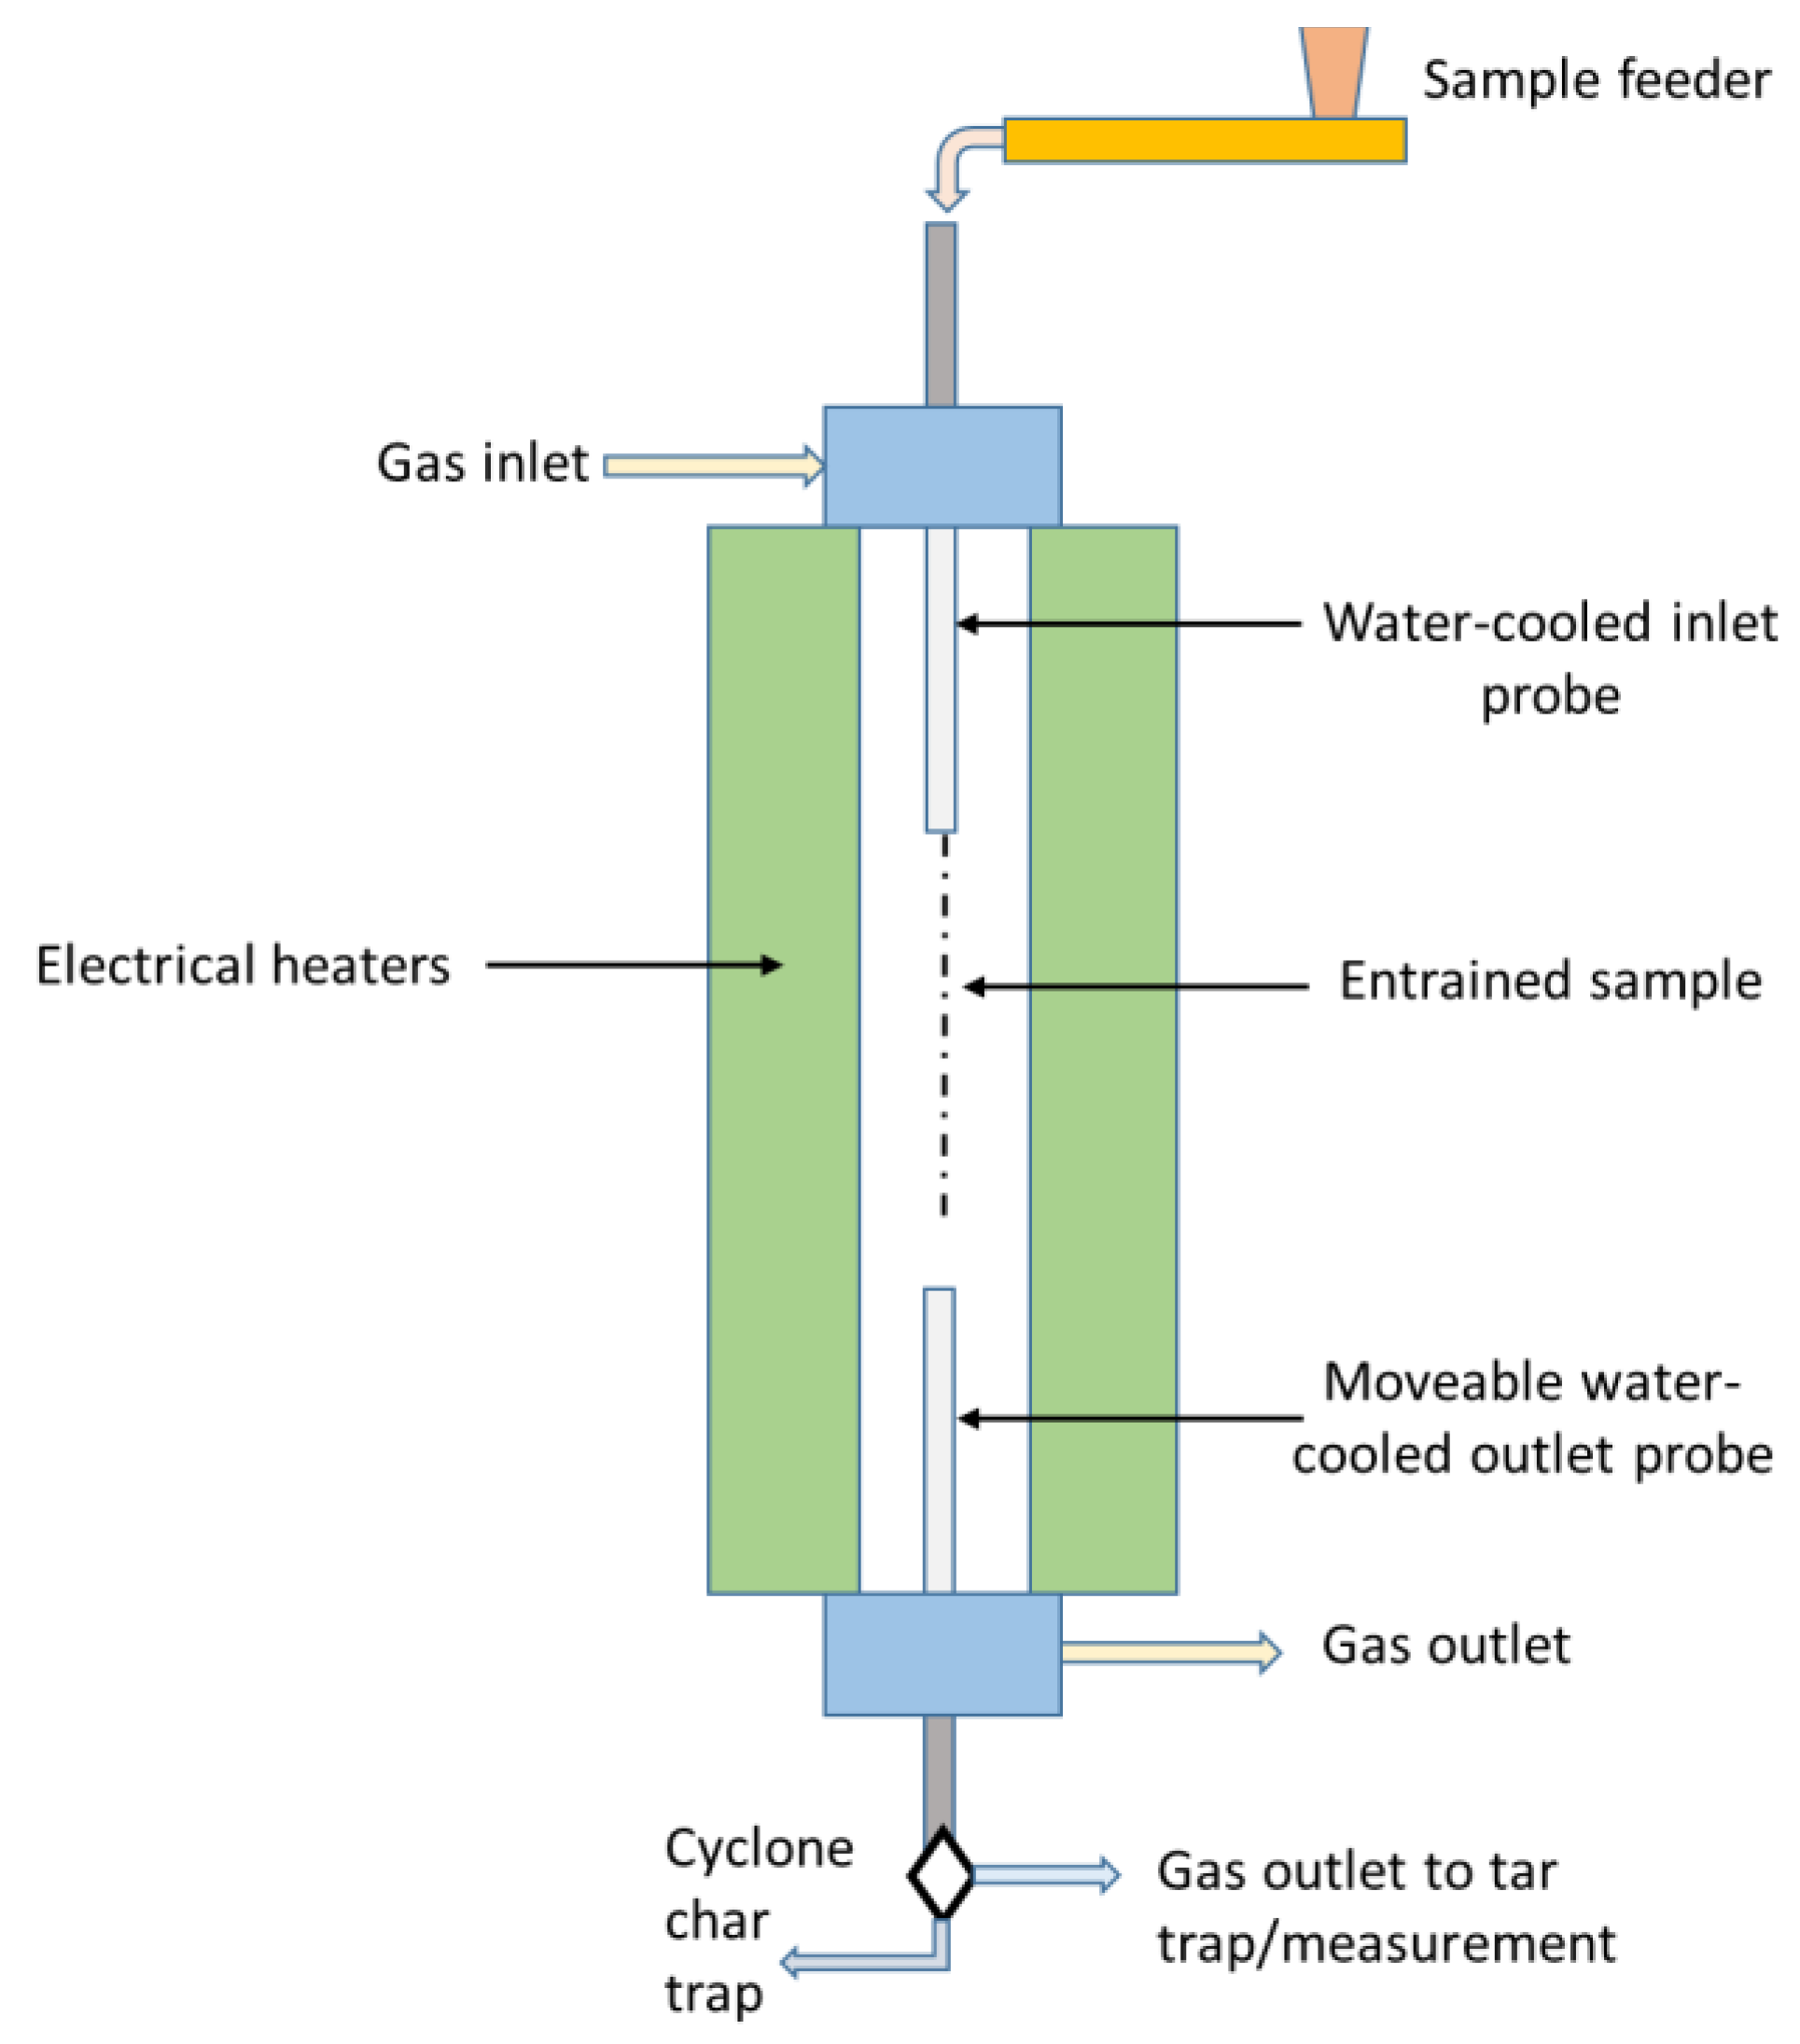
  • A Drop tube furnace (DTF) (manufactured by Severn Thermal Solutions, Dursley, Gloucester, UK) was used to measure the combustion burnout of production samples of coals or coal blends in the DTF and to produce partially burnt chars for TGA analysis.Blast furnace process information (PI data) was used to compare data from the blast furnace on inputs, such as coal addition rates and blast volume, and on process measurements, such as blast pressures and production rates, etc.

2.1. Proximate Analysis and Thermo Gravimetric Analysis

For the study period, production granulated coal samples were taken daily from a sample port on the coal injection line during the day and night shift. The samples were dried at 105 °C using BS11722:2013 until a constant weight and the volatile matter content was measured using standard BS15148:2005. Ash contents were carried out using the standard method BS 1171:2010.
Figure 1 shows the range of measured volatile matter contents (11–24%) for the coal samples collected over the duration of the trials, which covers low to medium volatile matter injection coals/blends. Coal D shows a particularly wide variation between 13–24%. This suggests the possibility of sample contamination, delivery contamination on the stockyard, or a particularly wide inconsistent delivery of the coal. In this case, comparisons for this coal are considered less reliable.
The ash contents shown in Figure 2 range from 6.8–10.9%, with the coal blend B measuring the greatest variation of 7.5–11%.
The variation of the fixed carbon content, shown in Figure 3, was much less than the other proximate analyses except for the coal D, which was expected since the volatile matter range was so wide.
Partially burnt chars that exit the raceway of the blast furnace will ascend the furnace where thermal decomposition can continue and where gasification can occur due to the reverse Boudouard reaction when carbon dioxide (CO2) reacts with carbon, gasifying it to carbon monoxide (CO). A Mettler–Toledo TGA/DSC 3+ was used to monitor the weight loss by first heating to 900 °C in nitrogen and holding for 7 min to devolatilise the sample then switching to a CO2 flow rate of 100 mL/min until complete conversion was obtained. Gasification reactivity is defined as t0.5, the time taken in minutes to achieve 50% conversion of the sample. The conversion is calculated using the following equation, where w i n t i a l is the initial mass, w t is the measured mass at any given time, and w f i n a l is the final mass. Comparison of the conversion in this way allows the “like for like” comparison of chars with different ash contents.
C o n v e r s i o n   ( % ) = 100   ×   w i n t i a l w t   w i n i t i a l w f i n a l
Thus, more reactive chars have shorter t0.5 gasification times compared to less reactive chars, which have longer t0.5 gasification times.

2.2. Drop Tube Furnace

The drop tube furnace (DTF) shown in Figure 4 is a vertical tube furnace used to characterise the devolatilisation and burnout of coal samples at 1100 °C in air at a residence time of 100 ms and to prepare chars for analysis using the TGA. The high heating rate and short residence times of the DTF has characteristics similar to those when coal is injected into the blast air of the blast furnace raceway [17,18]. Samples were fed into the top at feed rates of 30 g/h, entrained in a laminar air flow at 20 L/min, and collected at the bottom by means of a cyclone collector. The ash tracer method was used to calculate the burnout of the coals [19].

2.3. Blast Furnace Process Information

Process information (PI) data were obtained directly from the blast furnace process control system; this included real-time measurements taken directly from the furnace and control variables (Table 1). Because of the practicalities of organizing a large-scale trial, it was not possible to run under absolute steady state parameters or to choose predefined production conditions, so variation occurred during what was a normal processing period. Additionally, for the purposes of this work, only coal addition rates above 100 kg/tHM (kg/tonne of hot metal) were used, as levels below this were associated with reduced production regimes and problematic blockages.

2.4. Statistical Analysis

The IBM software package SPSS® version 26 was used to interrogate the results using three statistical approaches. Firstly, Spearman’s correlations to compare the relationship of laboratory test results with blast furnace variables and measurements; secondly, with box plots to examine the variation of results for the different coals and coal blends used during the production period; and thirdly, using multiple regression to form a model that describes the relationship between variables.
The SPSS™ multiple regression model is an example of a linear model used to predict a target based on linear relationships between the target and one or more predictors based on continuous variables.

3. Results and Discussion

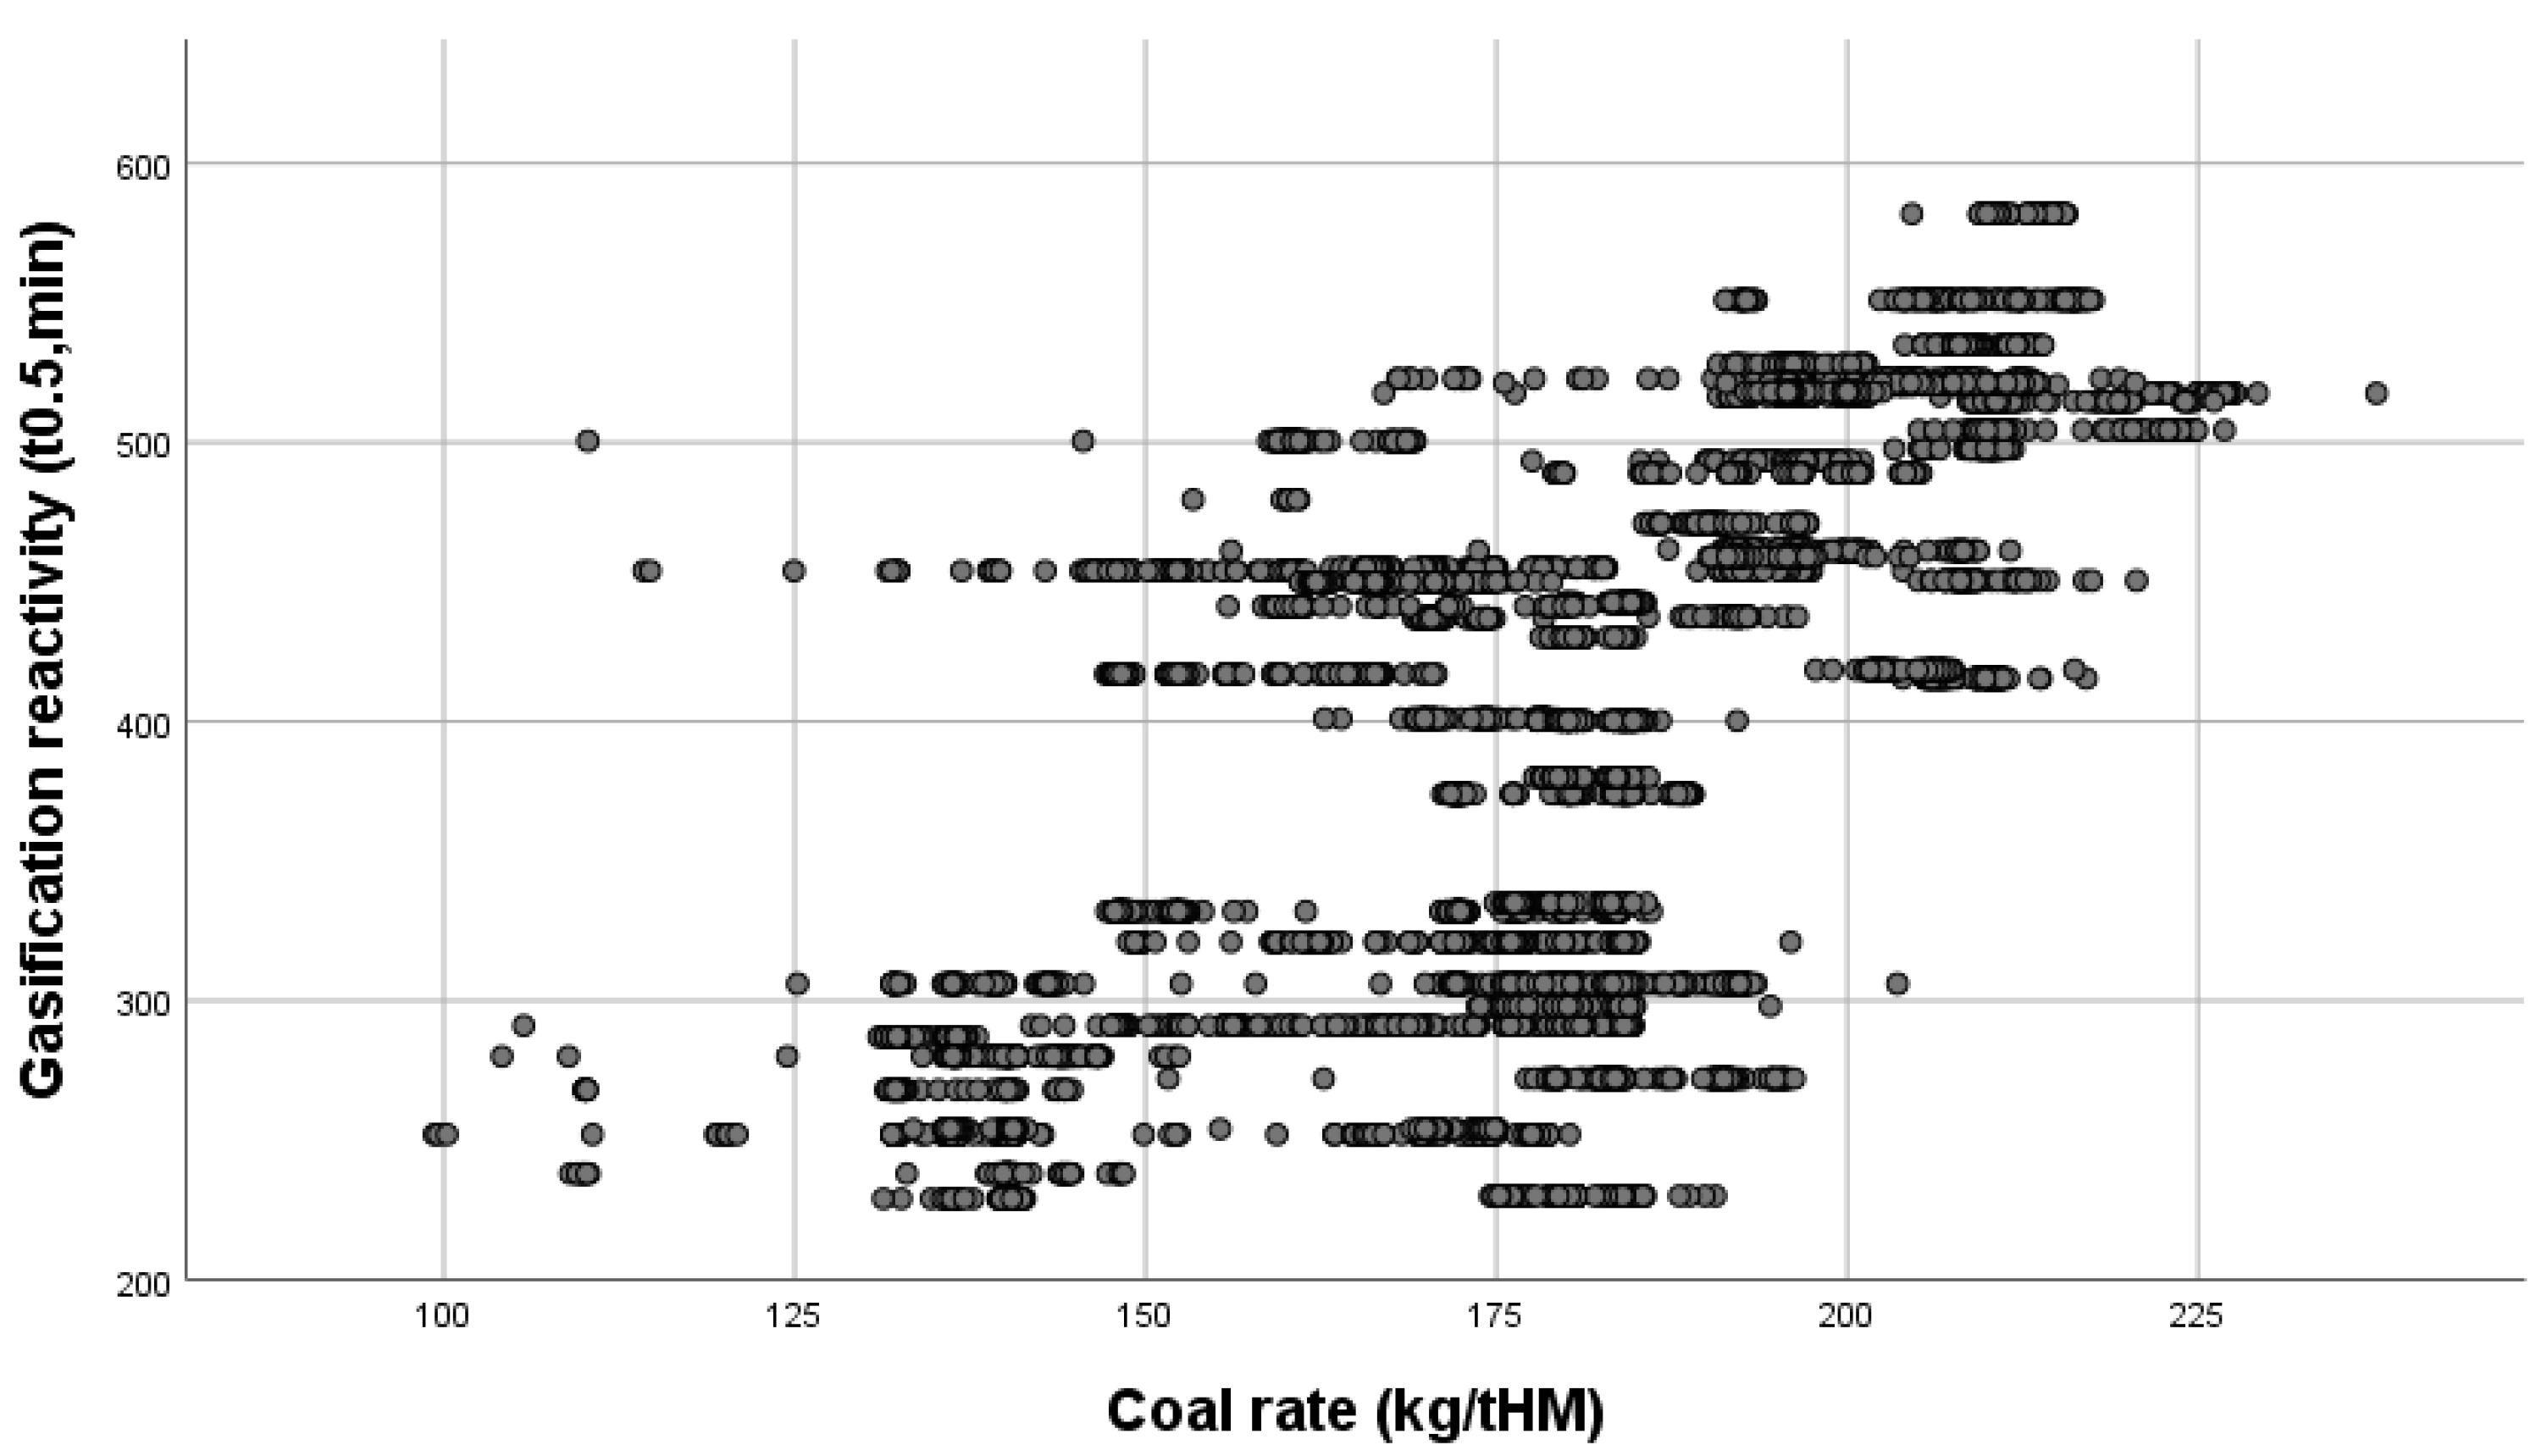
3.1. Spearman’s Correlation

Correlation coefficients are a useful statistical technique to visualise and quantify linear relationships between two variables. In this case, the laboratory measurements were related to changes in the blast furnace process variables.
Pearson’s coefficients are used to measure how closely the relationship between the variables follows a straight line when plotted. However, in some cases, variables do show a relationship, but it is not a linear one, and this is where Spearman’s correlation coefficients are useful. These are calculated on ranks instead of data values which allows the comparisons of relationships that are non-linear.
The data shown in Table 2 is divided into moderate and high correlations. The highest correlations are associated between the blast furnace process variables. As expected, the production rate of iron from the furnace shows a high correlation with process variables, such as the blast volume, the total reductant rate, and the oxygen flow rate (see Figure 5 scatter plot with a Spearman’s correlation of 0.819), as these are variables that are essential for the process to function. In this case, it is not possible to achieve high production rates without higher blast volumes, which also then correspond with increased pressures. This reinforces the importance of these variables to control the process, often preprogramed in automatically controlled systems, as a response to production parameters and illustrating how fluctuations in coal properties are masked behind these process variables.
Some of the moderate correlations also correspond to the blast furnace process information (PI) variables, such as oxygen enrichment with oxygen flow rate (oxyflow), and the oxyflow with blast pressure, top pressure, total volume, and nitrogen. However, in this case, high oxyflow is often accompanied with oxygen enrichment to facilitate higher production rates but is not always available to the blast furnace operator. Likewise, higher oxyflow means higher gas flow and corresponds to increases in the pressure; however, other non-measured variables, such as fine particulates in the burden, can also contribute to increased measured blast furnace pressure. In terms of the relationship between the laboratory analysis of the coal and chars with the blast furnace variables, moderate correlations were recorded for the char gasification reactivity with the coal rate (0.600 **) and coke rate (−0.685 **).
The raceway, formed by the hot blast directed into the furnace, is typically between 0.5–1.5 m in length, and the blast velocity is typically in the region of 180 m/s, so the residence time of coals injected into this region is short [16]. This means that the injected coal does not have long to burnout, and it is expected that partially burnt char particulates exit the raceway and ascend the furnace, where the reverse Boudouard reaction can take place between carbon dioxide and carbon to produce carbon monoxide. As a proxy for this, the reactivity of the partially burnt char residue from the incomplete coal combustion in the drop tube furnace was measured using a TGA. Increases in the measured char reactivity time (t0.5) indicate slower char reaction with CO2 and a less reactive char, whereas decreases in the char reactivity time indicate a more reactive char.
The moderate correlation of the char reactivity (formed in the laboratory DTF) with the coal rate (measured during blast furnace production) suggests a relationship between lower reactivity chars and higher blast furnace coal injection rates. Correspondingly, for the coke rate, the opposite was observed, where less reactive chars correlate with lower coke rates in the furnace.
It is understood that the reverse Boudouard reaction is endothermic, so more reactive chars could result in a larger cooling effect on the thermal reserve temperature of the blast furnace. This could be particularly problematic if the char retention by the burden is localised in certain regions due to retention by the raw material burden, leading to reduced blast furnace stability (temperature, pressure, and burden descent) and reduced coal rates.
Closer analysis of the scatter plot diagrams is necessary to interrogate the data more closely and verify that the data are not skewed or exhibiting bias. In the case of Figure 6, the data on the scatter plot are consistent with the −0.685 ** correlation of lower coke rates associated with lower char reactivates (indicated as longer gasification times).
The overall reductant charge to the blast furnace consists of both coke and coal and a closer look at the data in Figure 7 indicates that lower coke rates are associated with higher coal rates (high correlation 0.842 **), which is to be expected, as increased coal injection is used as a means to substitute the more expensive coke with its associated environmental emissions.
However, it should be noted that the scatter plot shows a stratification of the results into layers; this is due to wider variability in coal addition rates (injected into the bottom of the furnace) compared to the coke addition rates (added to the top of the furnace), which are added at a much more consistent rate. Coke is produced by a batch process, whereas coal is milled and injected as a continuous process, so additions are often subject to issues, such as blockages or variations in the milling process.
The scatter plot for the char gasification against coal rate shown in Figure 8 is also consistent with the Spearman’s correlation of 0.600.
Figure 8 also shows some data stratified in layers. This is a reflection of the spread of values for the rate at which coal is injected (see Figure 9) during iron production, whereas the laboratory test results represent the average value of the coal sample collected on either the day or night shift (a composite of 12 h production).
Comparing the gasification to the DTF burnout in Figure 10 and the coal volatile matter content in Figure 11 explains some of this relationship that higher char reactivities (lower gasification t0.5 times) show a correlation with higher coal burnout (0.643) and higher volatile matter content (0.668); in both cases, these types of coals would combust to a greater extent, requiring more oxygen to maintain the injection rates of the respective injection coals.
The large number of dependent and independent variables associated with iron making makes it challenging to draw reliable strong correlations, as the manual and automatic process control systems make adjustments to the process to compensate for changes associated with the different properties of the raw materials. It is also likely that there is considerable variation dependent on the coal milling process, sample properties, and coal blending.

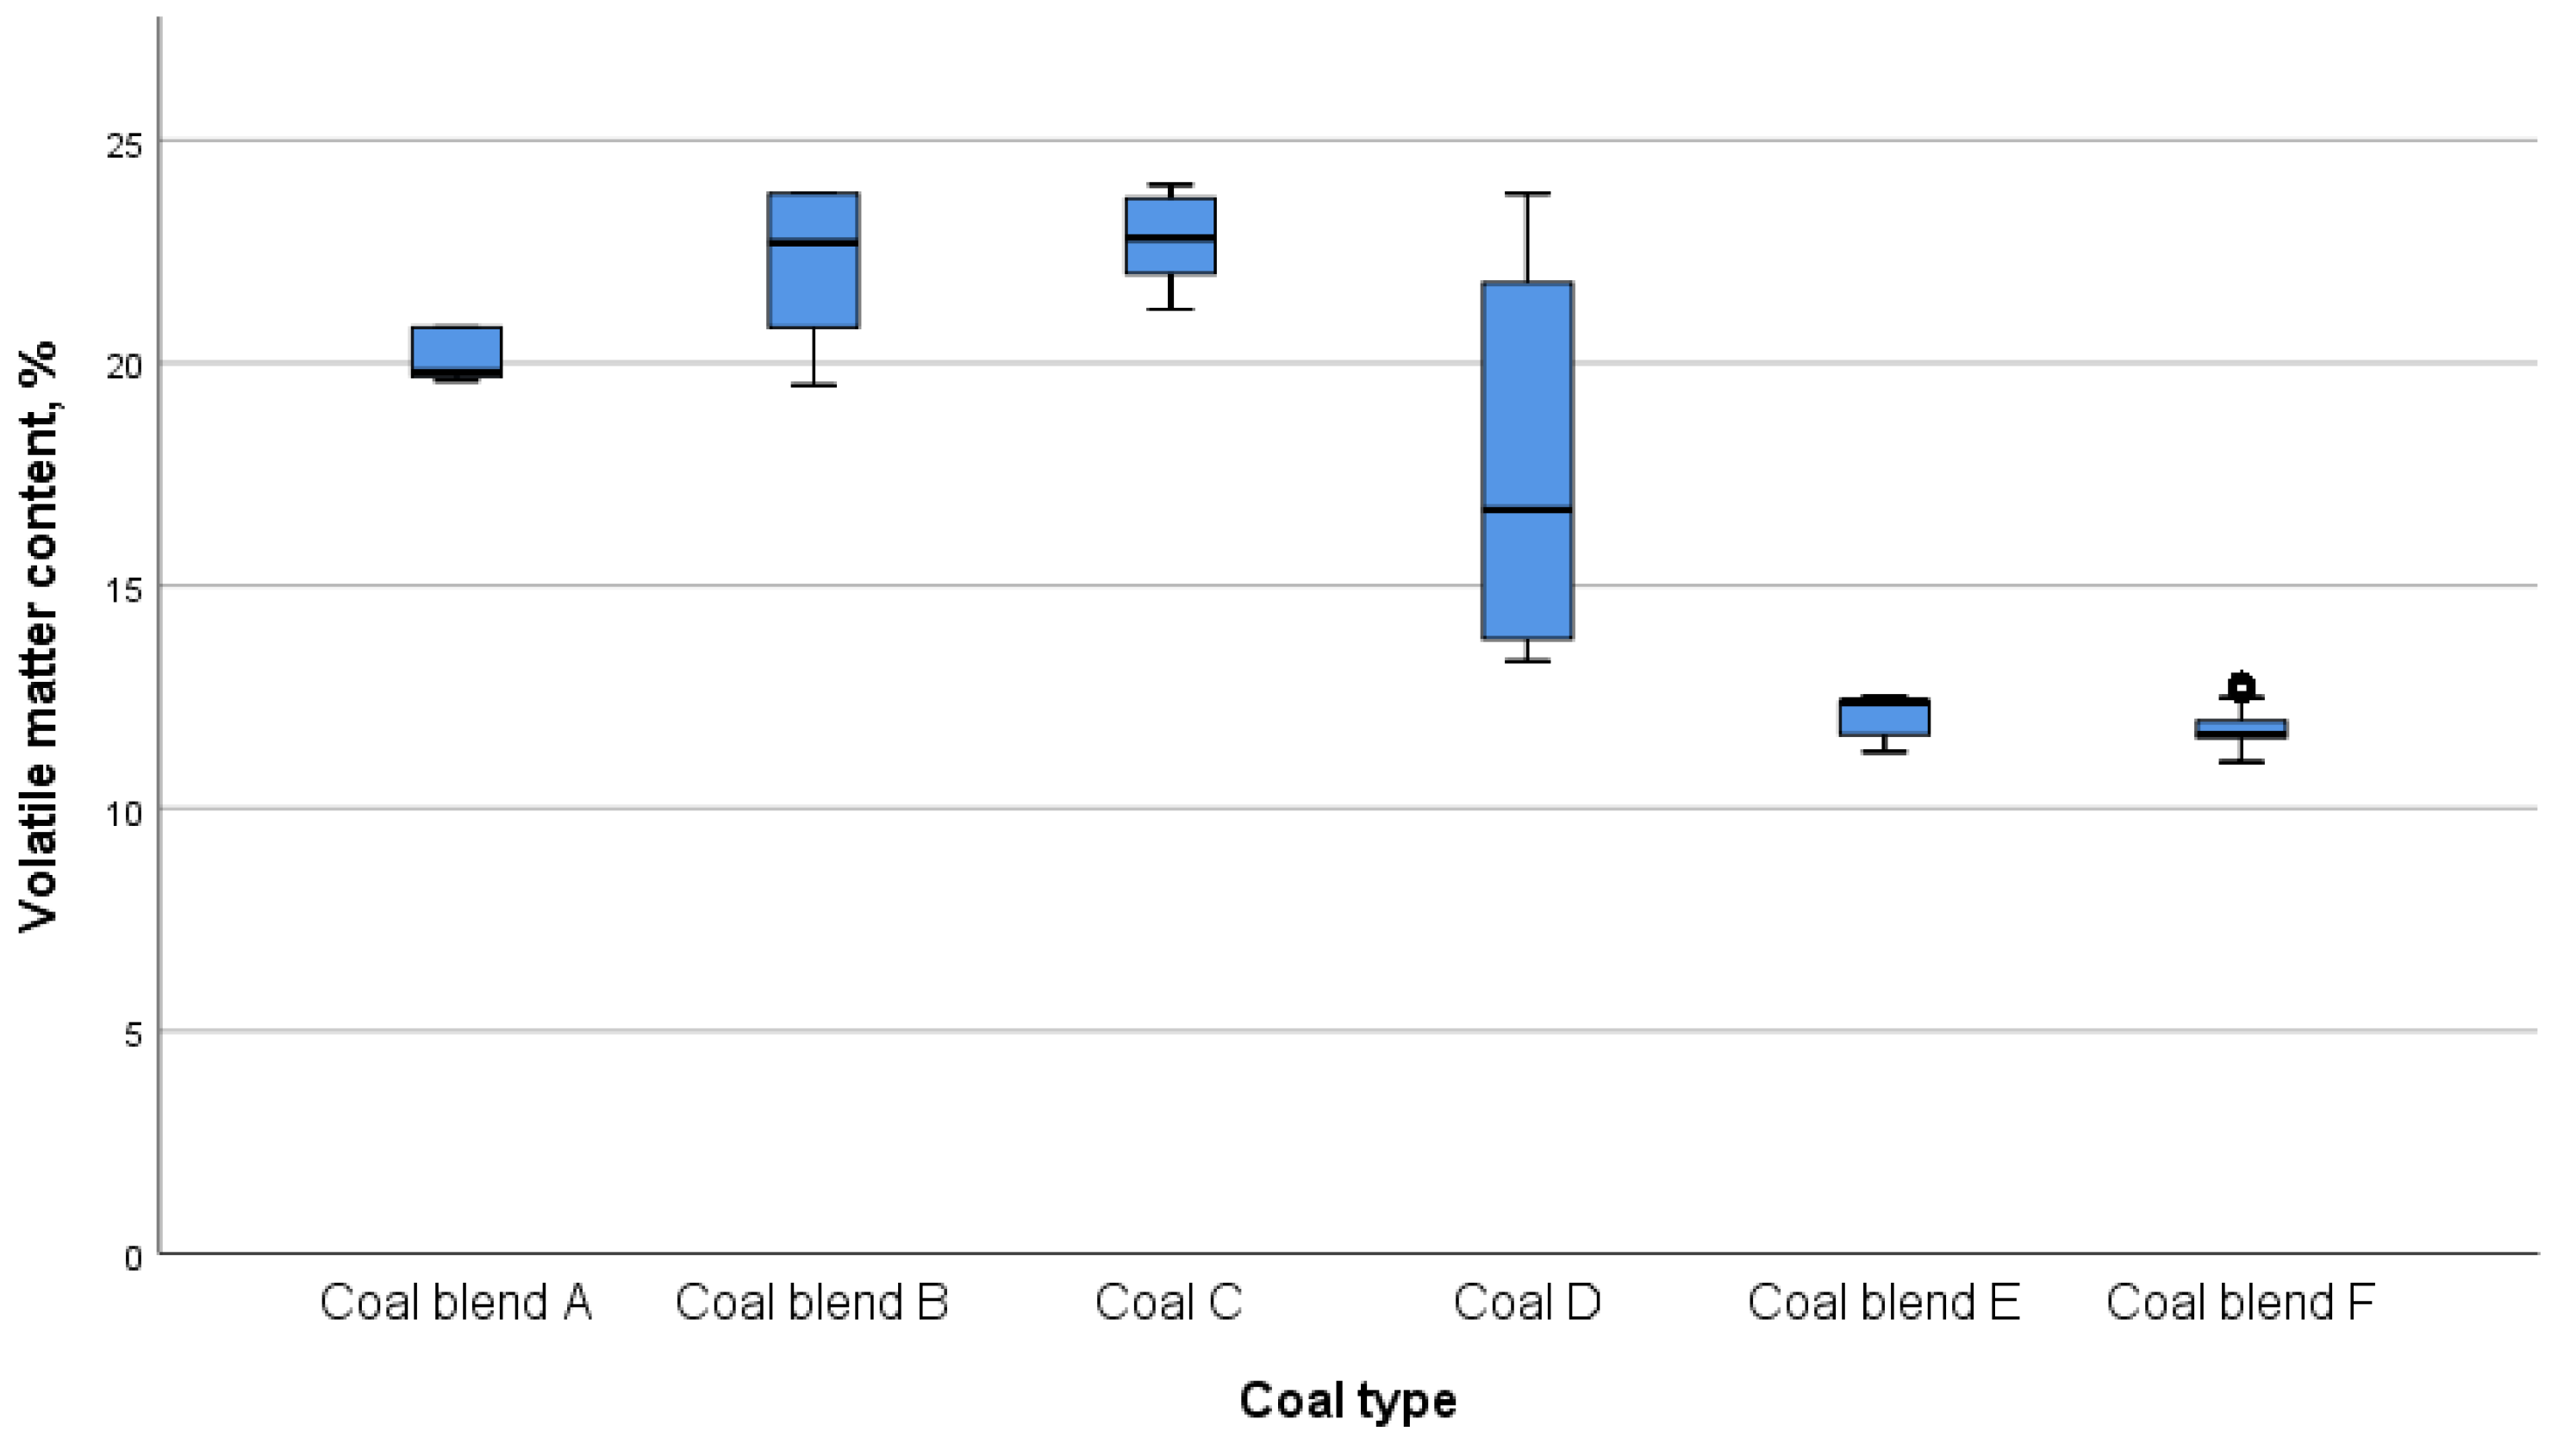
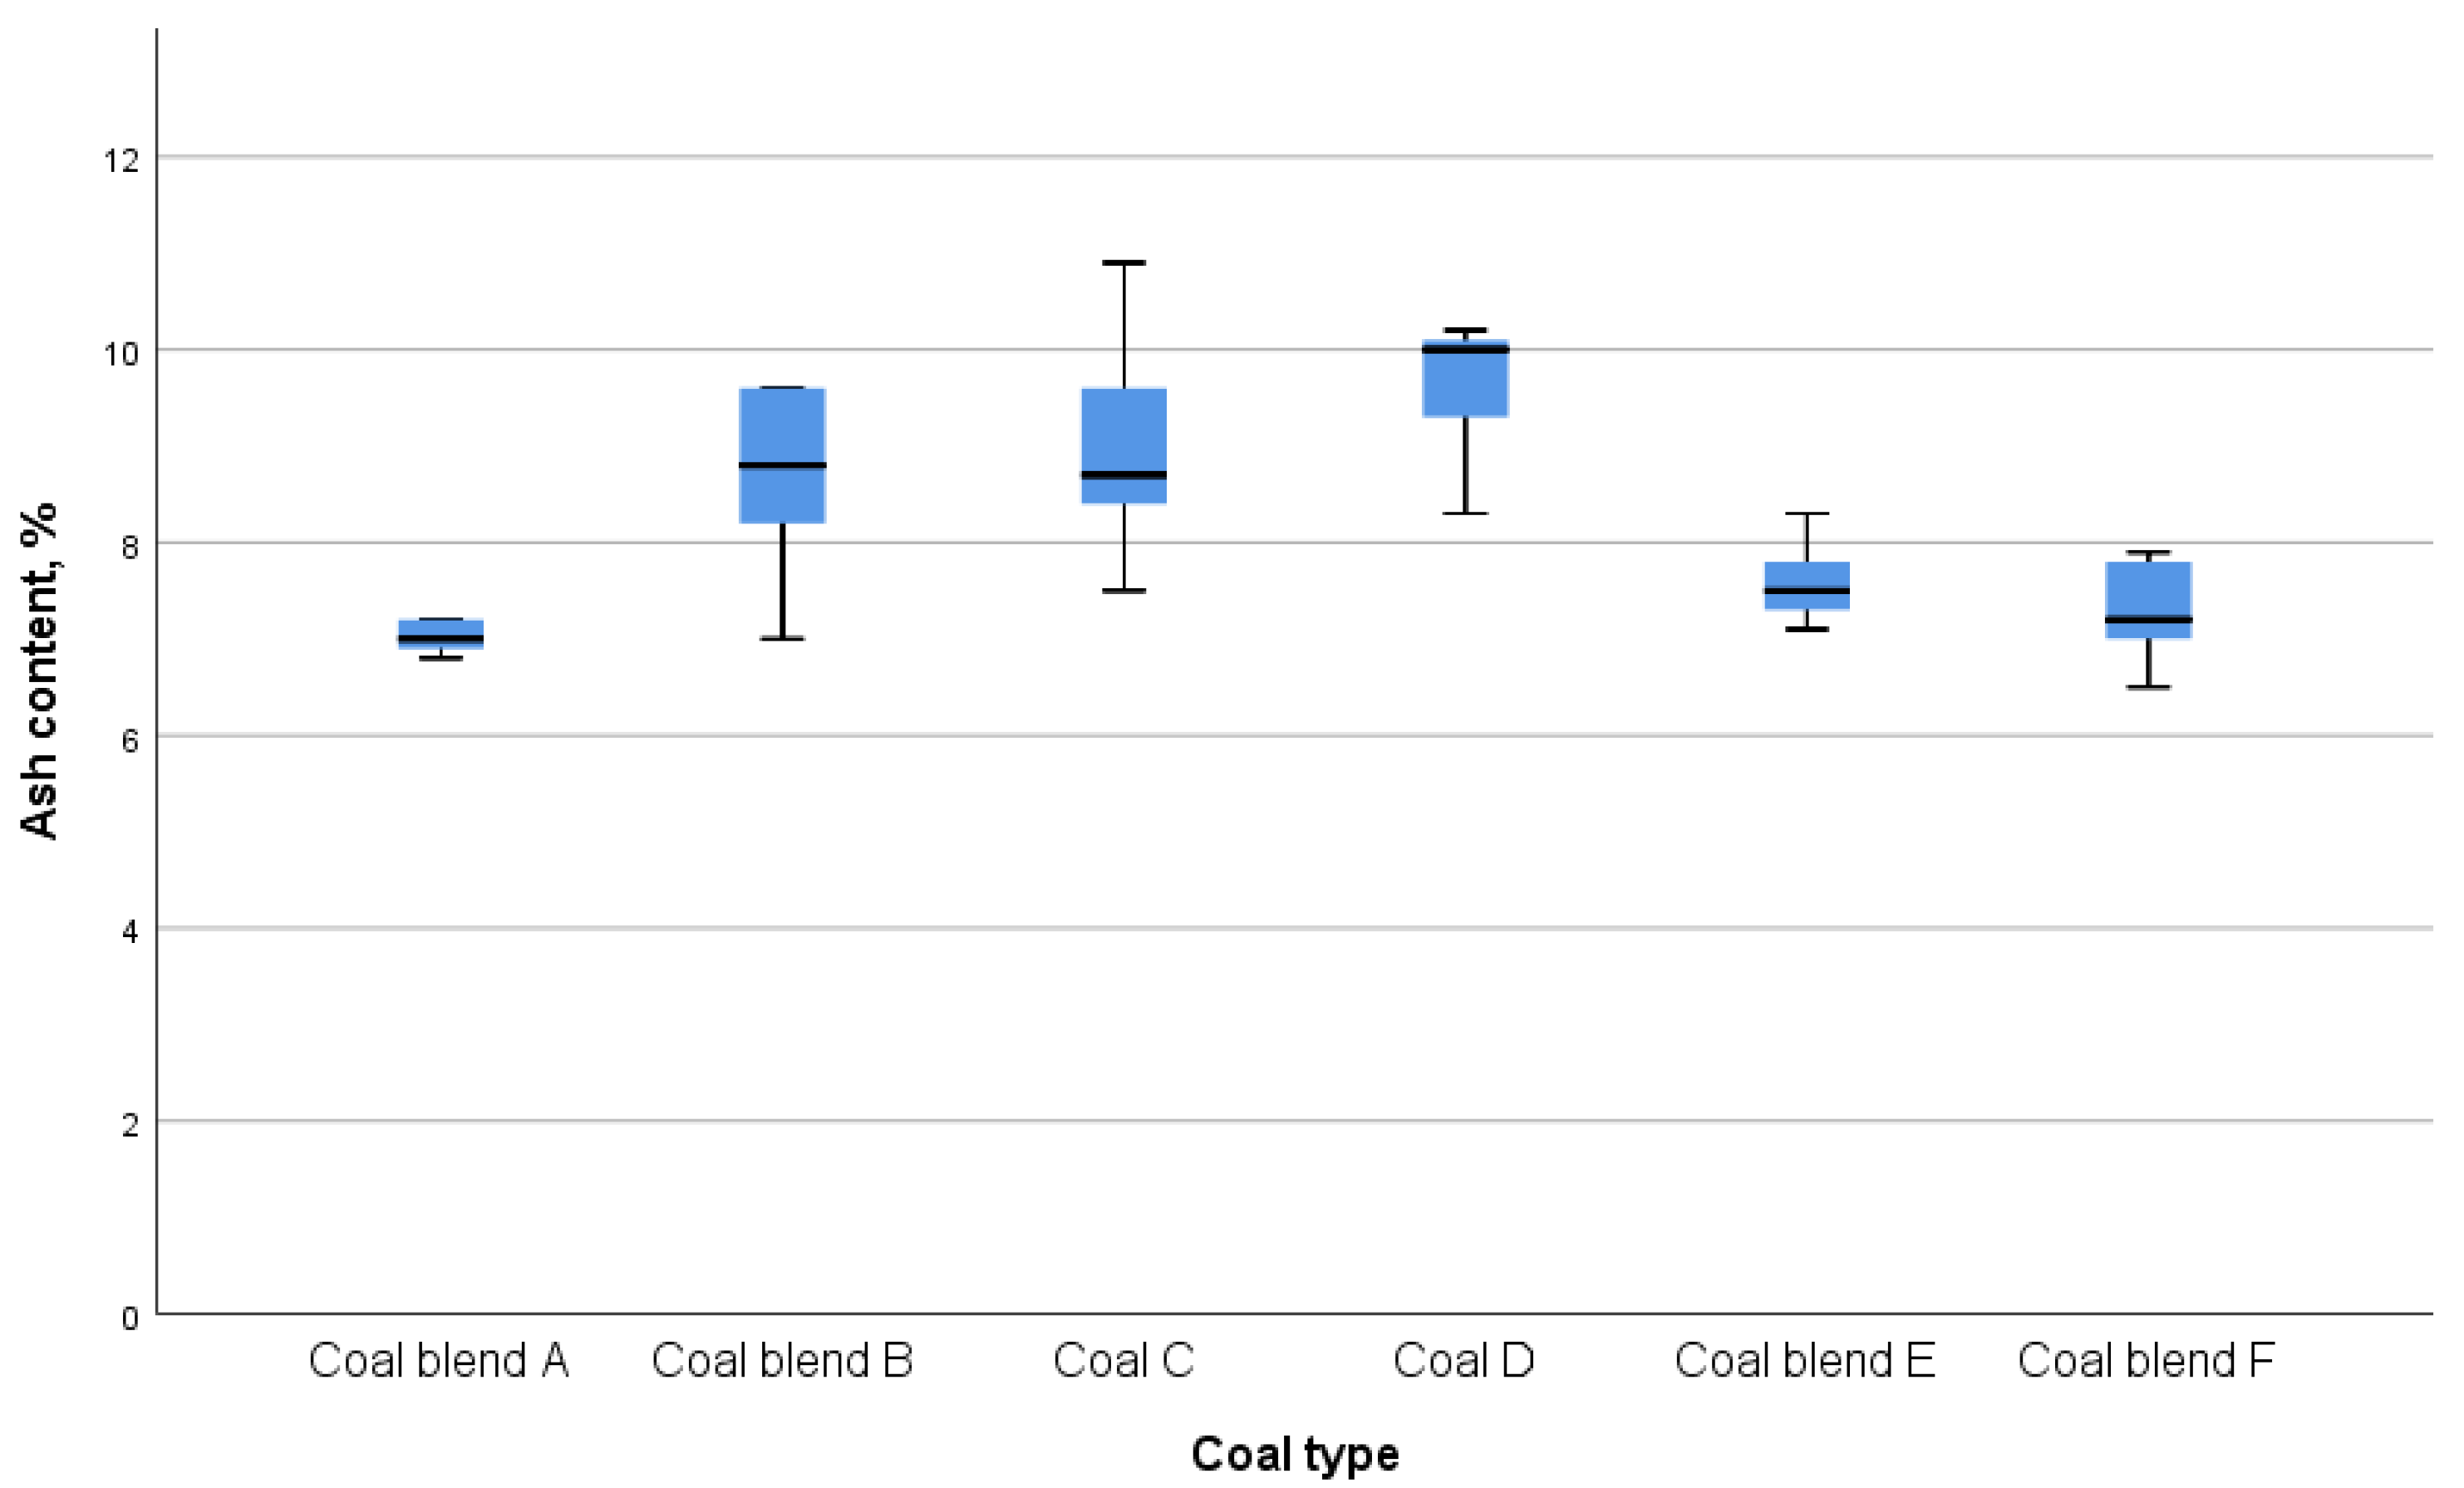
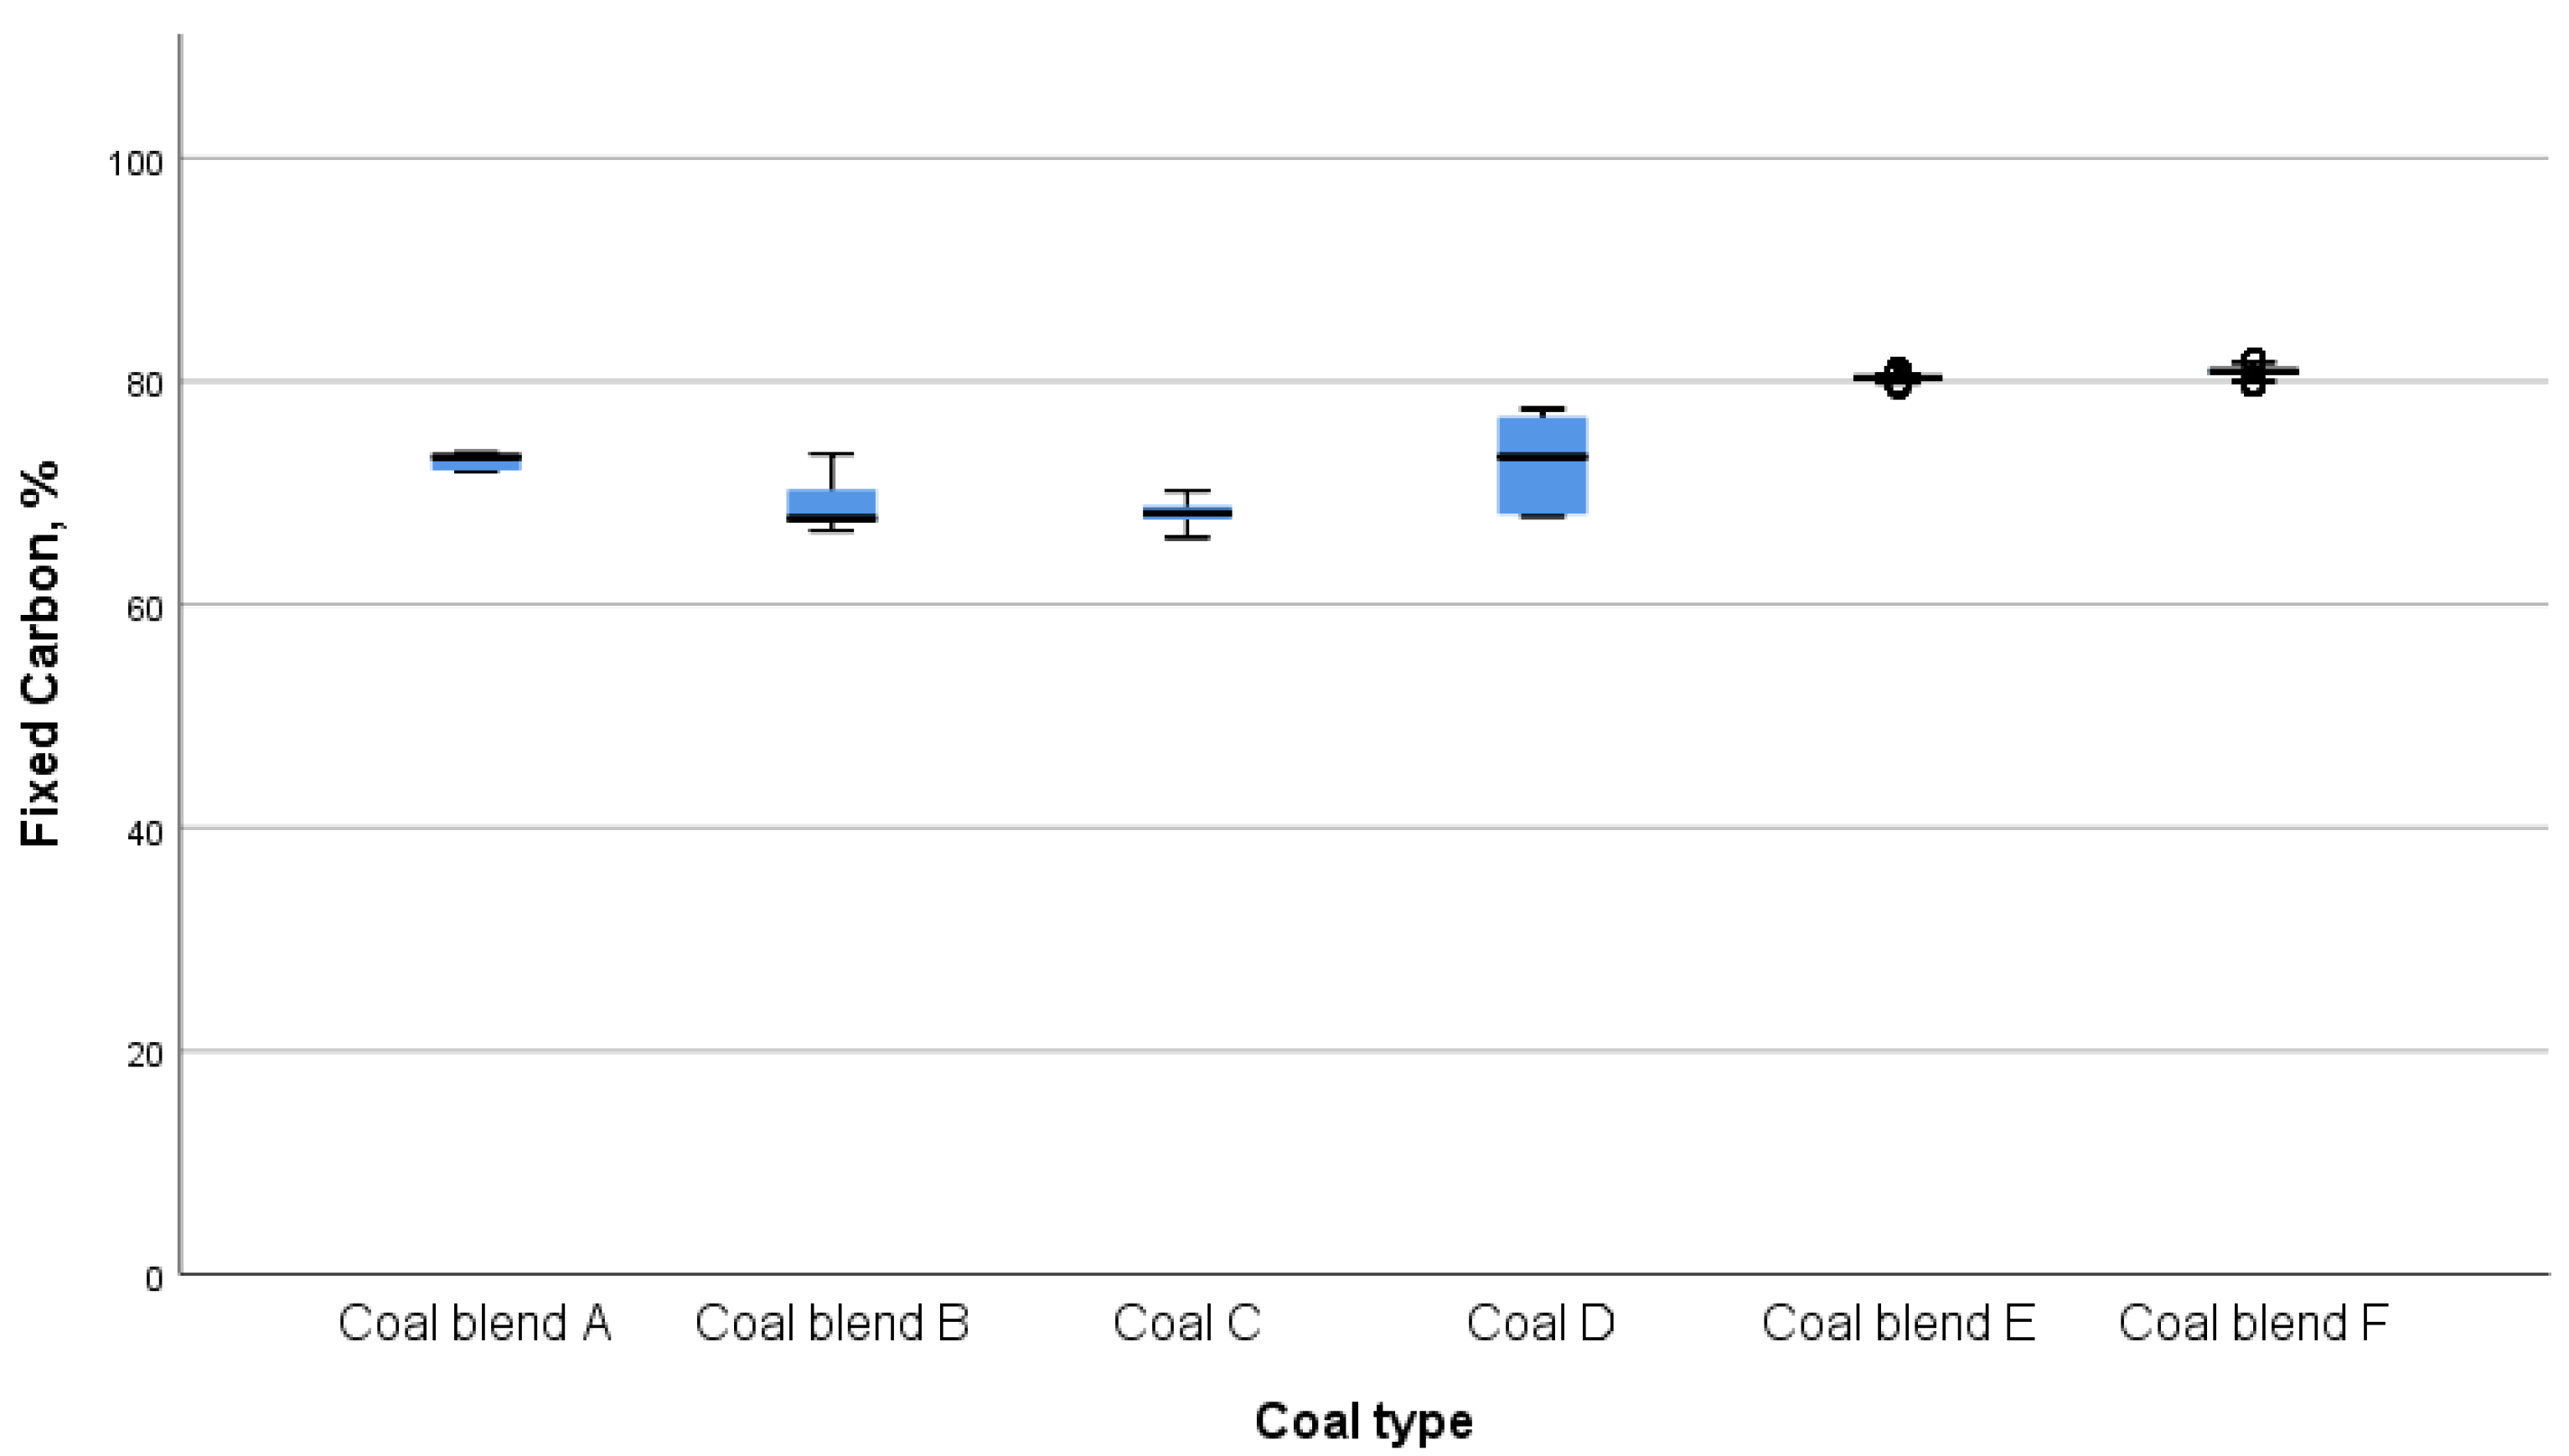
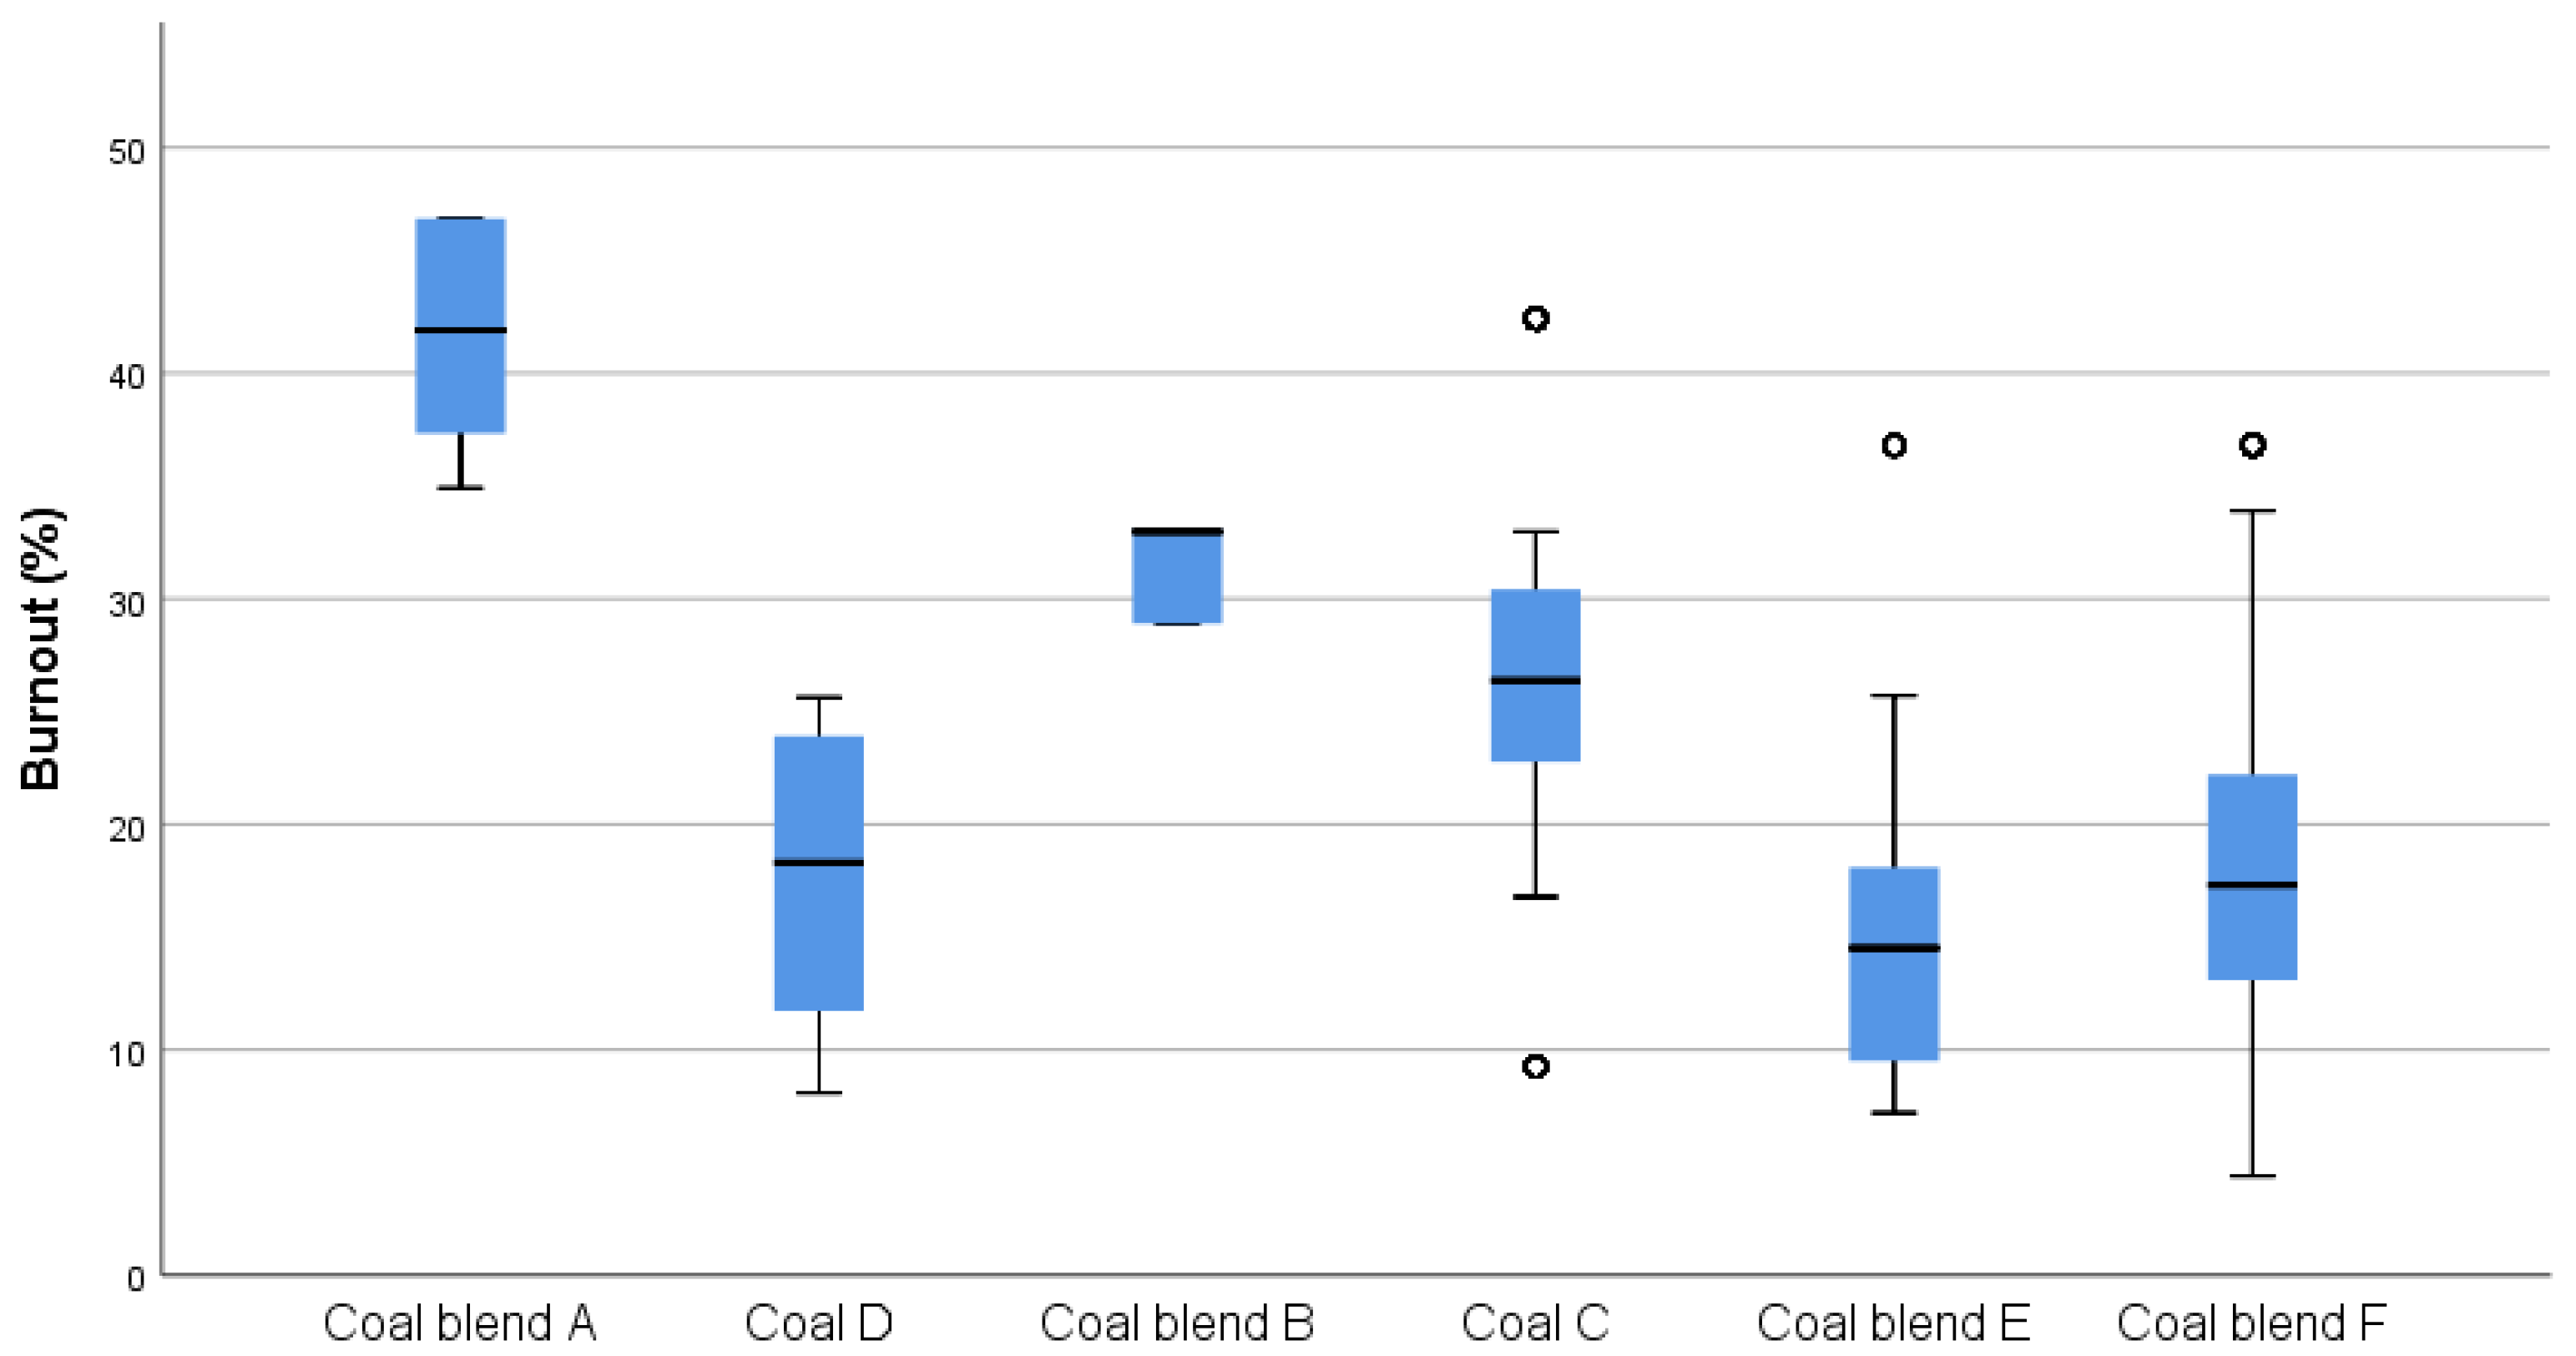
3.2. Box Plot Comparisons of Data

Another way to scrutinise the data is to use box plots; these give information on the spread of the results, their median, and the range. The box shows the range of results between the 25th percentile to the 75th percentile; inside of the box, the bold horizontal line shows the median; and finally, the whiskers that extend out of the box represent the minimum and maximum of the dataset (discounting any outliers which appear as circles).
All the box plots have been arranged in ascending order for the coal injection rate (Figure 12) where the box plots for the six different coal/coal blends used during the correlation trials are arranged from low to high coal rates. For Figure 12, the averages range from a minimum of 140 kg/tHM to a maximum of 200 kg/tHM. In contrast, Figure 13 is a plot of the coke addition rate for the time periods corresponding to the addition of different coals/coal blends during blast furnace production. The coke rate indicates a reverse trend, as less coke reductant is required with increasing coal injection rates.
In Figure 14 the data also show a similar ascending pattern that is in agreement with the Spearman’s correlation for the gasification reactivity against coal rate (Figure 8, Table 2), indicating that lower DTF char reactivity is associated with higher blast furnace coal injection rates.
However, although five of the blends follow this trend, it is noted that the coal D does not. The proximate analysis of samples of this coal, taken during the six days that this coal was used for injection on production, had a wide variation (13–24%) about the mean for the volatile matter content (see Figure 1) and drop tube furnace burnout reactivity (see Figure 15) compared to the other blends.
Coal D was added to the blast furnace as a single coal injectant (not as blend with another coal), so a narrower variability might be expected, as the process of blending would not be such an issue. However, the wide range suggests the possibility of supply variation or contamination with other coals on the stockyard. In contrast, coal A had a very narrow gasification range over the 4 days that this coal was used for injection during production; the asterisks either side of the bar represent outlier results.
The coal burnout results shown in Figure 15 mirror the gasification results trend in reverse, indicating an association between lower DTF burnouts and higher coal rates in the blast furnace, except for Coal D.

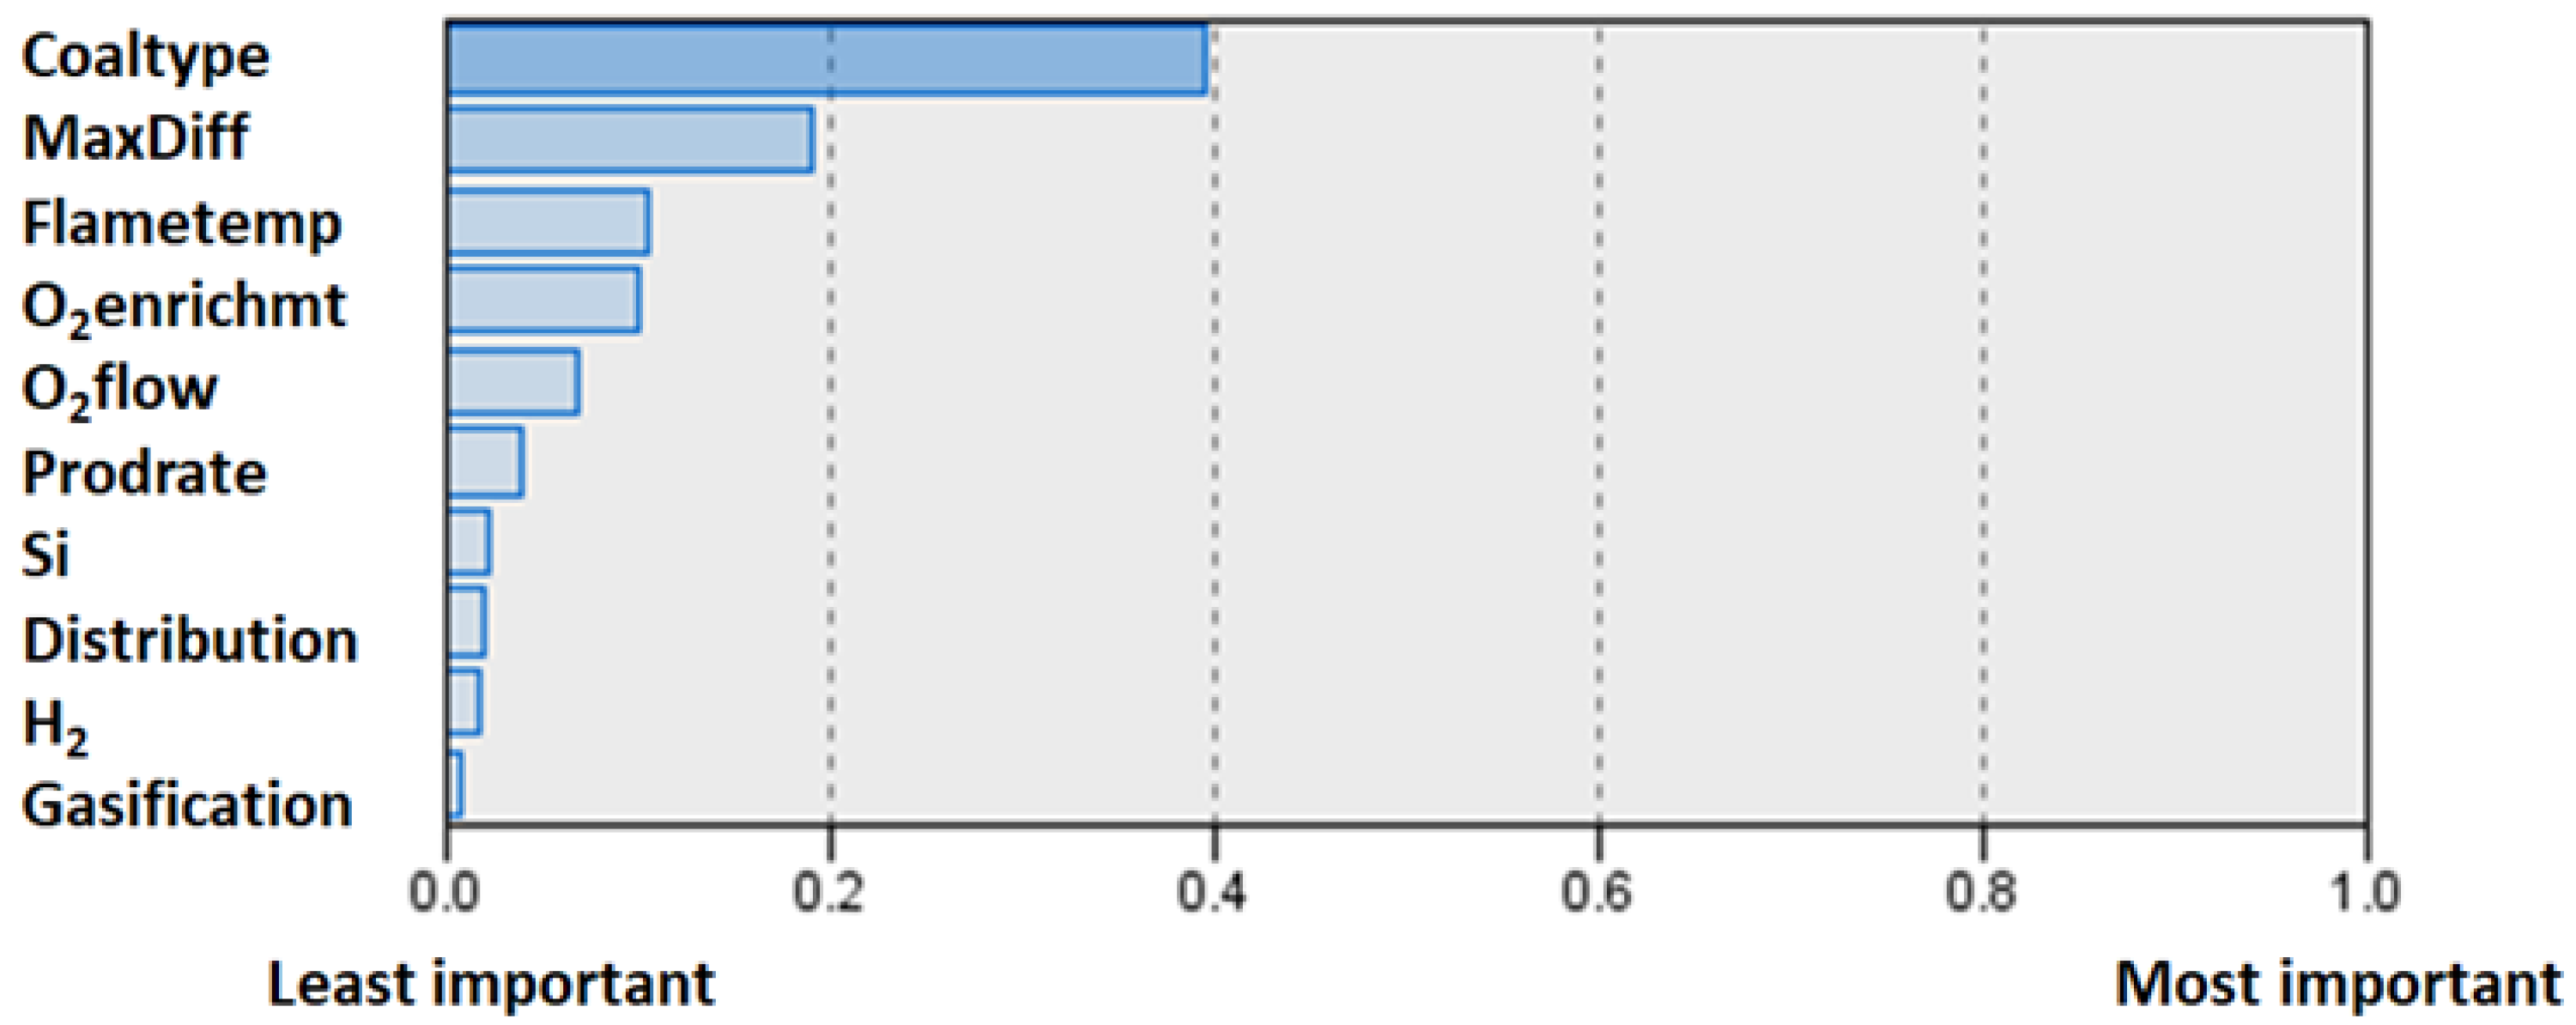
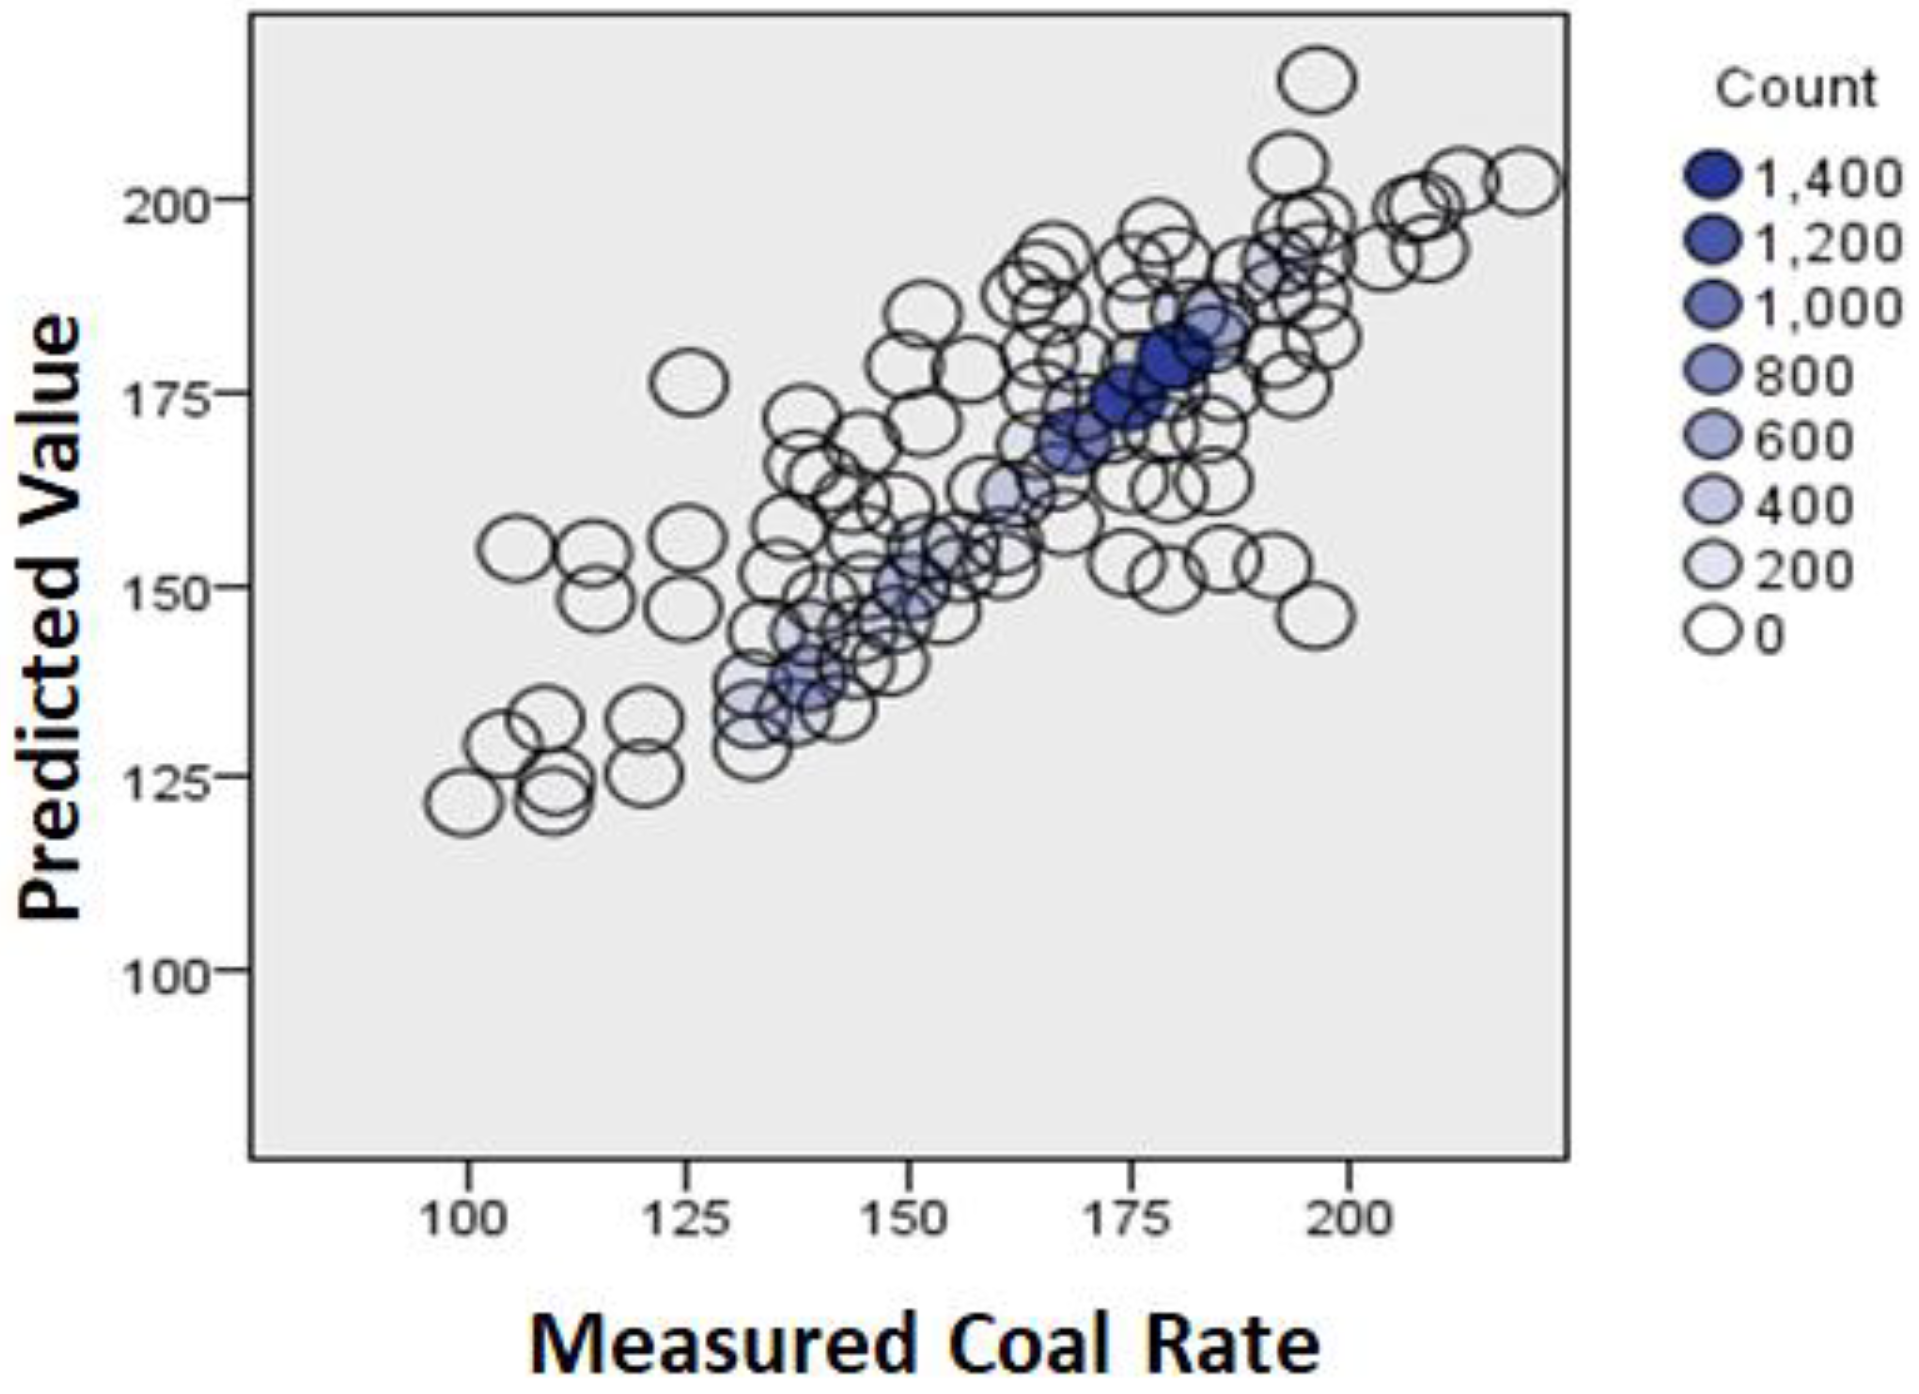
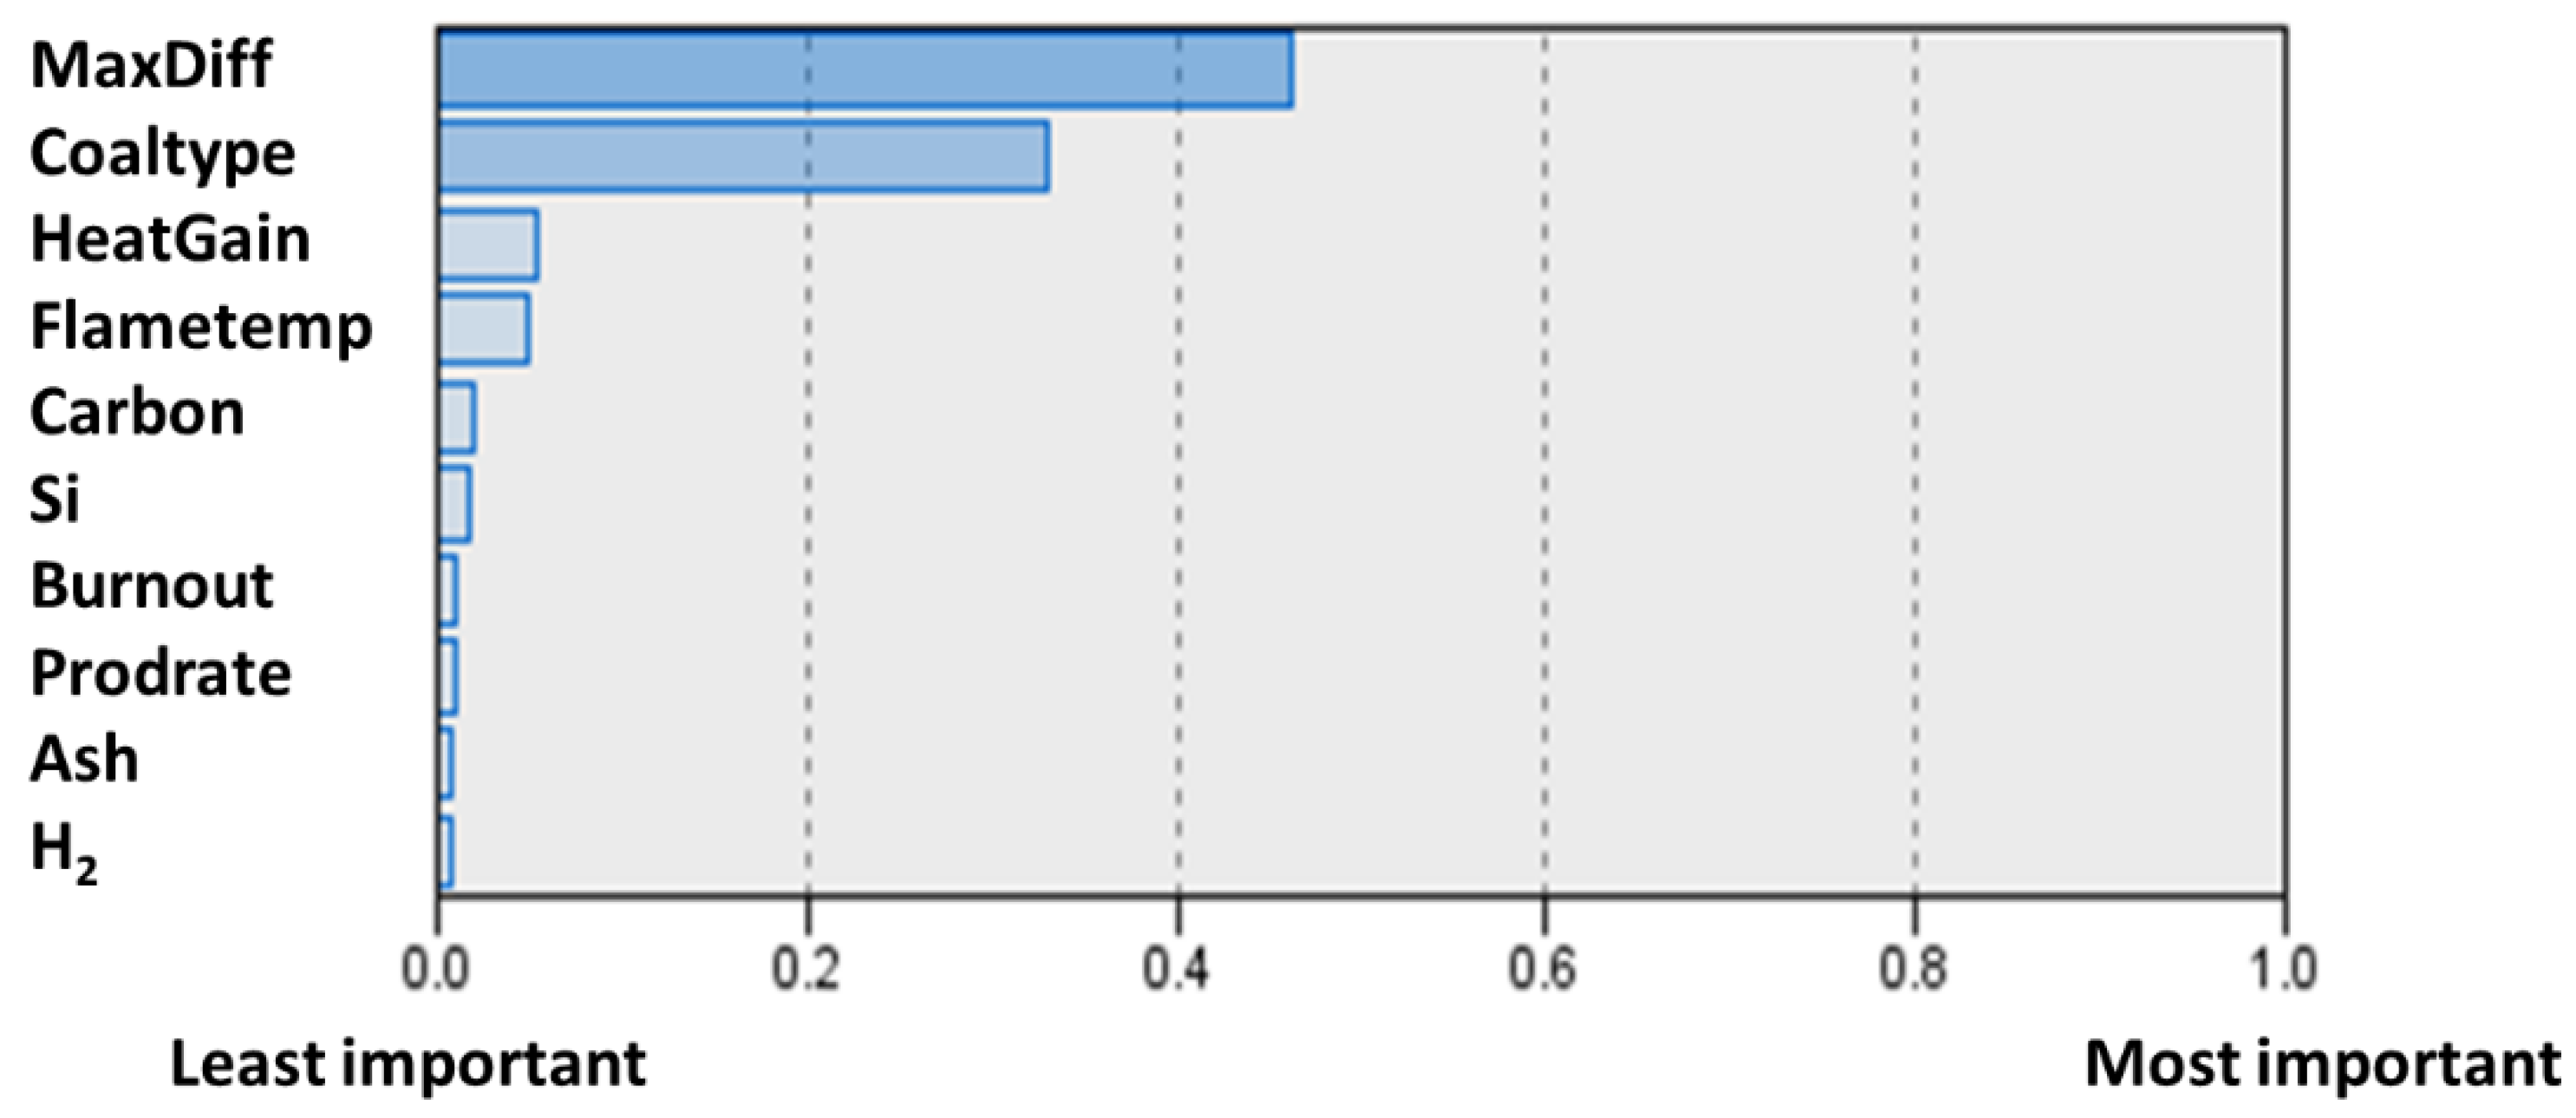
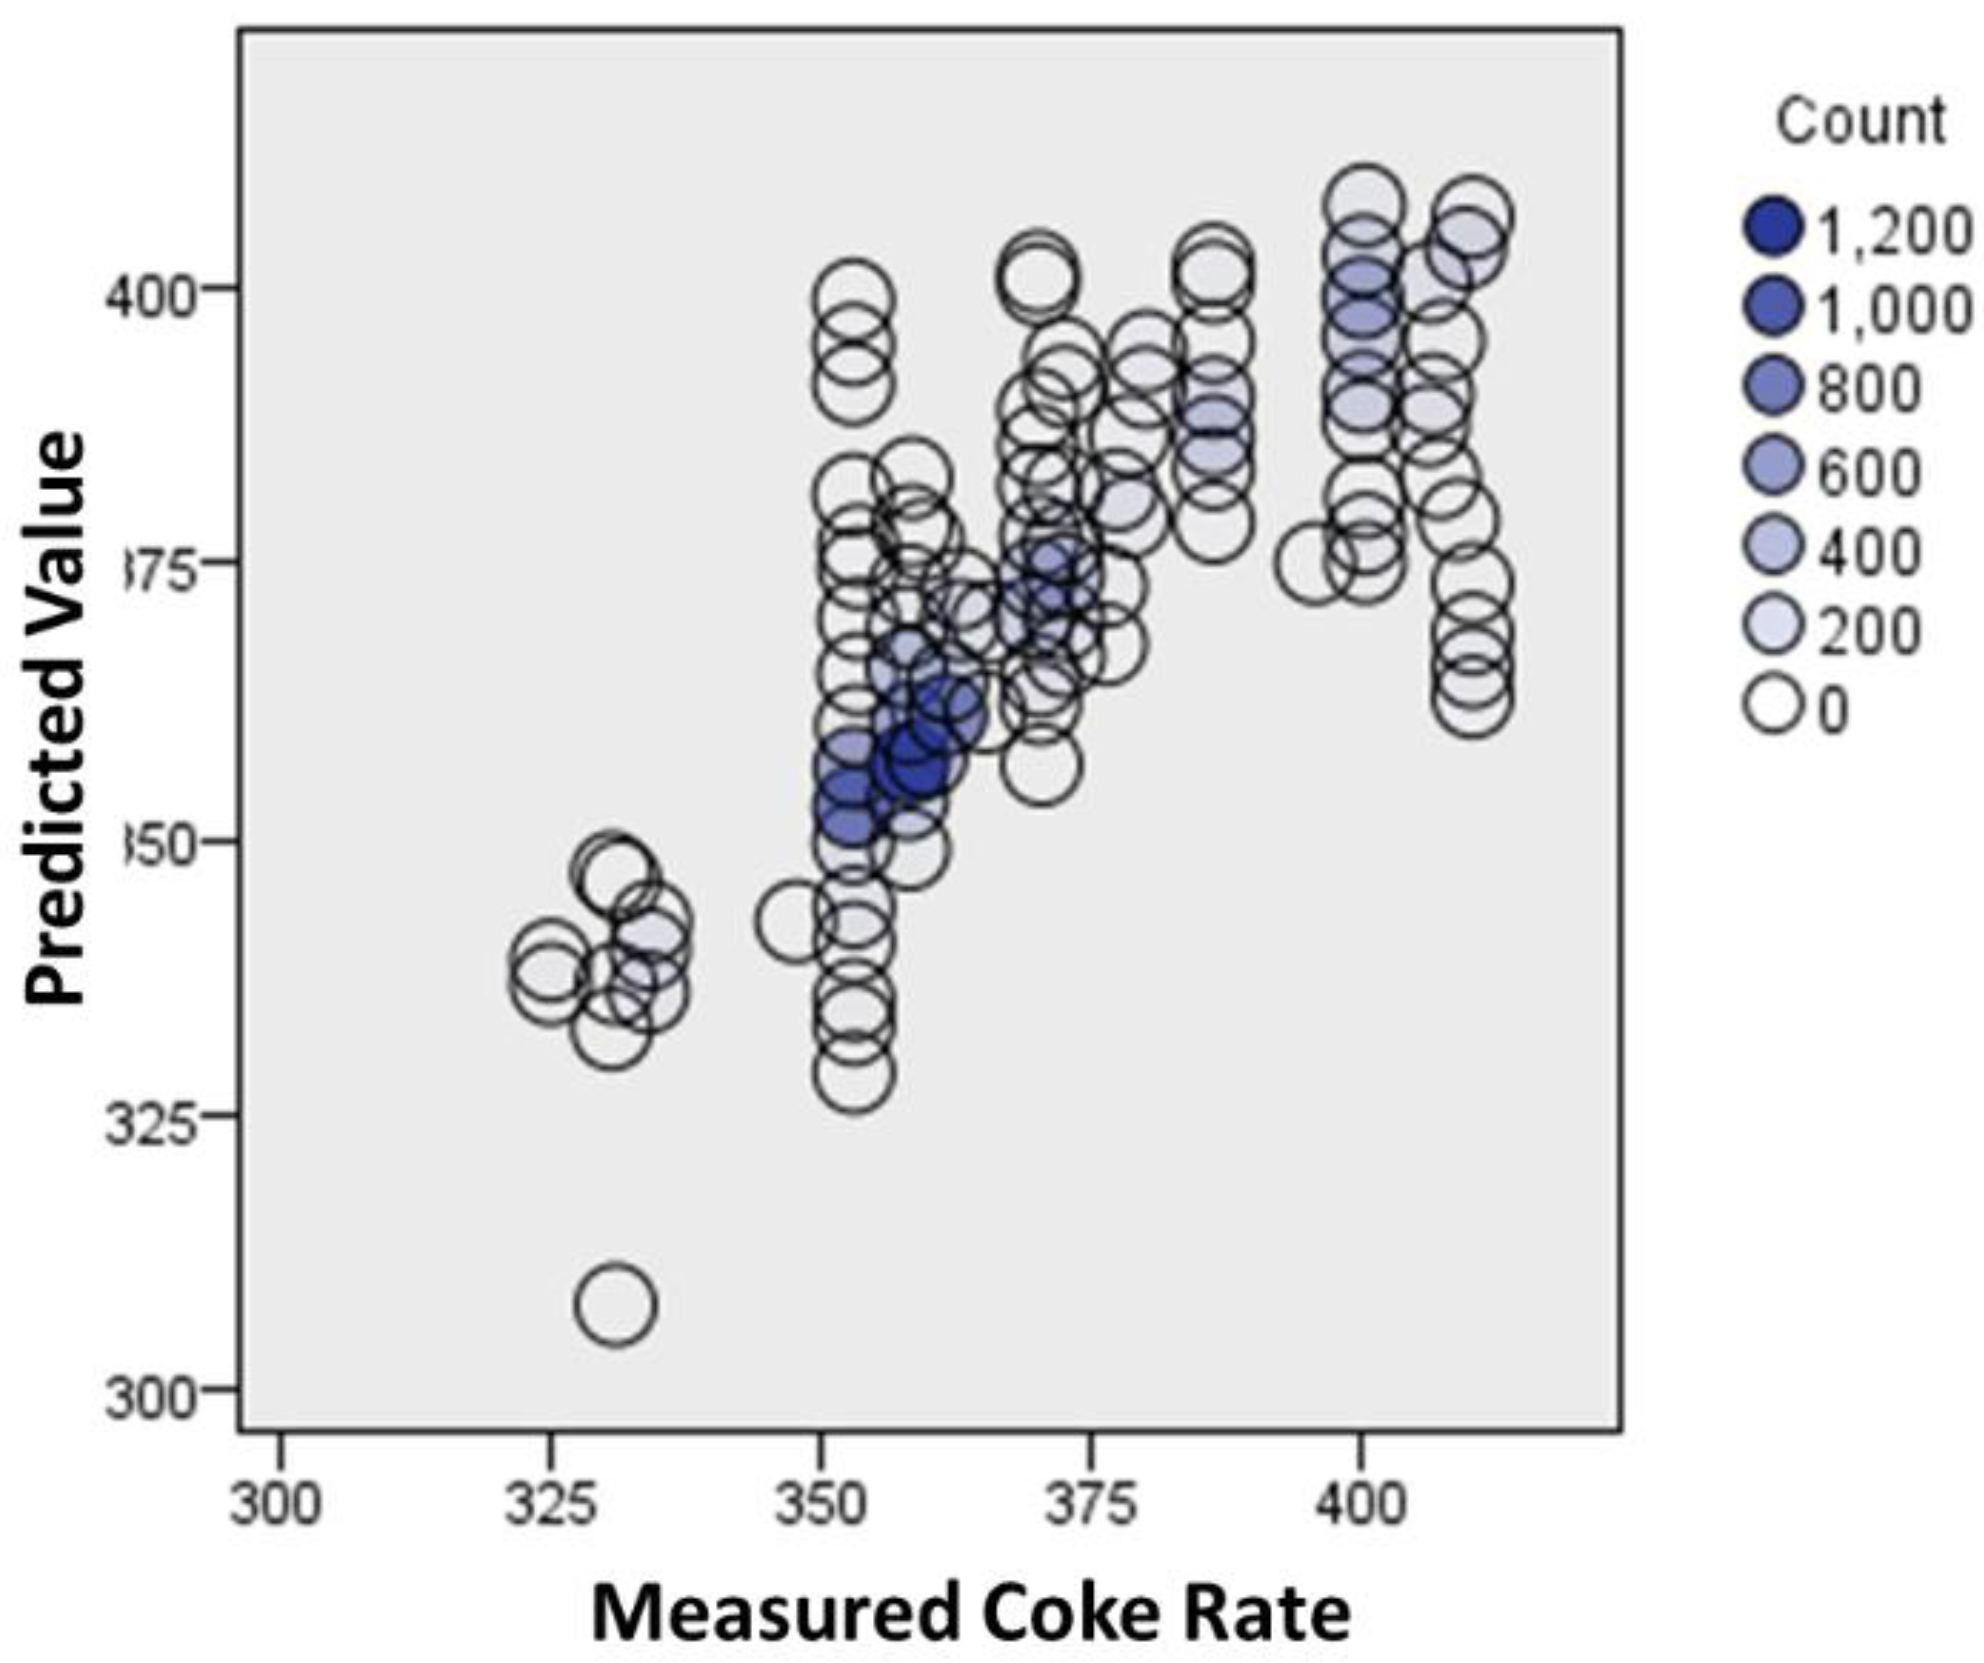
3.3. Multiple Regression Modelling

Multiple regression modelling is used to give a more complete assessment of the process by comparing all the measured variables and parameters. In this way, it is used to predict the value of dependent variables from the multiple variables obtained from the blast furnace process information. This technique is used to determine the overall fit of the model and the relative contribution of each of the predictors to the total variance.
The model fitting for the blast furnace coal injection rate shown Figure 16 indicates that the data explains the relationship with a 95% accuracy, also shown by the relationship between the predicted versus actual coal rates in the scatter plot.
The model indicates that the most important predictor of the coal rate was the type of coal used, which is also observed from anecdotal blast furnace operator experience. However, the model did not indicate any relationship with the measured coal properties, such as volatile matter content or DTF burnout, etc. In contrast to the previous approaches, the multiple regression showed only a small relationship with char gasification.
However, in conjunction with the box plots, there is an indicative relationship of higher injection coal rates, lower burnouts, and lower char gasification rates.
The reductant charged to the blast furnace is split between coke and coal; as one increases, the other is expected to decrease. Consequently, the type of injection coal is also the strongest predictor of the coke rate, too, and the model shown in Figure 17 explains the data with 87% accuracy. In the case of the coke addition rate, the maximum pressure difference was the highest predictor of coke rate, followed closely in second place by the injection coal type. Although this does not tell us specifically what coal property is important, in conjunction with the box plots in Figure 14 and Figure 15, we can deduce that the lower burnouts and lower char gasification reactivities that are determined in the laboratory are important to the lower coke rates. This is particularly relevant, as coking coal is more expensive than injection coal and involves the additional process of coking, which can result in additional environmental emissions. Lower coke rates also relate to higher coal injection rates, which are linked to higher production efficiency.

4. Conclusions

The aim of the study was to understand if laboratory test results could be related to the variables observed in a blast furnace during a production study; in this way, the laboratory testing of injection coals might be used as a predictor for the blast furnace performance of that process. Using the SPSS® statistical package, different statistical data analysis techniques were used to compare laboratory test results for the coals used over a two-month trial period against the process measurements for that production period. The main findings and conclusions from the study are summarised as follows:
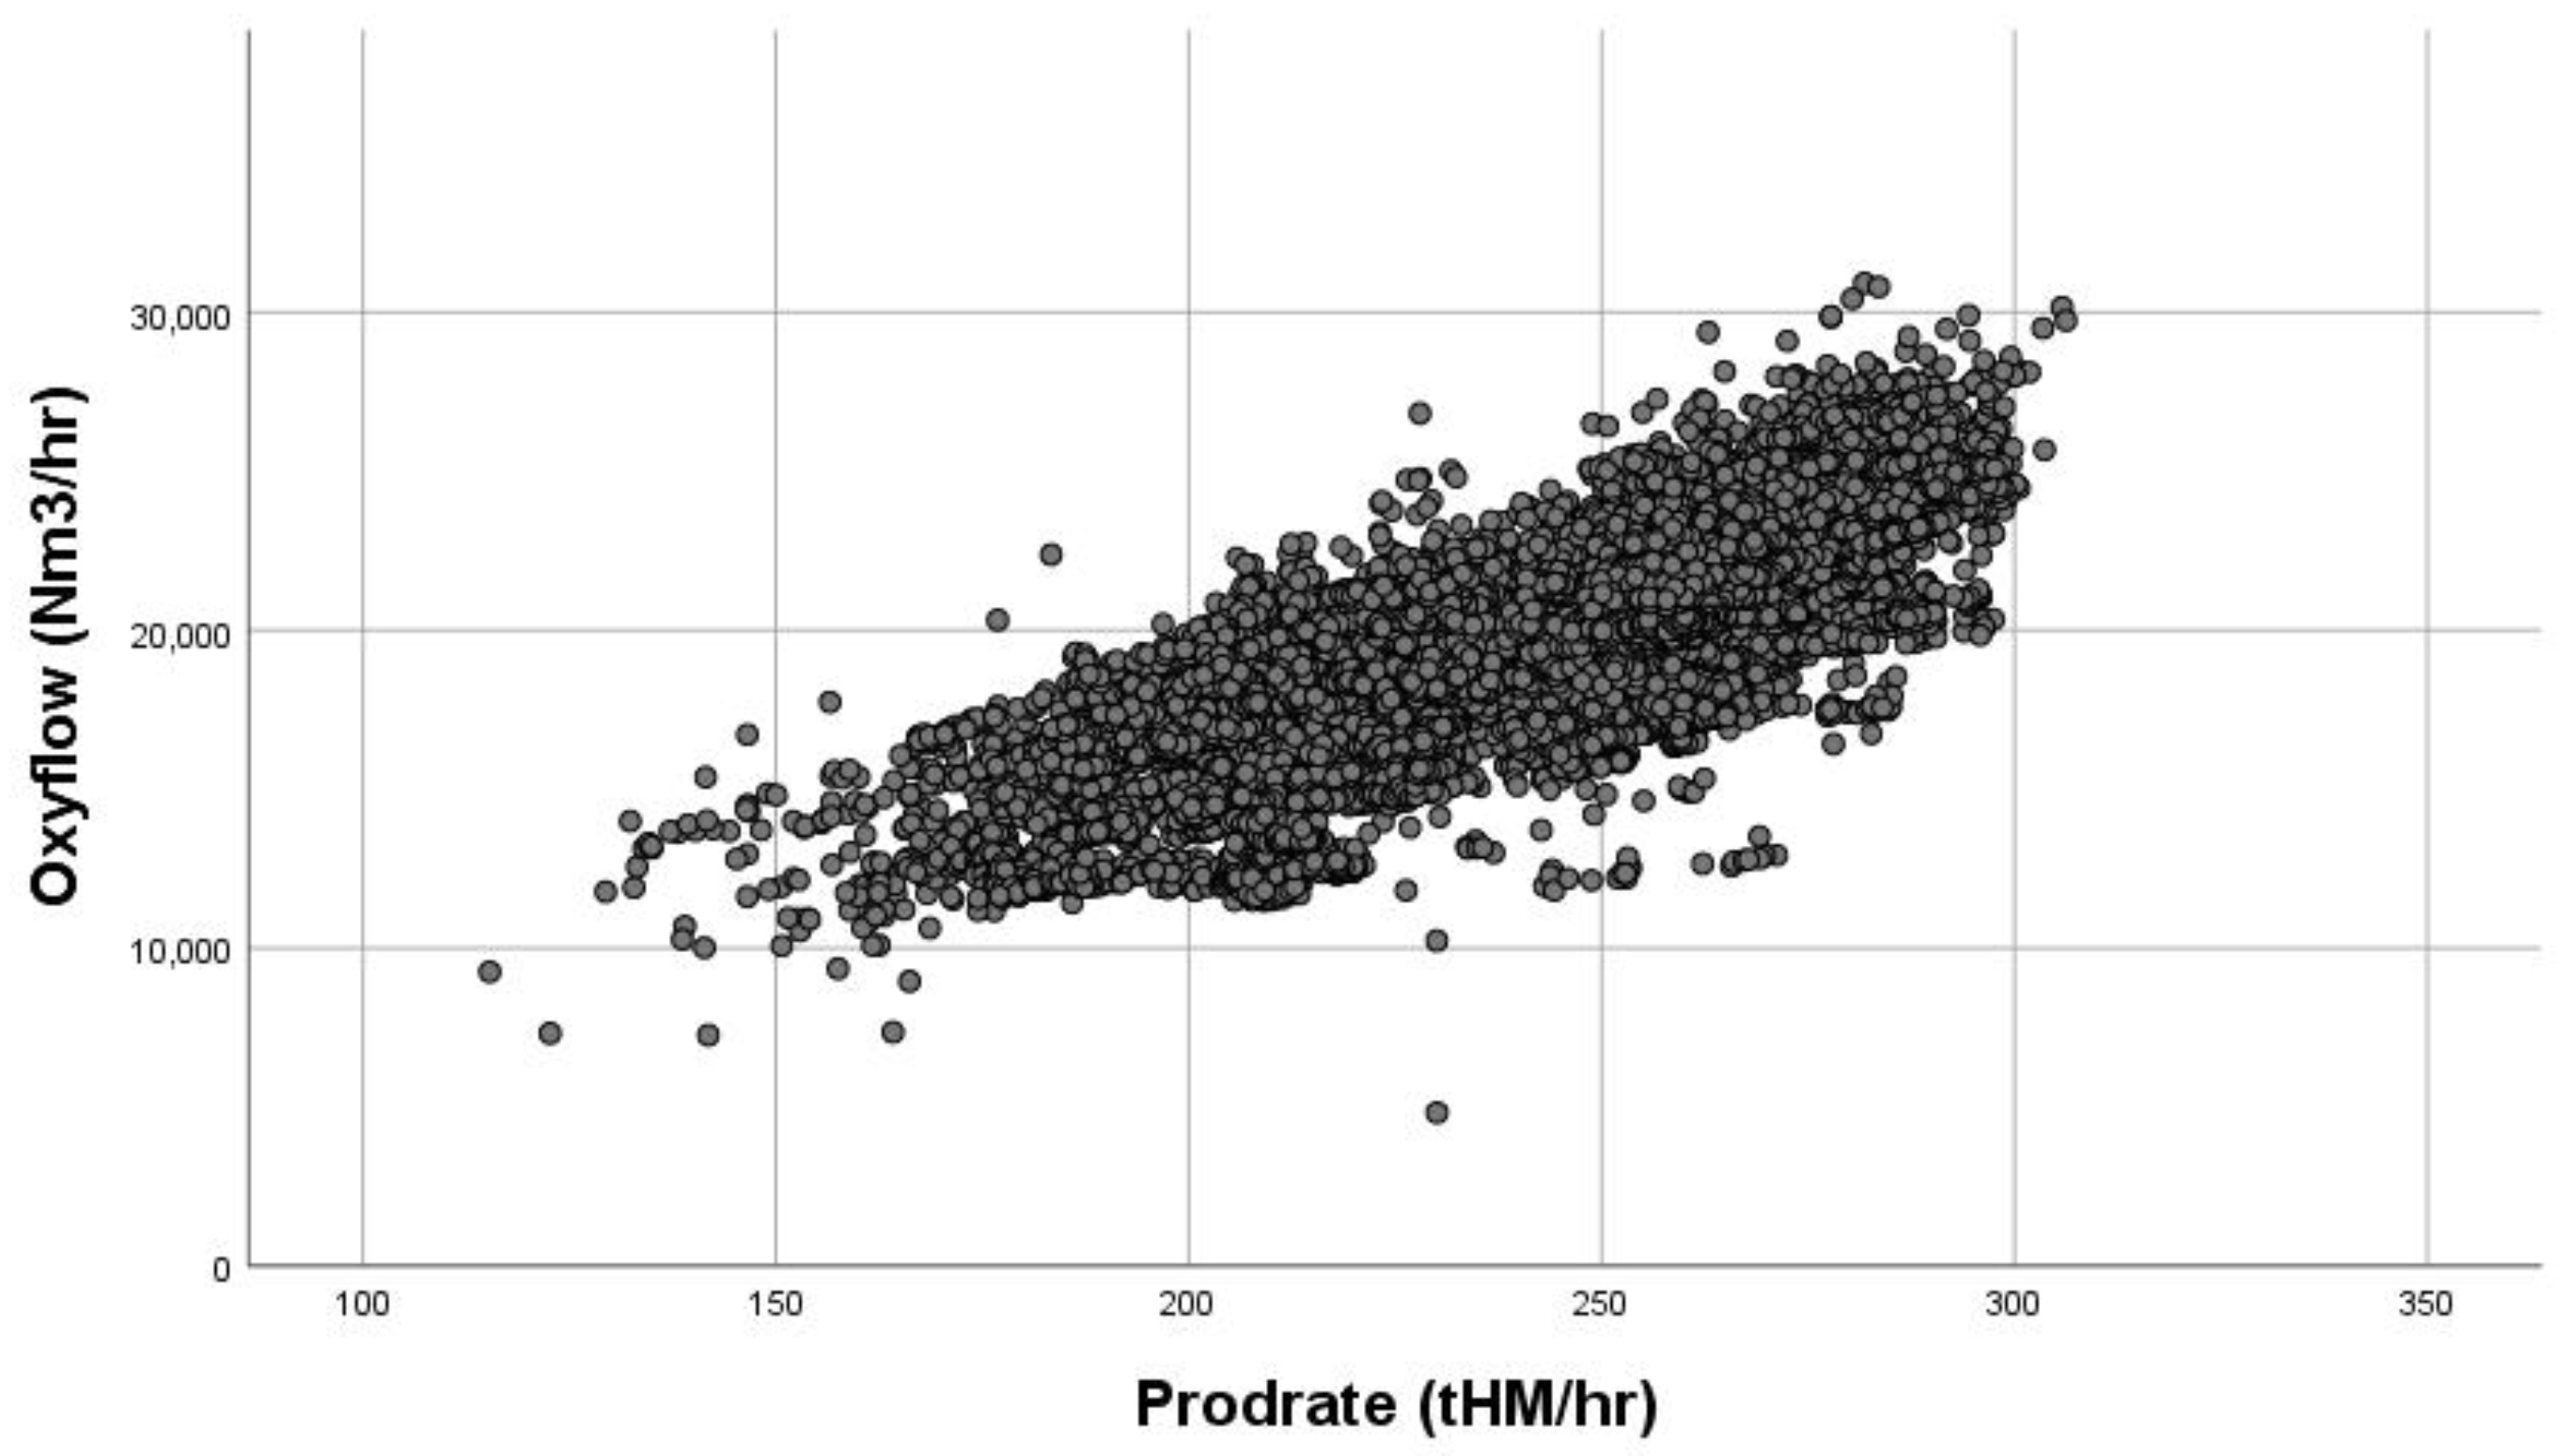
  • Strong correlations between the production variables, such as blast volume and oxygen enrichment, etc., make it difficult to differentiate more subtle relationships with the laboratory measured coal properties, as both operators and control systems make real-time adjustments for process variations.
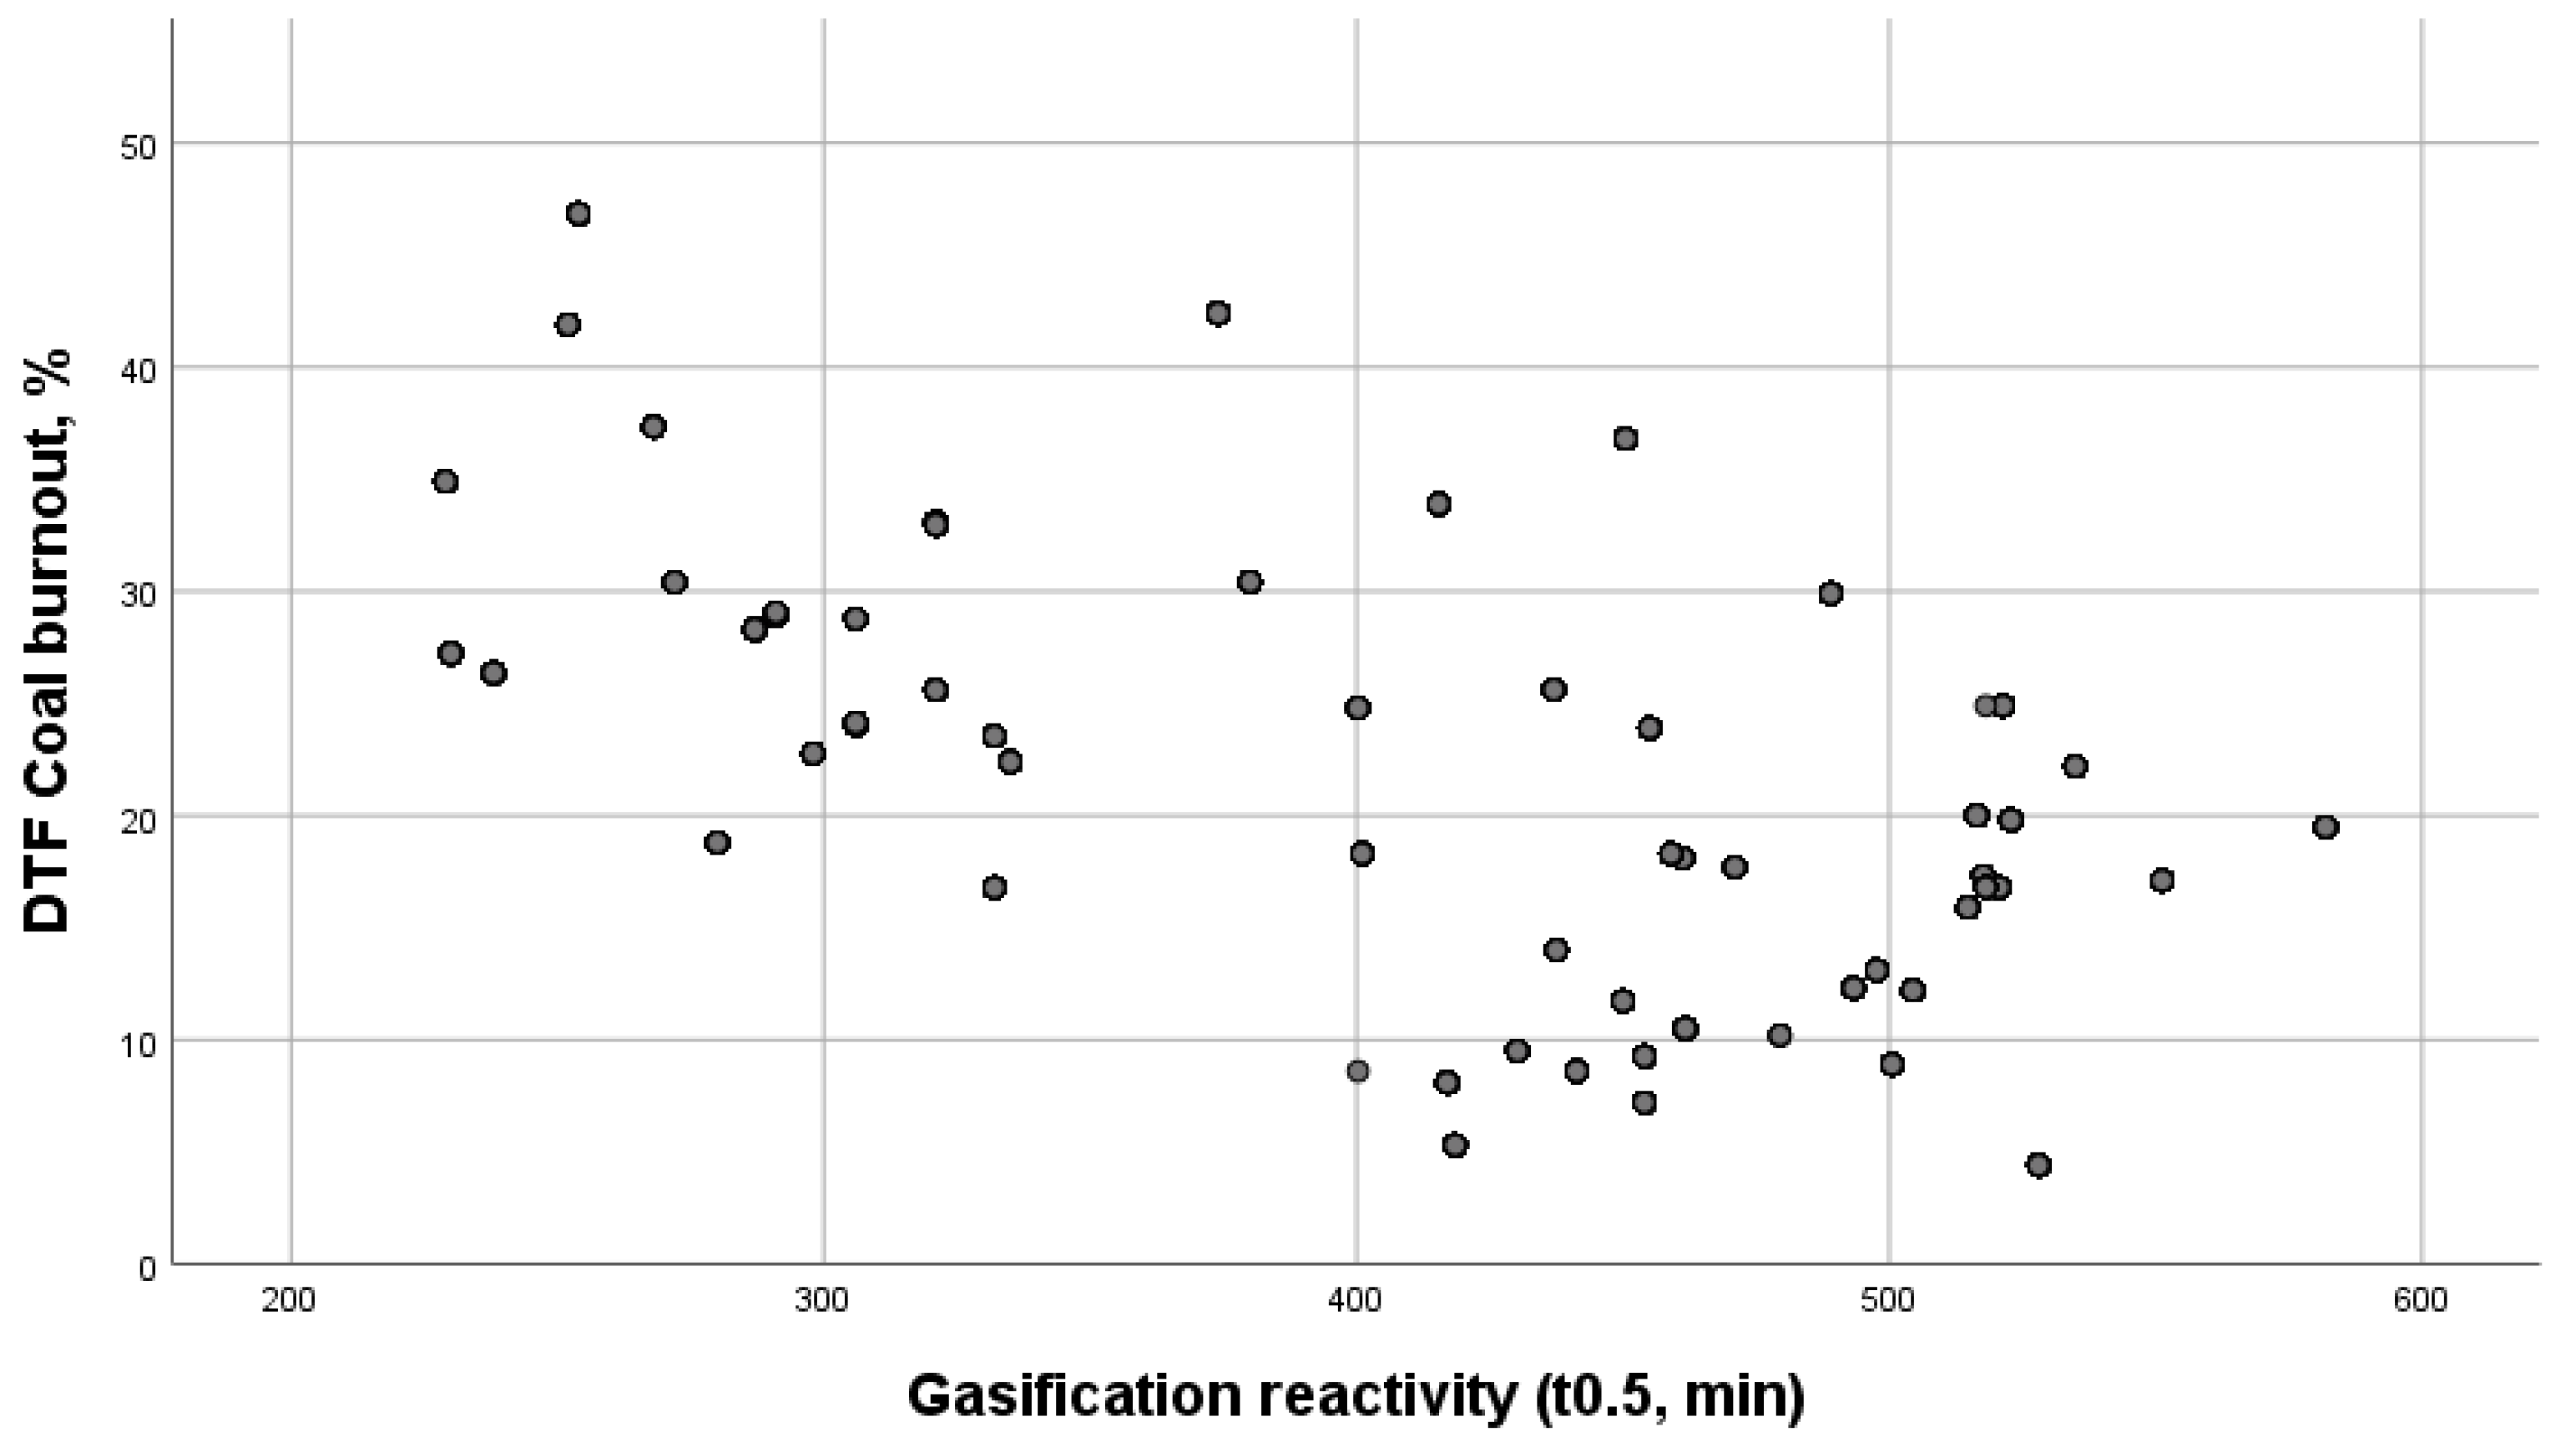
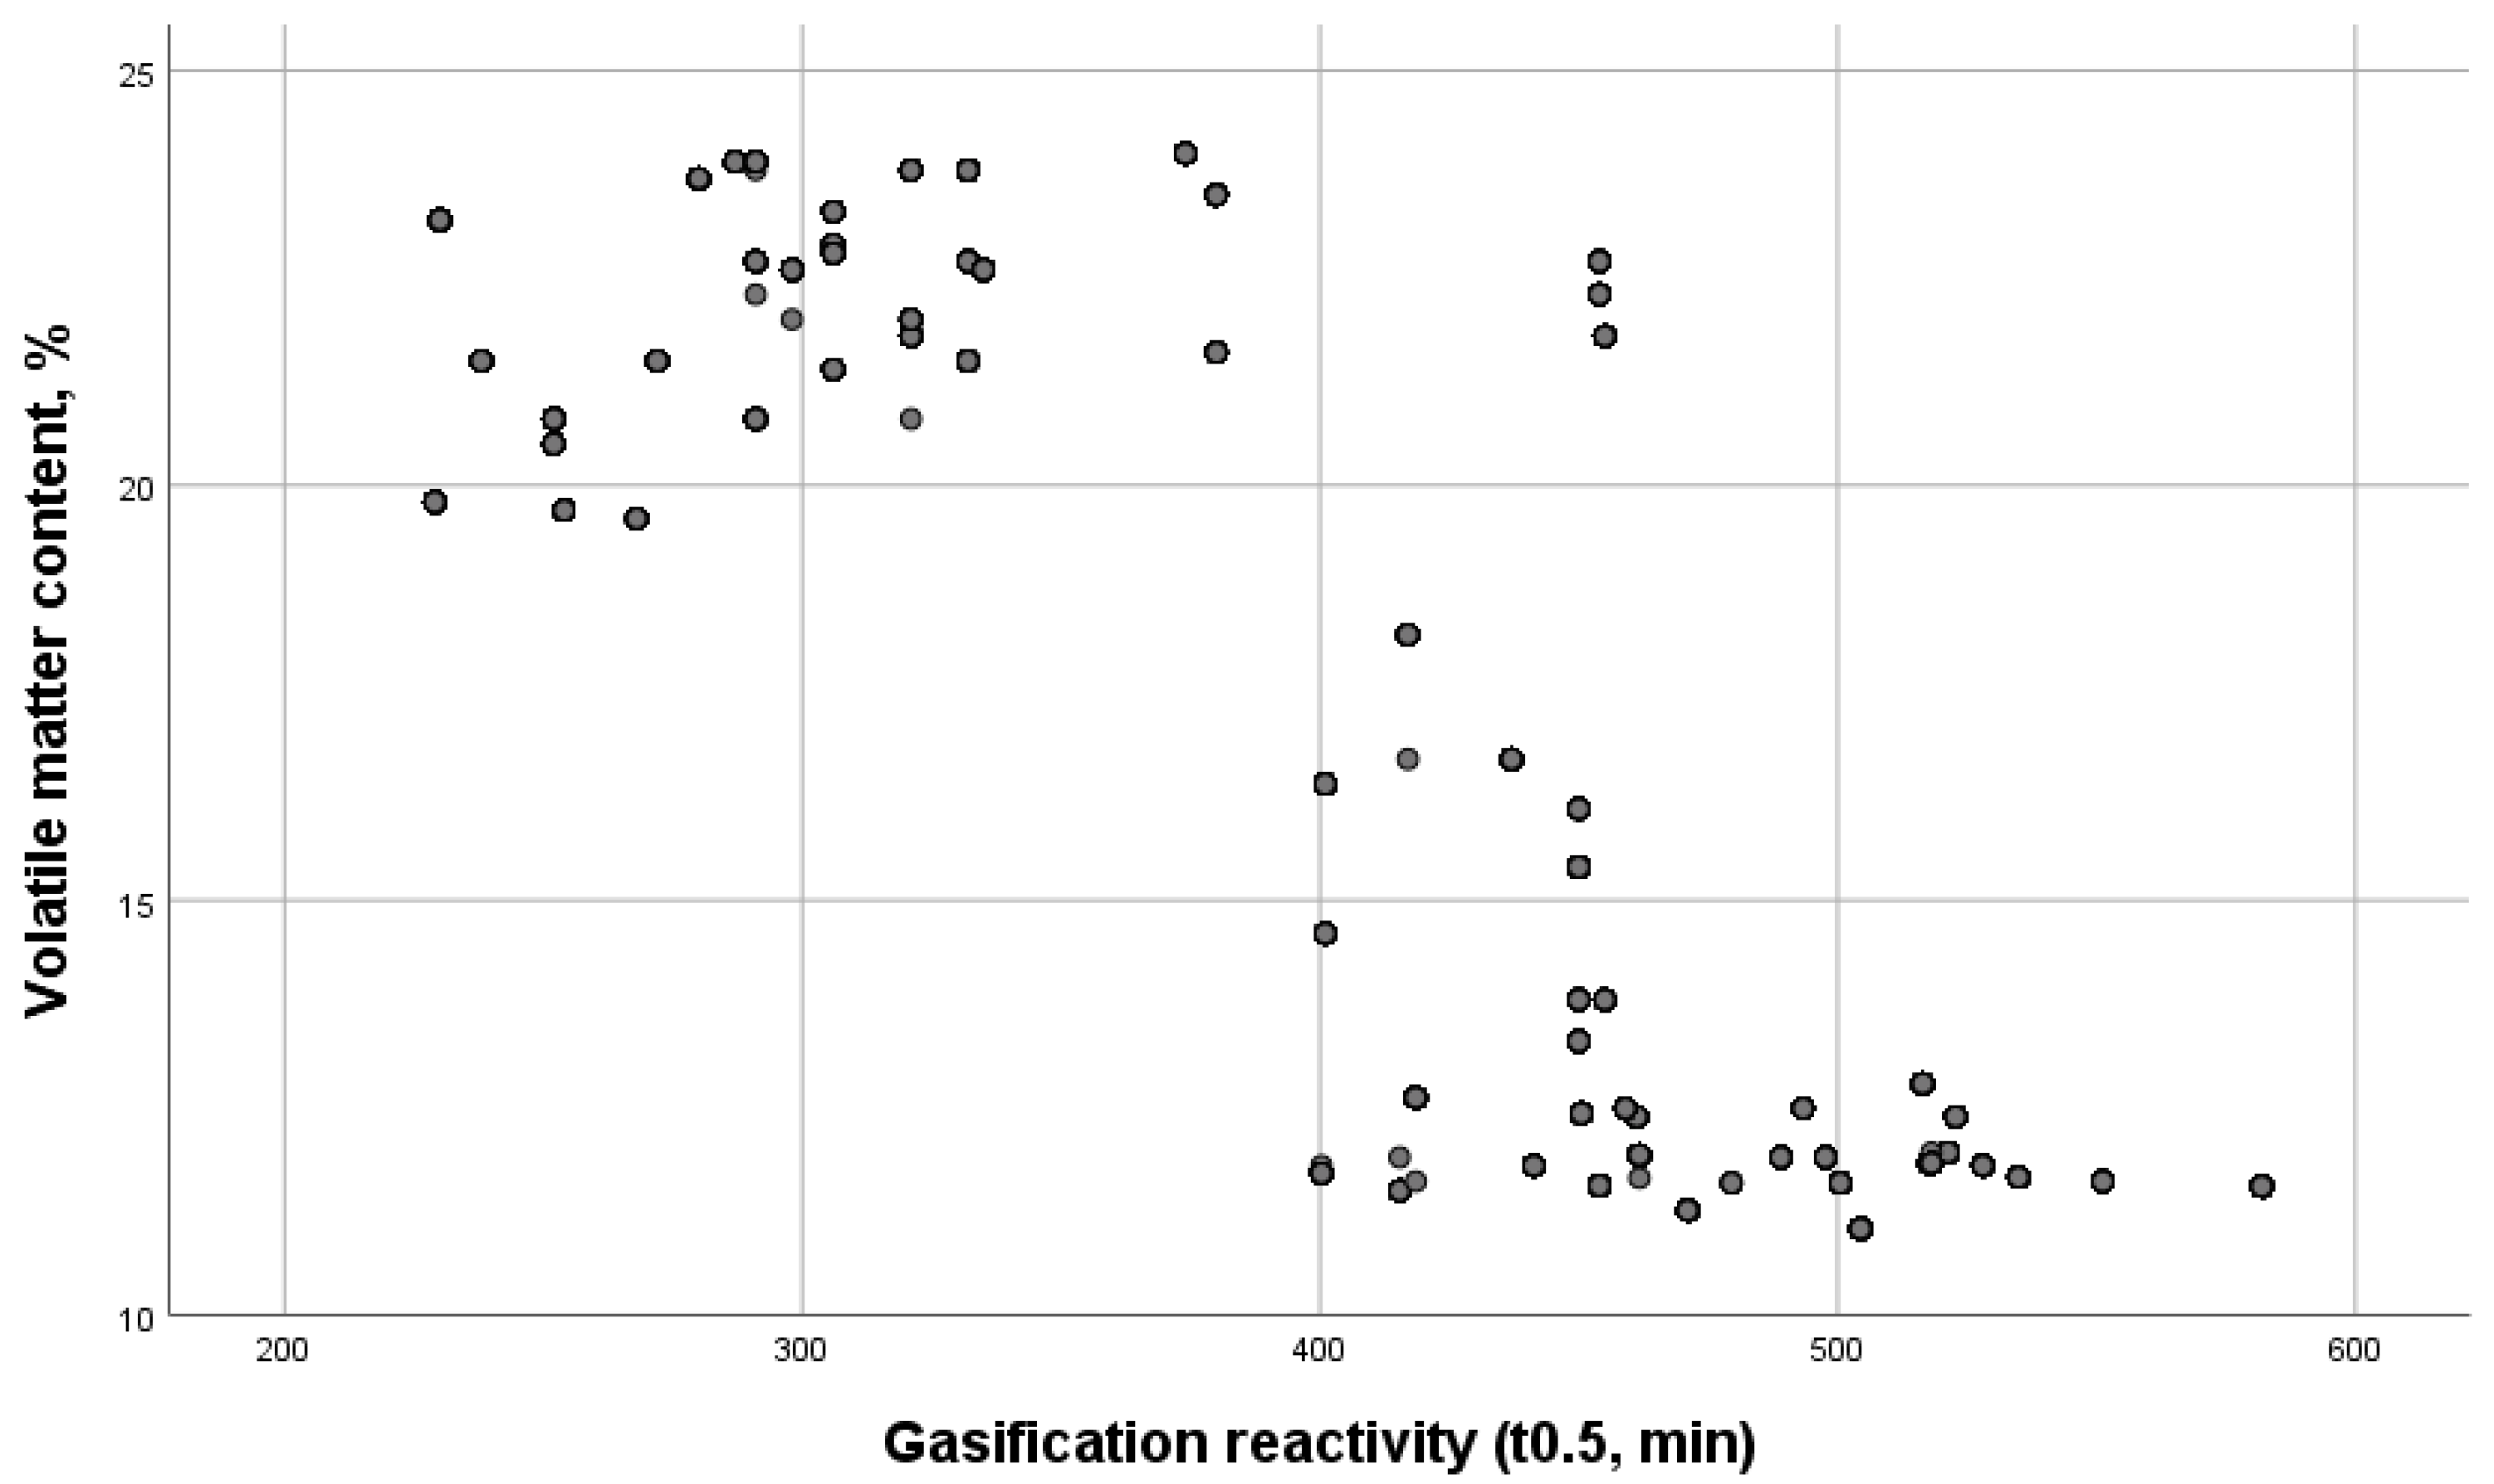
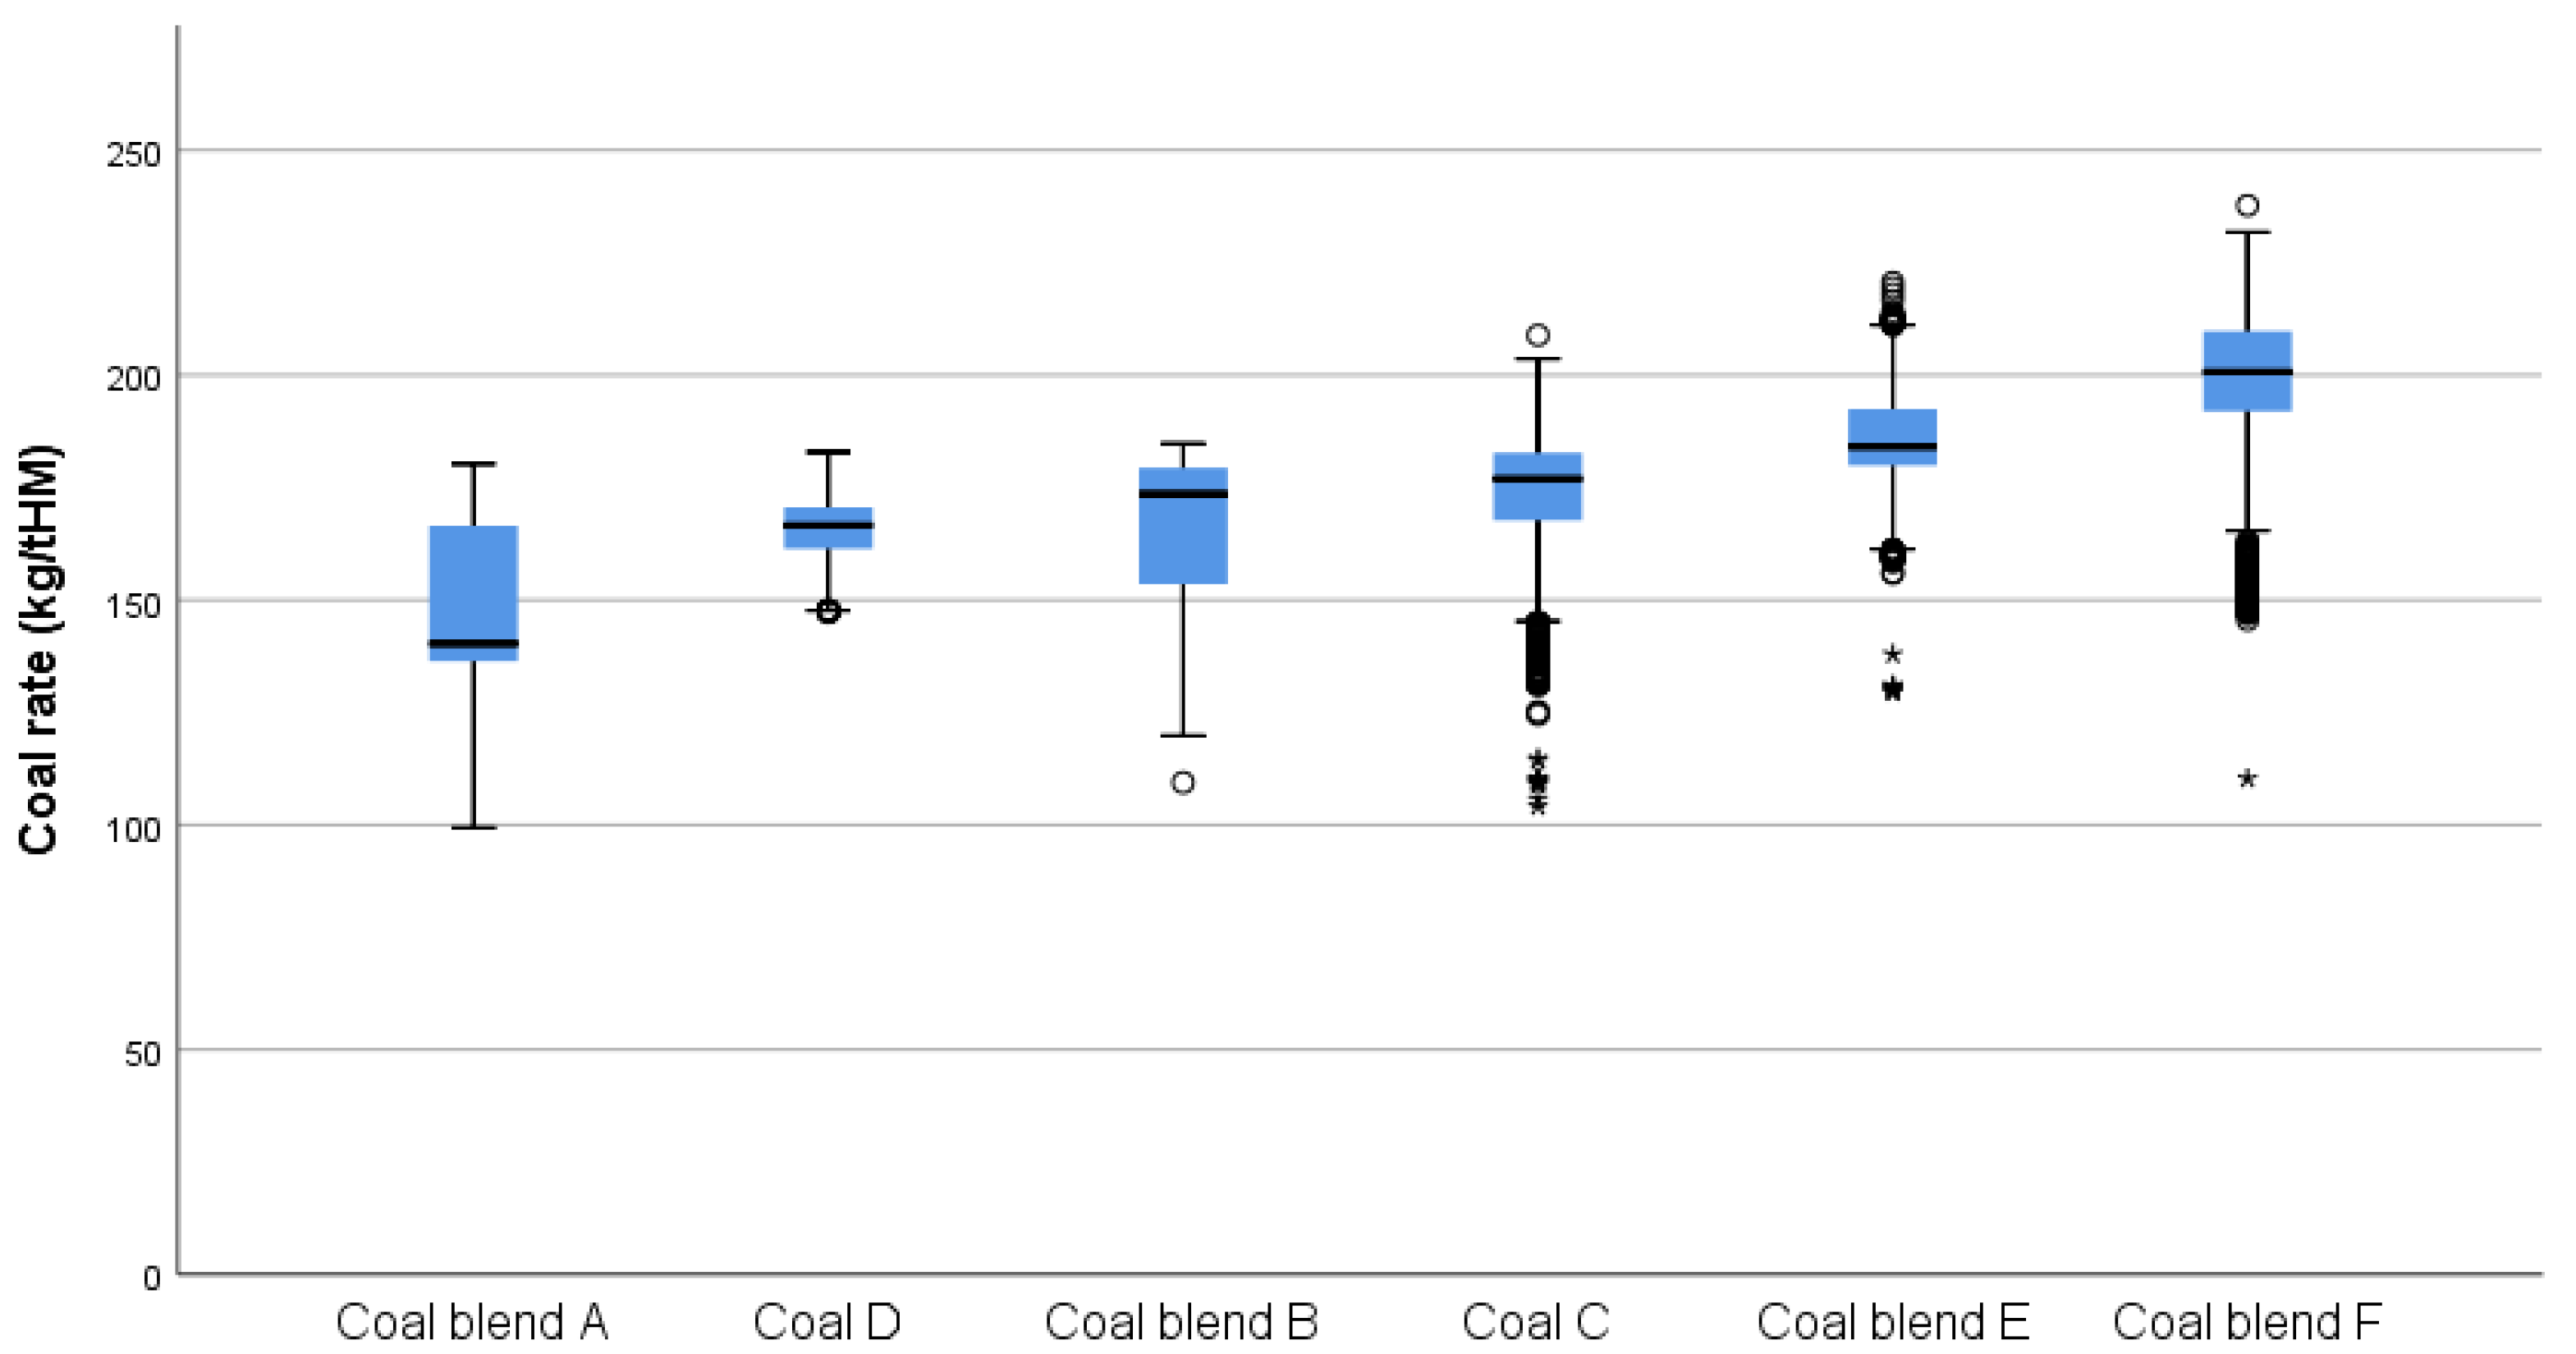
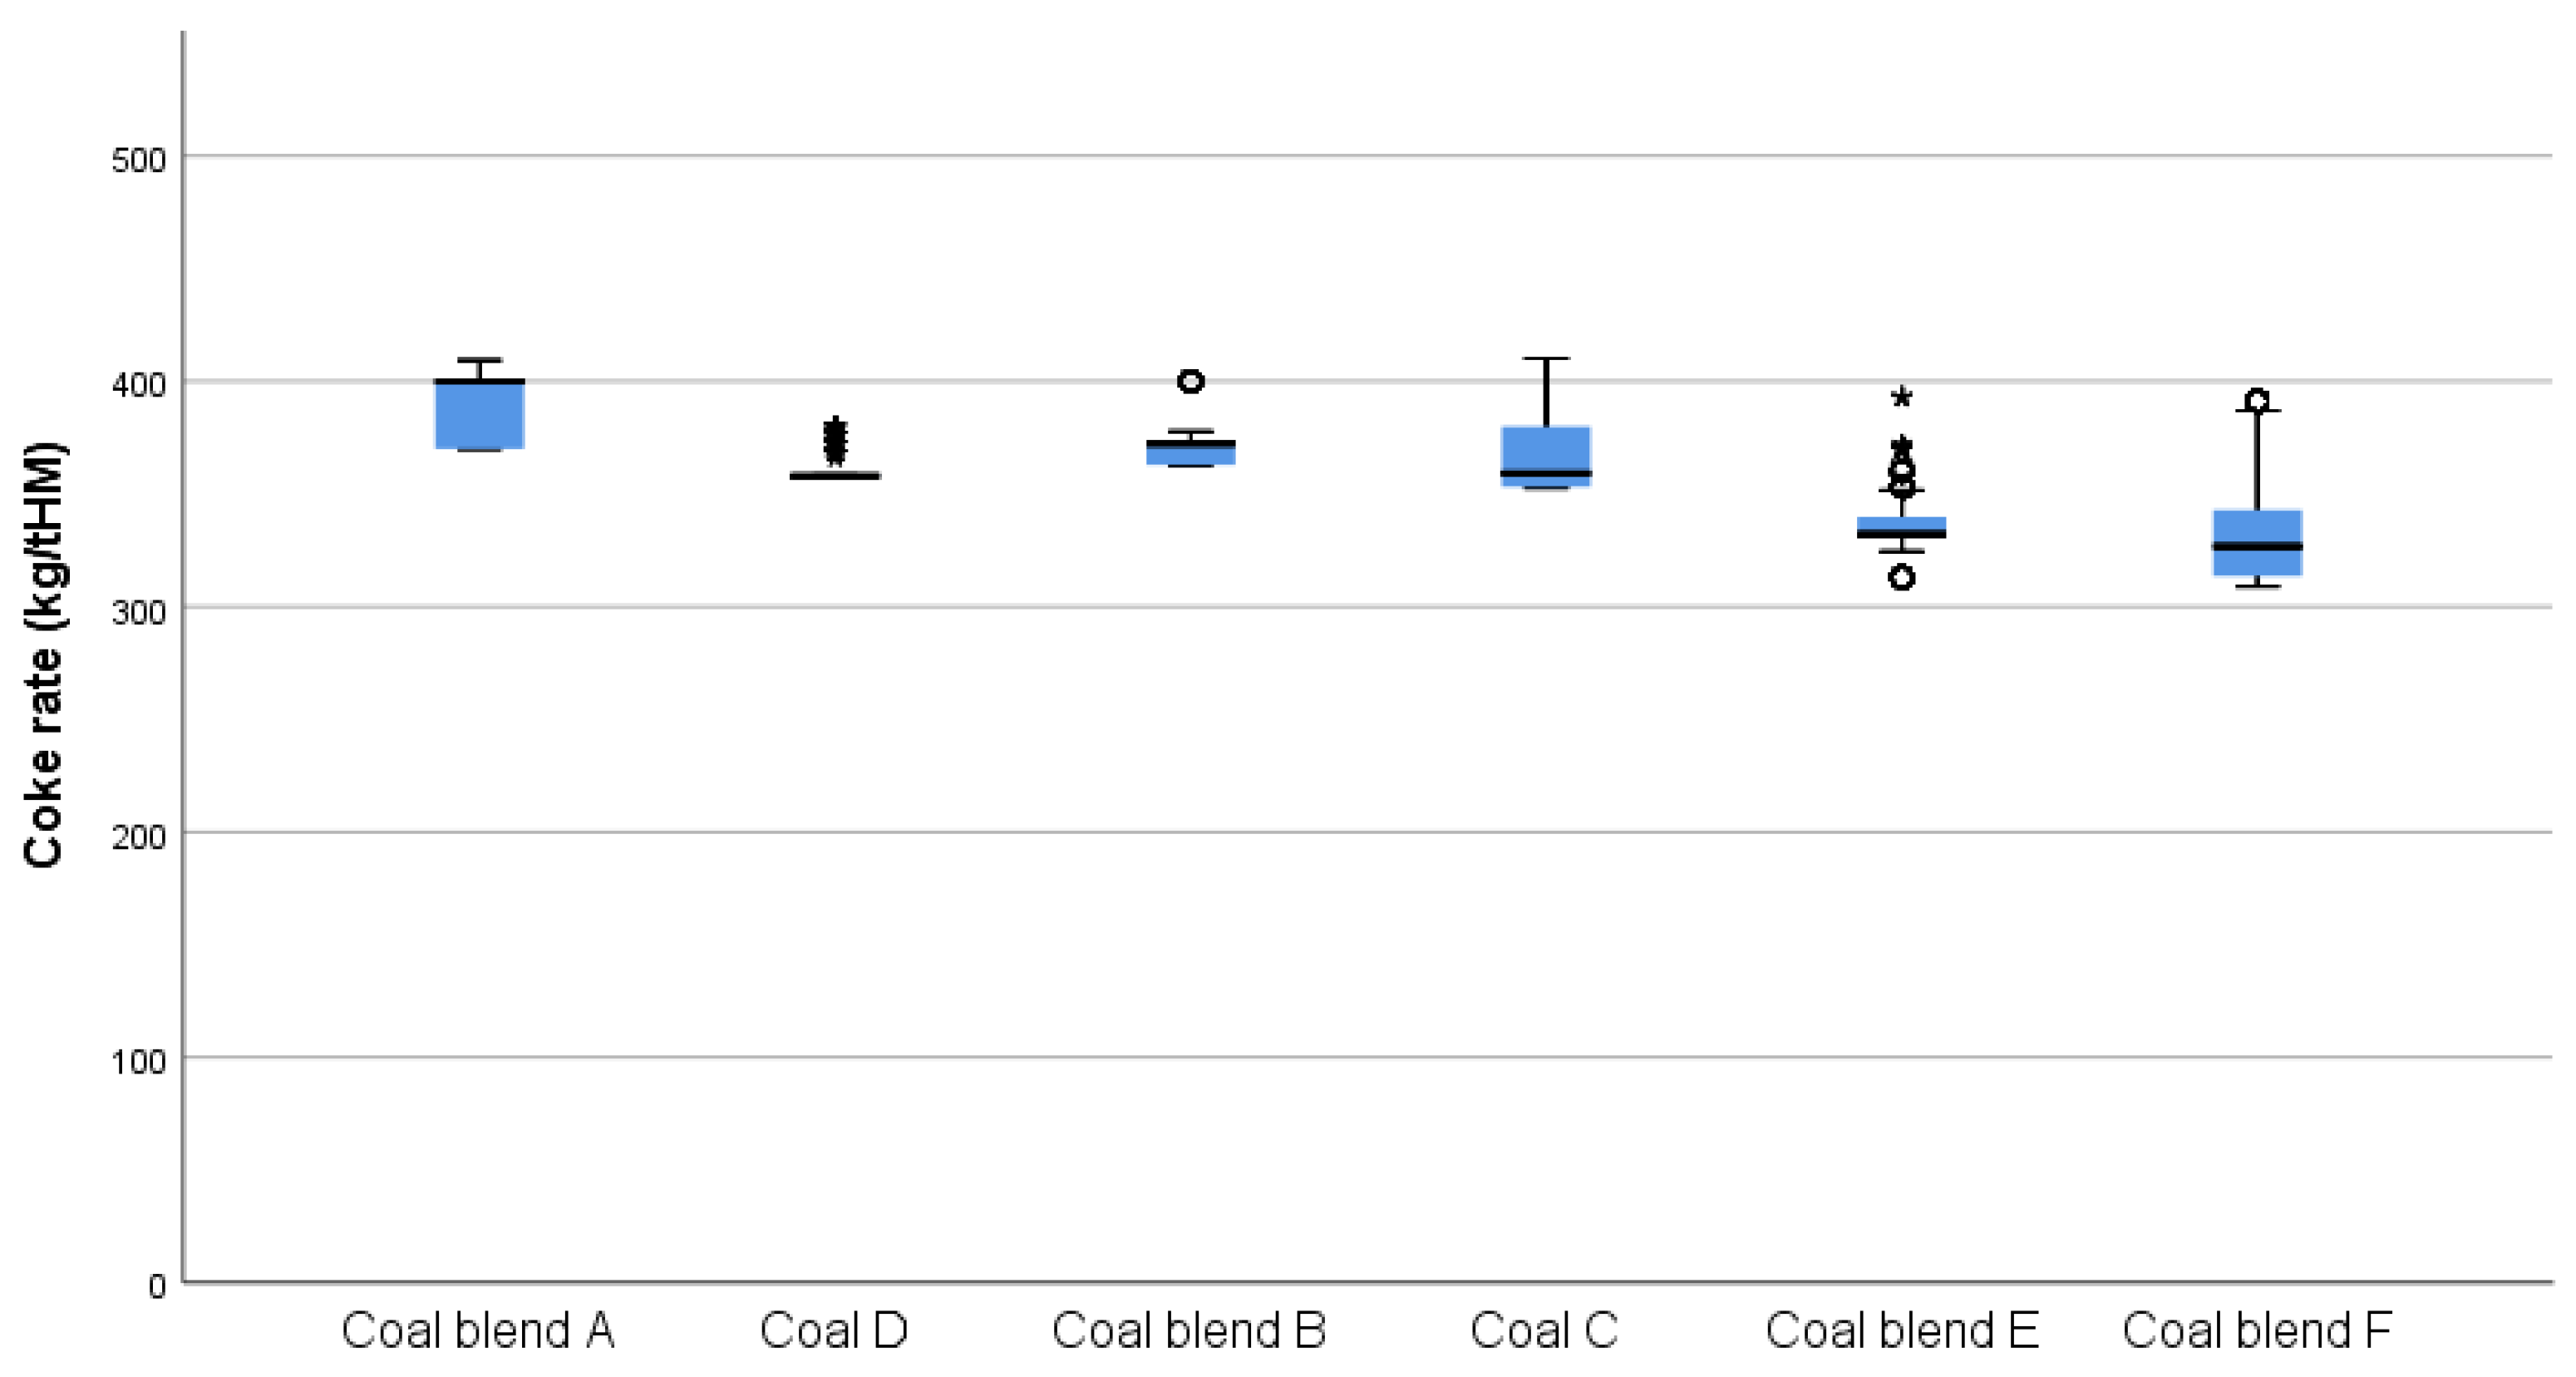
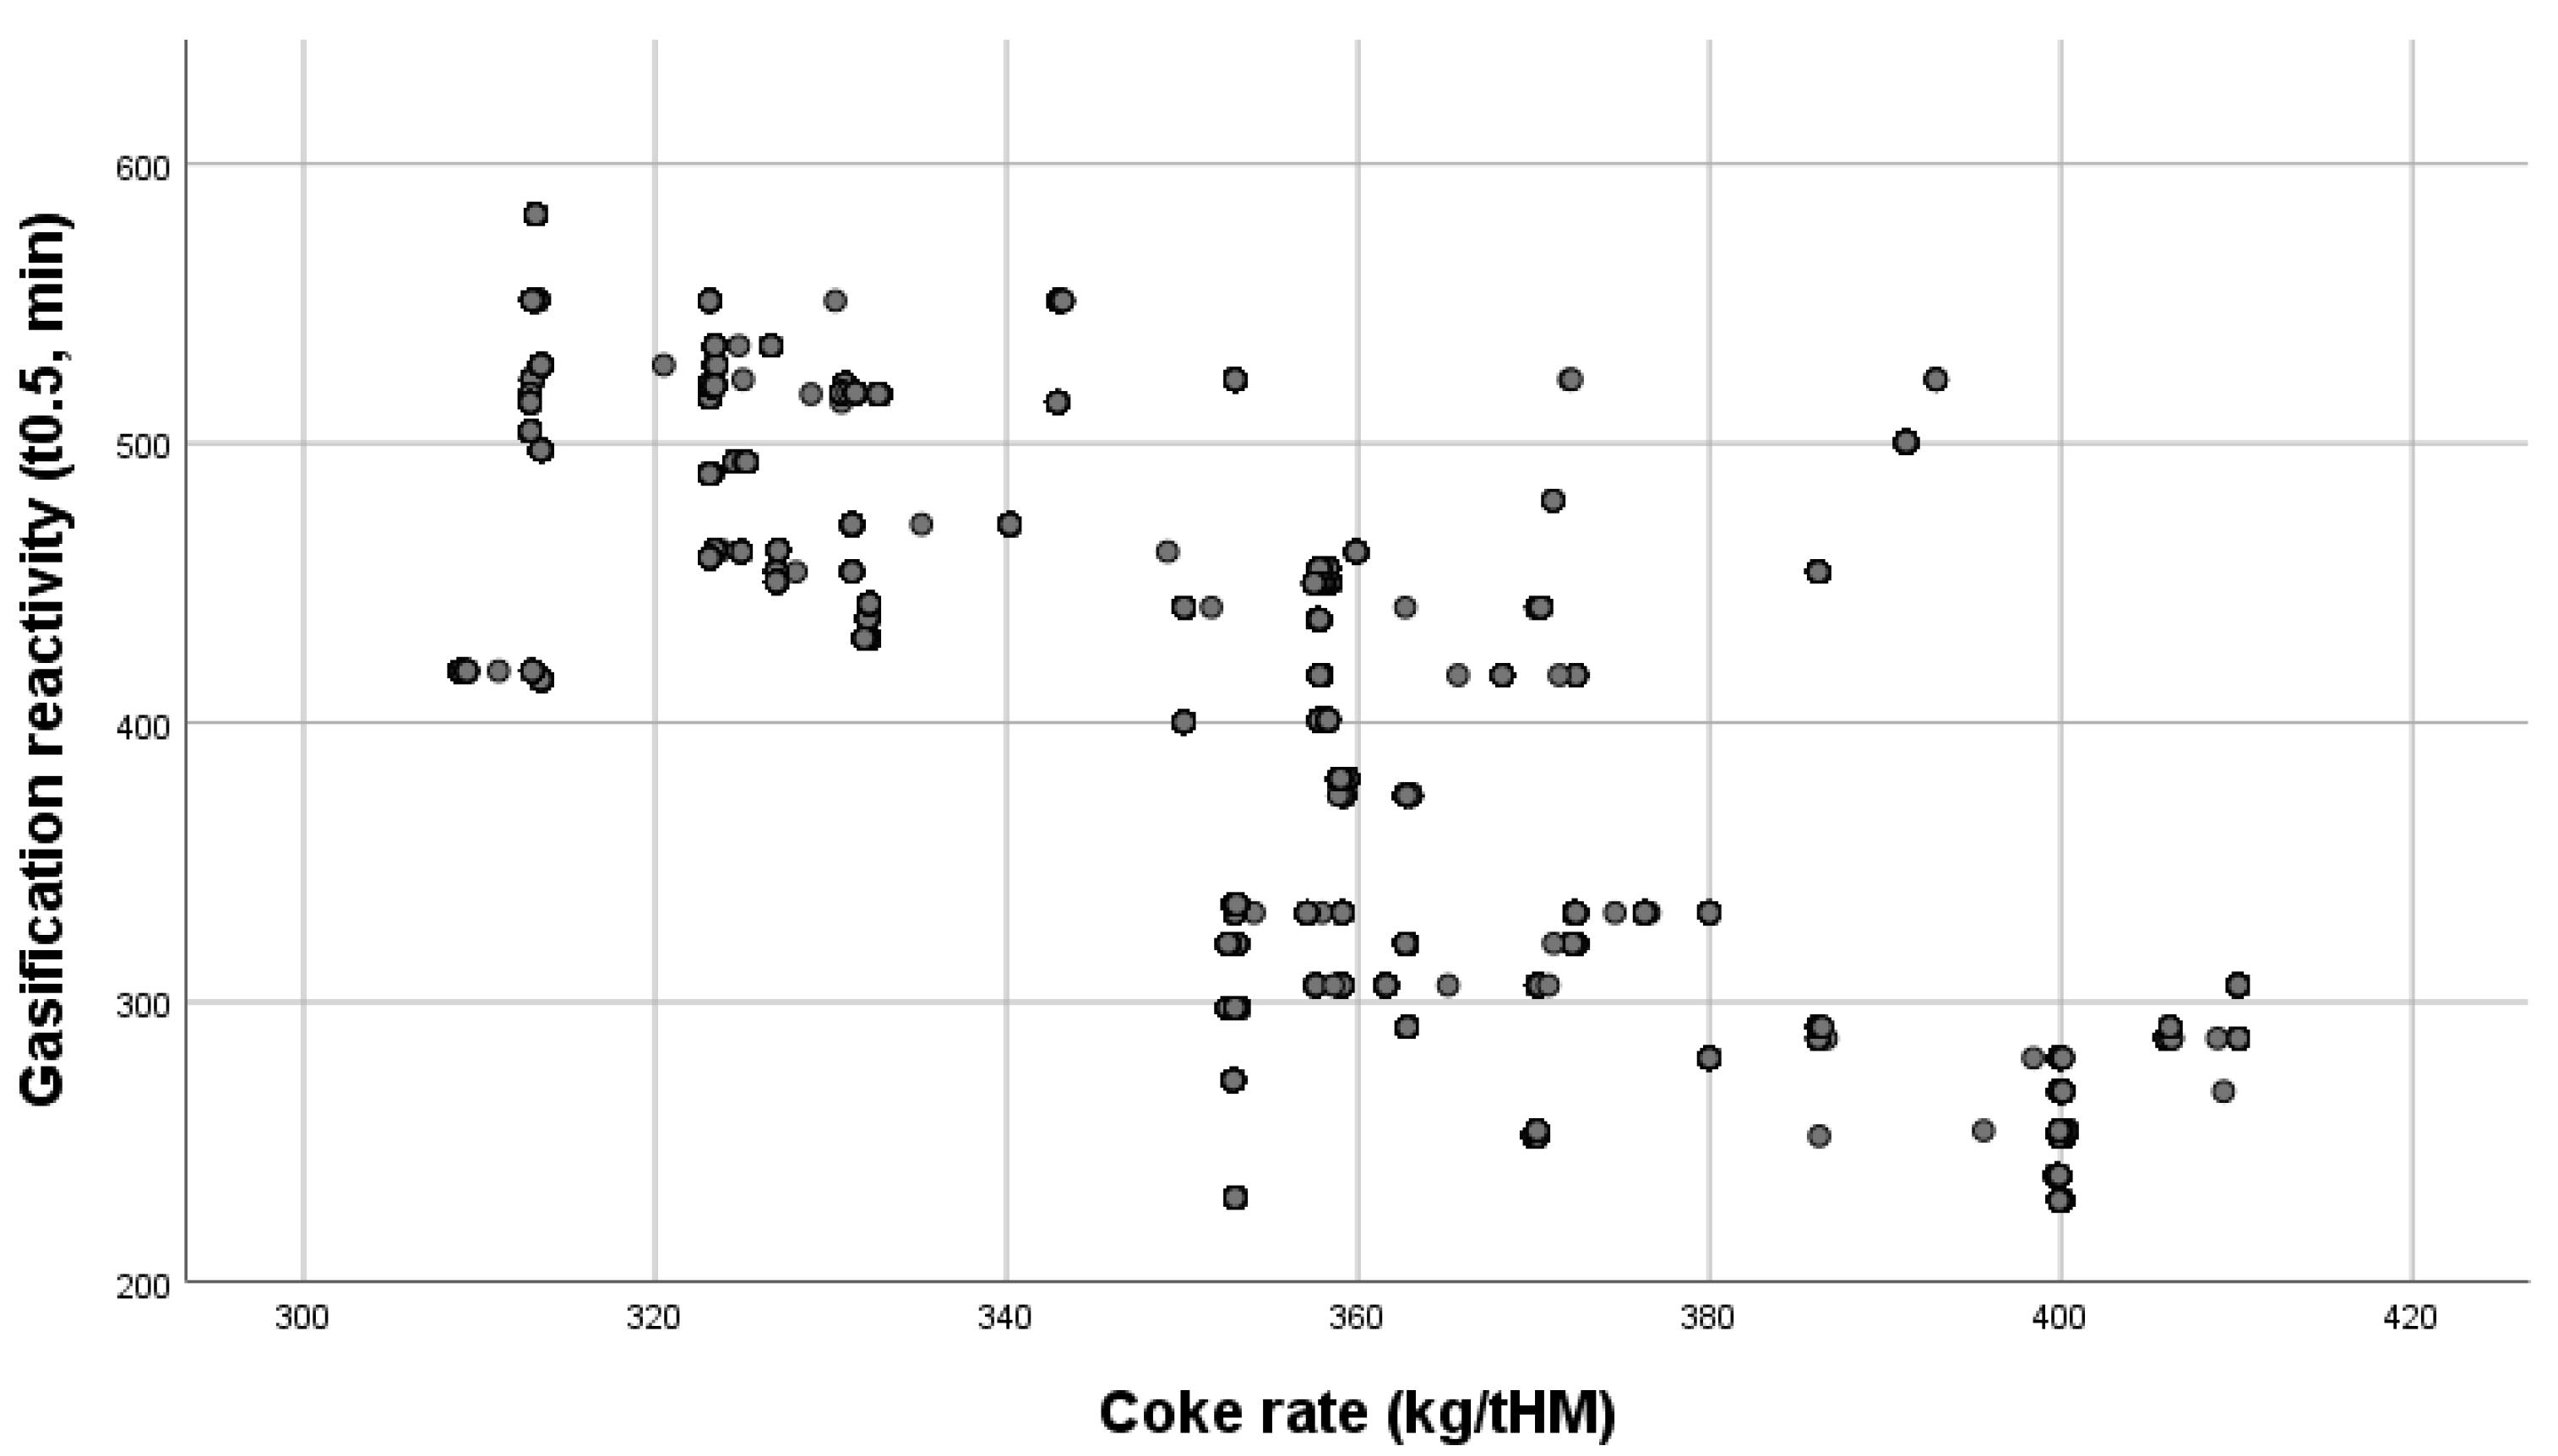
  • Combining the findings of the Spearman’s correlation obtained from the scatter plots (Figure 6, Figure 7 and Figure 8, Table 2), box plots (Figure 12, Figure 13 and Figure 14), and multiple regression models (Figure 16 and Figure 17) indicate that the coal injection rates through the blast furnace were higher for the chars (formed from the production coals tested in the drop tube furnace) with a lower gasification reactivity. Because efficient blast furnace operation aims to maintain consistent reductant additions, increased coal injection rates correspond with decreased coke rates accordingly so that there appears to be a relationship between lower gasification reactivity and lower coke rate.
Because the reverse Boudouard reaction is endothermic, it is thought that char with higher reactivity will consume more thermal energy and potentially reduce the thermal reserve of the blast furnace. This could result in a cooling effect, which could impact the stability of the process and the injection rates of coal obtainable with stable operation. This could be particularly problematic if the char deposition is localised in the furnace leading to blast furnace instabilities in the burden descent, pressure, and temperature variation.
  • Both the box plot (Figure 12) and the multiple regression model (Figure 16) highlighted the importance of the type of coal used in the blast furnace compared to the coal rate. It was hoped that the variation in the laboratory analyses and char burnouts could be used to predict the addition rates; however, a consistent relationship was not observable across all the injection coals, suggesting the possibility of other non-tested variables, insufficient sampling frequency, or possibly sampling or testing inconsistencies.
  • The composite coal samples were taken over a 12 h shift period. Because of this, the plotted results were sometimes stratified on the scatter plots, as the laboratory tests referred to process variability over that production time period. This is a limitation, and more frequent sampling would have been preferable. Ideally, this study would have been carried out on single coal injection; however, coal blends were a limitation, as the practicalities of blending are known to result in variability that would not be accounted for.

Author Contributions

J.S. carried out the laboratory testing, including the drop tube furnace testing and char preparation; data analysis and interpretation; writing; and funding acquisition. R.M. contributed to conceputalisation; project planning; data interpretation; and funding acquisition. M.G. contributed to the project and production planning; coal sampling and acquisition; process data acquisition; production liaison and advice; and funding acquisition. All authors have read and agreed to the published version of the manuscript.

Funding

The authors would like to acknowledge TATA Steel UK in providing financial support and making samples and production data available for this study.

Institutional Review Board Statement

Not applicable.

Informed Consent Statement

Not applicable.

Data Availability Statement

Not applicable.

Conflicts of Interest

The authors declare no conflict of interest.

References

  1. Carpenter, A.M. Use of PCI in Blast Furnaces; IEA Clean Coal Centre: London, UK, 2006. [Google Scholar]
  2. Babich, A. Blast furnace injection for minimizing the coke rate and CO2 emissions. Ironmak. Steelmak. 2021, 48, 728–741. [Google Scholar] [CrossRef]
  3. Hutny, W.; Lee, G.; Price, J. Fundamentals of coal combustion during injection into a blast furnace. Prog. Energy Combust. Sci. 1991, 17, 373–395. [Google Scholar] [CrossRef]
  4. Geerdes, M.; Toxopeus, H.; Van der Vilet, C. Modern Blast Furnace Ironmaking: An Introduction; IOS Press: Amsterdam, The Netherlands, 2009. [Google Scholar]
  5. Ishii, K. Advanced Pulverised Coal Injection and Blast Furnace Operation; Elsevier: Amsterdam, The Netherlands, 2000. [Google Scholar]
  6. Schott, R.; Kuttner, G.; Co, K.G. Optimisation strategies for pulverised coal injection into the blast furnace. In Proceedings of the European Steel Technology and Application Days (METEC & 2nd ESTAD 2015), Düsseldorf, Germany, 15–19 June 2015. [Google Scholar]
  7. Ariyama, T.; Sato, M.; Nouchi, T.; Takahashi, K. Evolution of Blast Furnace Process toward Reductant Flexibility and Carbon Dioxide Mitigation in Steel Works. ISIJ Int. 2016, 56, 1681–1696. [Google Scholar] [CrossRef] [Green Version]
  8. Born, S.; Babich, A.; Van Der Stel, J.; Ho, H.T.; Sert, D.; Ansseau, O.; Plancq, C.; Pierret, J.-C.; Geyer, R.; Senk, D.; et al. Char Formation by Coal Injection and Its Behavior in the Blast Furnace. Steel Res. Int. 2020, 91, 2000038. [Google Scholar] [CrossRef]
  9. Puttinger, S.; Stocker, H. Toward a Better Understanding of Blast Furnace Raceway Block-ages. Steel Res. Int. 2020, 91, 2000227. [Google Scholar] [CrossRef]
  10. Xing, X.; Rogers, H.; Zulli, P.; Hockings, K.; Ostrovski, O. Effect of coal properties on the strength of coke under simulated blast furnace conditions. Fuel 2018, 237, 775–785. [Google Scholar] [CrossRef]
  11. Tiwari, H.P.; Das, A.; Singh, U. Novel technique for assessing the burnout potential of pulverised coals/coal blends for blast furnace injection. Appl. Therm. Eng. 2018, 130, 1279–1289. [Google Scholar] [CrossRef]
  12. Cavaliere, P. Clean Ironmaking and Steelmaking Processes-Efficient Technologies for Green-House Emissions Abatement; Springer: Berlin/Heidelberg, Germany, 2019; ISBN 978-3-030-21208-7. [Google Scholar]
  13. Oliveira, A.; Mahowald, P.; Muller, B.; Kinzel, K.-P.; Oliveira, V. pulverized coal injection for high injection rates. In Proceedings of the 46th Reduction/17th Iron Ore/4th Agglomeration Seminar, Rio de Janeiro, Brazil, 27–29 September 2016. [Google Scholar] [CrossRef] [Green Version]
  14. Bortz, S.; Flament, G. Experiments on pulverized-coal combustion under conditions simulating blast furnace environments. Ironmak. Steelmak. 1982, 10, 222–229. [Google Scholar]
  15. Suzuki, T.; Hirose, R.; Morimoto, K.; Abe, T. Pulverized coal combustion in high temperature furnaces for steelmaking. JSME 1984, 27, 2803–2810. [Google Scholar] [CrossRef] [Green Version]
  16. Zhang, S.F.; Bai, C.G.; Wen, L.Y.; Qiu, G.B.; Lu, X.W. Gas particle flow and combustion charateristics of pulverised coal injection in blast furnace raceway. J. Iron Steel Res. 2010, 17, 8–12. [Google Scholar] [CrossRef]
  17. Du, S.W.; Chen, W.H.; Lucas, J. Pulverised coal burnout in blast furnace simulated by a drop tube furnace. Energy Fuels 2010, 35, 576–581. [Google Scholar]
  18. Li, H.; Elliott, L.; Rogers, H.; Austin, P.; Jin, Y.; Wall, T. Reactivity study of two coal chars produced in a drop tube furnace and a pulverised coal injection rig. Energy Fuels 2012, 26, 4690–4695. [Google Scholar] [CrossRef]
  19. Ballantyne, T.R.; Ashman, P.J.; Mullinger, P.J. A new method for determining the conversion of low-ash coals using synthetic ash as a tracer. Fuel 2005, 84, 1980–1985. [Google Scholar] [CrossRef]
Figure 1. The range of the measured volatile matter contents for oven-dried coals and coal blends used during the study periods (◦ represents outliers).
Metals 11 01476 g001
Figure 2. The ranges of the measured ash contents for the oven-dried coals and coal blends used during the study periods.
Metals 11 01476 g002
Figure 3. The ranges of the measured ash contents for the oven-dried coals and coal blends used during the study periods (◦ represents outliers).
Metals 11 01476 g003
Figure 4. Schematic of drop tube furnace.
Metals 11 01476 g004
Figure 5. Scatter plot of the relationship between oxygen flow and the iron-production rate.
Metals 11 01476 g005
Figure 6. Scatter plot of the relationship between the gasification reactivity of the injectant coal char and the coke rate during blast furnace production.
Metals 11 01476 g006
Figure 7. Scatter plot of the relationship between the injectant coal and the coke rate during blast furnace production.
Metals 11 01476 g007
Figure 8. Scatter plot of the relationship between the gasification reactivity of the injectant coal and the coal injection rate during blast furnace production.
Metals 11 01476 g008
Figure 9. The range of the coal injection rates for each of the coals/coal blends used during the trial period of blast furnace production.
Metals 11 01476 g009
Figure 10. Scatter plot of the DTF burnouts of the injection coals versus their char gasification reactivities.
Metals 11 01476 g010
Figure 11. Scatter plot of the volatile matter content of the injectant coals versus their char gasification reactivities.
Metals 11 01476 g011
Figure 12. Box plots of the range of coal injection rates for each of the coals/coal blends used during blast furnace production (◦ represents outliers and * extreme outliers).
Metals 11 01476 g012
Figure 13. Box plots of the range of coke addition rates for the time periods corresponding to the addition of different coals/coal blends during blast furnace production (◦ = high/low potential outliers and * = high/low extreme values).
Metals 11 01476 g013
Figure 14. Box plots of the range of char gasification reactivity for each of the coals/coal blends used during blast furnace production (◦ = high/low potential outliers and * = high/low extreme values).
Metals 11 01476 g014
Figure 15. Range of coal burnout for each of the coals/coal blends used during observed blast furnace production (◦ = high/low potential outliers).
Metals 11 01476 g015
Figure 16. Relationship between the measured and predicted injection coal rate in the multiple linear regression model.
Metals 11 01476 g016aMetals 11 01476 g016b
Figure 17. Relationship between the measured and predicted coke rate in the multiple linear regression model.
Metals 11 01476 g017aMetals 11 01476 g017b
Table 1. Process variables and measurements.
PI VariableDescription
DateBoth date and time (average of 5 min responses)
DustBlast furnace slurry mass (tonnes)
VolatilesCoal volatile matter content (%)
AshAsh matter content (%)
SulphurSulphur content of coal (%)
Less125mcnCoal particle-size distribution less than 125 µm (%)
BurnoutCoal sample burnout in a drop tube furnace (%)
GasificationGasification reactivity time to achieve 50% conversion (t0.5, min)
SiliconSilicon content in metal (%)
O2enrichmentOxygen enrichment of hot air blast (%)
O2 flowOxygen flow rate (Nm3/h)
ProdrateIron production rate, tonnes of hot metal per hour (tHM/hr)
CoalCoal or coal blend type
CokerateAddition rate of coke (kg/tHM)
CoalrateAddition rate of coal (kg/tHM)
TotRedtTotal addition rate of coke and coal (kg/tHM)
BlastPressureHot air blast pressure (bar)
TopPressurePressure at the top of the furnace (bar)
DeltaPressureDifference in pressure between top and bottom of furnace (bar)
FlametempCalculated adiabatic flame temperature (°C)
HeatGainHeat balance at the furnace walls
CO2CO2 in top gas exiting the furnace (%, vol)
COCO in top gas exiting the furnace (%, vol)
H2H2 in top gas exiting the furnace (%, vol)
N2N2 in top gas exiting the furnace (%, vol)
TotalVolTotal gas volume rate (Nm3/h)
MaxDiffPressure difference between top/bottom of blast furnace (bar)
TopPressSetpointTop pressure setpoint (bar)
DistributionA number assigned to the pattern of burden addition
TopTempTemperature of gas exiting the top of the furnace (°C)
BlastVolume rate of hot blast (Nm3/h)
CarbonCarbon in metal (%)
Table 2. Spearman’s correlations of variables and measurements.
Dependent VariableIndependent VariableNumber of Data PointsCorrelation CoefficientDependent VariableIndependent VariableNumber of Data PointsCorrelation Coefficient
GasificationVolatile matter10856−0.668 **Production rateOxygen flow177730.819
Sulphur<125 µm particles47080.669 **Production rateBlast pressure177730.800
BurnoutSulphur77870.669 **Production rateTop pressure177730.833
Burnout<125 µm particles41790.673 **Production rateTotal volume177730.903
BurnoutGasification11642−0.643 **Production rateBlast volume177730.844
GasificationCoke rate11915−0.685 **Coke rateCoal rate177730.842
GasificationCoal rate119150.600 **Coke rateCarbon dioxide17773−0.842
Oxygen enrichmentOxygen flow177730.730Coal rateHydrogen17773−0.818
Oxygen enrichmentNitrogen17773−0.636 **Coal rateNitrogen17773−0.805
Oxygen flowBlast pressure177730.713Blast pressureTop pressure177730.893
Oxygen flowTop pressure177730.641Blast pressureTotal volume177730.883
Oxygen flowTotal gas volume177730.701Blast pressureBlast volume177730.853
Oxygen flowNitrogen177730.668 **Top pressureTotal volume177730.865
Coal rateCarbon dioxide177730.693 **Top pressureBlast volume177730.862
Carbon dioxideNitrogen17773−0.690 **Total gas volumeBlast volume177730.966
HydrogenNitrogen17773−0.750 **----
Note: ** means significant at the 0.01 level (99%).
Publisher’s Note: MDPI stays neutral with regard to jurisdictional claims in published maps and institutional affiliations.

