Abstract
AlCoCrFeNiZrx (x = 0, 0.1, 0.2, 0.3, and 0.5) high-entropy alloys (HEAs) were prepared by a non-consumable vacuum arc melting technology, and the microstructure and corrosion behavior were investigated by XRD, SEM, immersion tests, and electrochemical measurements. The results indicate that galvanic corrosion of the AlCoCrFeNiZrx alloys occurred in 0.5 M H2SO4 solution, and only 0.1 mol of the added Zr could greatly improve the corrosion resistance of the alloys. The corrosion properties of the AlCoCrFeNiZrx HEAs had similar change tendencies with the increase in the Zr content in the immersion tests, potentiodynamic polarization measurements, and electrochemical impedance analysis, that is, the corrosion resistance of the AlCoCrFeNiZrx alloys in a 0.5 M H2SO4 solution first increased and then decreased with the increase in the Zr content. The Zr0.1 alloys were found to have the best selective corrosion and general corrosion resistance with the smallest corrosion rate, whereas the Zr0.3 alloys presented the worst selective corrosion and general corrosion resistance with the highest corrosion rate from both the immersion tests and the potentiodynamic polarization measurements.
1. Introduction
Due to their excellent functional and mechanical properties as well as being highly promising candidates for industrial applications [1,2,3,4], high-entropy alloys (HEAs) or multi-principal element alloys (MPEAs) have caused widespread attention in the materials science and engineering fields. HEAs or MPEAs were first defined as alloys composed of five or more principal elements in equimolar ratios and with simple average crystal structures such as face-centered cubic (FCC), body-centered cubic (BCC), and CsCl; then, the definition was expanded to alloys in which the principal elements each had a concentration of 5–35 at. %, and the alloys could also contain minor elements in concentrations below 5 at. % [1,2,3,4]. Many researchers have contributed their efforts to understanding the fabrication, composition, microstructure, and properties of more than 400 HEAs to date [5,6,7,8,9,10,11,12], where the CoCrFeNi system HEAs have been heavily researched, and many studies in the literature have focused on improving the corrosion resistance of CoCrFeNi system HEAs through the addition of other alloy elements, such as Al, Mn, Mo, Cu, and Ti [13,14,15,16,17,18,19,20,21,22,23,24,25,26,27,28,29]. Kao et al. [14] investigated the electrochemical passive properties of AlxCoCrFeNi alloys by potentiodynamic polarization, electrochemical impedance spectroscopy (EIS), and weight loss tests, indicating that a higher amount of Al in AlxCoCrFeNi alloys was harmful to the corrosion resistance in a 0.5 M H2SO4 solution at temperatures exceeding 27 °C; similar results for the Al content were obtained by Lee et al. regarding the corrosion behavior of AlxCrFe1.5MnNi0.5 alloys in aqueous environments, where an increased proportion of Al resulted in a higher general corrosion susceptibility of the alloys in a 0.5 M H2SO4 solution, and the pitting potentials of Al0.5CrFe1.5MnNi0.5 HEAs were significantly lower than those of Al-free CrFe1.5MnNi0.5 HEAs in a 1 M NaCl solution [15]. The corrosion behavior of the CoCrFeMnNi family HEAs was evaluated in a CO2-containing 3.5 wt % NaCl solution at pH 4 and 40 °C by electrochemical and immersion methods, revealing that CoFeMnNi HEAs underwent metal dissolution and exhibited the highest corrosion rate during immersion experiments, as well as undergoing general corrosion, while the rest of the HEAs and stainless steel 316 L underwent pitting corrosion after potentiodynamic polarization measurements [20]. Furthermore, a study of the corrosion behavior of an equiatomic CoCrFeMnNi high-entropy alloy compared with 304 stainless steel in 0.1 M H2SO4 solution was conducted by Luo et al., where the low content of Cr and the mixed Fe, Cr, and Ni hydroxides in the passive film were mainly responsible for the lower anti-corrosion performance of the HEA than that of the 304 stainless steel [21]. Chou et al. [24] found that Co1.5CrFeNi1.5Ti0.5 HEAs had superior resistance to general corrosion in a 0.5 M H2SO4 solution but were more susceptible to pitting corrosion in a deaerated 1 M NaCl solution than Co1.5CrFeNi1.5Ti0.5Mox (x = 0.1, 0.5, 0.8) HEAs. Additionally, the authors concluded that Mo additions decreased the corrosion resistance of the alloys in a 1 M NaOH solution [24]. Cui et al. [25] also confirmed that because they were easily being passivated, the directionally solidified FeCoNiCrCu HEAs were more corrosion-resistant than the as-cast FeCoNiCrCu HEAs in a 3.5 at. % NaCl solution. Moreover, the effects of Ti on the microstructure and properties of CoCrFeNi system HEAs also attracted much attention, and some researchers confirmed that a certain amount of Ti additions not only changed the microstructure of Al2-xCoCrFeNiTix, AlxCoCrFeNiTiy HEAs, and FeCoCrAlNiTix HEAs coatings but also enhanced their mechanical properties and corrosion resistance in aqueous environments [17,18,19].
Zr and Ti elements have some similar physical characteristics such as the same crystal structure (HCP), a high melting temperature, and good corrosion resistance, and Zr has a firm tendency to form its own very stable compounds in either a stainless steel [30] or a high-entropy alloy [31]. In previous work [32], the microstructure and mechanical properties of AlCoCrFeNiZrx alloys (x = 0, 0.1, 0.2, 0.3, and 0.5) were studied, and it was found that a minor Zr addition was able to significantly change the microstructures and enhance the mechanical properties of AlCoCrFeNiZrx alloys. However, few researchers have reported the effect of the Zr content on the corrosion properties of CoCrFeNi system alloys. Therefore, immersion and electrical polarization experiments of AlCoCrFeNiZrx alloys in a 0.5 M H2SO4 solution were conducted to comprehensively understand the influence of the Zr content on the corrosion properties of these alloys.
2. Materials and Methods
The AlCoCrFeNiZrx (x = 0, 0.1, 0.2, 0.3, and 0.5) alloy ingots were prepared by non-consumable arc melting technology from a mixture of highly pure Al, Co, Cr, Fe, Ni, and Zr (more than 99.9 wt %). This HEA is a six-component alloy with 1 mol each of Al, Co, Cr, Fe, and Ni and between 0 and 0.5 mol of the added Zr. The alloys with different Zr contents are denoted as Zr0, Zr0.1, Zr0.2, Zr0.3, and Zr0.5. The alloy ingots were then remelted at least five times for homogeneity. Table 1 presents the chemical compositions in weight percent (wt %), the densities, D (in g/cm3), and the equivalent weights, EWs, of the alloys. The EWs are defined by the formula presented in Equation (3).

Table 1.
Chemical composition, density (D), and equivalent weight (EW) of as-cast AlCoCrFeNiZrx alloys.
The samples were taken from the as-cast ingots. After mechanical polishing, the microstructure was characterized by both an FEI Quanta-400F scanning electron microscope—SEM (FEI Electron Optics International B.V., Eindhoven, The Netherlands) operating in the backscatter electron (BSE) mode and a Nikon EPIPHOT 300 optical metalloscope—OM (Nikon Corp., Tokyo, Japan). The chemical compositions were analyzed by using an Oxford Inca X-Max—EDS (Oxford Instruments plc, Oxford, UK), and the crystal structure was characterized by using a LabX XRD-6000 XRD (Shimadzu Corp., Kyoto, Japan), with the 2θ ranging from 20° to 100° at a speed of 0.2°/min.
After being taken from the as-cast ingots, the specimens for the immersion tests were machined into 5 mm× 5 mm× 5 mm bulks by wire electrode cutting, then mechanically ground following the standard metallographic procedure with a series of 240–1200 SiC grit papers, and finally cleaned with acetone and distilled water. Immersion tests were conducted in a 0.5 M H2SO4 solution at 25 °C for 192 h, and the specimens were weighed by an electronic analytic balance with a precision of 0.1 mg at 48 h intervals after being ultrasonically cleaned in alcohol, acetone, and distilled water in sequence and then dried in an electric drying chamber for 2 h. The average corrosion rate, CR (in mm/year), of the specimen was calculated according to the following equation [33]:
where K is the constant with a value of 8.76 × 10⁴; W (in g) is the total weight loss after the exposure time; t (in hours) is the immersion duration; A is the surface area of the specimen in cm2; and D is the density of the test alloy in g/cm3. The measured densities, D, of the alloys denoted from Zr0 to Zr0.5 are listed in Table 1. The surface morphologies of the corroded specimens after being ultrasonically cleaned in acetone were investigated by SEM.
CR (mm/year) = (K × W)/(t × A× D)
The measurements of the electrochemical polarization and electrochemical impedance spectroscopy (EIS) were conducted in a 0.5 M H2SO4 solution at room temperature with a PARSTAT 2273 Electrochemical Workstation (Princeton Applied Research, AMETEK, Oak Ridge, TN, USA) equipped with a typical three-electrode cell setup consisting of a specimen as the working electrode, a saturated calomel (SCE) as the reference electrode, and a platinum sheet as the counter electrode. All the potentials in this work were presented on the standard hydrogen scale (SHE). Before every measurement, the test solution was deaerated by bubbling purified nitrogen gas for 1 h to eliminate the effect of the dissolved oxygen, and then the open current potential (OCP) was recorded for 15 min to yield a state potential. The potentiodynamic polarization curves and EIS were plotted after the specimen was freely corroded for about 30 min to reach a quasi-stationary OCP value. Then, the specimen was cathodically polarized to a potential of −0.2 V for 5 min to reduce the possible existing surface oxides. The potentiodynamic tests were performed at a scan rate of 10 mV/s from an initial potential of −1 to a final potential of 1.5 V versus the OCP. EIS was performed at the OCP with a sinusoidal potential amplitude of 10 mV, running from 100 kHz to 100 mHz. Calibration was conducted in accordance with ASTM standards G5 [34] and G59 [35]. The corrosion rates, KR (in mm/year), obtained from the electrochemical polarization measurements were calculated by [36]
where Icorr is the corrosion current density in μA/cm2, D is the density of the test alloy in g/cm3 mentioned in Equation (1) (the measured densities, D, of the alloys denoted from Zr0 to Zr0.5 are listed in Table 1), and EW is the equivalent weight of the alloy that is defined as follows [36]:
where fi, ni, and ai are the mass fraction, electrons exchanged, and atomic weight of the ith alloying element, respectively. The EWs for the alloys denoted from Zr0 to Zr0.5 are also listed in Table 1.
KR (mm/year) = (3.27 × 10⁻³ × Icorr × EW)/D
In addition, an equivalent circuit was used to fit the experimental Nyquist curves of the AlCoCrFeNiZrx (x = 0, 0.1, 0.2, 0.3, and 0.5) alloys in a 0.5 M H2SO4 solution at room temperature with ZSimpWin commercial software (Version 3.3, Princeton Applied Research, AMETEK, Oak Ridge, TN, USA).
3. Results and Discussion
3.1. Immersion Measurements
The volume loss and the corrosion rates (CR) (computed by Equation (1)) of the as-cast AlCoCrFeNiZrx alloys in 0.5 M H2SO4 solution for the 0–192 h immersion tests at 25 °C are shown in Figure 1. It can be seen from Figure 1 that the volume loss of the as-cast AlCoCrFeNiZrx alloys increased with the immersion time (Figure 1a), whereas the corrosion rate of the alloys first quickly increased and then slowly decreased with the immersion time (Figure 1b). Among the alloys, the Zr0.3 alloys presented the maximum volume loss and the highest corrosion rate, and the Zr0.1 alloy presented the minimum volume loss and the lowest corrosion rate, which means the Zr0.3 and Zr0.1 alloys had the worst and the best corrosion resistances, respectively, at the same immersion time (Figure 1b). Moreover, the average corrosion rates of the Zr0.1, Zr0.2, and Zr0.5 alloys (especially the Zr0.1 alloys) were significantly lower than those of the Zr0 alloys. Therefore, only a certain amount of Zr addition had a positive effect on the corrosion resistance of the AlCoCrFeNi alloys.
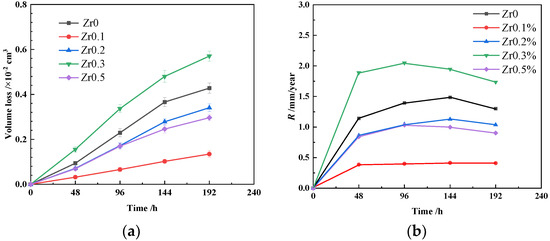
Figure 1.
Volume loss (a) and the average corrosion rates (b) of as-cast AlCoCrFeNiZrx alloys in a 0.5 M H2SO4 solution for the 0–192 h immersion tests at 25 °C.
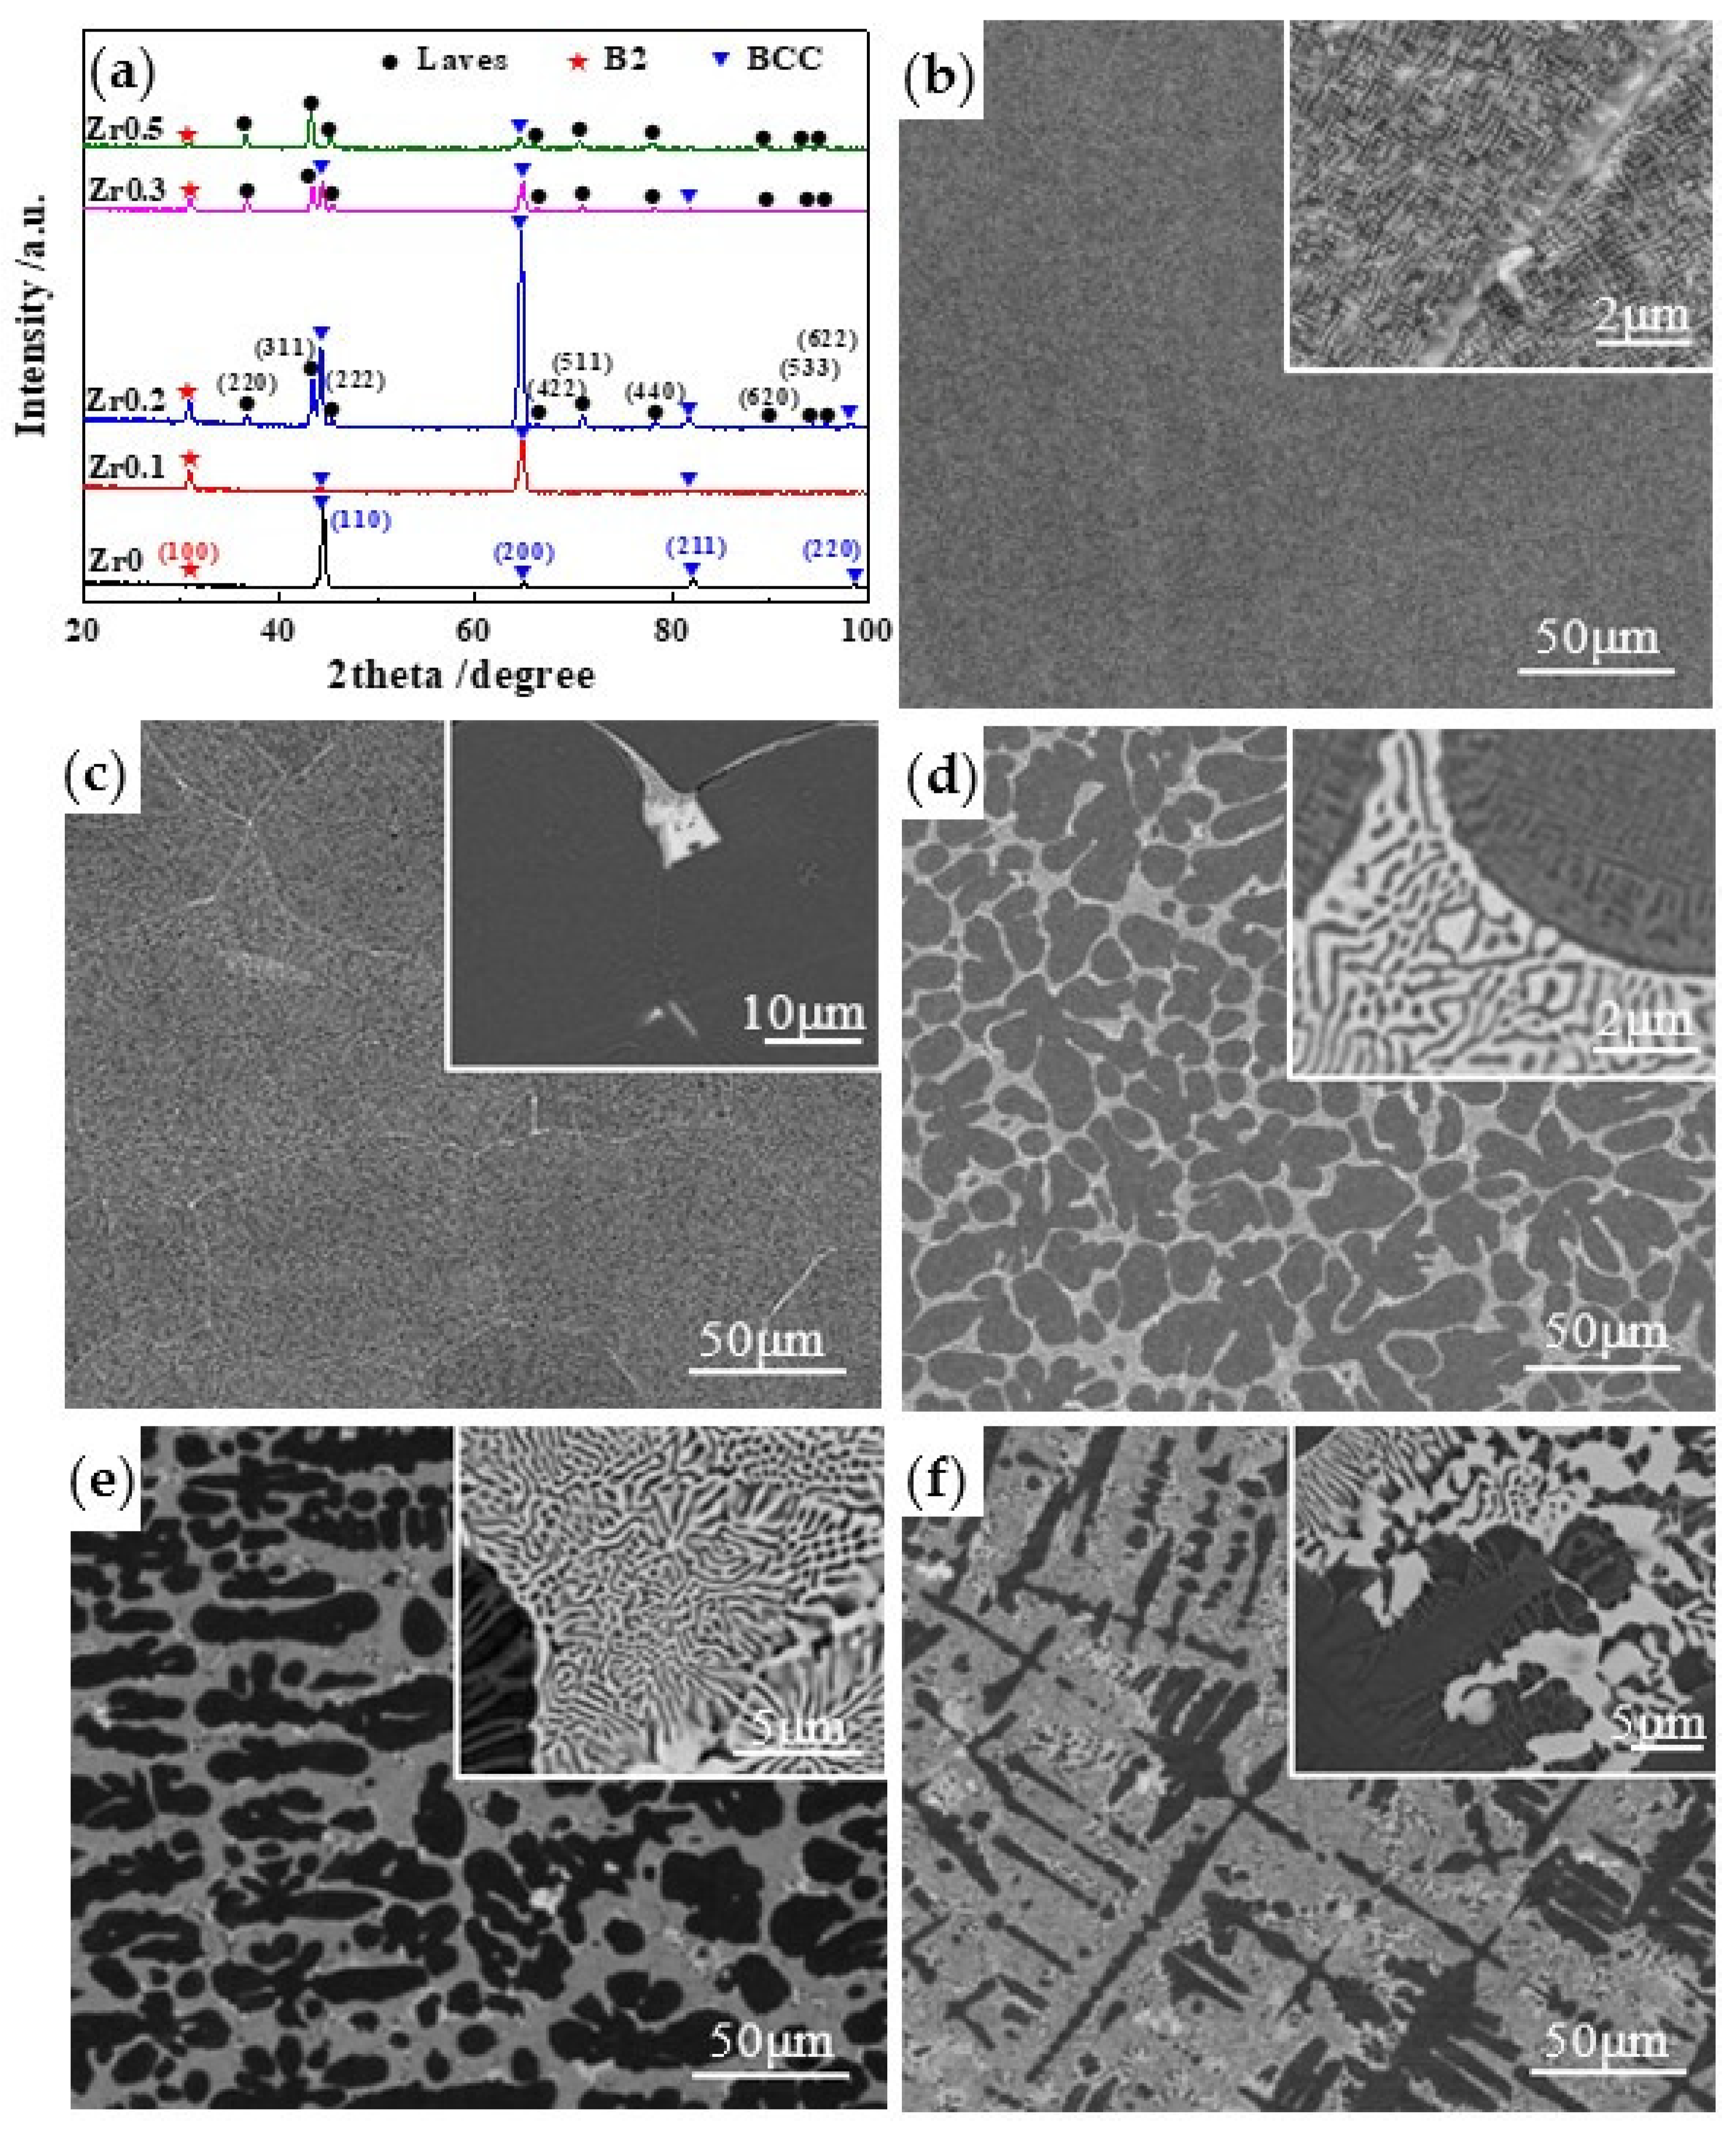
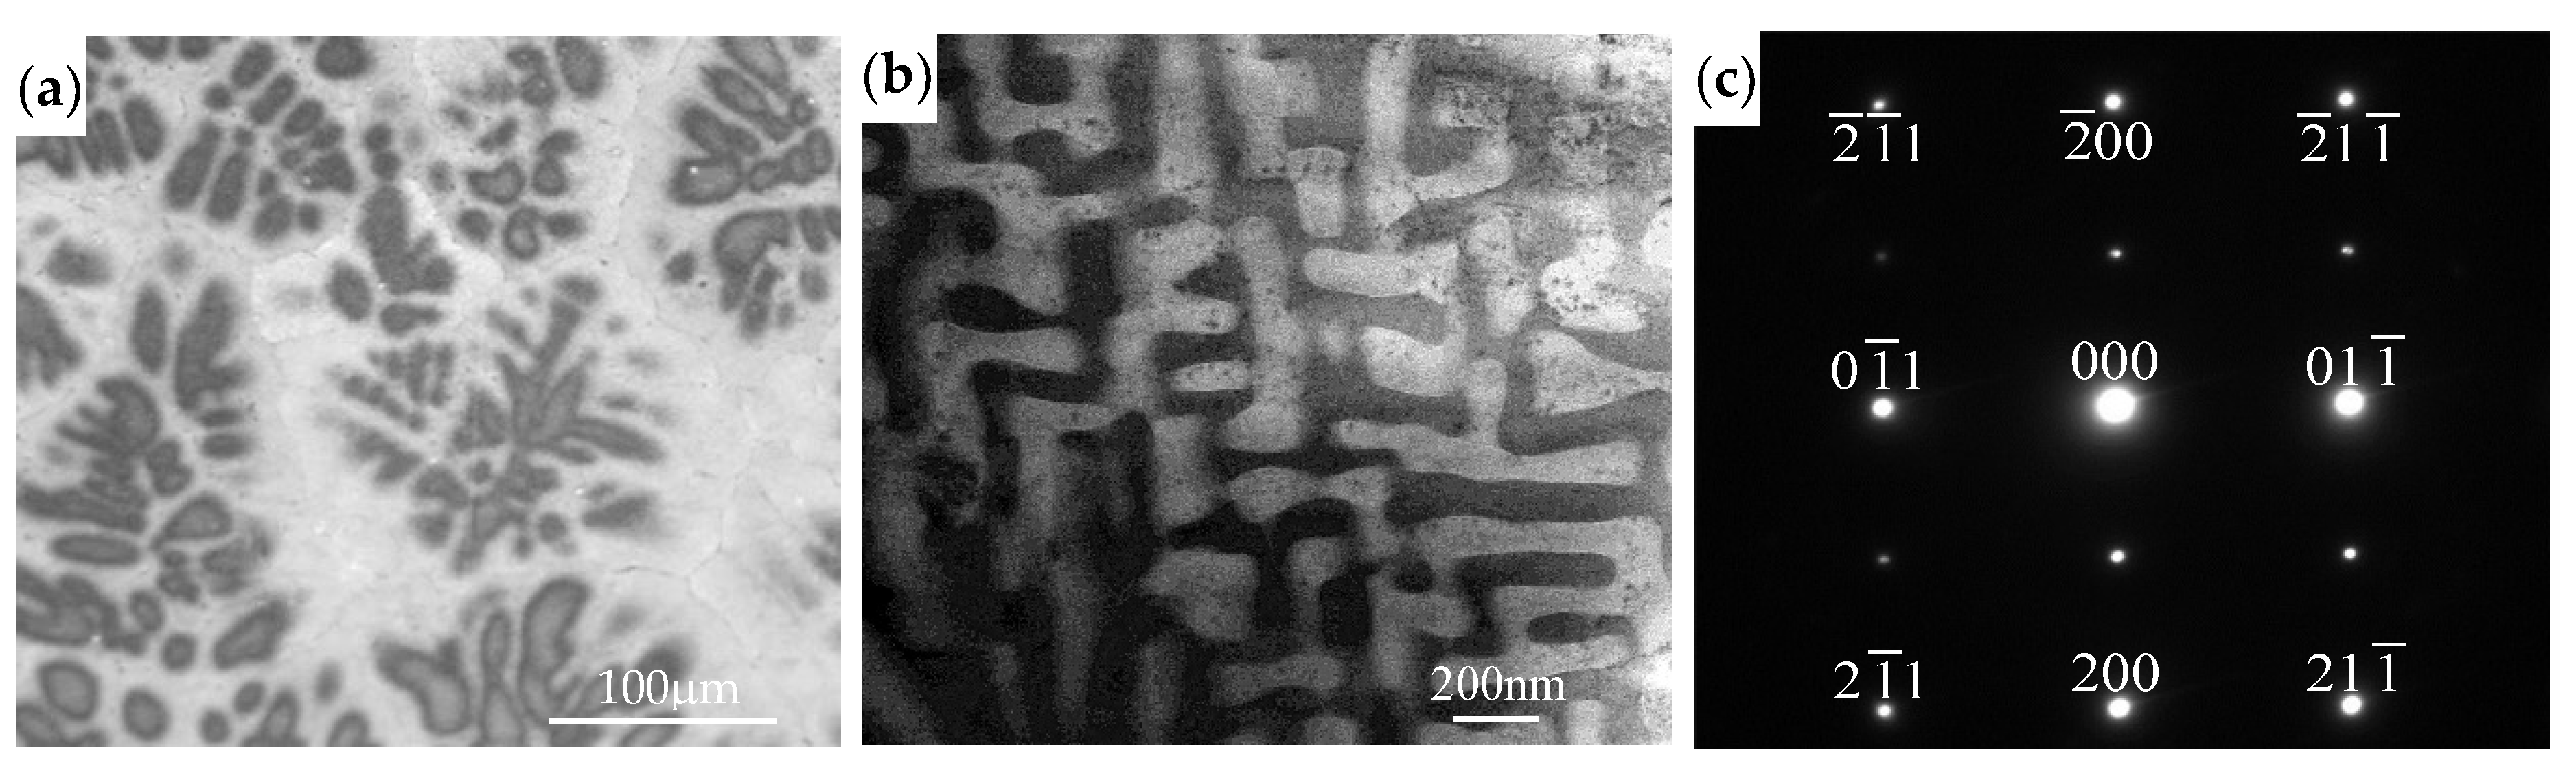
The corroded surface morphologies and the corresponding EDS spectra of the as-cast AlCoCrFeNiZrx alloys in 0.5 M H2SO4 solution for the 0–192 h immersion tests at 25 °C are shown in Figure 2. It can be seen from Figure 2 that the main corrosion types of the AlCoCrFeNiZrx alloys were general and intergranular corrosion, which is related to the microstructure of the AlCoCrFeNiZrx alloys and the different dissolution characteristic in the corroded surface of the alloys relevant to the different phase structure and its chemical inhomogeneity [24,28]. Figure 3 shows the XRD patterns and the typical SEM micrographs of the as-cast AlCoCrFeNiZrx alloys (x = 0, 0.1, 0.2, 0.3, and 0.5). From Figure 3a,b, it can be seen that the Zr0 alloys were a uniform solid solution with a modulated plate structure composed of an Fe- and Cr-rich BCC phase (the bright phase in the enlarged image in Figure 3b) and an Al- and Ni-rich ordered (B2) BCC phase (the dark phase in the enlarged image in Figure 3b), which were formed by a spinodal decomposition mechanism [18,37,38]. Moreover, it is also seen from Figure 3b that the detailed microstructures of the Zr0 alloys can only be identified at a large enough magnification, and the same result was confirmed by Shi et al., in that the disordered and ordered BCC phases in the FCC matrix of AlxCoCrFeNi HEAs cannot be separated via the BSE/EDS observation due to their fine grain size [16]. However, the near-equiaxed dendritic microstructure of the Zr0 alloys can be observed by OM in Figure 4a, and the black dendritic regions and the bright interdendritic regions can be seen clearly, which largely results from the elemental segregation between the dendritic and interdendritic regions [39]. Xiang et al. [16] also revealed that the most negative mixing enthalpy between Al and Ni was responsible for the formation of the Al- and Ni-rich ordered B2 matrix in the (Al, Ni)-rich dendritic and (Fe, Cr)-rich interdendritic regions of the as-cast AlCoCrFeNiSi0.1 alloy, and the periodic and coherent microstructure composed of the (Fe, Cr)-rich A2 phase and (Al, Ni)-rich B2 phase could be observed in both the (Al, Ni)-rich dendrite and the (Fe, Cr)-rich interdendrite. TEM was used to investigate the Zr0 alloys, and the bright-field TEM image and the corresponding selected area electron diffraction pattern along the [11] zone axis are shown in Figure 3b,c. Figure 3c reveals the superlattice reflections, confirming the existence of an ordered B2 phase. Therefore, the bright phase in Figure 3b is the Al- and Ni-rich ordered B2 phase, while the dark phase is the Fe- and Cr-rich disordered BCC phase, which is in agreement with the results of many previous studies [18,40,41]. Due to the formation of the ZrX2 (X = Co or Ni) Laves phase with the space group Fd3m (no. 227) [32], the microstructures of the AlCoCrFeNiZrx alloys (x = 0.1, 0.2, 0.3, and 0.5) were composed of an Fe- and Cr-rich BCC phase (the gray phase in the enlarged image in Figure 3d–f), an Al- and Ni-rich B2 phase (the black phase in the enlarged image in Figure 3d–f), and a Zr- and Ni-rich Laves phase (the bright phase in the enlarged image in Figure 3c–f). It was reported by Qiu et al. [18] that an Al0.9CoCrFeNi alloy comprised a combination of FCC, Fe-Cr-rich BCC, and Al-Ni-rich B2 phases, and an Al0.9CoCrFeNiTi0.5 alloy consisted of an Fe-Cr-rich BCC phase, an Al-Ni-rich B2 phase, and an Fe–Cr sigma phase. Though Ti has similar physical features to Zr, i.e., both elements have a hexagonal close-packed (HCP) crystal structure, a high melting temperature, and good corrosion resistance, the introduction of the Laves phase in AlCoCrFeNiZrx (x = 0.1, 0.2, 0.3, and 0.5) alloys instead of an Fe-Cr sigma phase is mainly attributed to the difference between the radius of the Zr atom and the other constituent atoms, as well as the large negative mixing enthalpy between the constituent atomic pairs [32]. Moazzen et al. [39] calculated the Gibbs free energy for the formation of all possible binary intermetallic compounds in the FeCoCrNi and FeCoCrNiZr0.4 systems at 298 K, and they also revealed that the greater negative Gibbs free energy in the formation of the intermetallic compounds containing zirconium than that of the other intermetallic compounds was due to the large difference in the atomic radius and electronegativity of Zr with the other alloying elements. The Laves phase was preferentially formed along the grain boundary in the Zr0.1 alloy (Figure 3c), and the volume fraction of the Laves phase located in the interdendritic zone increased with the Zr content, which became the main phase when the Zr content was over 0.3 mol (Figure 3e,f). Table 2 shows the EDS results of the dendritic and interdendritic zones of the AlCoCrFeNiZrx alloys (x = 0, 0.1, 0.2, 0.3, and 0.5), and it can be easily seen from Table 2 that the bright interdendritic regions of the Zr0 alloys in Figure 4a were rich in Cr and Fe, while the dendritic regions were enriched with Al and Ni, and Co was almost uniformly distributed in these two distinct regions, both of which are composed of an (Fe, Cr)-rich BCC phase and an (Al, Ni)-rich B2 phase; the same results were also reported by Xiang et al. [27]. Moreover, it can also be seen from Table 2 that the markedly different metal concentrations of Cr and Zr were found in the interdendritic and dendritic areas of the AlCoCrFeNiZrx (x = 0.1, 0.2, 0.3, and 0.5) alloys, and Zr additions were almost segregated along the grain boundary in the Zr0.1 alloys and enriched in the Laves phase of the Zr0.2, Zr0.3, and Zr0.5 alloys. Perhaps, due to the formation of the ZrX2 (X = Co or Ni) Laves phase in the interdendritic regions, it is difficult to detect Zr elements in the (Al, Ni)-rich dendritic regions. It is well known that, due to the formation of protective chromium oxide-based passive films on the surfaces, Fe-Cr and Fe-Cr-Ni stainless steels have good general corrosion resistance and pitting corrosion resistance in different corrosion media, and the role of Cr in protecting HEAs is thought to be similar to its protecting role in stainless steels [13]. Kao et al. [14] reported that, due to the poor protective capabilities of an Al oxide-based film on the surface of Al-containing CoCrFeNi HEAs, Al additions were detrimental to the corrosion resistance of the AlxCoCrFeNi alloy system in sulfuric acid solution, and Ni could easily combine with Al to form an Al- and Ni-rich B2 phase, which might deteriorate the corrosion resistance of Ni-containing AlxCoCrFeNi alloys. Based on these results, it can be concluded that the selective corrosion of the Al- and Ni-rich, Cr-depleted B2 phases in the AlCoCrFeNiZrx (x = 0, 0.1, 0.2, 0.3, and 0.5) alloys is mainly attributed to the large bonding in Al and Ni [16], which tends to readily react with (OH)− and (SO4)2− to form less protective Al and Ni complexes, such as Al2O3, Al(OH)3, and NiO, and dissolve in 0.5 M H2SO4 solution [14]. Accordingly, the seriously corroded surface in Figure 2(a1) was mainly caused by the selective dissolution of Al and Ni in the Al- and Ni-rich ordered B2 phase in the Zr0 alloys, and similar phenomena have been reported by other researchers [14,15,16,17,18,26,27,29]. It has been mentioned before that both the (Al, Ni)-rich dendrite and the (Fe, Cr)-rich interdendrite of Zr0 alloys have a periodic and coherent microstructure composed of an (Fe, Cr)-rich A2 phase and an (Al, Ni)-rich B2 phase, inferring that the Al- and Ni-rich, Cr-depleted B2 phases in both the dendrite and interdendrite are caused by a severe galvanic corrosion attack, where an Al- and Ni-rich, Cr-depleted B2 phase is the anode coupled with the Fe-Cr-rich BCC phase, which can be also confirmed by Table 3. Table 3 shows EDS analyses on the marked regions in the corroded surfaces of the AlCoCrFeNiZrx (x = 0, 0.1, 0.2, 0.3, and 0.5) alloys, where regions A and B represent the seriously and slightly corroded surfaces, respectively. From Table 3, it can be seen that both regions A and B were enriched with Cr, Fe, and O but depleted of Al and Ni, which means either the dendrite or the interdendrite was greatly attacked by galvanic corrosion during the immersion tests in 0.5 M H2SO4 solution. As seen in Table 2 and Figure 3c, almost 0.1 mol of the Zr addition preferentially segregated along the grain boundary of the Zr0.1 alloys during the period of solidification. Due to the good corrosion resistance of the Laves phase with more than 85 wt % Zr or nearly pure Zr, the galvanic corrosion potential difference between the grain boundary and the grain itself became small, and the corrosion of the grain boundary was almost inhibited, that is, the addition of 0.1 mol Zr resulted in isolated grains surrounded by a high Zr content of the Laves phase or pure Zr in the grain boundary, which prevented or retarded the corrosion process of the Zr0.1 alloys in 0.5 M H2SO4 solution. In other words, the dissolution of the Al- and Ni-rich B2 phase coupled with the Fe-Cr-rich BCC phase was restricted within the grain, and due to the grain refinement caused by the Zr addition compared with the Zr0 alloys (see Figure 3c and Figure 4a), a lot of grain boundaries with good corrosion resistance existed in the Zr0.1 alloys, and the corrosion rate of the grain was retarded. Therefore, the Zr0.1 alloys had the smallest corrosion rate (Figure 1b) and good galvanic corrosion resistance. Table 3 also shows a seriously corroded surface with higher Cr and lower Al and Ni contents, a slightly corroded surface with higher Cr and lower Al and Ni contents, and a slightly corroded surface with a relatively high Cr, Al, and Ni content, revealing the corrosion process by the dissolution of the (Al, Ni)-rich and Cr-depleted B2 phase; this can also be confirmed by the small amount of isolated corroded pits and the large area of the relatively less corroded flat surface in Figure 2(b1), which means that the dissolution of the B2 phase was inhibited within the isolated grains in the Zr0.1 alloys. Since the interdendritic and dendritic regions have markedly different chemical compositions, both selective corrosion and general corrosion were found to appear in the Zr0.2, Zr0.3, and Zr0.5 alloys with increasing Zr content, as it can be observed in Figure 2(c1–e1). From the enlarged images in Figure 3d–f, it can be seen that with the increase in the Zr content from 0.1 to 0.5 mol, the width of the periodic structure consisting of the (Fe, Cr)-rich BCC phase and (Al, Ni)-rich B2 phase significantly became thicker, especially close to the interfaces of the Laves phase in the Zr0.2 and Zr0.3 alloys, while the periodic structure was refined again with the Zr content further increased to 0.5 mol. From Figure 2, it can be clearly seen that the general corrosion and intergranular corrosion of the Zr0.2 and Zr0.3 alloys were severe for the “tubular coral reef” morphology and their relatively larger and deeper pits, which mostly resulted from the dissolution of the thicker (Al, Ni)-rich and Cr-depleted B2 phase in these two alloys. Additionally, compared to the corrosion morphology of the “pine needles” present on the surface of the Zr0.5 alloys, the obvious “tubular coral reef” morphology indicates that the Zr0.3 alloys with the largest width of the periodic structure or the maximum volume fraction of the (Al, Ni)-rich and Cr-depleted B2 phase among the AlCoCrFeNiZrx (x = 0, 0.1, 0.2, 0.3, and 0.5) alloys suffered the most severe corrosion in 0.5 M H2SO4 solution. It can be easily found that with an increasing Zr content, the Laves phase dramatically increased in the Zr0.2 alloys and became the main phase in the Zr0.3 and Zr0.5 alloys. For the Zr0.2, Zr0.3, and Zr0.5 alloys, the corroded surfaces seriously suffered from the galvanic corrosion existing in both the dendritic zone for an Al- and Ni-rich, Cr-depleted B2 phase as the anode coupled with the Fe-Cr-rich BCC phase and the interdendritic zone for an Al- and Ni-rich, Cr-depleted B2 phase as the anode coupled with the Zr-rich Laves phase. Moreover, it can be proposed based on Table 2 that during the decline in the Zr content in the Laves phase, the resistance to general corrosion of the Zr0.2, Zr0.3, and Zr0.5 alloys compared to the Zr0.1 alloys slightly decreased, and the surfaces of the Zr0.2, Zr0.3, and Zr0.5 alloys were roughened by general corrosion. Table 3 also reveals that both the severely and the slightly corroded surfaces were rich in Cr and lacked Al, Ni, and Zr compared with the chemical compositions of the Zr0.2, Zr0.3, and Zr0.5 alloys in Table 2. These results are in accordance with research on the electrochemical behavior of multi-component amorphous and nanocrystalline Zr-based alloys in NaOH and H2SO4 solutions [42]. Regarding the formation of a Zr-rich Laves phase and the maximum ratio of the Al- and Ni-rich, Cr-depleted B2 phase in the microstructures, the Zr0.3 alloys presented the heaviest volume loss and the worst corroded surfaces, as shown in Figure 1 and Figure 2(d1), respectively. As seen in Figure 3f, the volume fraction of the Zr-rich Laves phase with relatively better galvanic corrosion resistance dramatically increases to more than 60% together with a decreased volume fraction of the Al- and Ni-rich, Cr-depleted B2 phase and the Fe–Cr-rich BCC phase to less than 40% in the Zr0.5 alloys. It is because the decrease of the Al- and Ni-rich, Cr-depleted B2 phase that the Zr0.5 alloys show the almost matchable volume loss and corrosion resistance to the Zr0.2 alloys and the smaller volume loss and better corrosion resistance than the Zr0.3 alloys.
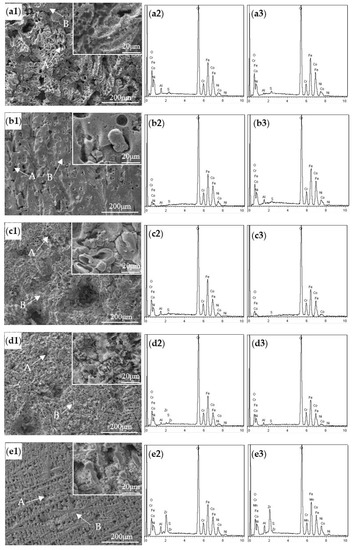
Figure 2.
Corroded surface morphologies (a1, b1,c1,d1,e1) and typical EDS spectra in region A (a2,b2,c2,d2,e2) and region B (a3,b3,c3,d3,e3) of as-cast AlCoCrFeNiZrx alloys in a 0.5 M H2SO4 solution for 0–192 h immersion tests at 25 °C: (a) x = 0, (b) x = 0.1, (c) x = 0.2, (d) x = 0.3, and (e) x = 0.5.

Figure 3.
XRD patterns and SEM micrographs of as-cast AlCoCrFeNiZrx (x = 0, 0.1, 0.2, 0.3, and 0.5) alloys: (a) XRD patterns, (b) x = 0, (c) x = 0.1, (d) x = 0.2, (e) x = 0.3, and (f) x = 0.5.
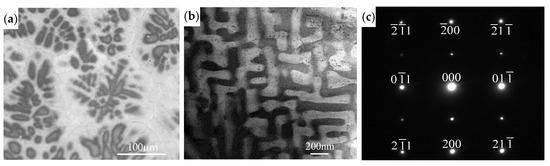
Figure 4.
Metallograph (a) and TEM bright-field image (b) as well as corresponding selected area electron diffraction patterns (c) of the Zr0 alloys.
Table 2.
EDS results of the dendritic and interdendritic zones of AlCoCrFeNiZrx alloys (wt %).
Table 3.
EDS analyses for chemical compositions of the marked regions in the corroded surfaces of AlCoCrFeNiZrx (x = 0.1, 0.2, 0.3, and 0.5) alloys (wt %).
3.2. Potentiodynamic Polarization Measurements
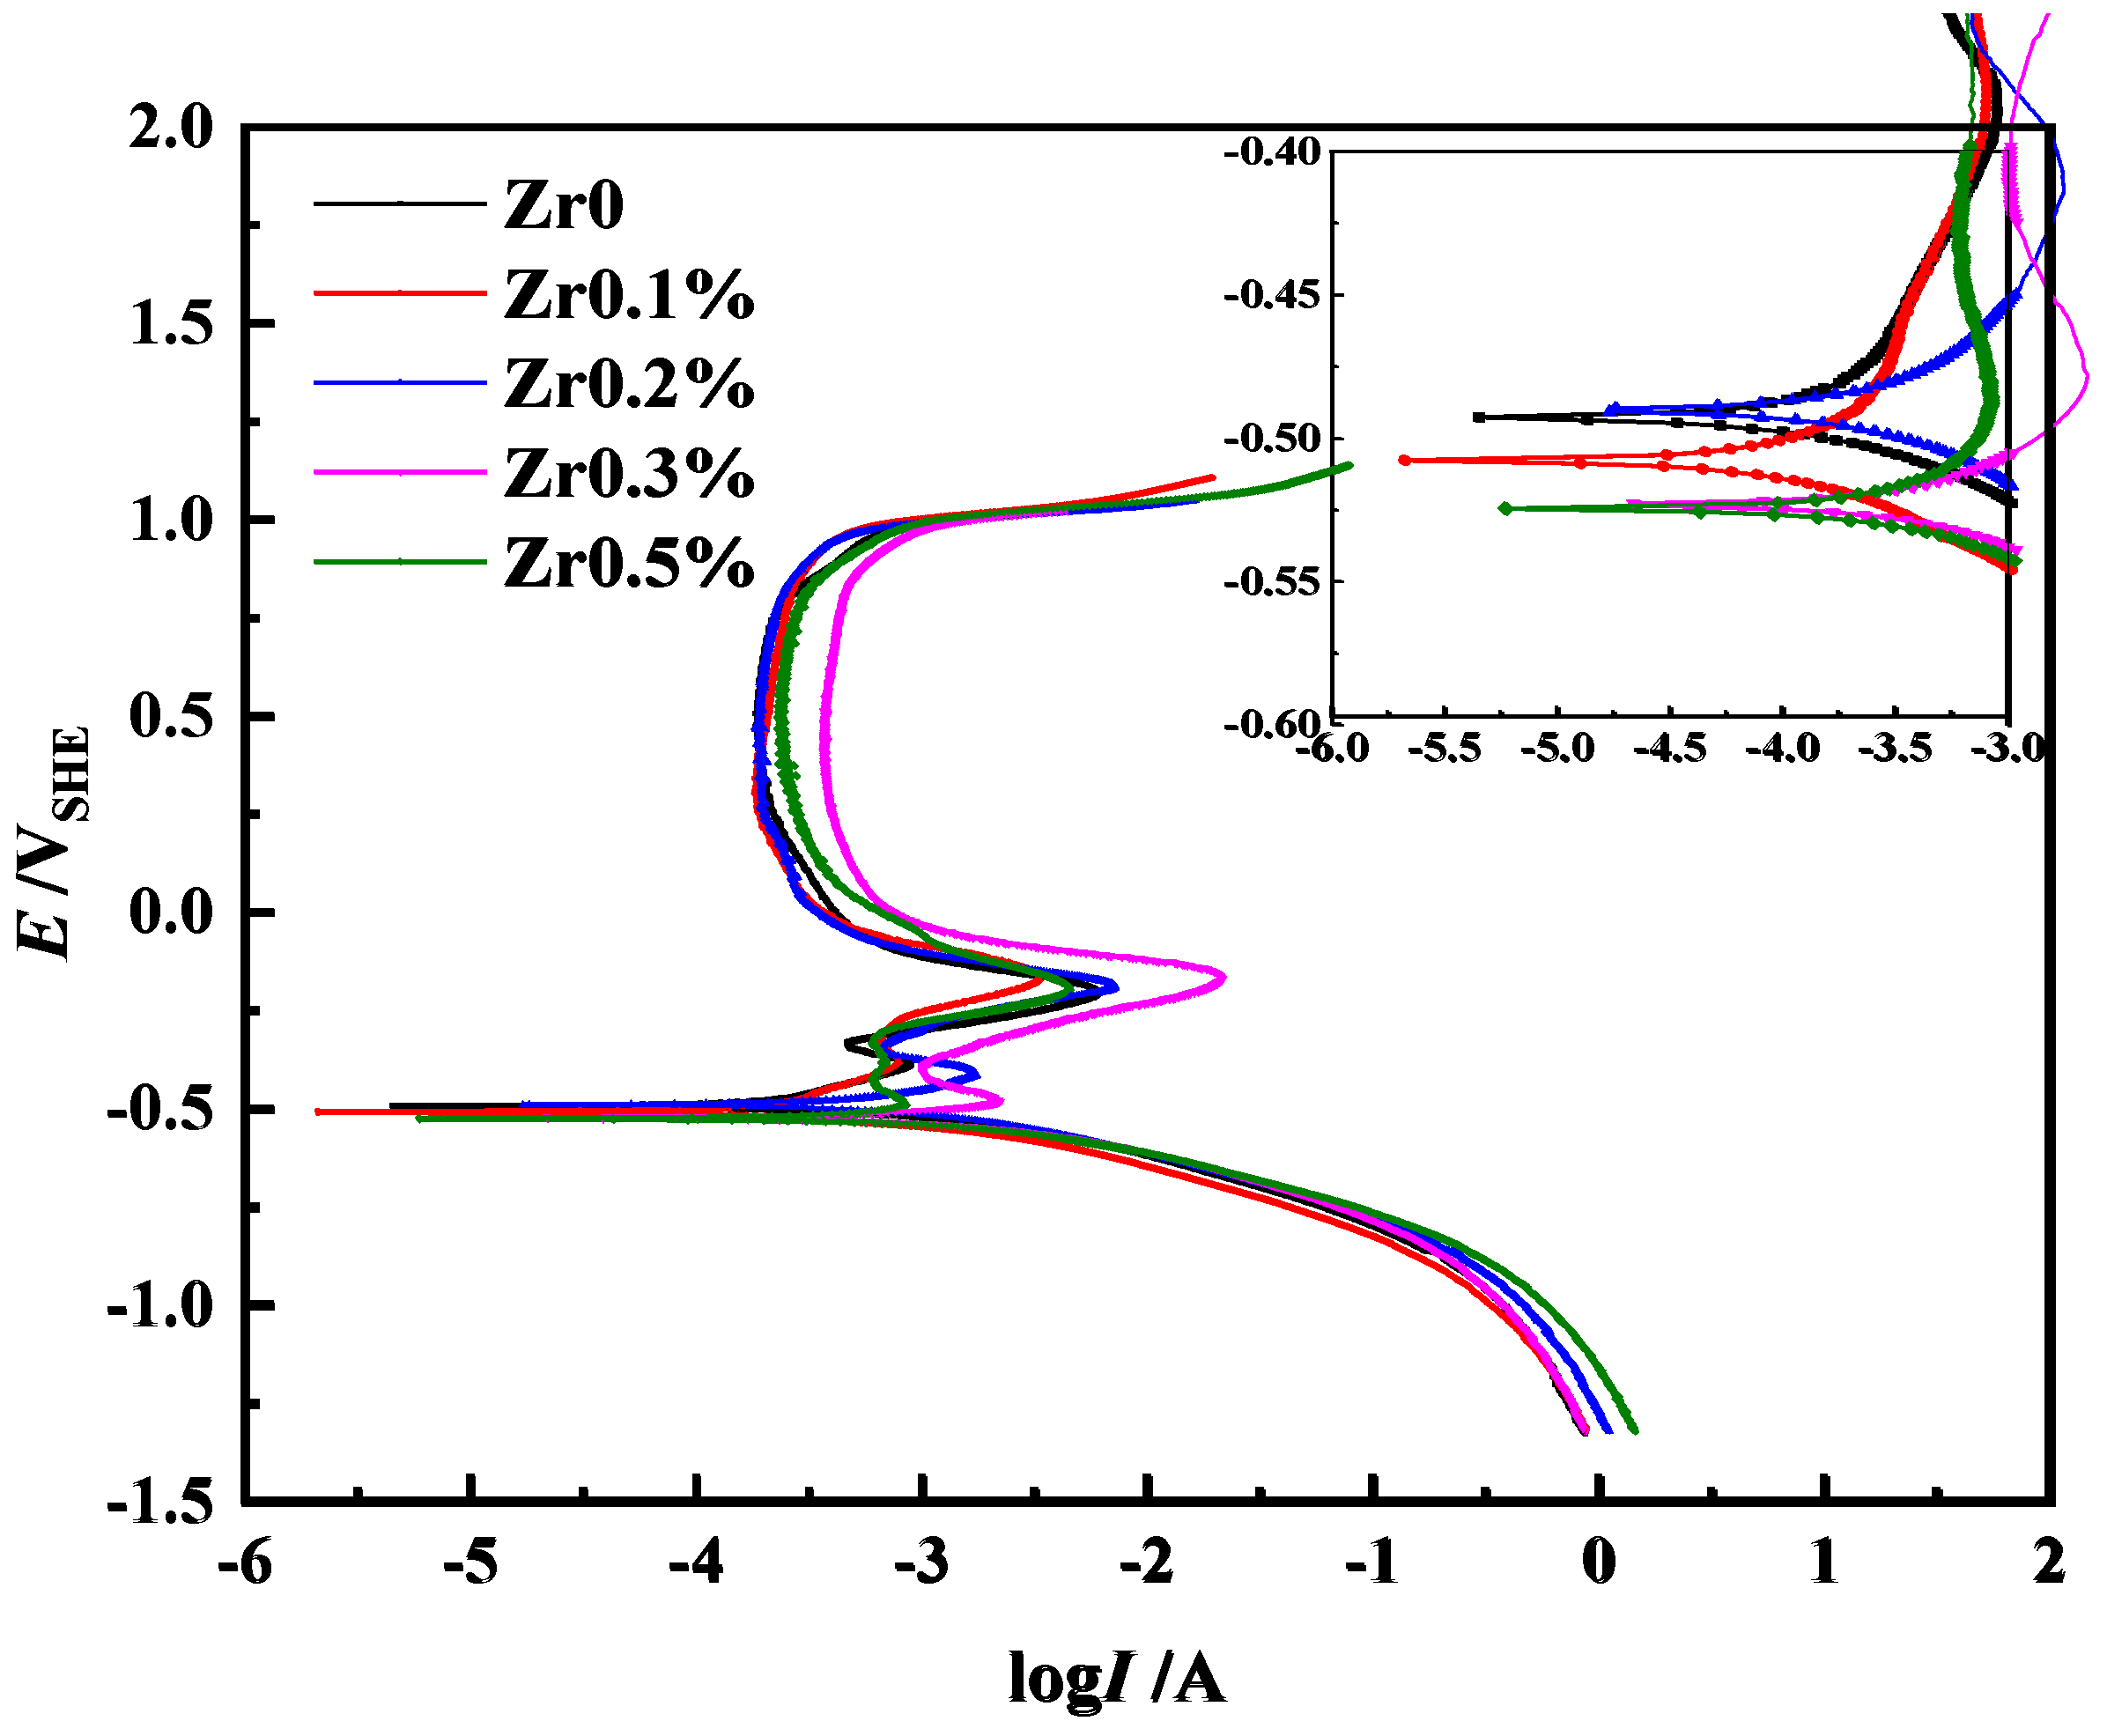
The potentiodynamic polarization curves of the AlCoCrFeNiZrx alloys in 0.5 M H2SO4 solution are plotted in Figure 5, and the electrochemical parameters of the AlCoCrFeNiZrx alloys are listed in Table 4. It can be observed from Figure 5 that the polarization curves obviously exhibit an active-passive corrosion behavior, and all alloys possessed a well-defined passive region following a tendency to passivate in the curves. It can be seen from Table 4 that compared with the Zr0 alloys, the Zr0.1 and Zr0.5 alloys had a very small change in their corrosion potentials (Ecorr), and the Zr0.2 and Zr0.3 alloys showed relatively negative corrosion potentials, which indicates the Zr0.2 and Zr0.3 alloys are more susceptible to corrosion than the other alloys. The corrosion potentials only reflect the corrosion resistance tendency (electrochemical corrosion thermodynamics) of the material, whereas the corrosion current densities are a true reflection of the corrosion behavior (electrochemical corrosion kinetics) of the material. The corrosion current densities (Icorr) of the AlCoCrFeNiZrx alloys presented a similar trend to those of the immersion test with increasing Zr. The Zr0.1 and Zr0.3 alloys exhibited a relatively lower and higher corrosion current density (Icorr) than that of the other AlCoCrFeNiZrx alloys, respectively, which implies that the Zr0.1 and Zr0.3 alloys are individually less and more susceptible to general corrosion in 0.5 M H2SO4 solution. Furthermore, the critical passive current density (Ip) and the maintained passive current density (I’p) of the Zr0.3 alloys were the highest, thus indicating that they are also more susceptible to local corrosion in 0.5 M H2SO4 solution, which has a close relationship with the existence of a large amount of the Al- and Ni-rich, Cr-depleted B2 phase matching with the Fe-Cr-rich BCC phase and the Zr-rich Laves phase in the microstructures of the Zr0.3 alloys [16,18,43,44]. Yen et al. [43] discussed the corrosion mechanism of the annealed equiatomic AlCoCrFeNi tri-phase high-entropy alloy in 0.5 M H2SO4 aerated aqueous solution and pointed out that the lower-Cr content phase was the least corrosion-resistant, and the B2 phase with plenty of Al and Ni was easily released from the hydroxide film during the polarization test and preferentially corroded.

Figure 5.
Potentiodynamic polarization curves of AlCoCrFeNiZrx (x = 0, 0.1, 0.2, 0.3, and 0.5) alloys in a 0.5 M H2SO4 solution.
Table 4.
Potentials and current densities of AlCoCrFeNiZrx (x = 0, 0.1, 0.2, 0.3, and 0.5) alloys in a 0.5 M H2SO4 solution.
Table 5 shows the corrosion rates, KR and CR (in mm/year), obtained from the polarization measurements according to Equation (2) and the immersion tests according to Equation (1), respectively. The change tendencies of both KR and CR are consistent with the maximum for the Zr0.3 alloys and the minimum for the Zr0.1 alloys, and the reason for the higher value of KR than that of CR is that the electrochemical polarization measurements are more transient than those of the immersion test.
Table 5.
The corrosion rates obtained from the polarization measurements and immersion tests.
3.3. Electrochemical Impedance Spectroscopy Measurements
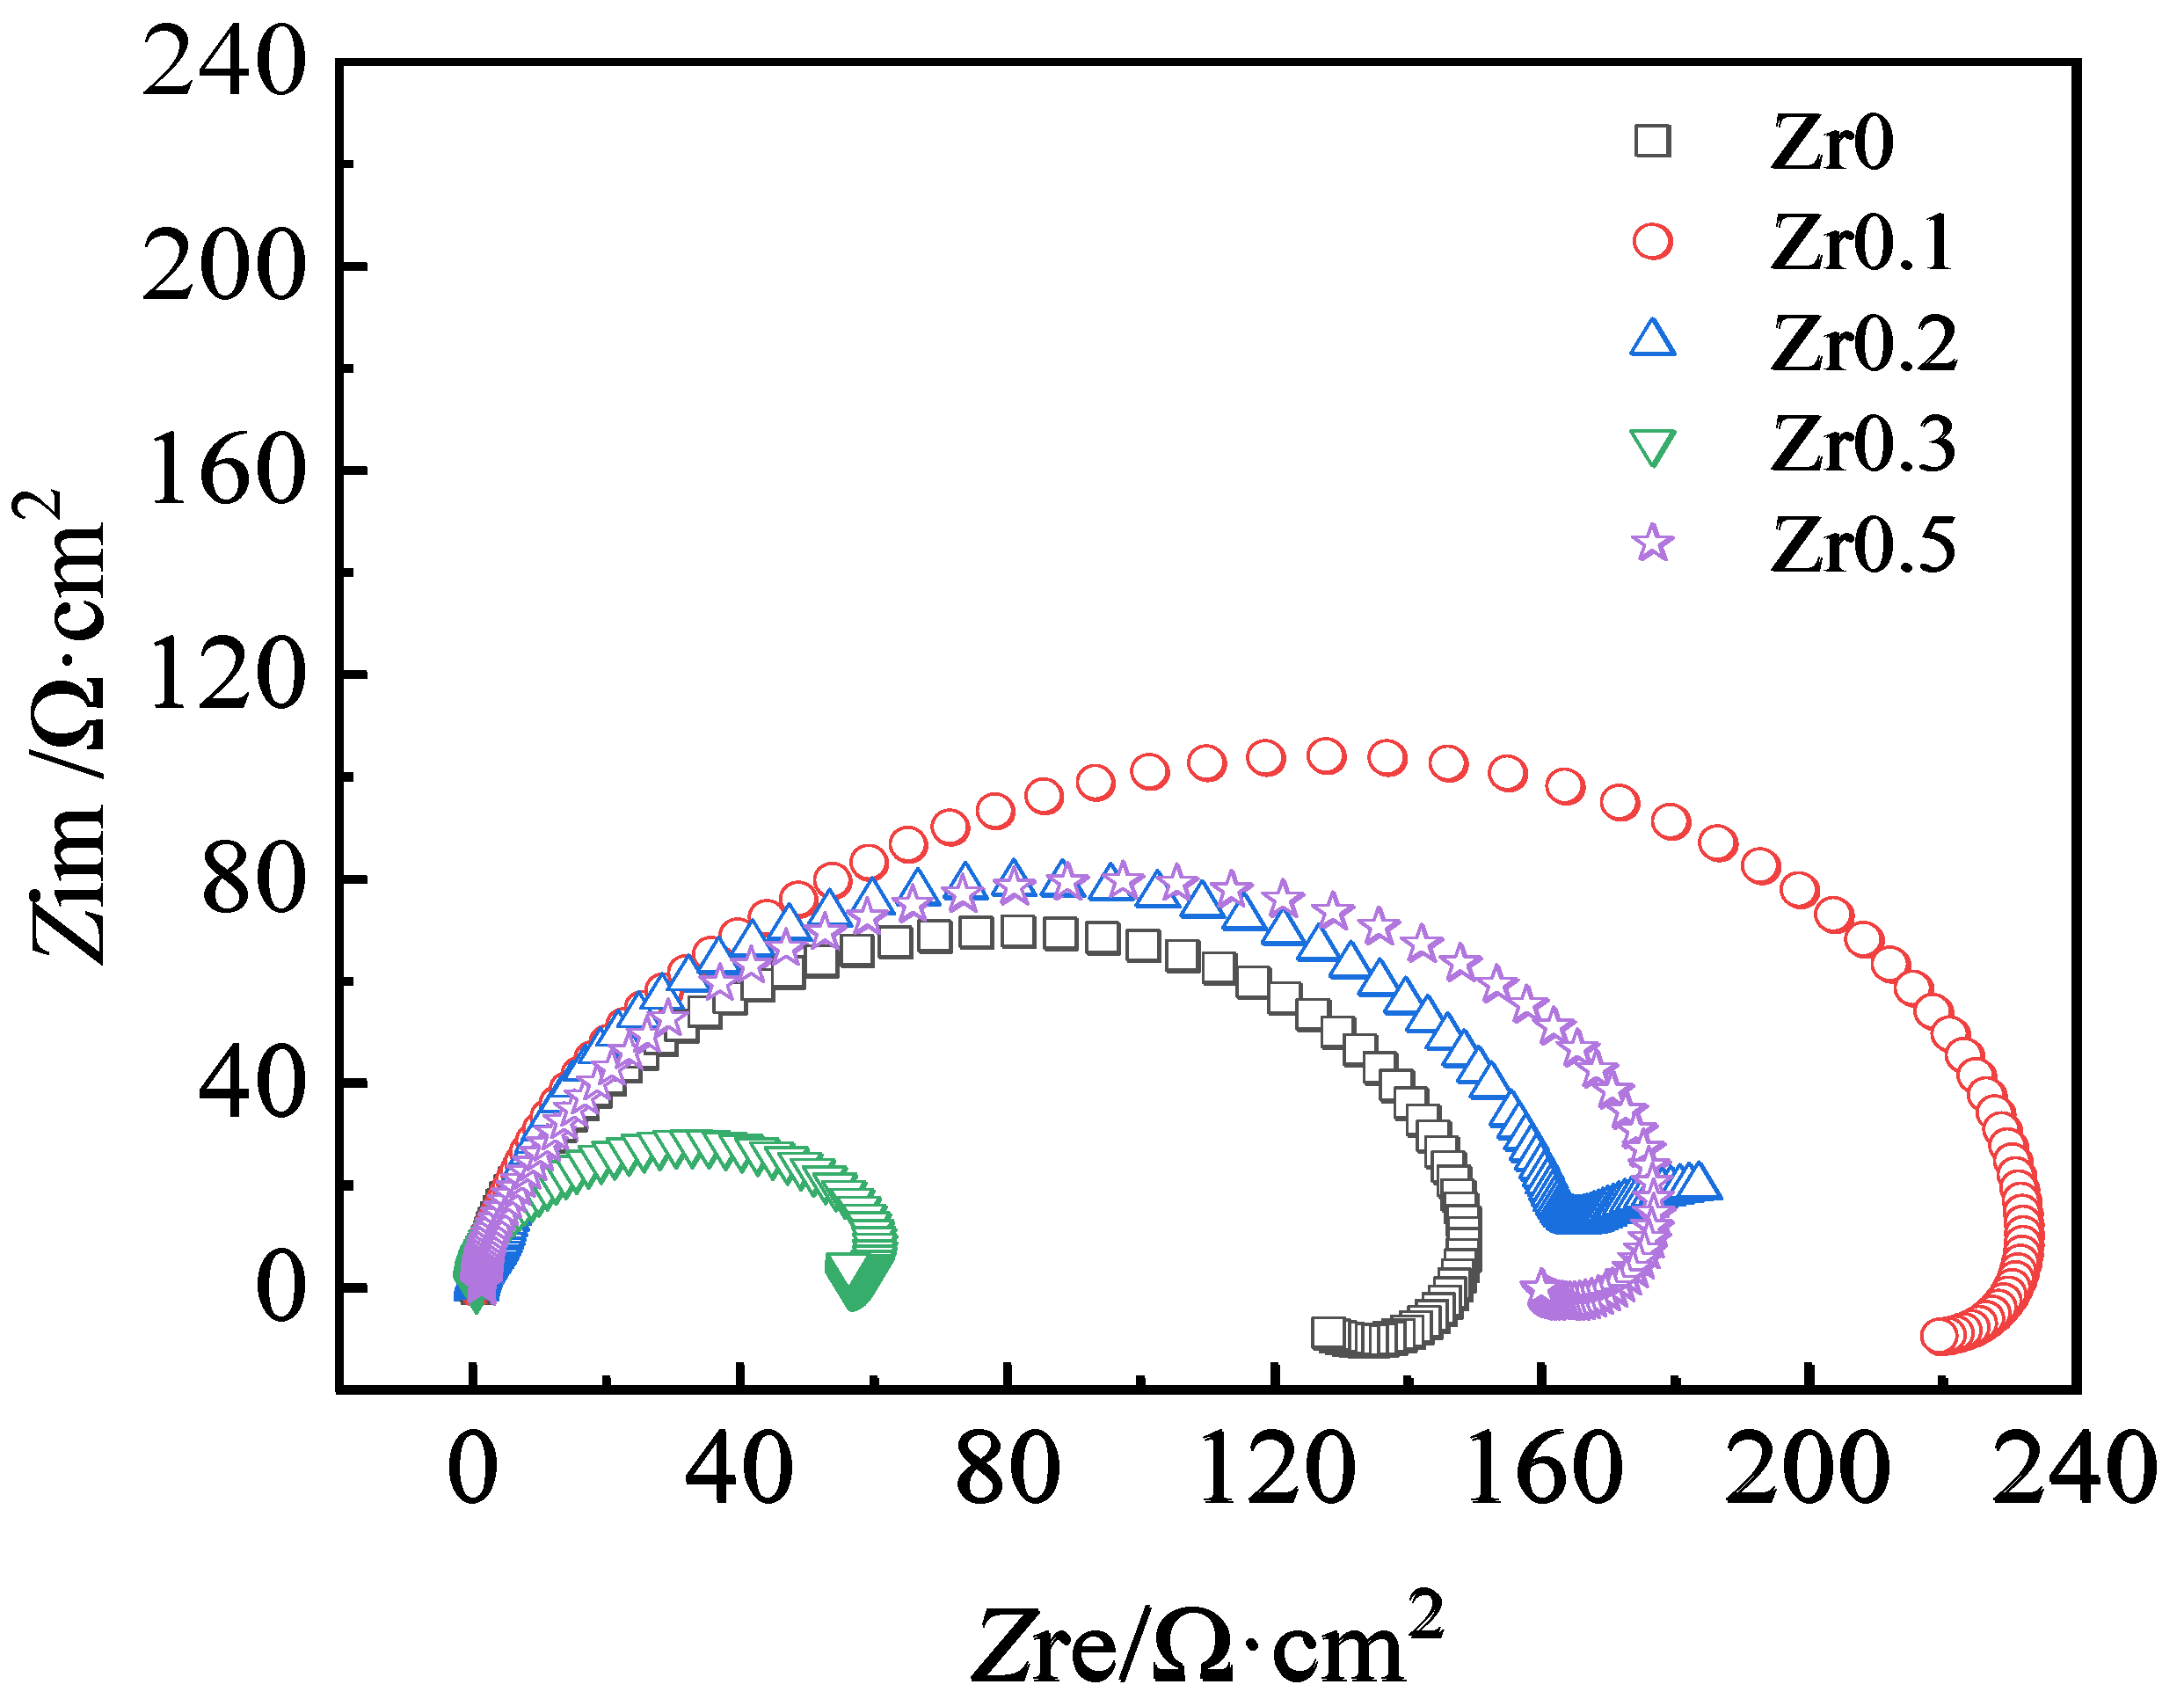
Electrochemical Impedance Spectroscopy is a powerful tool for studying corrosion and passivation processes and the electrochemical impedance (Z(w) in Ω·cm2) can be represented as a complex number composed of a real part (Zre in Ω·cm2) and an imaginary part (Zim in Ω·cm2). The Nyquist curves (Zim versus Zre) of the AlCoCrFeNiZrx alloys in 0.5 M H2SO4 solution are plotted in Figure 6. Figure 6 shows that the Nyquist curves of the AlCoCrFeNiZrx (x = 0, 0.1, 0.3, and 0.5) alloys in 0.5 M H2SO4 solution include one capacitive loop at high frequencies and one inductive loop at low frequencies. The Zr0.1 and Zr0.3 alloys have the largest and smallest diameters of the impedance arc, respectively. The addition of the Zr content to the alloys cannot lead to better corrosion resistance, e.g., the corrosion resistance of the Zr0.3 alloys is lower than that of the Zr0 alloys, which is in good agreement with the results of the immersion tests and potentiodynamic polarization measurements. The Nyquist curves of the Zr0.2 alloys include one capacitive loop at high frequencies and one capacitive loop at low frequencies, which are closely related to the structures in Figure 2(c1). Additionally, it was reported that the arc was related to the metal dissolution in the corrosion process, and the diameter of the arc was associated with charge transfer resistance, i.e., corrosion resistance [43].
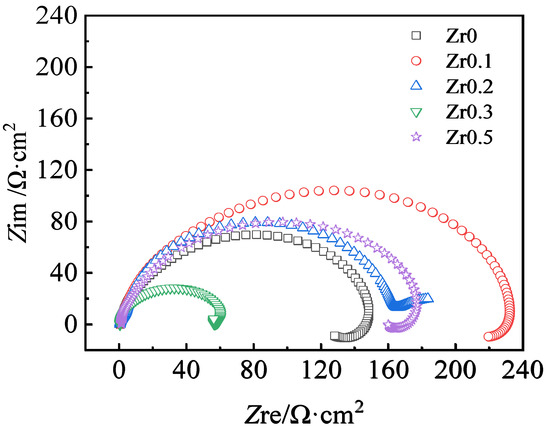
Figure 6.
The Nyquist curves (Zim versus Zre) of AlCoCrFeNiZrx (x = 0, 0.1, 0.2, 0.3, and 0.5) alloys in a 0.5 M H2SO4 solution.
For a better explanation of the corrosion behavior of the AlCoCrFeNiZrx alloys in 0.5 M H2SO4 solution, appropriate models of the impedance were developed to fit the test data, thus helping to evaluate the parameters and characterize the corrosion process. An equivalent electrical circuit was designed to best fit the experimental results for the electrodes, as shown in Figure 7. Figure 7a,b show the equivalent electrical circuit of the AlCo-CrFeNiZrx (x = 0, 0.1, 0.3, and 0.5) and AlCoCrFeNiZrx (x = 0.2) alloys, respectively, in 0.5 M H2SO4 solution, and Table 6 lists the related equivalent circuit parameters, where Rs is the resistance of the solution, Cdl is the double layer capacitance, Rt is the charge transfer resistance, Rct is the resistance that is associated with the inductive processes [14,45], L is the pseudoinductance [46], and Qdl is the constant phase element that compensates for the non-homogeneity in the system [47]. In a previous study [48], alloys with Al and Ni readily reacted with (SO4)2− in a sulfuric solution, and the reaction products could adsorb on the surface of the alloys, which increased the amount of ions in the adsorption layer. Therefore, Qdl in Figure 7b increases with x, and the inductance disappears as the x value increases to 0.2, an effect that normally occurs in the case of a severe corrosive condition [49]. The origin of the inductance is generally influenced by some adsorbed intermediates or attributed to spaces at the interfaces [50].
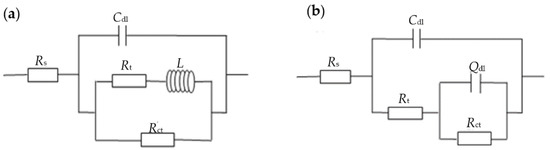
Figure 7.
EIS equivalent circuits of AlCoCrFeNiZrx (x = 0, 0.1, 0.2, 0.3, and 0.5) alloys in a 0.5 M H2SO4 solution: (a) x = 0, 0.1, 0.3, and 0.5; (b) x = 0.2.
Table 6.
EIS equivalent circuit parameters of AlCoCrFeNiZrx (x = 0, 0.1, 0.2, 0.3, and 0.5) alloys in a 0.5 M H2SO4 solution.
In the AlCoCrFeNiZrx alloys, a microstructure with an Al- and Ni-rich ordered BCC phase, which is metallographically seen as a reactive phase, not only caused the adsorption in these BCC phase areas during the corrosion process but also decreased the impedance in the low-frequency areas due to their continuous dissolution. Thus, the excessive Al- and Ni-rich BCC phases in the Zr0.3 alloys seriously deteriorated their corrosion resistance properties, and the dramatic increase in the Laves phases in the Zr0.2 alloys strengthened their galvanic corrosion with the Al- and Ni-rich BCC phases. In addition, with the decreases in the thickness of the passivation film, the value of the equivalent inductance L accordingly decreased, and vice versa. Thus, the Zr0.1 alloys presented good corrosion resistance due to the higher value of the equivalent inductance L, whereas the equivalent inductance L disappeared in the Zr0.2 alloys, indicating severe local corrosion.
4. Conclusions
- During the immersion and electrochemical tests of the AlCoCrFeNiZrx alloys in 0.5 M H2SO4 solution, galvanic corrosion occurred both in the dendritic zone for an Al- and Ni-rich, Cr-depleted B2 phase as the anode coupled with the Fe–Cr-rich BCC phase, and in the interdendritic zone for an Al- and Ni-rich, Cr-depleted B2 phase as the anode coupled with the Zr-rich Laves phase.
- For both the immersion tests and the electrochemical measurements in 0.5 M H2SO4 solution, the corrosion properties of the AlCoCrFeNiZrx alloys first increased and then decreased with the increase in the Zr content.
- Zr addition at 0.1, 0.3, and 0.5 mol can be advantageous for improving the corrosion resistance of AlCoCrFeNi alloys. The Zr0.3 alloys presented the worst corrosion resistance to 0.5 M H2SO4 solution due to the serious galvanic corrosion attack on the Al- and Ni-rich, Cr-depleted B2 phases in both the dendrite and interdendrite, whereas the Zr0.1 alloys had the best corrosion resistance due to the segregation of the Zr-rich Laves phase along the grain boundary.
Author Contributions
Designing the experiments, Y.Y. and J.C.; performing the experiments, Y.J., X.L., and W.G.; contributing the reagents, materials, and analysis tools, J.C. and S.Z.; analyzing the data, Y.Y., Y.J., W.G., X.L., and S.Z.; writing—original draft preparation, Y.Y., Y.J., X.L., and S.Z.; writing—review and editing, Y.Y., Y.J., and S.Z. All authors have read and agreed to the published version of the manuscript.
Funding
This research was funded by the National Natural Science Foundation of China (52071251, 51931005, 51974245, 21808182), Xi’an Science and Technology Planning Project (2020KJRC0097, 2020KJRC0098), Shaanxi Outstanding Youth Fund (2020JC-49), and Youth Innovation Team of University in Shaanxi Province.
Data Availability Statement
Data presented in this article are available at request from the corresponding author.
Conflicts of Interest
The authors declare no conflict of interest.
References
- Miracle, D.B.; Senkov, O.N. A critical review of high entropy alloys and related concepts. Acta Mater. 2017, 122, 448–511. [Google Scholar] [CrossRef] [Green Version]
- Tsai, M.H.; Yeh, J.W. High-entropy alloys: A critical review. Mater. Res. Lett. 2014, 2, 107–123. [Google Scholar] [CrossRef]
- Zhang, Y.; Zuo, T.T.; Tang, Z.; Gao, M.C.; Dahmen, K.A.; Liaw, P.K.; Lu, Z.P. Microstructures and properties of high-entropy alloys. Prog. Mater. Sci. 2014, 61, 1–93. [Google Scholar] [CrossRef]
- George, E.P.; Raabe, D.; Ritchie, R.O. High-entropy alloys. Nat. Rev. Mater. 2019, 4, 515–534. [Google Scholar] [CrossRef]
- Pouraliakbar, H.; Shim, S.H.; Kim, Y.K.; Rizi, M.S.; Noh, H.; Hong, S.I. Microstructure evolution and mechanical properties of (CoCrNi)90(AlTiZr)5(CuFeMo)5 multicomponent alloy: A pathway through multicomponent alloys toward new superalloys. J. Alloys Compd. 2021, 860, 158412. [Google Scholar] [CrossRef]
- Kim, Y.K.; Shim, S.H.; Lee, B.J.; Hong, S.I. Correlation between mechanical properties and thermodynamic parameters of dual-fcc-phase CoCrFeCuxNi (x = 1, 1.71) and CoCu1.71FeMnNi. Mater. Lett. 2020, 272, 127866. [Google Scholar] [CrossRef]
- Song, J.S.; Lee, B.J.; Moon, W.J.; Hong, S.I. Mechanical performance and microstructural evolution of (NiCo)75Cr17Fe8Cx (x = 0–0.83) medium entropy alloys at room and cryogenic temperatures. Metals 2020, 10, 1646. [Google Scholar] [CrossRef]
- Kozelj, P.; Vrtnik, S.; Jelen, A.; Jazbec, S.; Jaglicic, Z.; Maiti, S.; Feuerbacher, M.; Steurer, W.; Dolinsek, J. Discovery of a superconducting high-entropy alloy. Phys. Rev. Lett. 2014, 113, 107001–107005. [Google Scholar] [CrossRef]
- Gludovatz, B.; Hohenwarter, A.; Catoor, D.; Chang, E.H.; George, E.P. A fracture-resistant high-entropy alloy for cryogenic applications. Science 2014, 345, 1153–1158. [Google Scholar] [CrossRef] [Green Version]
- Salishchev, G.A.; Tikhonovsky, M.A.; Shaysultanov, D.G.; Stepanov, N.D.; Kuznetsov, A.V.; Kolodiy, I.V.; Tortika, A.S.; Senkov, O.N. Effect of Mn and V on structure and mechanical properties of high-entropy alloys based on CoCrFeNi system. Alloy. Compd. 2014, 591, 11–21. [Google Scholar] [CrossRef]
- Lu, C.L.; Lu, S.Y.; Yeh, J.W.; Hsu, W.K. Thermal expansion and enhanced heat transfer in high-entropy alloys. J. Appl. Crystallogr. 2013, 46, 736–739. [Google Scholar] [CrossRef]
- Xia, S.Q.; Wang, Z.; Yang, T.F.; Zhang, Y. Irradiation behavior in high entropy alloys. J. Iron Steel Res. Int. 2015, 22, 879–884. [Google Scholar] [CrossRef]
- Qiu, Y.; Thomas, S.; Gibson, M.A.; Fraser, H.L.; Birbilis, N. Corrosion of high entropy alloys. NPJ Mater. Degrad. 2017, 1, 15. [Google Scholar] [CrossRef]
- Kao, Y.F.; Lee, T.D.; Chen, S.K.; Chang, Y.S. Electrochemical passive properties of AlxCoCrFeNi (x = 0, 0.25, 0.50, 1.00) alloys in sulfuric acids. Corros. Sci. 2010, 52, 1026–1034. [Google Scholar] [CrossRef]
- Lee, C.P.; Chang, C.C.; Chen, Y.Y.; Yeh, J.W.; Shih, H.C. Effect of the aluminum content of AlxCrFe1.5MnNi0.5 high-entropy alloys on the corrosion behaviour in aqueous environments. Corros. Sci. 2008, 50, 2053–2060. [Google Scholar] [CrossRef]
- Shi, Y.Z.; Yang, B.; Xie, X.; Brechtl, J.; Dahmen, K.A.; Liaw, P.K. Corrosion of AlxCoCrFeNi high-entropy alloys: Al-content and potential scan-rate dependent pitting behavior. Corros. Sci. 2017, 119, 33–45. [Google Scholar] [CrossRef]
- Zhao, Y.; Wang, M.L.; Cui, H.Z.; Zhao, Y.Q.; Song, X.J.; Zeng, Y.; Gao, X.H.; Lu, F.; Wang, C.M.; Song, Q. Effects of Ti-to-Al ratios on the phases, microstructures, mechanical properties, and corrosion resistance of Al2-xCoCrFeNiTix high-entropy alloys. J. Alloys Compd. 2019, 805, 585–596. [Google Scholar] [CrossRef]
- Qiu, Y.; Thomas, S.; Fabijanic, D.; Barlow, A.J.; Fraser, H.L.; Birbilis, N. Microstructural evolution, electrochemical and corrosion properties of AlxCoCrFeNiTiy high entropy alloys. Mater. Des. 2019, 170, 107698. [Google Scholar] [CrossRef]
- Yang, J.; Wu, J.; Zhang, C.Y.; Zhang, S.D.; Yang, B.J.; Emori, W.; Wang, J.Q. Effects of Mn on the electrochemical corrosion and passivation behavior of CoFeNiMnCr high-entropy alloy system in H2SO4 solution. J. Alloys Compd. 2020, 819, 152943. [Google Scholar] [CrossRef]
- Rodriguez, A.; Tylczak, J.H.; Ziomek-Moroz, M. Corrosion behavior of CoCrFeMnNi high-entropy alloys (HEAs) under aqueous acidic conditions. ECS Trans. 2017, 77, 741–752. [Google Scholar] [CrossRef]
- Luo, H.; Li, Z.M.; Mingers, A.M.; Raabe, D. Corrosion behavior of an equiatomic CoCrFeMnNi high-entropy alloy compared with 304 stainless steel in sulfuric acid solution. Corros. Sci. 2018, 191, 131–139. [Google Scholar] [CrossRef]
- Pao, L.; Muto, I.; Sugawara, Y. Pitting at inclusions of the equiatomic CoCrFeMnNi alloy and improving corrosion resistance by potentiodynamic polarization in H2SO4. Corros. Sci. 2021, 191, 109748. [Google Scholar] [CrossRef]
- Hsu, K.M.; Chen, S.H.; Lin, C.S. Microstructure and corrosion behavior of FeCrNiCoMnx (x = 1.0, 0.6, 0.3, 0) high entropy alloys in 0.5 M H2SO4. Corros. Sci. 2021, 190, 109694. [Google Scholar] [CrossRef]
- Chou, Y.L.; Yeh, J.W.; Shih, H.C. The effect of molybdenum on the corrosion behaviour of the high-entropy alloys Co1.5CrFeNi1.5Ti0.5Mox in aqueous environments. Corros. Sci. 2010, 52, 2571–2581. [Google Scholar] [CrossRef]
- Cui, H.B.; Zheng, L.F.; Wang, J.Y. Microstructure evolution and corrosion behavior of directionally solidified FeCoNiCrCu high entropy alloy. Appl. Mech. Mater. 2011, 66–68, 146–149. [Google Scholar] [CrossRef]
- Wu, C.L.; Zhang, S.; Zhang, C.H.; Zhang, H.; Dong, S.Y. Phase evolution and cavitation erosion-corrosion behavior of FeCoCrAlNiTix high entropy alloy coatings on 304 stainless steel by laser surface alloying. J. Alloys Compd. 2017, 698, 761–770. [Google Scholar] [CrossRef]
- Xiang, C.; Zhang, Z.M.; Fu, H.M.; Han, E.H.; Zhang, H.F.; Wan, J.Q. Microstructure and corrosion behavior of AlCoCrFeNiSi0.1 high-entropy alloy. Intermetallics 2019, 114, 106599. [Google Scholar] [CrossRef]
- Niu, Z.Z.; Xu, J.; Wang, T.; Wang, N.R.; Han, Z.H.; Wang, Y. Microstructure, mechanical properties and corrosion resistance of CoCrFeNiWx (x = 0, 0.2, 0.5) high entropy alloys. Intermetallics 2019, 112, 106550. [Google Scholar] [CrossRef]
- Qiu, X.W. Corrosion behavior of Al2CrFeCoxCuNiTi high-entropy alloy coating in alkaline solution and salt solution. Results Phys. 2019, 12, 1737–1741. [Google Scholar] [CrossRef]
- Wen, D.; Jiang, B.; Wang, Q.; Yu, F.; Li, X.; Tang, R.; Zhang, R.; Chen, G.; Dong, C. Influences of Mo/Zr minor-alloying on the phase precipitation behavior in modified 310S austenitic stainless steels at high temperatures. Mater. Des. 2017, 128, 34–46. [Google Scholar] [CrossRef]
- Yurchenko, N.Y.; Stepanov, N.D.; Gridneva, A.O.; Mishunin, M.V.; Salishchev, G.A. Effect of Cr and Zr on phase stability of refractory Al-Cr-Nb-Ti-V-Zr high-entropy alloys. J. Alloys Compd. 2018, 757, 403–414. [Google Scholar] [CrossRef]
- Chen, J.; Niu, P.Y.; Liu, Y.Z.; Lu, Y.K.; Wang, X.H.; Peng, Y.L.; Liu, J.N. Effect of Zr content on microstructure and mechanical properties of AlCoCrFeNi high entropy alloy. Mater. Des. 2016, 94, 39–44. [Google Scholar] [CrossRef]
- American Society for Testing of Materials. ASTM G31-72 (Reapproved 2004) Standard Practice for Laboratory Immersion Corrosion Testing of Metals; ASTM International: West Conshohocken, PA, USA, 2004; pp. 1–8. [Google Scholar]
- American Society for Testing of Materials. ASTM G5-14 Standard Reference Test Method for Making Potentiodynamic Anodic Polarization Measurements; ASTM International: West Conshohocken, PA, USA, 2004; pp. 1–9. [Google Scholar]
- American Society for Testing of Materials. ASTM G59-97 (Reapproved 2003) Standard Test Method for Conducting Potentiodynamic Polarization Resistance Measurements; ASTM International: West Conshohocken, PA, USA, 2003; pp. 1–4. [Google Scholar]
- American Society for Testing of Materials. ASTM G102-89(2015)e1 Standard Practice for Calculation of Corrosion Rates and Related Information from Electrochemical Measurements; ASTM International: West Conshohocken, PA, USA, 2015; pp. 1–7. [Google Scholar]
- Tong, C.J.; Chen, M.R.; Chen, S.K.; Yeh, J.W.; Shun, T.T.; Lin, S.J.; Chang, S.Y. Mechanical performance of the AlxCoCrCuFeNi high-entropy alloy system with multi-principal elements. Metall. Mater. Trans. A 2005, 36A, 1263–1271. [Google Scholar] [CrossRef]
- Moazzen, P.; Toroghinejad, M.R.; Karimzadeh, F.; Vleugels, J.; Ravash, H.; Cavaliere, P. Influence of zirconium addition on the microstructure, thermodynamic stability, thermal stability and mechanical properties of mechanical alloyed spark plasma sintered (MA-SPS) FeCoCrNi high entropy alloy. Powder Metall. 2018, 61, 405–416. [Google Scholar] [CrossRef]
- Tang, Z.; Senkov, O.N.; Parish, C.M.; Zhang, C.; Zhang, F.; Santodonato, L.J.; Wang, G.; Zhao, G.; Yang, F.; Liaw, P.K. Tensile ductility of an AlCoCrFeNi multi-phase highentropy alloy through hot isostatic pressing (HIP) and homogenization. Mater. Sci. Eng. A 2015, 647, 229–240. [Google Scholar] [CrossRef] [Green Version]
- Yang, T.F.; Xia, S.Q.; Liu, S.; Wang, C.X.; Liu, S.S.; Zhang, Y.; Xue, J.M.; Yan, S.; Wang, Y.G. Effects of AL addition on microstructure and mechanical properties of AlxCoCrFeNi High-entropy alloy. Mater. Sci. Eng. A 2010, 648, 15–22. [Google Scholar] [CrossRef]
- Wang, W.R.; Wang, W.L.; Wang, S.C.; Tsai, Y.C.; Lai, C.H.; Yeh, J.W. Effects of Al addition on the microstructure and mechanical property of AlxCoCrFeNi high-entropy alloys. Intermetallics 2012, 26, 44–51. [Google Scholar] [CrossRef]
- Mondal, K.; Murty, B.S.; Chatterjee, U.K. Electrochemical behavior of multicomponent amorphous and nanocrystalline Zr-based alloys in different environments. Corros. Sci. 2006, 48, 2212–2225. [Google Scholar] [CrossRef]
- Yen, C.C.; Lu, H.N.; Tsai, M.H.; Wo, B.W.; Lo, Y.C.; Wang, C.C.; Chang, S.Y.; Yen, S.K. Corrosion mechanism of annealed equiatomic AlCoCrFeNi tri-phase high entropy alloy in 0.5 M H2SO4 aerated aqueous solution. Corros. Sci. 2019, 157, 462–471. [Google Scholar] [CrossRef]
- Yamanaka, K.; Shiratori, H.; Mori, M.; Omura, K.; Fujieda, T.; Kuwabara, K.; Chiba, A. Corrosion mechanism of an equimolar AlCoCrFeNi high-entropy alloy additively manufactured by electron beam melting. NPJ Mater. Degrad. 2020, 24, 24. [Google Scholar] [CrossRef]
- Chen, S.K. Electrochemical passive properties of AlxCoCrFeNi (x = 0, 0.25, 0.50, 1.00) high-entropy alloys in sulfuric acids. In Corrosion Resistance; Shih, H., Ed.; IntechOpen: Taiwan, China, 2012; pp. 133–156. [Google Scholar]
- Lins, V.; Reis, G.; Araujo, C.; Matencio, T. Electrochemical impedance spectroscopy and linear polarization applied to evaluation of porosity of phosphate conversion coatings on electrogalvanized steels. Appl. Surf. Sci. 2006, 253, 2875–2884. [Google Scholar] [CrossRef]
- Guo, W.; Dmowski, W.; Noh, J.Y.; Rack, P.; Liaw, P.K.; Egami, T. Local atomic structure of a high-entropy alloy: An-ray and neutron scattering study. Metall. Mater. Trans. A 2012, 44, 1994–1997. [Google Scholar] [CrossRef]
- Hurtado, M.; Sumodjo, P.; Benedetti, A.V. Electrochemical studies with a Cu-5 wt% Ni alloy in 0.5 M H2SO4. Electrochim. Acta 2003, 48, 2791–2798. [Google Scholar] [CrossRef]
- Metikos-Hukovic, M.; Babic, R.; Brinic, S. EIS-in situ characterization of anodic films on antimony and lead-antimony alloys. J. Power Sources 2006, 157, 563–570. [Google Scholar] [CrossRef]
- Trueman, A.R. Determining the probability of stable pit initiation on aluminium alloys using potentiostatic electrochemical measurements. Corros. Sci. 2005, 47, 2240–2256. [Google Scholar] [CrossRef]


Publisher’s Note: MDPI stays neutral with regard to jurisdictional claims in published maps and institutional affiliations. |
© 2021 by the authors. Licensee MDPI, Basel, Switzerland. This article is an open access article distributed under the terms and conditions of the Creative Commons Attribution (CC BY) license (https://creativecommons.org/licenses/by/4.0/).